
Visualization of the Movement Disorder Society Unified Parkinson’s Disease Rating Scale Results
Abstract
We sought to design a data visualization platform to represent the Movement Disorder Society- Unified Parkinson’s Disease Rating Scale (MDS-UPDRS) item scores in an easy-to-use display without modification of the raw data or summary scores. Score items for Parts I, II, and IV were arranged as separate inline blocks, while Part III item blocks were arranged in an anatomical fashion. A color scale was created to represent symptom severity and changes observed from one exam to another. We have found the visualization helpful for quickly defining the most troublesome symptoms and their anatomical location enabling communication of the results and interpretations.
INTRODUCTION
The Unified Parkinson’s Disease Rating Scale (UPDRS) is the most frequently used rating scale worldwide to record and communicate the severity of patient’s symptoms and exam findings and is often viewed as the “Gold Standard”. The Movement Disorder Society (MDS) revised the UPDRS rating scale (MDS-UPDRS) to be more comprehensive, consistent, and to provide a greater emphasis on distinguishing milder impairments and disabilities [1]. The MDS-UPDRS Task Force recommended that each Part (I–IV) be reported individually to maintain scores that are extensively validated and clinically important [1, 2]. Representation of each subset with a single number simplifies the reporting process and facilitates communication. Likewise, a change in the summed score of Part III in response to a therapy can be easily derived to indicate the motor impact of an intervention. Although these features support ease of calculation and communication, a single number lacks the ability to demonstrate the distribution, range, and anatomical location of the associated impairments/disabilities [3]. A deeper analysis requires searching through raw data scores recorded in a running tabular fashion in the order the items were assessed. Identifying specific clinical features in this type of format is time consuming, difficult to process, and can be cognitively challenging. This task becomes increasingly more difficult when considering the effect of a therapy such as medication or deep brain stimulation (DBS). We present a data visualization platform for the MDS-UPDRS that graphically illustrates the scored data. We reorganized the test items graphically and color coded the scores. More specifically, we arranged the Part III test items in an anatomical distribution based on the Vitruvian Man [4] and created a visualization format to display the change in individual scores related to therapeutic intervention. We emphasize that the display of data is completely unrelated to the administration of the rating scale, does not change any of the raw data, and does not interfere with the current derivation or interpretation of the scores. Used clinically, the data visualization allows for the rapid determination of the presence and severity of a given test item and greatly facilitates the evaluation of changes in scores in response to therapeutic interventions.
METHODS
Clinical data
Following approval for a retrospective chart review by the University of Kentucky Institutional Review Board as part of a larger registry that waived the requirement for informed consent, we obtained the results of a complete MDS-UPDRS exam for a single patient, a 64-year-old male with a 13-year history of Parkinson’s disease (PD). The exam was administered by an MDS-UPDRS trained and qualified clinician during an evaluation for possible DBS therapy. The baseline off-medication exam was performed in the practical off-medication state more than 12 hours from the last dose. The on-medication exam was performed during the period of peak efficacy after taking his regularly prescribed levodopa dose (300 mg). This patient had a total daily levodopa equivalent dose [5] (LED) of 1500 mg. Scores were collected in standard fashion with patient input and clinician support where appropriate.
Creation of the visualization platform
Our visualization platform was created through the following series of steps.
Step 1. Data Organization. MDS-UPDRS score-sheet items were entered into individual cells in a spreadsheet software (Excel 2019, Microsoft) in list form while maintaining the name and order of the assessed item, the assigned rating value for each item, and the segregation of the four subscales [1]. A macro was created to automate the task of moving the values from the list into a dashboard-style arrangement.
Step 2. Data Grouping. Visualizations were created individually for each of the four subscales of the MDS-UPDRS exam (Fig. 1A, B). The visualizations for Parts I, II, and IV consist of inline blocks stacked vertically in the order the items appear on the MDS-UPDRS score sheet (Fig. 1B). Items in Part III (3.1 to 3.18) were first organized in general by anatomic symptom location. More specifically, all upper extremity and lower extremity symptoms were grouped and then separated by right and left body sides. Axial symptoms not defined within an extremity were separated by symptoms related to the head region (facial expression, speech, lip tremor), the upper midline body region related to rigidity, tremor, or bradykinesia, or lower midline body region (posture and mobility).
Fig. 1
Arranging and color coding a data visualization of the MDS-UPDRS Part III score. A) The classification and organization of assessed MDS-UPDRS Part III items are shown. MDS-UPDRS items are first classified by body location and then rearranged into anatomical organizational groups. Numbers displayed in cells are item numbers from the MDS-UPDRS. B) Arrangement of Parts I, II, and IV with numbers displayed corresponding to items from the MDS-UPDRS are shown. C) This is the legend for UPDRS scoring results. The numeric score reported by the assessed patient or examiner were color coded for ease of interpretation. D) Shown is when the cursor hovers over the cell of interest, a comment box appears with a description of the test item the cell represents. In this case, item 3.18: constancy of rest tremor.
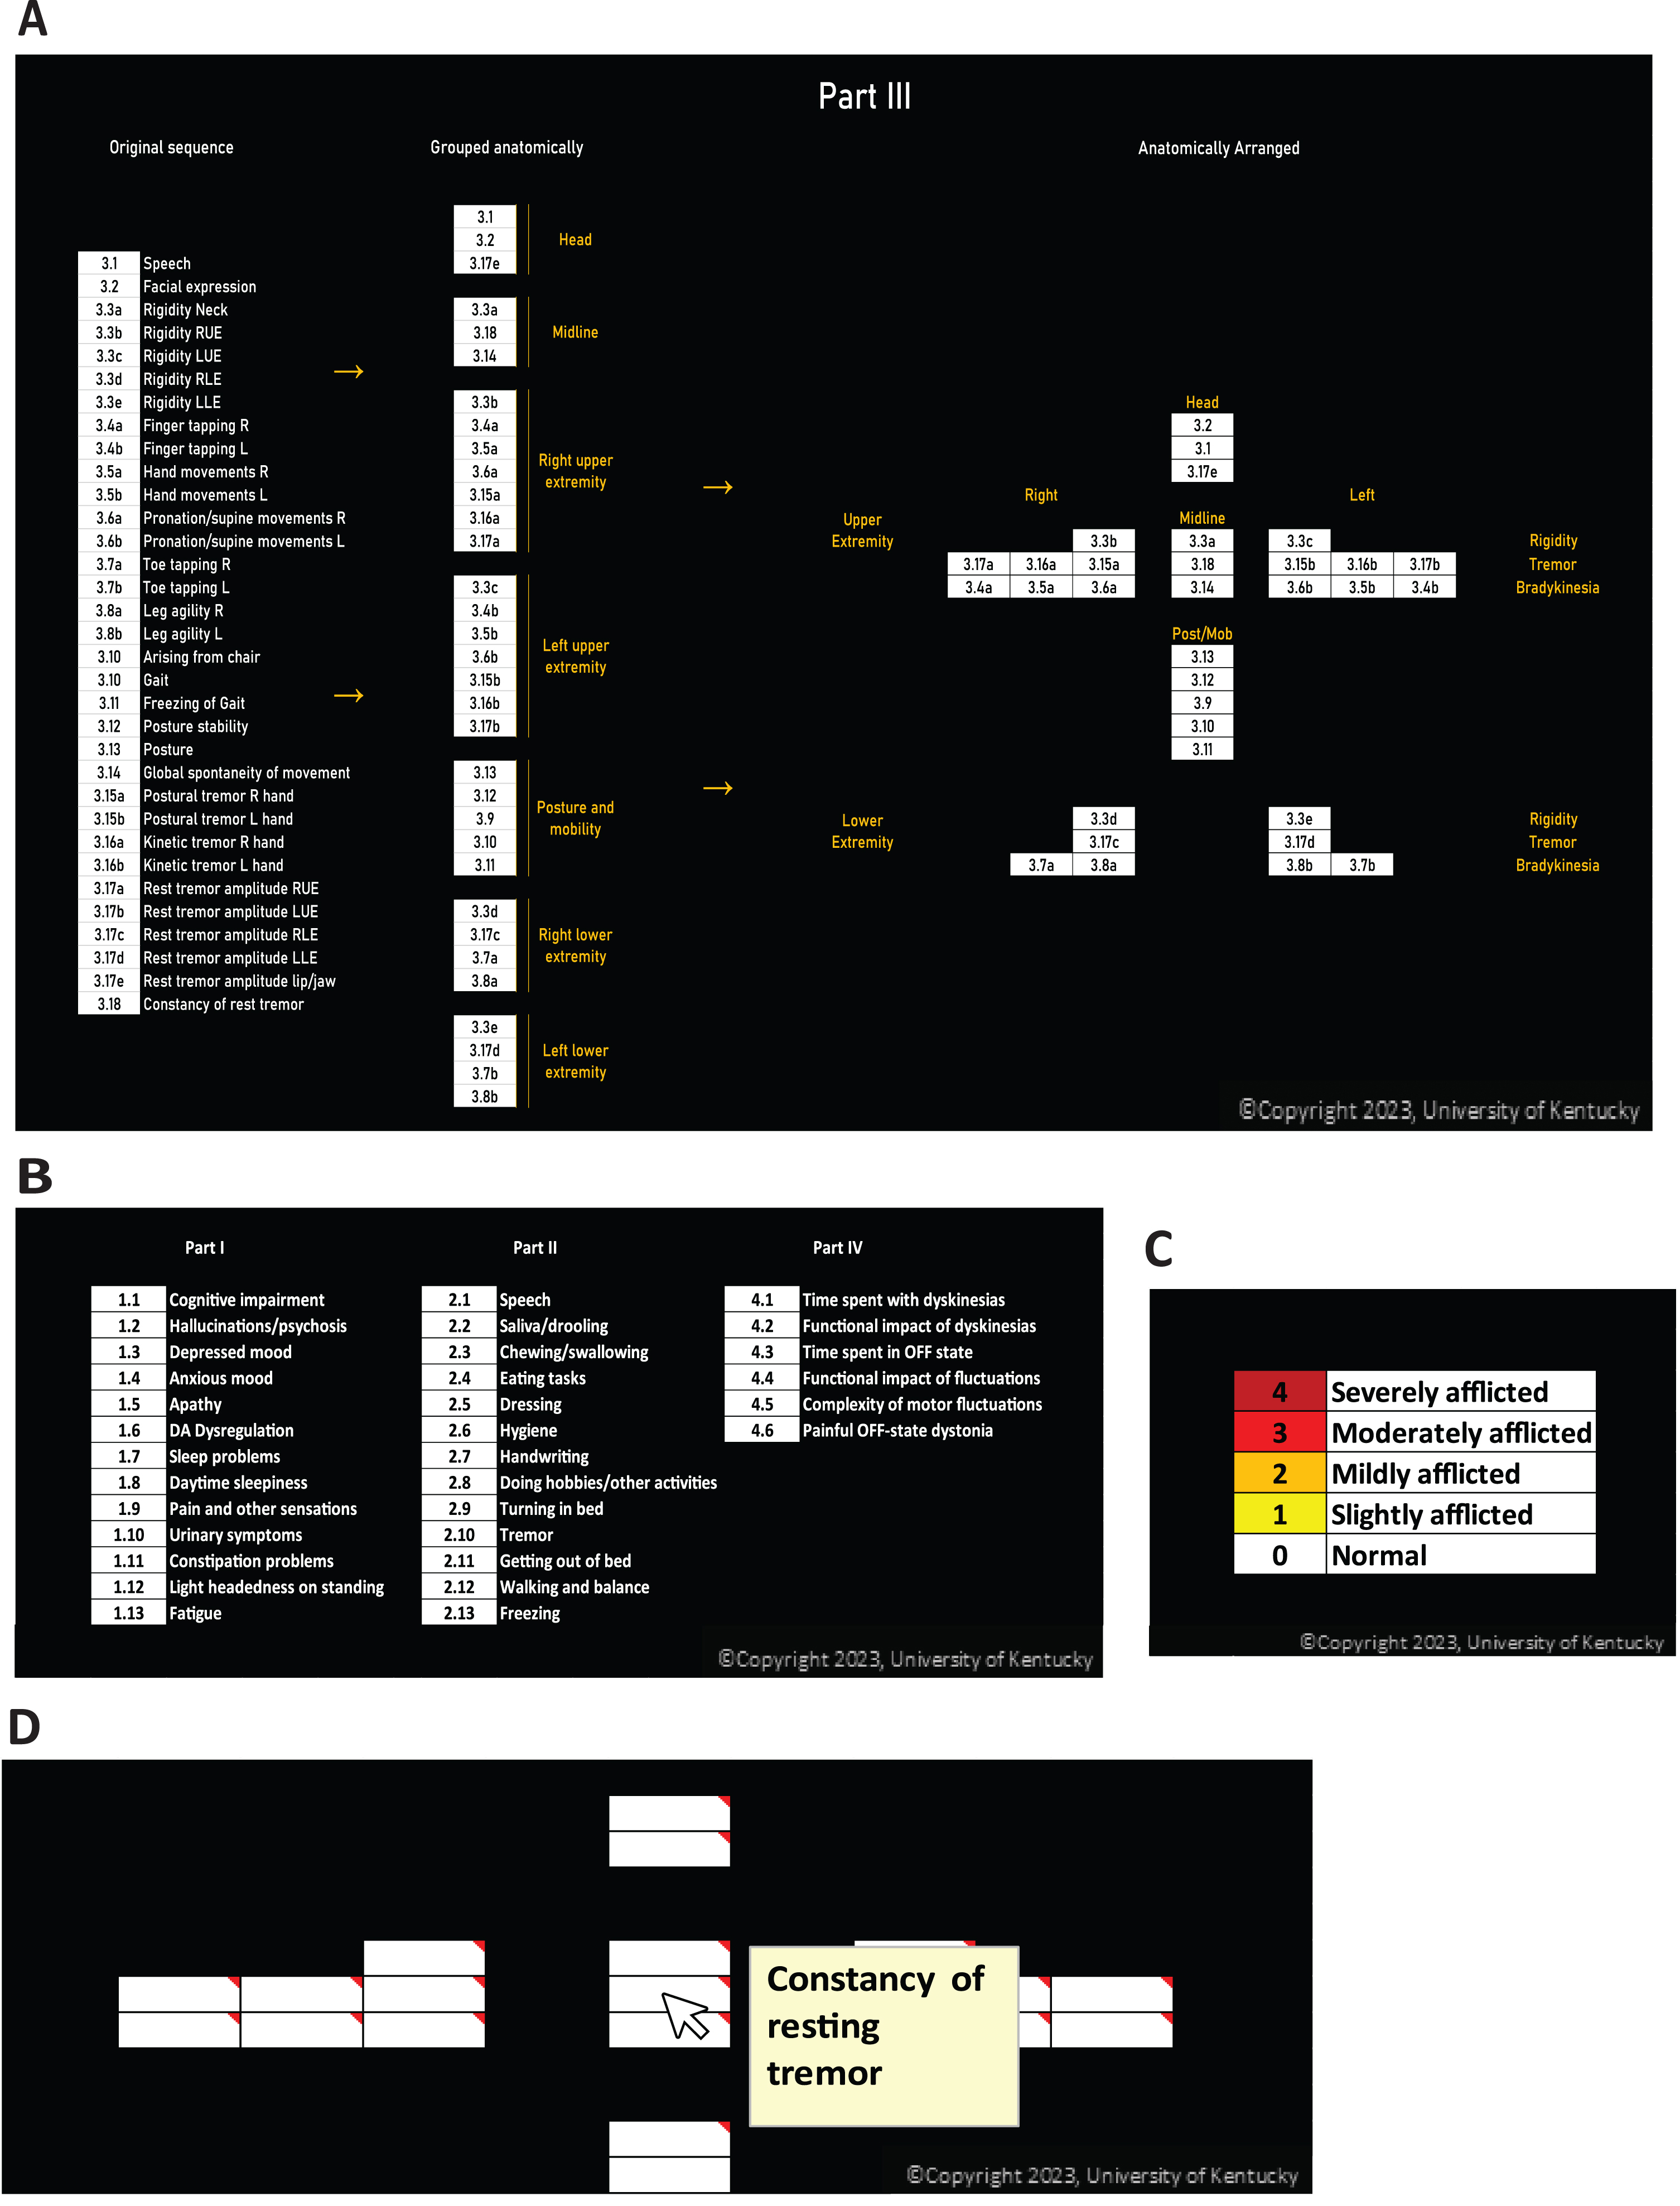
Step 3. Data Reorganization. The grouped list for Part III was re-organized into an anatomical, Vitruvian Man-style arrangement for visualization (Fig. 1A). Symptoms in the head were arranged in the head of the diagram; symptoms of the neck and global movements were designated to the midline of the diagram; items assessing posture and mobility were oriented in the midline caudal grouping. The items for each extremity were assembled by symptom type, such that rigidity, tremor, and bradykinesia assessments were grouped in the same location and order for each limb. For the visualization platform, separate Part III anatomic figures were placed side-by-side to represent the scores for the Off medication and On medication conditions (Fig. 2A). In summary, the individual figures for each part were laid out in order from left to right so the diagram illustrates Part I, Part II, Part III baseline, Part III post-intervention, and Part IV. The sum of the scores for each subscale appears under the corresponding figure.
Fig. 2
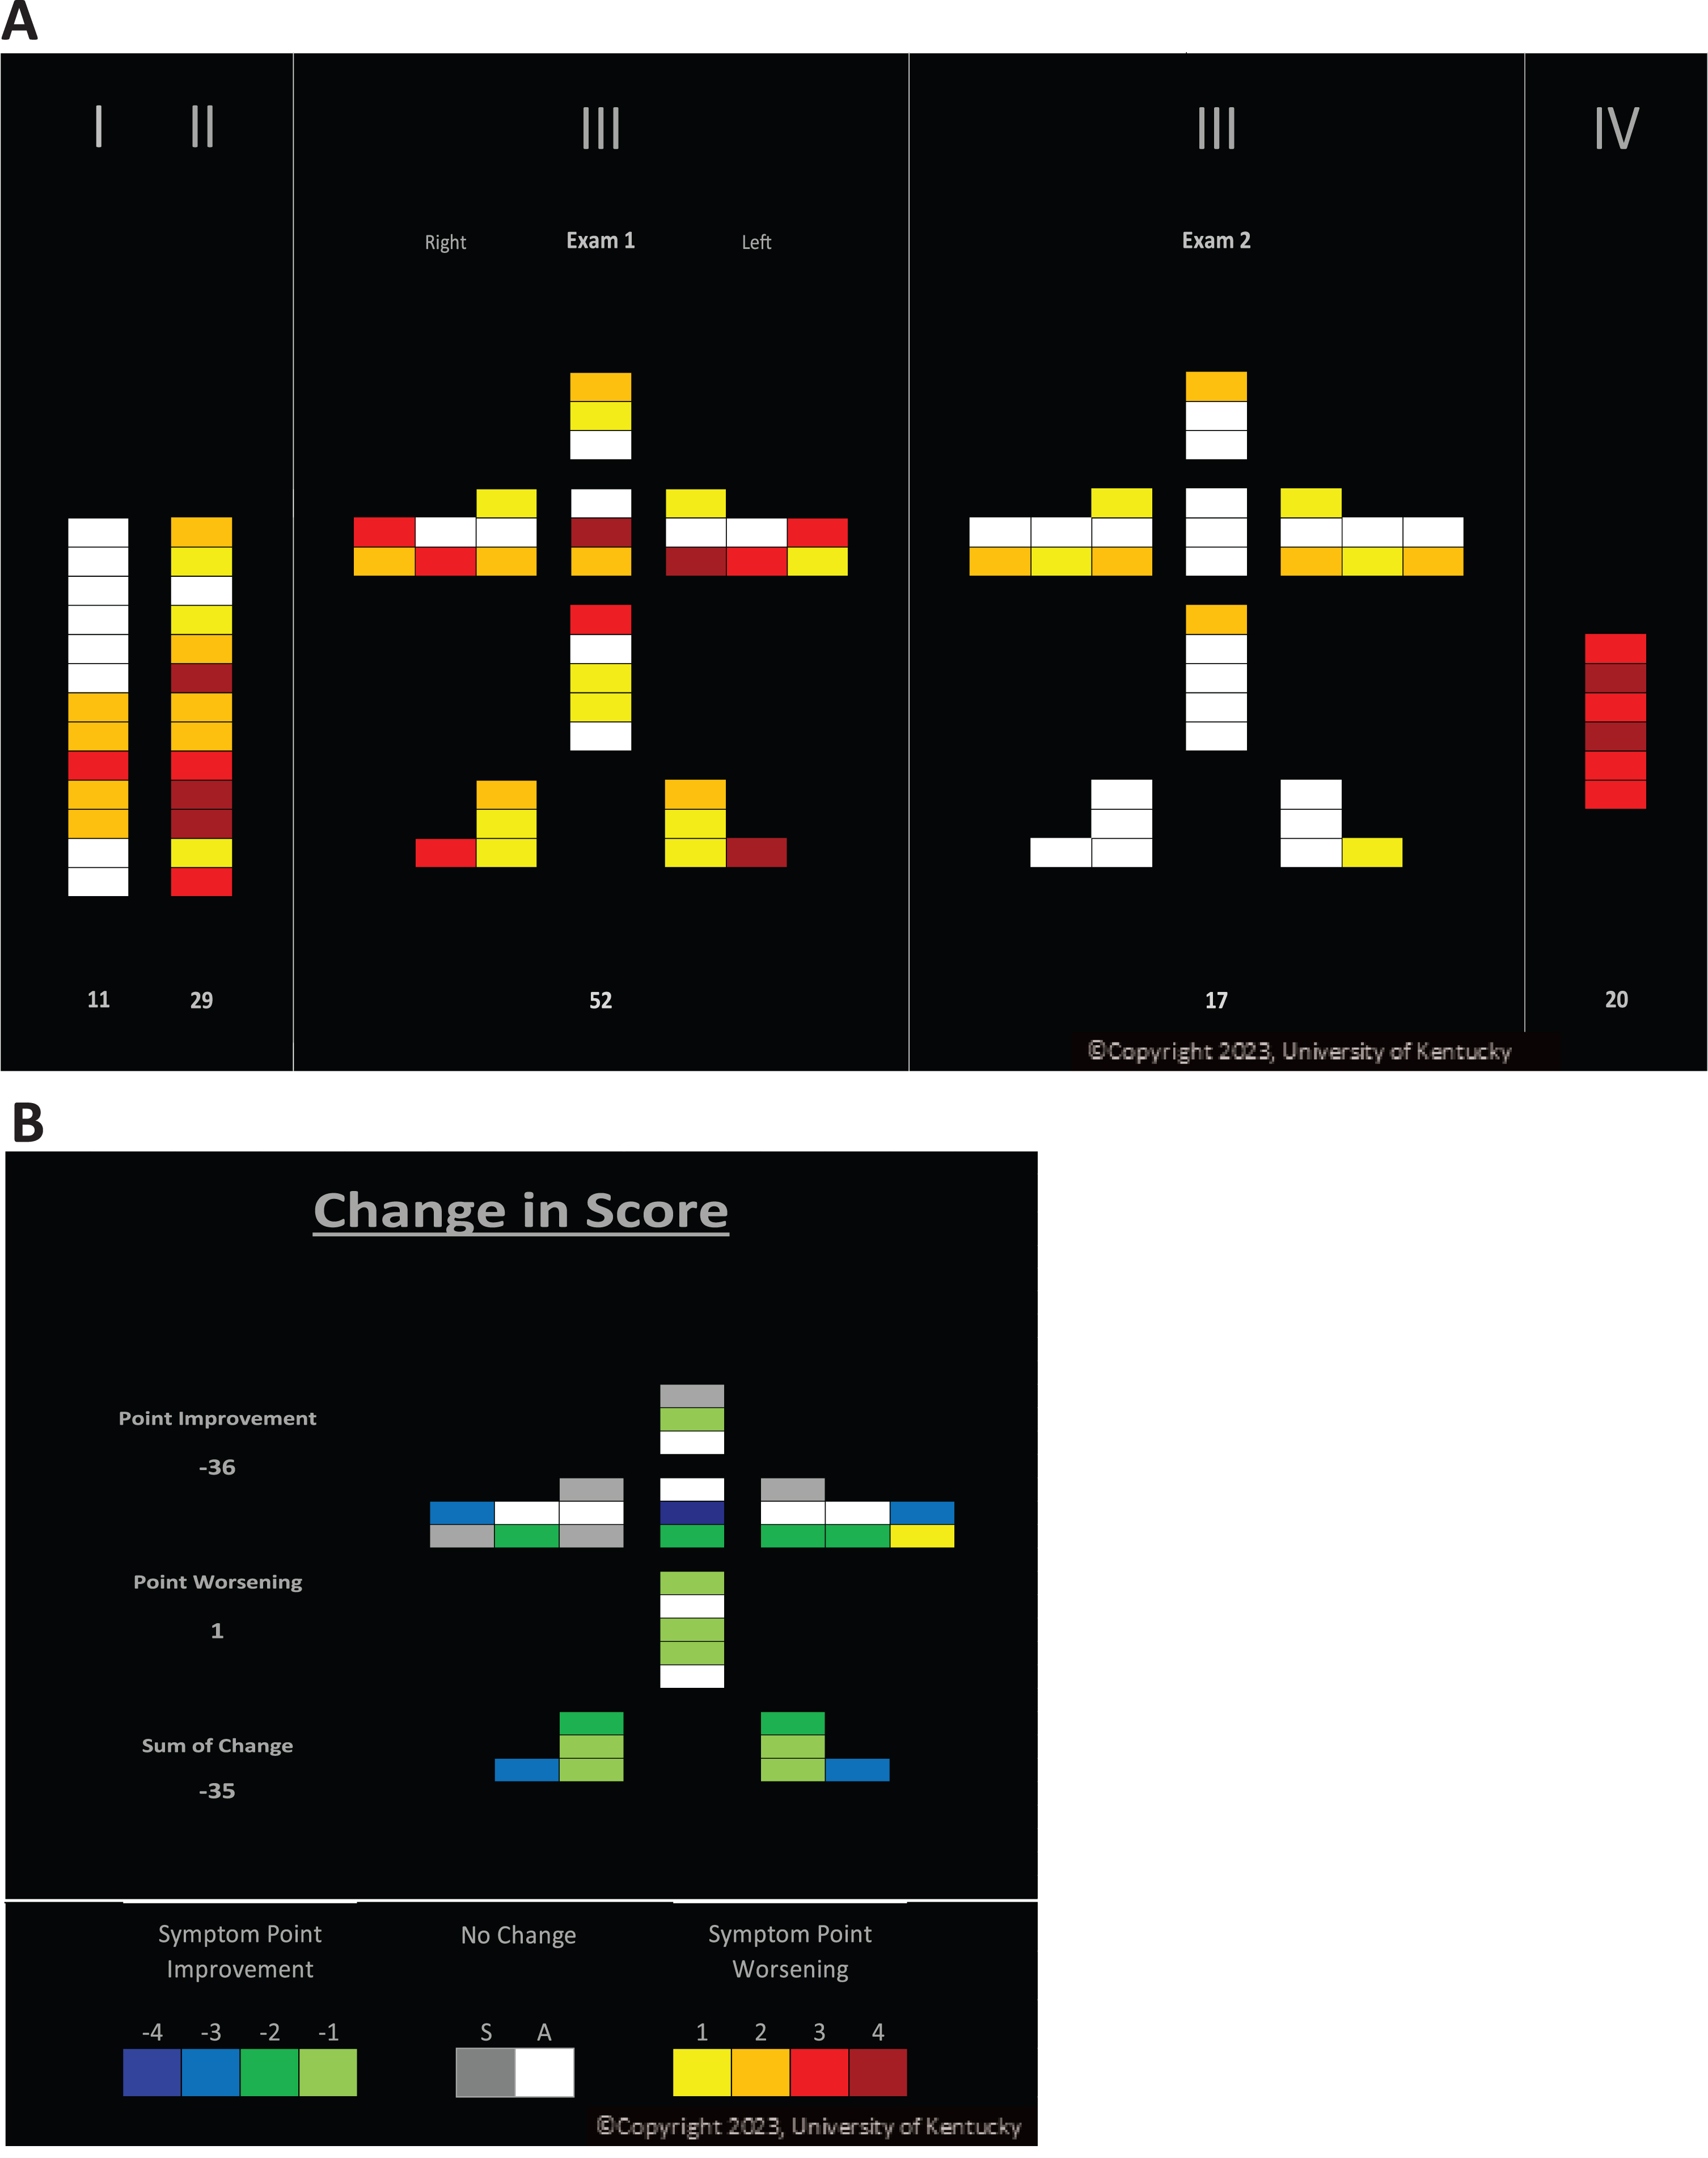
A data visualization of the MDS-UPDRS disease severity and impact of medication. A) Patient UPDRS results: Exam 1 (Off) vs. Exam 2 (On) are shown. B) Change in patient score calculated by subtracting Exam 2 scores from Exam 1 scores are shown. Changes in points defined by color code are shown. Cool colors (greens and blues) indicate items with a point improvement. Items that had no change from Exam 1 to Exam 2 are depicted in a gray scale. “A” is for consistently asymptomatic and “S” for symptomatic but unchanged from Exam 1 to Exam 2. Point worsening in a symptom is depicted by yellows and reds.
Step 4. Color Coding. A five-level color code corresponding to the MDS-UPDRS ratings’ values [1] (0 through 4) was incorporated into the individual spreadsheet cells with the autoformat function in Excel to represent the severity of symptoms based on color (Fig. 1C). For easy reference, test item descriptions were displayed when hovering the cursor over an item of interest (Fig. 1D).
Step 6. Visualizing changes in scores. To visualize the change of scores related to the administration of medication in Part III exam scores, a separate Part III change diagram was added (Fig. 2B). The human form layout was preserved, and the values were calculated by subtracting the Exam 2 item scores (On-medication) from the Exam 1 item scores (Off-medication).
Observed changes can be an increase in severity, a positive number; a decrease in severity, a negative number; or no change, zero. For positive numbers, the same warm color scheme was maintained. For negative colors, a green and blue color scheme was utilized. For zero values, we designated white for unchanged scores that were zero at baseline and gray for scores that were symptomatic at baseline but were unaffected by intervention. This allows the viewer to quickly identify items that did not change with intervention from those that could not have improved as they were already normal prior to the intervention.
Data sharing
The participant data used in the visualization presented here is not available.
RESULTS
MDS-UPDRS data were entered into the data visualization spreadsheet (Fig. 2A), and we determined that the non-motor experiences of daily living, Part I, were relatively mild compared to the motor experiences of daily living, Part II, which showed three maroon and two red items and only one asymptomatic item. Visually comparing the Part III displays allows one to quickly conclude that the overall baseline symptoms included moderate and severe items and that overall, the symptoms included rigidity, tremor, and bradykinesia and were relatively symmetrically distributed in the upper and lower extremities with lesser effects on the axial symptoms. Medication administration was quite effective with no residual moderate or severe findings (Fig. 2B), complete resolution of tremor and near full improvement in the lower extremities. A quick glance at the Part IV figure easily revealed significant motor complications with all items either red or maroon. Evaluating the Part III Change in Score figure showed the degree and location of changes resulting from medication. More specifically, there was a large effect on resting tremor with respect to severity and constancy (blue) and the lower extremities were more consistently improved compared to the upper extremities. The grey items, mostly in the upper extremities, demonstrated symptomatic items that were not changed by medication. The figure also revealed that one item (Left finger tapping, yellow) actually scored worse following medication.
DISCUSSION
We have developed an MDS-UPDRS data visualization platform to facilitate the interpretation of clinical information derived from this standard of care rating scale. Important features of the visualization platform include preservation of the raw data sub-component scoring, reorganization of scale items to reflect symptom type with anatomic location, and color coding of item scores to reflect symptom severity or degree of change in symptoms related to therapeutic intervention. Use of this platform in no way interferes with the collection of the data or the interpretation of the data by standard methodologies.
We demonstrated the basic utility of the platform by presenting data obtained from a typical patient with PD who had undergone MDS-UPDRS evaluation. While we show one patient’s visualization, we have been routinely using the visualization in our clinic for almost three years across more than 200 patients. Visual examination of the figures allowed a more in depth and relevant evaluation of the data with respect to symptom type, anatomic location, and response to medication. Holistically, this additional information, available in a visualized manner, could be informative and useful in assessing and communicating complex responses to therapy or disease progression that are not available in single-value assessments, e.g., the Hoehn and Yahr scale or Schwab and England Activities of Daily Living scale. The comment display box with a description for each item when hovering over the cell of interest eliminated the need to refer back to the key or the score sheet.
The main limitation of this report was that we present only one example of a patient demonstrating moderate symptoms without atypical features and good response to medication. Furthermore, we recognize that using a spreadsheet approach necessitates the manual entry of data from the original score sheet and the manual transfer of the visualization into a patient’s electronic medical record which does add time and effort; however, these limitations may also create an opportunity for future optimization. Meanwhile, we appreciate that employing a visual color code may prevent the use of the visualization tool by individuals with color vision deficiencies but find the color code effective in conveying critical information. Having incorporated this visualization tool into our standard practice for all MDS-UPDRS evaluations, we have found the data displays to be quite valuable in framing discussions centered on options for clinical treatment plans both with clinicians and patients/caregivers. More specifically, the displays have been useful when determining the need for changes in medical management and/or when evaluating the timing, staging, and lead location (subthalamic nucleus vs. globus pallidus internus) for DBS electrode placements.
Conclusion
We provide evidence that a data visualization platform for scores obtained from the MDS-UPDRS can be used as a clinical tool to assist with the interpretation of the data and potentially facilitate communication of the results with the clinical care team, the patient, and caregivers. We find this tool is easy to use, has practical applicability, and maintains the integrity of the original data. The figures generated by the spreadsheet were incorporated into the patient’s electronic medical record. We are currently developing a prospective version of the platform where data could be entered directly to the spreadsheet during the data collection portion of the exam.
ACKNOWLEDGMENTS
Supported in part by the Ann Hanley Neuroscience Fund. We thank Dr. Fred Schmitt for critical comments on the development of the visualization.
CONFLICT OF INTEREST
CvH, JH, and JEQ have a financial interest in the development of the visualization tool. Other authors declare no competing interests.
REFERENCES
[1] | Goetz CG , Tilley BC , Shaftman SR , Stebbins GT , Fahn S , Martinez-Martin P , Poewe W , Sampaio C , Stern MB , Dodel R , Dubois B , Holloway R , Jankovic J , Kulisevsky J , Lang AE , Lees A , Leurgans S , LeWitt PA , Nyenhuis D , Olanow CW , Rascol O , Schrag A , Teresi JA , van Hilten JJ , LaPelle N ((2008) ) Movement Disorder Society-sponsored revision of the Unified Parkinson’s Disease Rating Scale (MDS-UPDRS): Scale presentation and clinimetric testing results. Mov Disord 23: , 2129–2170. |
[2] | Ramaker C , Marinus J , Stiggelbout AM , Van Hilten BJ ((2002) ) Systematic evaluation of rating scales for impairment and disability in Parkinson’s disease. Mov Disord 17: , 867–876. |
[3] | Tosin MHS , Goetz CG , Luo S , Choi D , Stebbins GT ((2020) ) Item response theory analysis of the MDS-UPDRS motor examination: Tremor vs. nontremor items. Mov Disord 35: , 1587–1595. |
[4] | Creed JC ((1986) ) Leonardo da Vinci, Vitruvian Man. JAMA 256: , 1541–1541. |
[5] | Tomlinson CL , Stowe R , Patel S , Rick C , Gray R , Clarke CE ((2010) ) Systematic review of levodopa dose equivalency reporting in Parkinson’s disease. Mov Disord 25: , 2649–2653. |


