
miR-101a-3p Impairs Synaptic Plasticity and Contributes to Synucleinopathy
Abstract
Background:
Synucleinopathies are disorders characterized by the abnormal accumulation of α-synuclein (aSyn). Synaptic compromise is observed in synucleinopathies parallel to aSyn aggregation and is accompanied by transcript deregulation.
Objective:
We sought to identify microRNAs associated with synaptic processes that may contribute to synaptic dysfunction and degeneration in synucleinopathies.
Methods:
We performed small RNA-sequencing of midbrain from 6-month-old transgenic mice expressing A30P mutant aSyn, followed by comparative expression analysis. We then used real-time quantitative polymerase chain reaction (qPCR) for validation. Functional analysis was performed in primary neurons by biochemical assays and imaging.
Results:
We found several deregulated biological processes linked to the synapse. miR-101a-3p was validated as a synaptic miRNA upregulated in aSyn Tg mice and in the cortex of dementia with Lewy bodies patients. Mice and primary cultured neurons overexpressing miR-101a-3p showed downregulation of postsynaptic proteins GABA Ab2 and SAPAP3 and altered dendritic morphology resembling synaptic plasticity impairments and/or synaptic damage. Interestingly, primary cultured neuron exposure to recombinant wild-type aSyn species efficiently increased miR-101a-3p levels. Finally, a dynamic role of miR-101a-3p in synapse plasticity was shown by identifying downregulation of miR-101a-3p in a condition of enhanced synaptic plasticity modelled in Wt animals housed in enriched environment.
Conclusion:
To conclude, we correlated pathologic aSyn with high levels of miR-101a-3p and a novel dynamic role of the miRNA in synaptic plasticity.
INTRODUCTION
Alpha-synuclein (aSyn) is a small protein abundant in neuronal cells involved in synaptic physiology [1, 2]. In synucleinopathies, such as Parkinson’s disease (PD) and dementia with Lewy bodies (DLB), aSyn accumulates in proteinaceous deposits known as Lewy bodies (LBs) and Lewy neurites [3–5]. The pathological hallmark of PD is the progressive loss of dopaminergic neurons in the substantia nigra leading to motor impairments while in DLB pathology prevails in the neocortex and cognitive decline precedes the motor phenotype [6, 7].
The fact that large protein deposits in synucleinopathies contain aSyn has suggested a central role for this protein in the pathological process [8], and this has been the dominating hypothesis thus far. aSyn accumulation is evident in synapses prior LB formation, suggesting pathology starts at synapses and spreads to cell body [9–11]. Interestingly, it was recently confirmed that synaptic impairments take place alongside LB formation [12]. Upon exposure to fibrils, synaptic activity is compromised as dendritic spines are withdrawn and synapses are lost [13]. Additional studies in mouse models of synucleinopathies strengthen the hypothesis that synapses may be affected early on in the process of neurodegeneration [11, 14].
Despite intensive research, we still lack a complete understanding of the molecular underpinnings of pathology and onset of clinical features in synucleinopathies. While genetics has been instrumental to inform on possible deregulated cellular pathways, it is important to keep in mind that the majority of synucleinopathy cases appear to be multifactorial, resulting from a unique interplay between genetics, environmental factors, and aging processes. In this context, epigenetics emerges as a promising field that can help explain the complex etiology of this group of disorders [15, 16].
Among the epigenetic mechanisms, RNA-based processes are the only ones operating locally at synapses. RNAs are transported to synapses where they regulate protein synthesis, thereby actively participating in synaptic remodeling [17, 18]. This is also true for microRNAs (miRNAs) that mediate post-transcriptional regulation of mRNA expression by complementary binding to the 3’-untranslated regions (3’UTR) [19, 20]. Thus, miRNAs are now being widely studied in the context of synucleinopathies [21–23].
Considering the relevance of epigenetic alterations in synucleinopathies, and the particular relevance of miRNA-mediated processes in the synaptic compartment, we sought to identify miRNA-mediated alterations in early stages of neurodegeneration and their relevance to synaptic impairments. Using small RNA sequencing we found significant miRNA deregulation in a mouse model of familial PD at an early stage, prior to neuronal loss and to the phenotype onset. Importantly, we demonstrated that miR-101a-3p, is increased in the cortex of DLB patients, and that this increase correlates with impairments in synaptic plasticity both in vivo and in vitro. This was further validated in Wt animals housed in an enriched environment to model enhanced plasticity, where we found reduced levels of miR-101a-3p. Strikingly, exposure of primary neurons to in vitro-produced aSyn species resulted in an increase in miR-101a-3p, indicating a direct effect of aSyn on the miRNA levels. In conclusion, the identification of miRNAs associated with synaptic deficits prior to symptom onset holds great potential not only as putative biomarkers but also as targets for therapeutic intervention in synucleinopathies.
MATERIALS AND METHODS
Human samples
RNA extracted from human cortex was provided by the Newcastle Brain Tissue Resource, Institute of Neuroscience, Newcastle University, Campus for Ageing and Vitality, Newcastle upon Tyne, UK. Detailed sample information is presented in Supplementary Table 1.
Ethical approval
Newcastle Brain Tissue Resource Ethics Committee granted ethical approval for the DLB and control cases.
Animals
Male homozygous [A30P] aSyn Tg mice [24] and littermate controls were used at 6 months of age. Animals were housed in standard cages with 12 h light/12 h dark cycle and free access to food and water in the animal facilities of the University Medical Center, Göttingen, Germany. All animal experiments were approved by the Lower Saxony State office for Consumer Protection and Food Safety (license number: 33.9.42502-04-19/3213). In addition, midbrain samples of WT mice housed in either a standard or enriched environment for 12 months were included. For details on enriched housing conditions, see Wassouf et al. [25]. All procedures strictly adhered to the international standards for the care and use of laboratory animals and were approved by the local Animal Welfare and Ethics committee of the Country Commission Tübingen, Germany (license number: TVA HG 4/11).
Primary cortical neuronal cultures and immortalized cell lines
Mouse cortical neuronal mass cultures were prepared as previously described [12] and grown on coated plates including glass coverslips for imaging or custom-made microfluidic devices (MFDs). Details for immunocytochemistry and the MFDs are provided in the respective sections. For assessing the miRNA effect, cells were infected on day in vitro (DIV) 1 and harvested on DIV 14. For recombinant wt aSyn (raSyn) experiments, cells were exposed to 100 nM monomeric or oligomeric raSyn, or pre-formed fibrils (PFFs) on DIV 5 and harvested on DIV 25. Recombinant wt aSyn species were produced as in Vasili et al. [26]. Human embryonic kidney 293 cells were grown at standard conditions and transfected with plasmid DNA (1μg/ml culture medium) and microRNA mimic (4 nM final concentration) in a 1:3 ratio with FuGENE® HD Transfection Reagent. Following transfection, cells were incubated for 24 h.
Plasmids
For the luciferase assay, fragments of the GABRB2 and DLGAP3 3’-untrsanslated region (UTR) sequences (GABRBR2 3’UTR fragment: 5’ -ATTTCCTTCATATGACTTTTTTTTTTTTAAATTTGCCAGCCAACAGTCACCATTCTGAAATAAATAATACAGGGTACTGAACATCTCTCTCAGCAAATCAATGCCTACAGTTCCTAAGAACATTGCACAGTTTGACTCTACAATAGTACTGTACCTCAGAATATGAGATGTTAACTAGTGTCTGCATTGCTTGTCAAATATCCATTTGTTCTTTTAAAGGACACAGATAACACTATCCATTGGTGATTTAAAATTGAAAAAAAAATTAGGAAAATGGGGAAAAATCCTCTTGAGAGGAGG- 3’; DLGAP3 3’UTR fragment: 5’ -CCCGCCCGGGCCGCCCAGTCCGACCCGGGCCCGCGGTTTTCTACCCGTACTGTACACCCAGCGTCGAGGTCACTGTGAACGCGGGCAGCTCCGTGCGCCCGCCCTGCCGGCACCGCACGCCCCGGCTTCTGCCCGCCGCGCTTTCGTGGGTTTTTTACCTTCCTGATCCCACGCAAAGGCGCCCGGGCTAGGCTGGGGGTCGTGCCTCTCCGCCCTGCGCCCCTCACTTGGAACTCCCATCTTCCTGGTCCGACGCTTTGACCCCCTCACCTTTTTCCCCCCATGGGCACCATCTCTGCC- 3’) (custom made, BioCat, Germany) were subcloned in a mammalian expression vector that encodes Gaussia luciferase with a KDEL sequence under the cytomegalovirus promoter. The vector expressing luciferase alone was used as a control vector. For assessing the miRNA effects, miR-101a-3p (5’ -CAAAAATACGTACTGATAACGAACTGCAGTTCAGTTATCACAGTACTGTA- 3’) or a scrambled miRNA sequence (5’ – CAAAAAATAGTATGCAATTCGAAGATCCTGCAGGATCTTCGAATTGCATACTA- 3’) (custom made, Metabion, Germany) was introduced in the pLKO.3G vector (Plasmid #14748, Addgene, MA, USA). The vector expressing GFP alone was used as a control vector. Lentivirus production was performed according to Follenzi and Naldini [27].
Luciferase and β-galactosidase activity assay
HEK cells expressing target genes 3’UTRs, Gaussia luciferase and miRNA mimic (miScript miRNA mimics, Qiagen, Germany) were harvested with Glycylglycin lysis buffer, centrifuged for 15 min at 15,000× g at 4°C and the supernatant was collected.
For the luciferase assay, cell lysate was added in a 96-well plate and luciferase activity was estimated by measuring luminescence on the plate reader Infinite M200 PRO after injecting the Luciferase Assay Reagent (Promega, WIS, USA) with the Te-Injecttrademark reagent injector.
For the β-galactosidase assay, cell lysate and β-galactosidase reagent (1 mg/ml o-nitrophenyl-β-D-galactopyranoside, 25 mM Sodium Phosphate pH 7.1, 2μM MgSO4) was incubated at ambient temperature until color development was evident. Reaction was stopped with 0.5 M sodium carbonate, and absorbance at 420 nm was measured on the plate reader Infinite M200 PRO.
RNA extraction
RNA isolation was performed with TRIzol reagent (Invitrogen, CA, USA) according to the manufacturer’s instructions. For liquid samples equal volume of sample and TRIzol were mixed. For cell culture, media was aspirated and TRIzol was added directly to the culture plate for cell lysis. For tissue, TRIzol and ceramic beads (1.4 mm diameter ceramic beads, 91-PCS-CK14B, PEQLAB Biotechnologie, Germany) were added in vials with frozen tissue and homogenization was performed with the Precellys 24 tissue homogenizer (Bertin Instruments) at 65,000× g for 2×30-s runs with a 30-s break in between. Following RNA extraction and precipitation, RNA was dissolved in RNAse-free water and concentration and quality was estimated with NanoDrop 1000 spectrophotometer (Thermo Fisher Scientific, MA, USA) by measuring absorption at 260 nm and the ratios 260/280 nm and 230/280 respectively.
Small RNA sequencing and data analysis
Small RNA sequencing was performed using RNA from whole midbrain of 8 Wt mice and 7 Tg mice on an Illumina HiSeq 2000 system. Small RNA libraries were prepared from 1μg total RNA using the Illumina TruSeq Small RNA Sample Preparation kit. Analysis of sequencing data was performed using custom pipelines. For quality check and demultiplexing, the CASAVA 1.8.2 software (Illumina) was used. For alignment the mapper.pl from miRDeep2 was used. Reads were aligned to MiRBase version 19 with a cut off score of p < 5×10⁻⁷ and a single mismatch allowed. In order to compare the miRNA expression levels between samples, a differential expression analysis was performed using R and the DESeq2 package and the following thresholds were used: log2FC < >0.25, basemean ≥5, padjusted ≤0.05. Heatmaps were created using the ggplot2 package. Computational miRNA target prediction analysis was performed using Target Scan Mouse 6.2. For functional annotation of predicted miRNA targets the Panther database (version 15.0) was used.
For the RNA-seq data integration we used in-house scripts to detect the miRNAs and target genes interaction using information from 2 different databases: miRTar [28] and miRbase [29]. We selected the miRNA-gene interactions that were true in both databases and then correlated those to the RNA seq data.
Reverse transcription and real-time qPCR
RNA sequencing results were validated using qPCR with primers specific for miR-101a-3p and target genes (Supplementary Table 2). QuantiTect RT Kit and miScript RT II Kit (Qiagen, Germany) were used for reverse transcription according to the kit manuals. Reactions were performed on Eppendorf MasterCycler.
Quantification of relative mRNA and miRNA levels was performed with QuantStudio3 Real-Time PCR system (Applied Biosystems, CA, USA). For the miRNA qPCR, miScript SYBR Green PCR Kit (Qiagen, Germany) was used with miScript primer assay (Supplementary Table 2) and the expression was normalized to endogenous control RNU6. For the mRNA qPCR, Mesa blue qPCR Mastermix plus for SYBR assay (Eurogentec, Belgium) was used with custom primers (Supplementary Table 2) and mRNA expression was normalized to ACTB. Relative expression levels (fold change, FC) were calculated using the Livak method [30].
Protein extraction, electrophoresis, and immunoblotting
Proteins were extracted in ice cold RIPA buffer (50 mM Tris pH 8.0, 150 mM NaCl, 0.1% sodium-dodecyl-sulphate, 1% Nonidet NP40, 0.5% sodium-deoxycholate, and protease inhibitor (completetrademark Protease Inhibitor Cocktail, Roche, Switzerland)). Cell culture protein extracts were prepared by incubating on ice for 20 min to allow complete protein extraction from cell membranes following centrifugation at 13,000× g for 15 min at 4°C to pellet debris. For tissue protein extracts, 100μl RIPA buffer was used per 10 mg tissue and homogenization was in vials with ceramic beads on the Precellys 24 tissue homogenizer at 65,000× g for 2×30 s runs with a 30 s break in between. Following homogenization, the sample was allowed to rest for 20 min on ice to allow protein extraction followed by ultracentrifugation to remove debris at 100,000× g for 1 h at 4°C in a Sorvalltrademark MTX 150 Micro-Ultracentrifuge (Thermo Fisher Scientific, MA, USA). Protein concentration was estimated by the Bradford assay (Bradford 1976), a standard curve was prepared with standard concentrations of bovine serum albumin (BSA) and triplicates of all samples and standards were measured at 595 nm using the plate reader Infinite M200 PRO (Tecan Ltd., Maennedorf, Switzerland).
Protein extracts were mixed with Laemmli buffer (250 mM Tris pH 6.8 (Carl Roth, Germany), 10% SDS, 1.25% Bromophenol Blue (Sigma-Aldrich, MO, USA), 5% β-mercaptoethanol (Fluka Analytical, Germany), 50% Glycerol (Sigma-Aldrich, MO, USA)) and incubated at 95°C for 5 min. Electrophoresis was performed on 12 or 15% SDS-PAGE gels and proteins were transferred onto nitrocellulose membrane (Thermo Fisher Scientific, MA, USA) using the iBlot 2 Gel Transfer device (Thermo Fisher Scientific, MA, USA) by applying 20 V constantly for 10 min.
Immunoblotting was performed with of one of the primary antibodies: Syn1, mouse, BD; anti-β-actin, mouse, Sigma; anti-GABA Aβ2, rabbit, Abcam; anti-GAPDH, rabbit, Cell Signaling; anti-PSD-95, rabbit, Cell Signalling, anti-SAPAP3, rabbit, Abcam; anti-SNAP-25, rabbit, Synaptic System; anti-Synaptophysin, mouse, Sigma. Protein bands were visualized with a chemiluminescence imaging system (Fusion FX, Vilber Lourmat, Marne-la-Vallée, France). Semi-quantitative analysis of protein levels was performed with densitometric quantification using the Fiji software [31].
Golgi cox staining
Freshly dissected brain tissue was washed once with H2O, cut in sagittal halves and each half was incubated in a glass vial with Golgi Cox solution (5% w/v K2Cr2O7, Merck, Germany; 5% w/v HgCl2, Carl Roth, Germany; 5% K2CrO4, Carl Roth, Germany) overnight at room temperature in the dark. The next day tissue was transferred in fresh Golgi Cox solution in a new vial and incubated for 10 days at room temperature in the dark. After that, tissue was transferred in a new vial and incubated with tissue protection solution (0.87 M sucrose; 1% w/v polyvinylpyrrolidone, Sigma-Aldrich, MO, USA; 30% v/v ethylene glycol, Sigma-Aldrich, MO, USA; 0.05 M phosphate buffer pH 7.2, Geyer, Germany) at 4°C overnight in the dark. The next day, tissue was transferred to fresh tissue protection solution in a new vial and incubated at 4°C for 5 days. Tissue sectioning was performed with a Leica VT1000 S Vibrating blade microtome vibratome, Leica, Germany. Tissue was embedded in 4% agarose (PEQLAB Biotechnologie, Germany) blocks and sectioned in sagittal, 100μm thick sections, on vibration frequency 60 Hz, at a speed of 15 mm/s and placed onto gelatin coated glass slides. Sections were left to dry overnight before developing the staining. Slides were first washed in distilled water twice for 5 min, then 50% EtOH for 5 min and developed by 8 min in 3:1 ammonia solution, washed with distilled water twice for 5 min and 5% sodium thiosulfate for 10 min in the dark following by a quick 1 min wash with distilled water. Slides were then dehydrated in sequential 6 min incubations with 70, 95, 100% EtOH and xylol. Lastly, when the slides dried, a few drops of quick-hardening mounting medium Eukitt (Fluka Analytical, Germany) were added to apply the cover glass. Slides were left for 48 h in the dark to dry and brightfield images were acquired with confocal microscope.
Synaptosome isolation
Freshly dissected tissue was homogenized in 3 ml homogenization solution (0.32 M sucrose; 1 mM 4-(2-hydroxyethyl)-1-piperazineethanesulfonic acid, HEPES, Carl Roth, Germany, pH 7.4; 1 mM MgCl2, Fluka Analytical, Germany; 0.5 mM CaCl2, Sigma-Aldrich, MO, USA) in a 5 ml glass-Teflon homogenizer with 12 strokes at 900 rpm on a motorized stirrer (Heidolph Instruments, Germany). Homogenate was transferred to a falcon tube and centrifuged at 1.400× g for 10 min at 4°C. Supernatant was saved and pellet was resuspended with 3 ml homogenization solution and re-homogenized (5 strokes, 900 rpm) to ensure maximum synaptosome extraction. The new homogenate was centrifuged at 710× g for 10 min at 4°C, supernatants were pooled and centrifuged at 13,800× g for 10 min at 4°C. Produced pellet was collected, resuspended in 2 ml resuspension solution (0.32 M sucrose; 1 mM HEPES pH 7.4) with the use of the homogenizer (5 strokes, 900 rpm) and loaded on a sucrose gradient. Sucrose gradient was prepared in Ultra-Clear centrifuge tubes (Beckman Coulter, CA, USA) with 4 ml 1.2 M sucrose, 3 ml 1.0 M sucrose and 3 ml 0.85 M sucrose. Ultracentrifugation was performed at 82,000× g for 2 h at 4°C in a TH641 swinging bucket rotor in an ultracentrifuge (Sorvall Discovery 90SE Thermo Fisher Scientific, MA, USA) and the synaptosome fraction was collected from the 1.0/1.2 M sucrose interface. All solutions were supplemented with RNase inhibitor (ProtectRNAtrademark RNase Inhibitor 500×Concentrate, Thermo Fisher Scientific, MA, USA). Purified synaptosomes were immediately processed for RNA extraction.
Compartmentalized cultures of primary cortical neurons
For optimal separation of neuronal cell bodies and dendrites, cells were cultured in custom made microfluidic devices (MFDs) manufactured from polymethylsiloxane (PDMS) poured in molds designed with soft-lithography in a clean room at the IV Physics Institute, Georg-August-University Göttingen similar to Epple et al. [32]. MDFs consist of 2 chambers connected with microgrooves (500×7500μm). Following polymerization, PDMS design was cut out of the molds, washed with soap water overnight, rinsed excessively with water, washed with EtOH for 2 h and mounted on glass slides by plasma application with a tesla coil. After mounting MFDs were washed with water, EtOH, incubated under UV light to sterilize and coated with PLO. Finally, MFDs were washed and left with culture medium to equilibrate at 37°C at least for 2 h prior cell seeding. Neuronal cells were plated in the MFDs by pipetting 200,000 cells in 60μl culture medium to the top well on one side. After a 10 min incubation, cells have moved to the lower well through the channel and stabilized enough for addition of 300μl neuronal culture medium per well. Cells in MFDs were infected on DIV1 with equimolar amounts of control, scrambled or miR-101a-3p lentivirus by removing the media from the bottom well, incorporation of the viral particles and reapplication on the top well so that viral particles are enriched in the culture channel. MFDs were incubated in petri dishes with a smaller dish with sterile double distilled H2O to prevent media evaporation from the device. In case evaporation is observed media is added from a sister mass neuronal culture in a standard plate treated in the same manner. Neurons grow in the MFDs for 10 days before further processing for imaging purposes. We did not observe cellular death upon infection.
Immunocytochemistry
Cells grown on coverslips were fixed with 2% PFA at ambient temperature for 20 min. Following incubation with blocking buffer (3% BSA; 0.1% Triton-X100, Sigma-Aldrich, MO, USA; PBS) at ambient temperature for 1 h, cells were incubated at 4°C overnight in anti-MAP2 antibody (rabbit, Proteintech) diluted 1:500 in blocking buffer. Cells were washed with PBS and incubated with Alexa Fluor 555 anti-rabbit IgG secondary antibody (goat, Invitrogen) diluted 1:1000 in blocking buffer at ambient temperature for 2 h or at 4°C overnight for the MFDs. For visualization of the nuclei cells were stained with Hoechst 33258 (2μg/mL, pentahydrate (bis-benzimide), Thermo Fisher Scientific, MA, USA); PBS). Finally, coverslips were mounted on glass slides (Knittel Glass, Germany) with Mowiol mounting medium (1.18 M 1,4 Diazabicyclo (2.2.2) octane, Sigma-Aldrich, MO, USA; 3.6 M glycerol; 0.13 M Tris pH 7.2) and MFDs were stored with PBS at 4°C until imaging.
Microscopy
Imaging of MFDs was performed with a Leica DMI6000 B microscope equipped with a Leica DFC320 color camera (Leica, Germany). Imaging of primary cell culture and brain sections was performed with a TCS SP5 confocal microscope (Leica, Germany). Images were analyzed with Fiji software.
Statistical analysis
Data analysis was performed using the Graphpad software version 5.03 for Windows (GraphPad Software, La Jolla California USA, https://www.graphpad.com). For group comparisons, one-way ANOVA with Dunnet’s post-hoc test was used, while comparisons of two groups of means were done with unpaired t test. All data are expressed as mean±SEM. Differences are considered significant with p < 0.05 (*p < 0.05, **<0.01, ***<0.001).
RESULTS
Altered midbrain miRNAome in A30P aSyn mice
We used an established Tg mouse model of synucleinopathy expressing familial PD-associated mutant A30P aSyn in order to identify RNA-mediated synaptic alterations. This Tg model displays motor and cognitive impairments at 12 months of age, while accumulation of insoluble aSyn forms is already evident at 3–4 months [24, 33, 34]. Transcriptional analysis of the mouse midbrain at 6 months shows downregulation of biological pathways related to neuronal development and synaptic signaling [35]. Thus, we assessed the miRNAome of the mouse midbrain at 6 months using small RNA-sequencing. Small RNA mapped reads in all samples consisted of 90.27% miRNA and principal component analysis (PCA) indicated a clear separation group. Although two samples in the Wt group are further from the rest, they are clearly separated from the Tg group and were not identified as significant outliers (Supplementary Figure 1a, b). 124 miRNAs were differentially expressed, of which 99 were downregulated and 25 upregulated (Fig. 1a). Gene set enrichment analysis (GSEA) was performed for the predicted miRNA target genes to determine affected processes. Development and morphogenesis were identified as the major processes affected by upregulated miRNAs, while downregulated miRNAs target genes were identified to mostly regulate secretion and, in particular, protein exocytosis (Fig. 1b).
Fig. 1
A30P αsyn expression alters midbrain miRNA expression. a) Heatmap illustrating differentially expressed miRNAs between Wt and Tg mice. The color key indicates expression levels ranging from lower (blue) to higher (red) expression. b) Enrichment ratio of overrepresented Gene Ontology terms of upregulated and downregulated miRNA targets. c) Heatmap illustrating negative interactions among deregulated miRNAs and mRNAs. The color key indicates expression levels ranging from lower (blue) to higher (red). d) Histogram plotting top interacting miRNAs according to number of target genes.
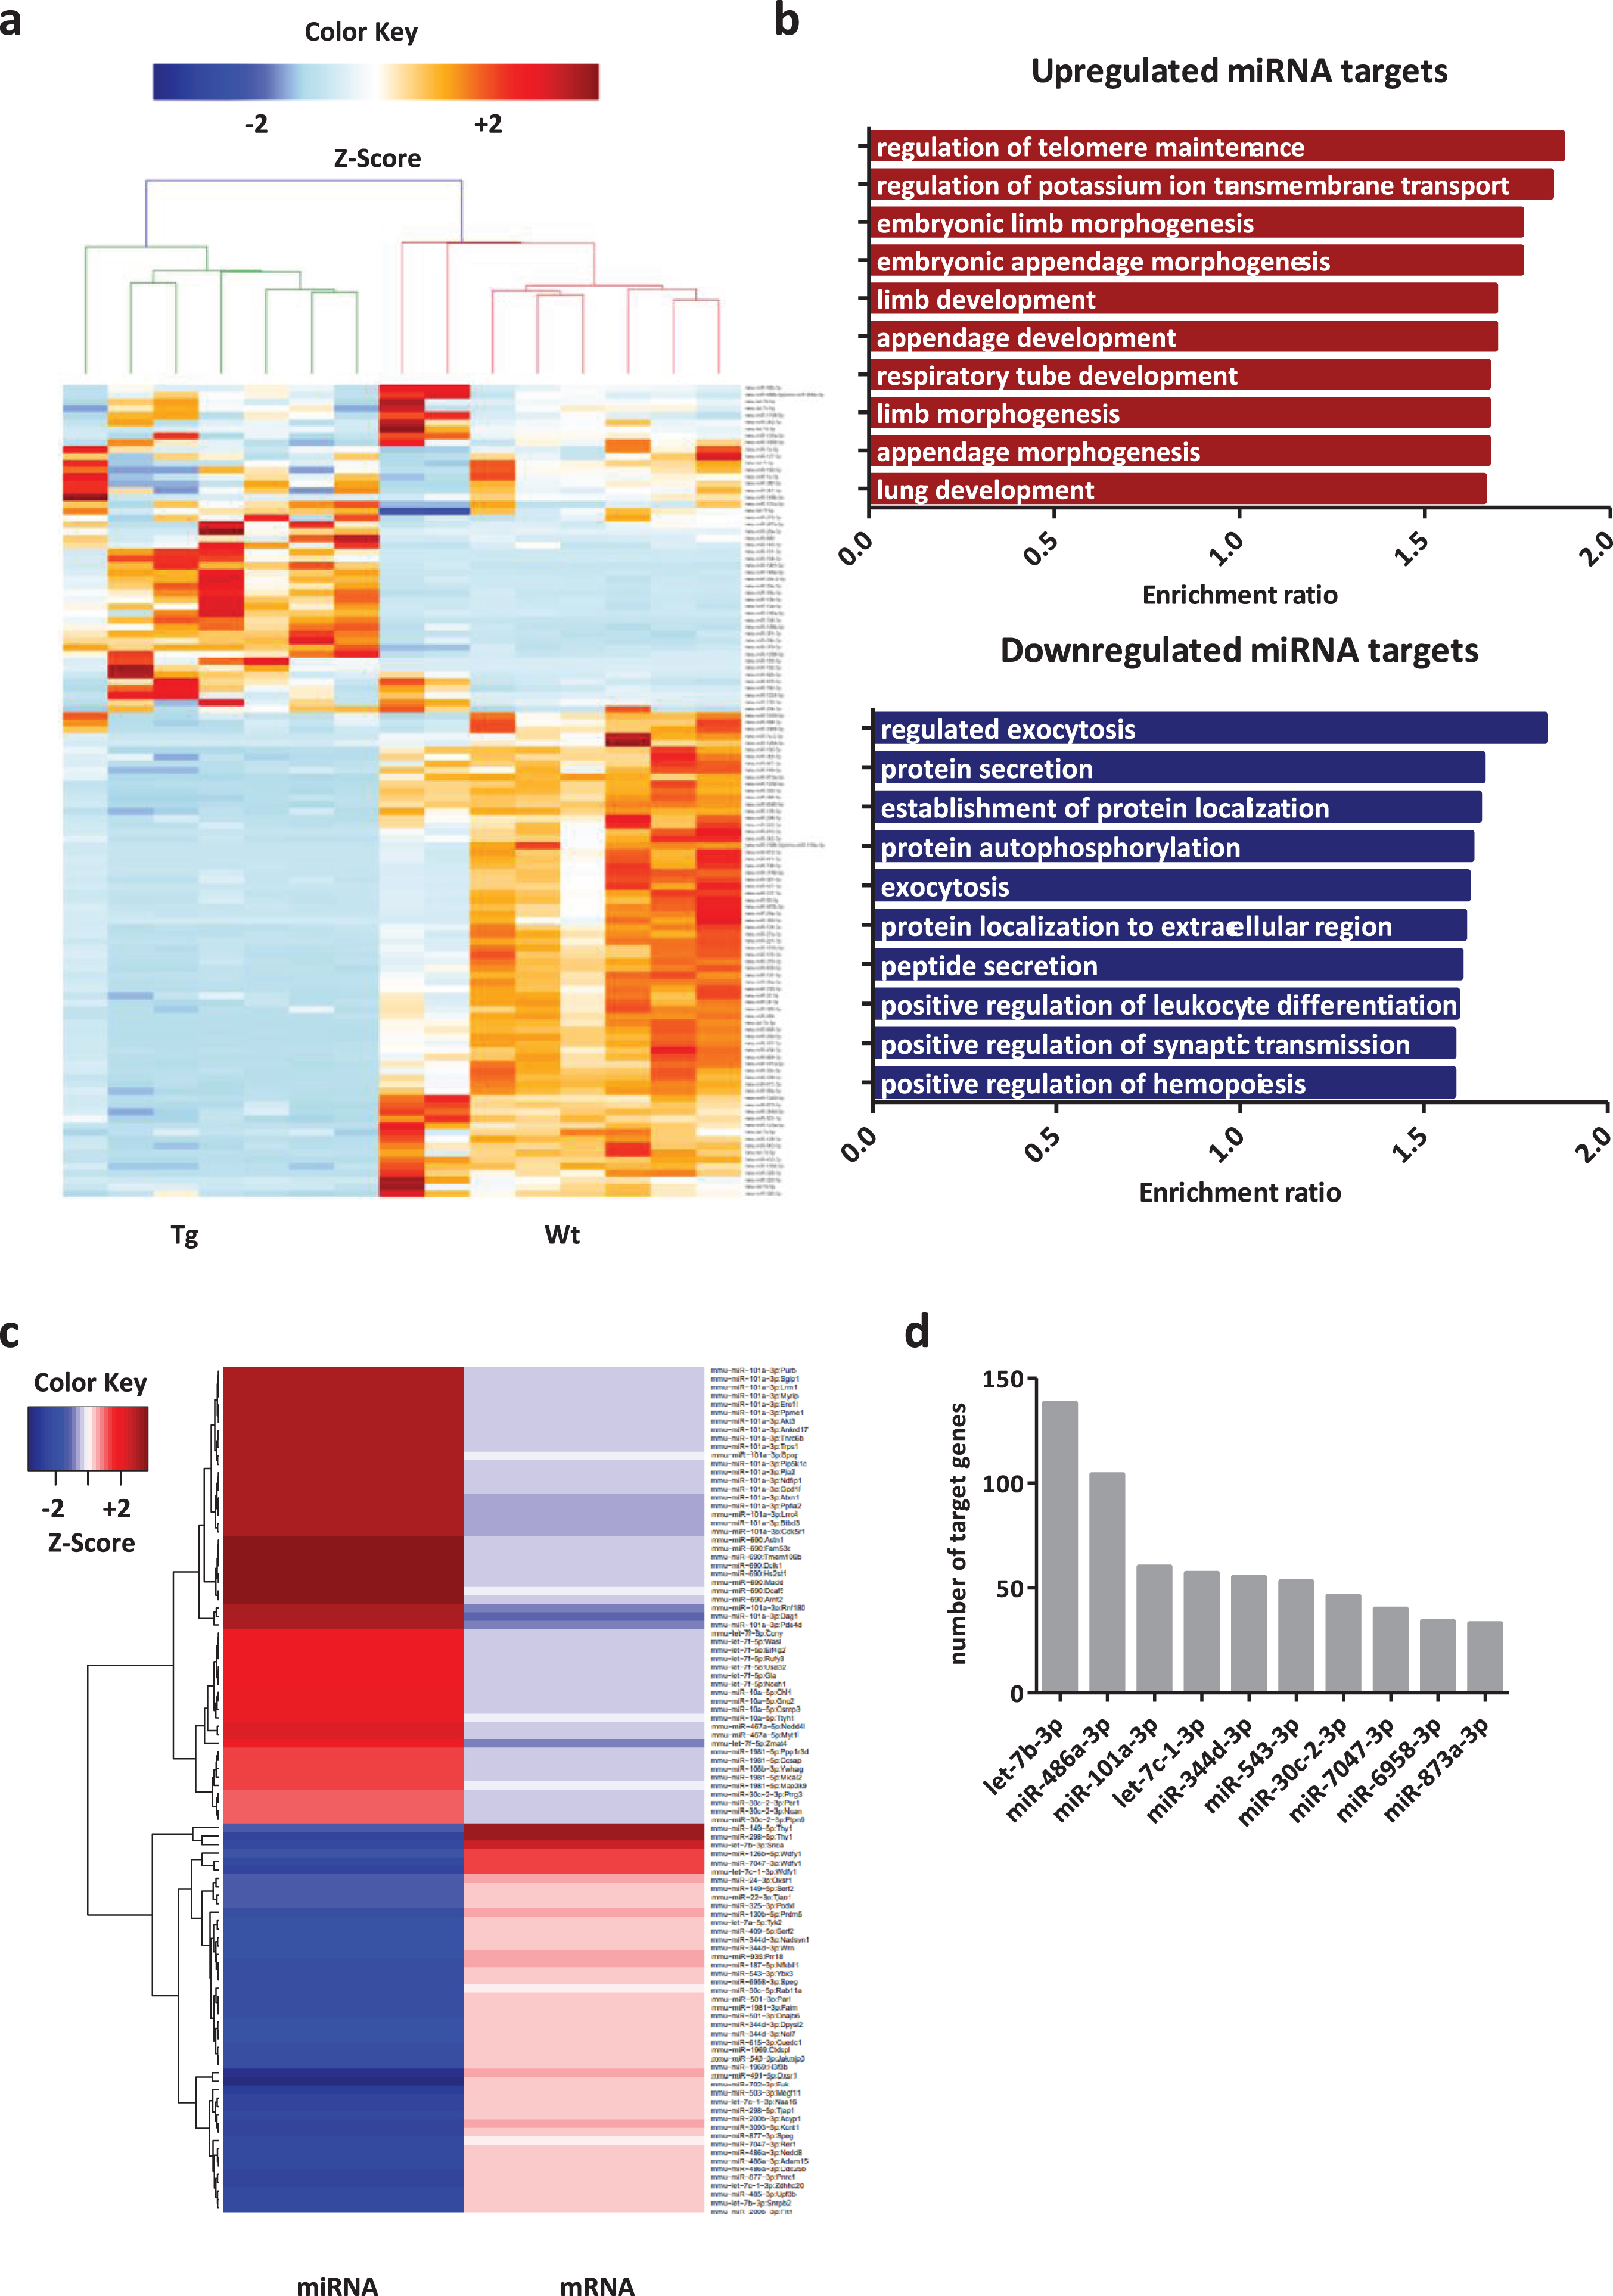
For further analysis we identified the predicted target mRNAs of the deregulated miRNA and correlated them with the deregulated mRNAs from the previously published data set [35]. Then, we selected the negative miRNA-mRNA interactions. This means, only downregulated mRNAs were appointed to upregulated miRNAs and contrariwise. Only those valid miRNA-mRNA interacting pairs were considered for downstream analysis. Finally, in order to select the most relevant pairs, the miRNAs were filtered according to number of target genes, and we selected the top 10 interacting miRNAs (Fig. 1d). This approach obviously restricted the candidate miRNAs but significantly increased the confidence of validity, reducing the possibility of identifying mRNAs targeted via non-canonical interactions or low proficiency matches with low biological impact [36, 37]. We identified the down regulated let-7b-3p (0.19±0.1 FC, p = 0.0003) and miR-486a-3p (0.20±0.08 FC, p = 0.0002) as the top interacting miRNAs with 138 and 104 upregulated target mRNAs respectively (Fig. 1d). Those miRNAs showed a low number of reads indicative of lower expression in the mouse midbrain reducing the chances of producing a strong phenotype alone (Supplementary Figure 1c). Considering the large number of validated targets, we cannot exclude the possibility of synergistic effects from other miRNAs targeting the same genes. Following the top 2 interacting miRNAs, a group of 4 miRNAs showed above 50 target genes. The upregulated miR-101a-3p (2.71±0.44 FC, p = 0.0009) with 60 target genes and the downregulated let-7c-1-3p (0.17±0.08 FC, p = 0.00007), miR-344d-3p (0.27±0.1 FC, p = 0.0004), and miR-543-3p (0.26±0.09 FC, p = 0.00005) with 57, 55, and 53 target genes respectively. Of those, miR-543-3p and miR-101a-3p are the miRNAs with the highest expression levels providing confidence of producing a strong phenotype (Supplementary Figure 1c).
Synaptic miR-101a-3p is deregulated in brain of PD mouse model and DLB patients
In order to validate our findings from bioinformatic analysis we performed qPCR. The relative levels of miR-543-3p were decreased in Tg mice, in agreement with the small RNA-seq data (0.26±0.09 FC, p = 0.00005), but the decrease did not reach significance (0.68±0.13 FC, p = 0.2518) due to variability in control animals (Supplementary Figure 1e). The levels of miR-101a-3p showed significant increase in Tg mice (2.71±0.44 FC, p = 0.0009) (Fig. 2a), in agreement with the small RNA-seq data (7.78±1.71 FC, p = 0.0006), indicating miR-101a-3p for downstream analysis based on our selection approach.
Fig. 2
miR-101a-3p is a synaptic miRNA dysregulated in PD mouse model and DLB patients. a) Real time qPCR validation of miR-101a-3p levels in Wt (n = 8) and Tg (n = 7) mouse midbrain. b) Fold enrichment of overrepresented Gene Ontology terms among miR-101a-3p target genes. GAPDH is used for normalization. c) Bar graph of miR-101a-3p enrichment ratio in cytosol and synaptosomes compared to total homogenate. d) Representative immunoblot of synaptic markers in the crude midbrain homogenate (hom), cytosolic fraction (cyt) and purified synaptosomes (syp) used for miRNA assessment e. miR-101a-3p levels quantified by real-time qPCR in cortex of 8 DLB patients and 14 control samples of healthy individuals.; All data are expressed as mean±SEM; Student’s t-test; *p < 0.05, **p < 0.01, ***p < 0.001).
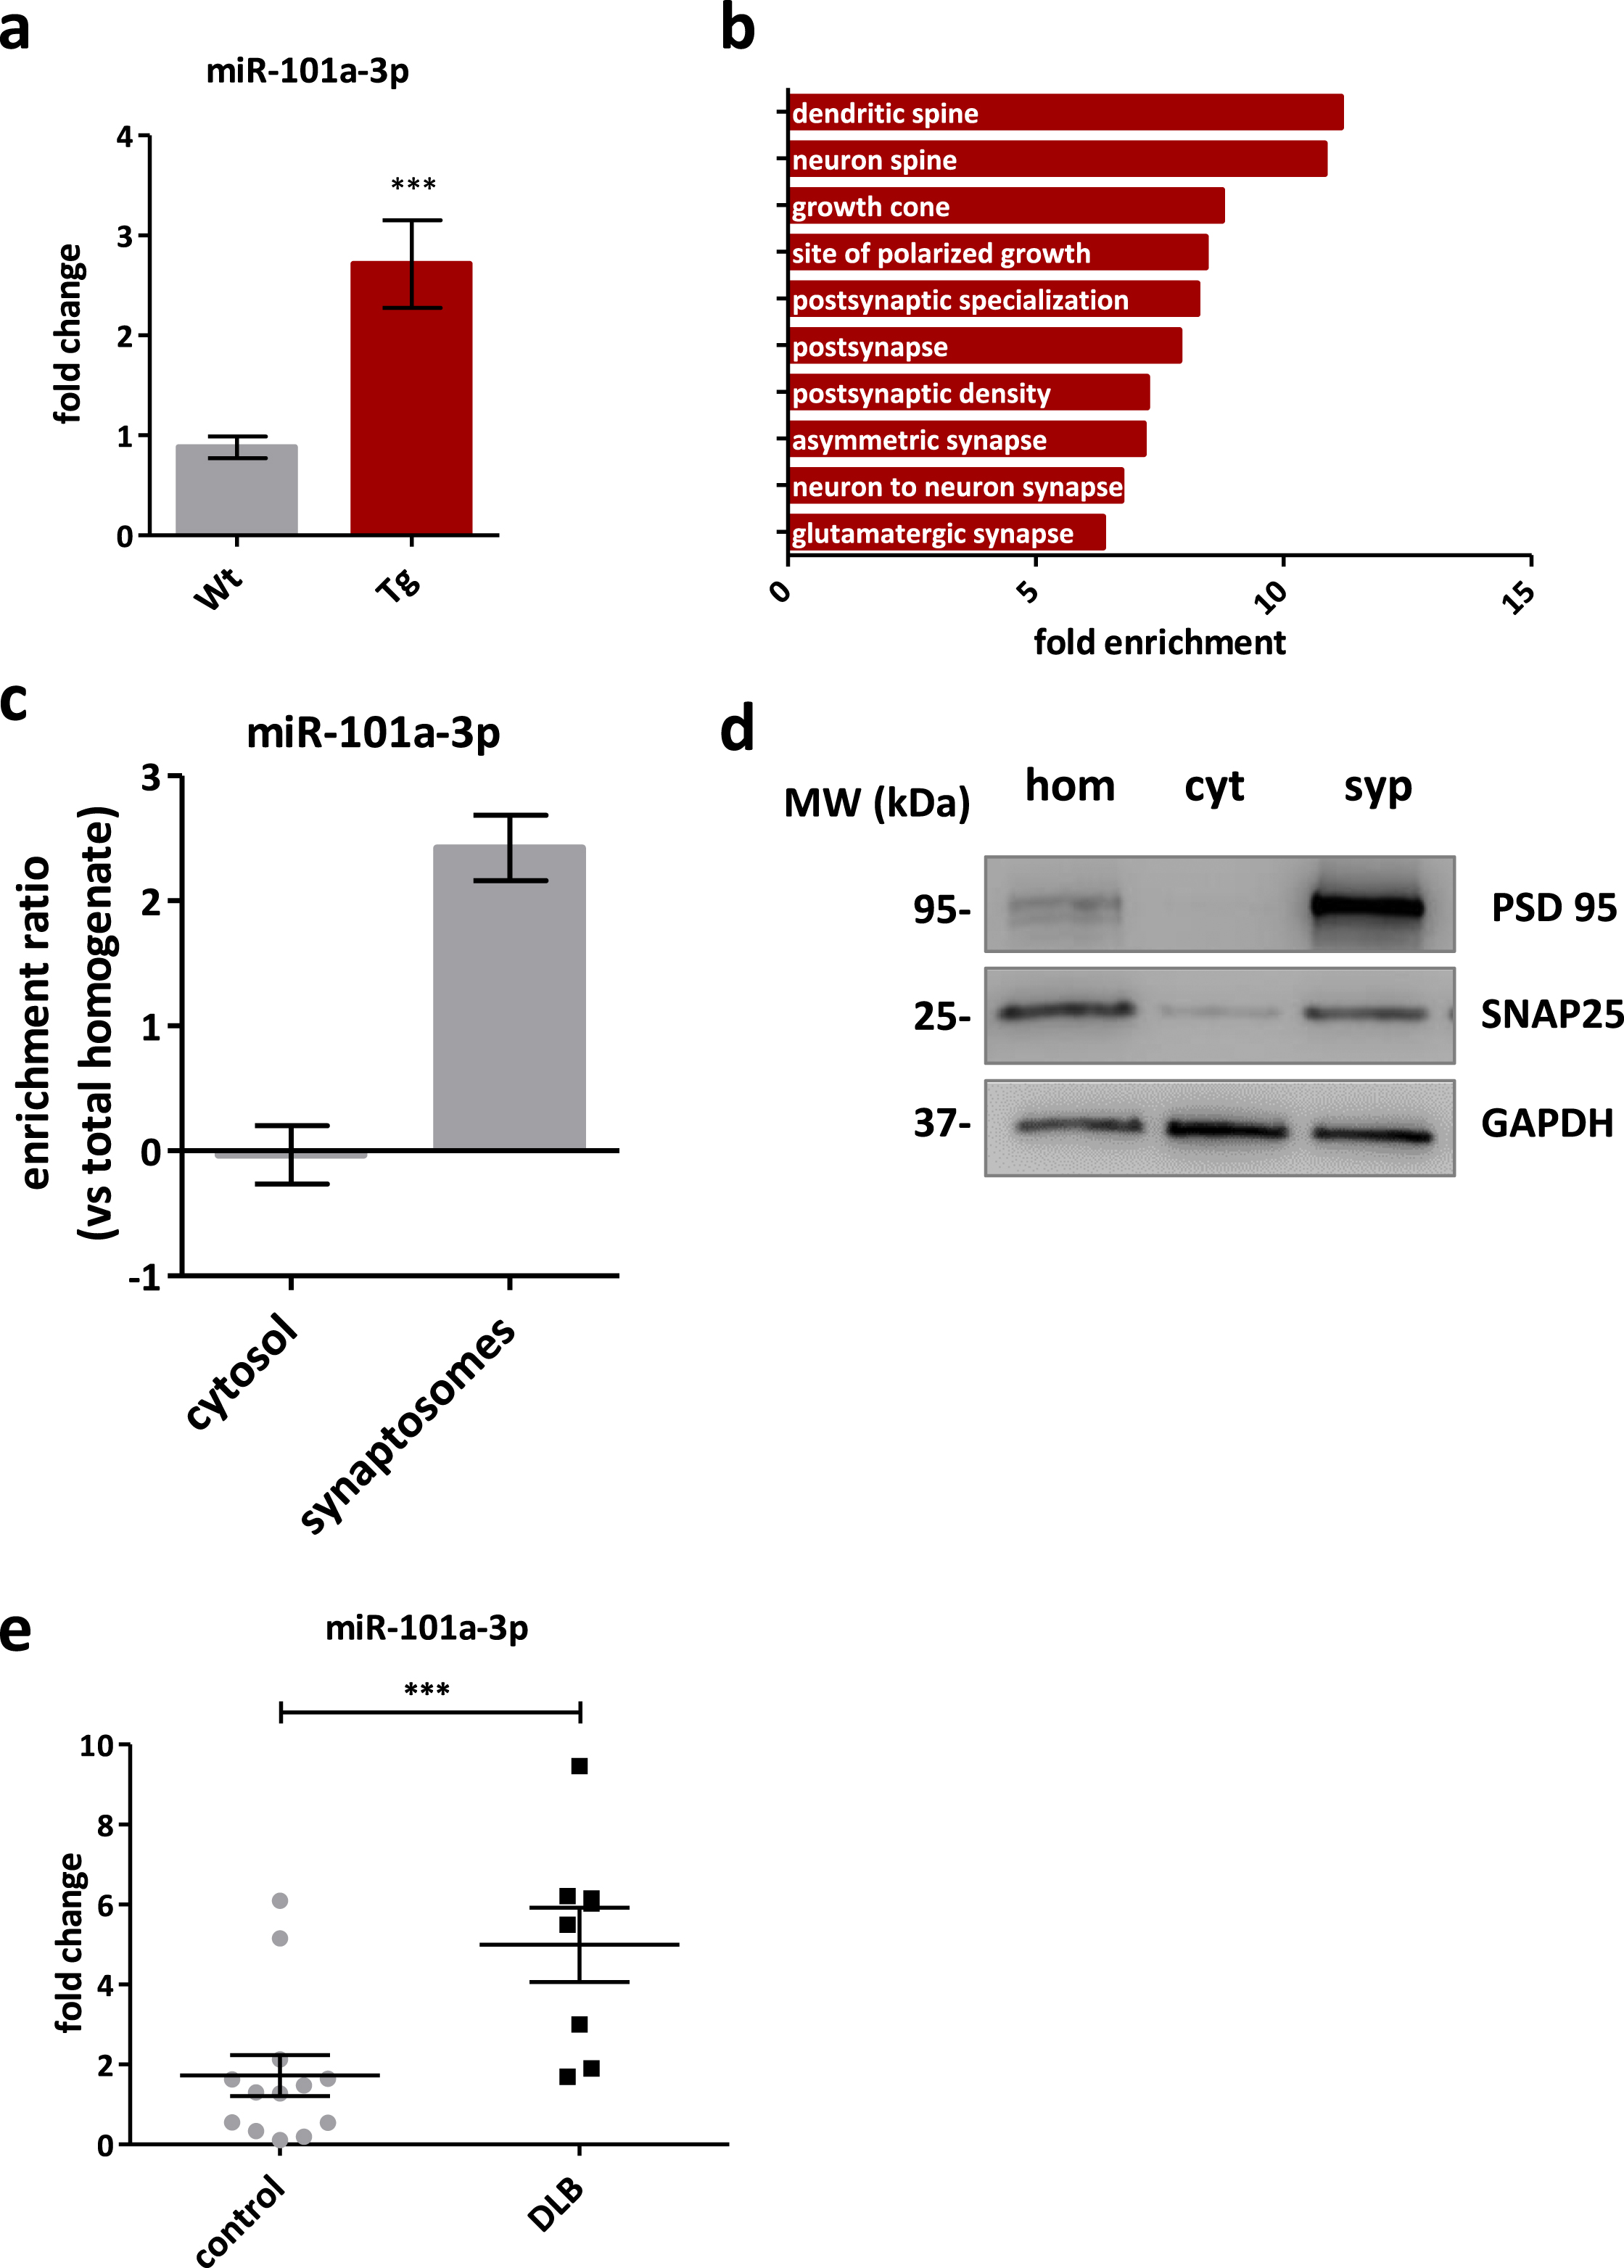
Next, GSEA was performed for the confirmed miR-101a-3p target genes based on the RNA-seq correlation. Analysis of the cellular component unveiled dendritic spines and post synapses as the affected compartments (Fig. 2b), in agreement with the cellular component from the bulk data set (Supplementary Figure 1d).
We then asked if miR-101a-3p acted locally, and specifically at the synapse. To address this, we assessed the levels of miR-101a-3p by qPCR in midbrain cytosolic and synaptosomal fractions of 6-month-old Wt mice, and calculated the miRNA enrichment ratio [18]. Cytosolic miR-101a-3p levels were similar to total homogenate while miR-101a-3p levels in synaptosomes were enriched by 2-fold (2.42±0.26) (Fig. 2c, d). This highlights that miR-101a-3p plays a regulatory role near synapses even in physiological conditions.
The Tg mouse we used displays cortical pathology and cognitive impairments that resemble those present in DLB [24, 33]. For this, we assessed by qPCR the relative expression levels of miR-101a-3p in the cortex of DLB patients obtained from the Newcastle Brain Tissue Resource (Supplementary Table 1) and found a significant increase in DLB samples (4.994±0.93 FC, p = 0.0027) compared to healthy individuals (Fig. 2e) indicating a potentially common epigenetic mechanism with the mouse model driven by miR-101a-3p.
miR-101a-3p effectively targets Dlgap3 and Gabrb2 and down regulates translation in vivo and in vitro
To validate the miRNA-driven synaptic deficits in the Tg mice, we focused on the miR-101a-3p target mRNAs and the post-synapse, as the data analysis indicated. Four downregulated target mRNAs associated with the post-synapse were identified: Dag1 (0.70±0.06 FC, p = 0.00017), Dlgap3 (0.66±0.07 FC, p = 0.0012), Shisa6 (0.53±0.05 FC, p = 0.000001), and Gabrb2 (0.48±0.07 FC, p = 0.000001) (Supplementary Figure 1f). The levels of the mRNAs were assessed in mouse midbrain by qPCR. The levels of Dlgap3 (0.60±0.06 FC, p < 0.0001) and Gabrb2 (0.64±0.14 FC, p = 0.01) were found significantly downregulated (Fig. 3a), while the levels of Dag1 (1.19±0.06 FC, p = 0.28) and Shisa6 (1.28±0.11 FC, p = 0.045) were not altered (Supplementary Figure 1g).
Fig. 3
miR-101a-3p regulates postsynaptic proteins GABA(A)b2 and SAPAP3 in vivo and in vitro. a) Real time qPCR assessment of miR-101a-3p target genes Gabrb2 and Dlgap3 levels in Wt (n = 8) and Tg (n = 7) mouse midbrain. b) miR-101a-3p targeting 3’UTRs of Gabrb2 and Dlgap3 validation by Gaussia luciferase assay (n = 6). Gaussia luciferase activity is normalized to β-galactosidase activity. c) Representative immunoblots and quantification of GABA A b2 and SAPAP3 levels in Wt (n = 4) and Tg (n = 4) mouse midbrain. β-actin is used for normalization. d) Real time qPCR assessment of miR-101a-3p levels and e) target genes Gabrb2 and Dlgap3 in neurons infected with control vector expressing only GFP (control) (n = 4), vector expressing GFP and scrambled miRNA sequence (scrambled) (n = 4) and vector expressing GFP and miR-101a-3p (miR-101a-3p) (n = 4). f) Representative immunoblots and quantification of GABA A b2 and SAPAP3 levels in infected neurons (n = 4). β-actin is used for normalization. All data are expressed as mean±SEM; Student’s t-test; *p < 0.05, **p < 0.01, ***p < 0.001).
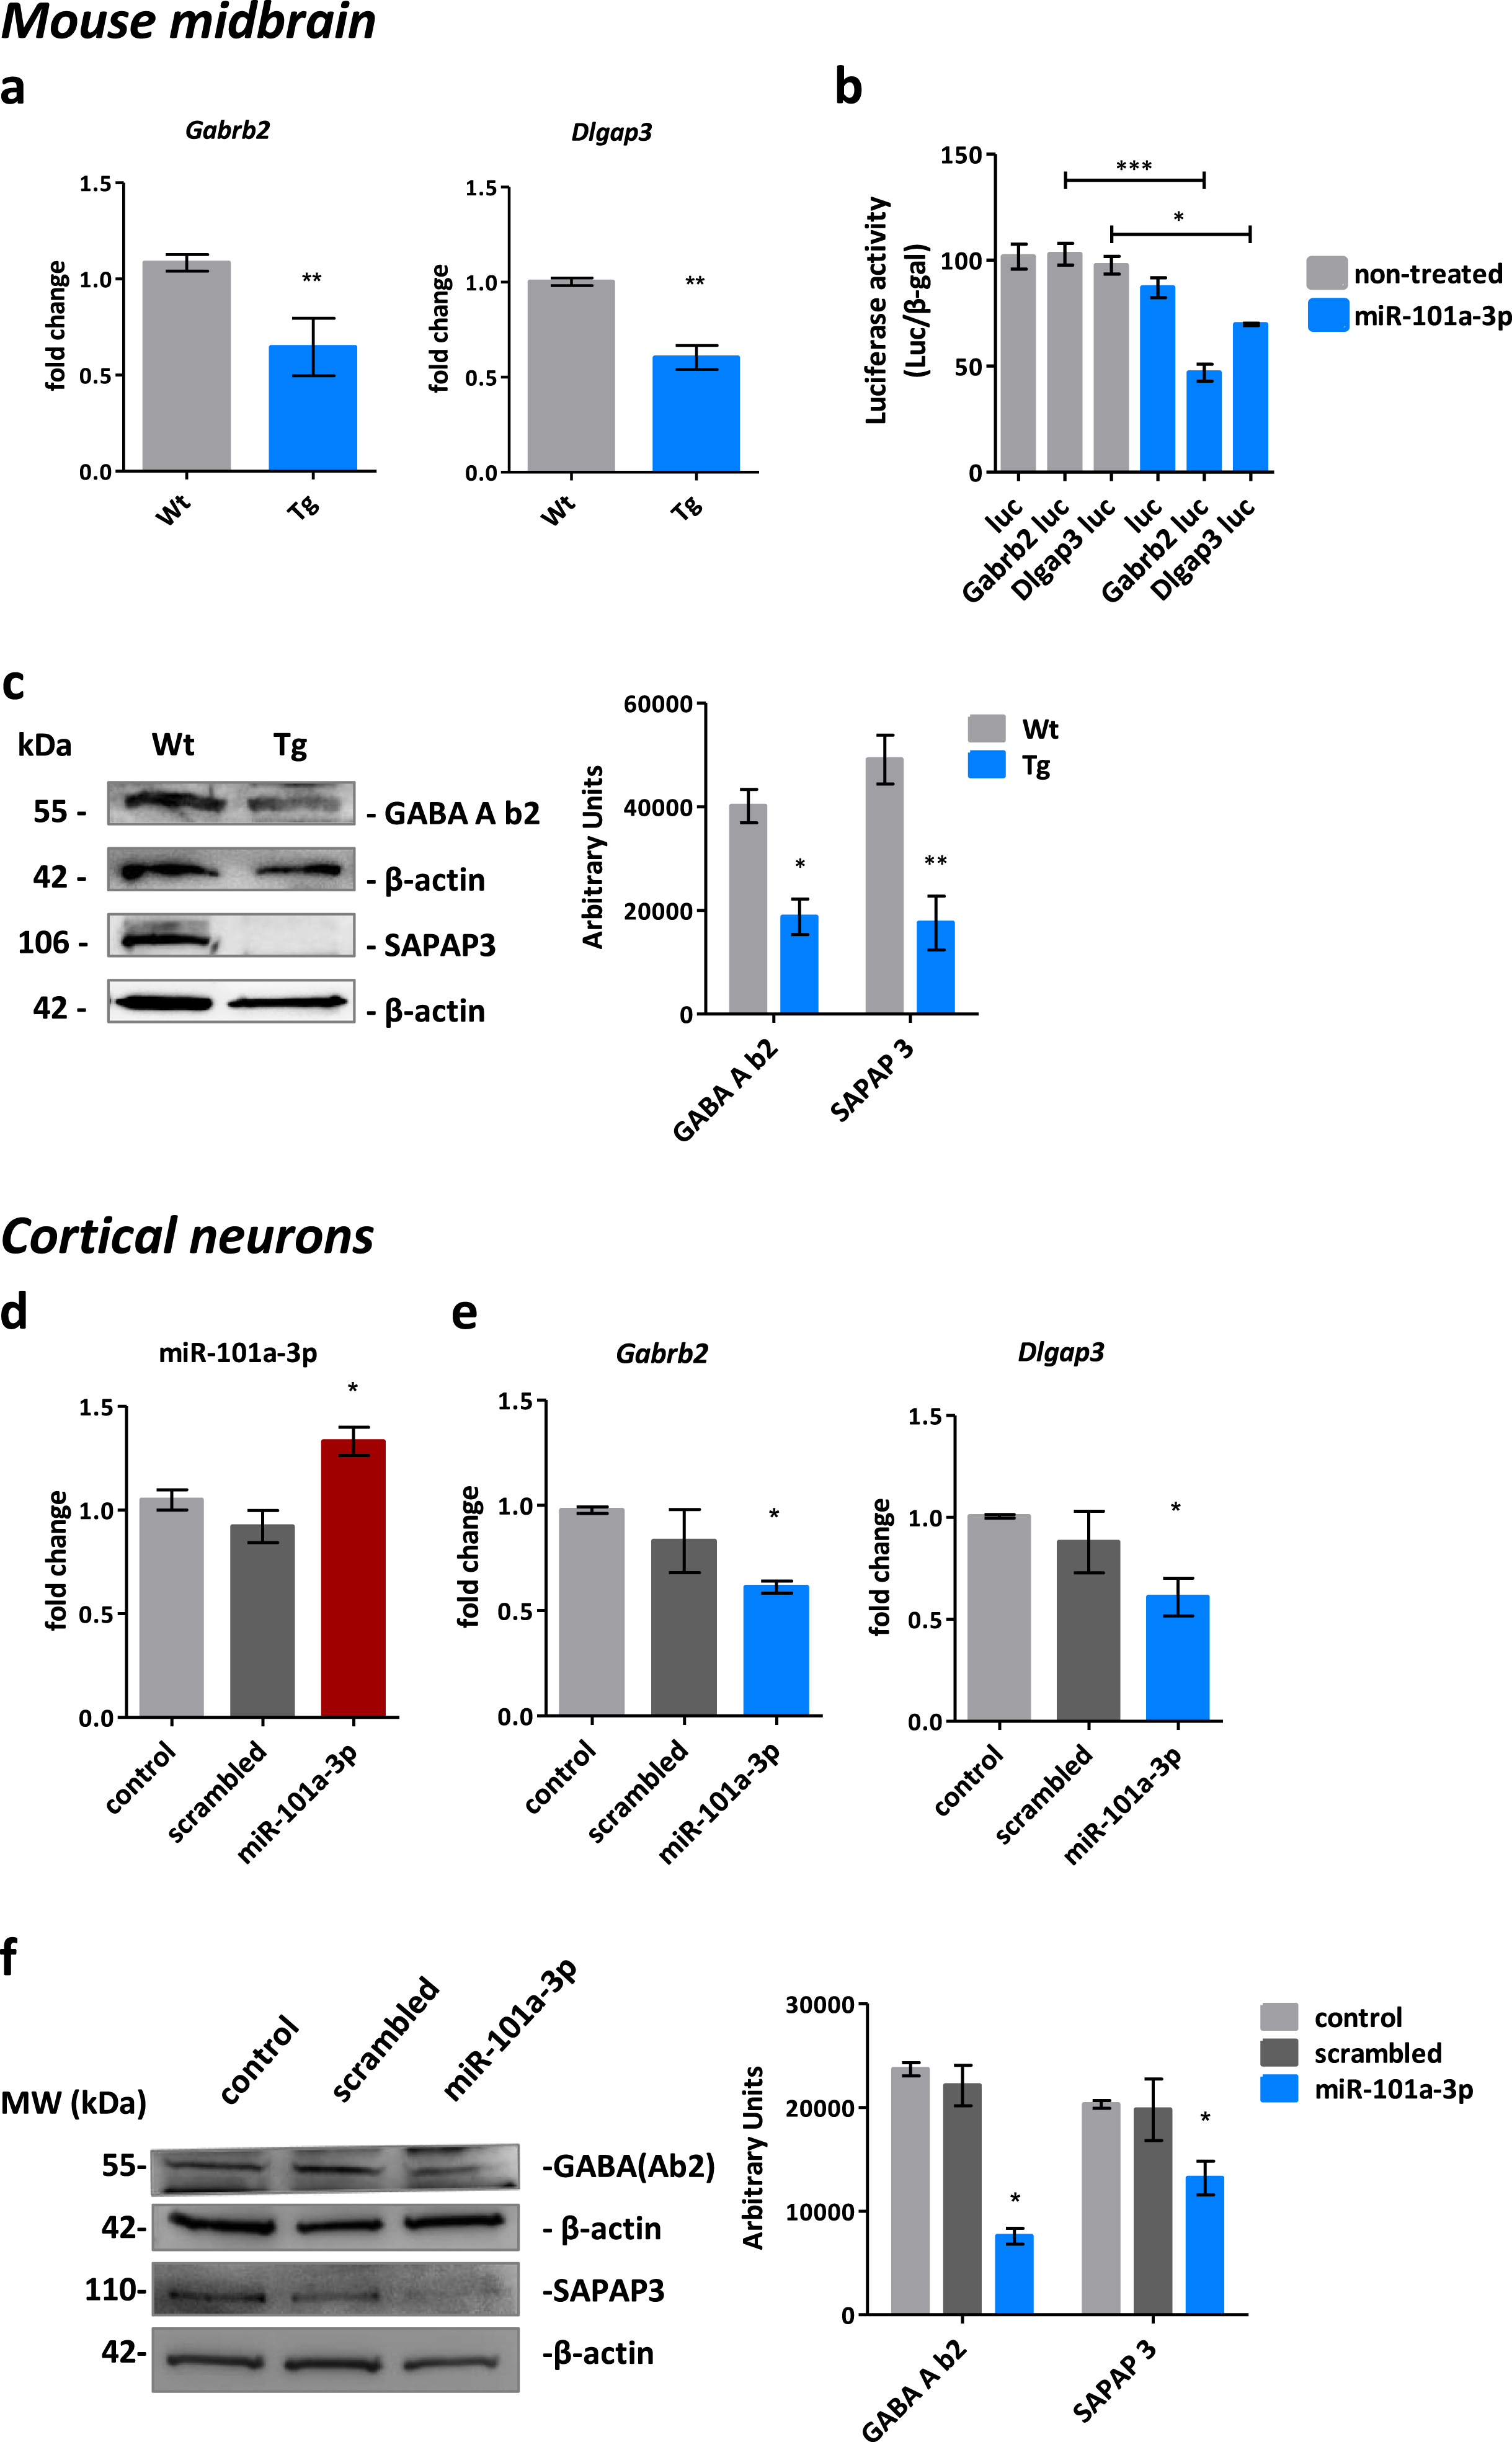
The interaction of miR-101a-3p and its targeting sequence in the miRNA 3′-UTR was assessed by the Gaussia luciferase reporter assay. Luciferase activity was significantly inhibited by miR-101a-3p for the constructs containing the Dlgap3 and Gabrb2 3’UTR but not the naïve construct (Fig. 3b), confirming the post-transcriptional regulation of the target genes via the miR-101a-3p binding. Importantly, translation of Dlgap3 and Gabrb2 was significantly reduced as shown by the immunoblotting analysis of the produced proteins SAPAP3 and GABA(A)b2 that showed a significant decrease of 53% and 64% respectively in the mouse midbrain.
To confirm our observations were due to miR-101a-3p increase, we infected neurons with a lentiviral construct expressing miR-101a-3p (Fig. 3d). Infection efficiency and expression levels were equal among conditions (Supplementary Figure 2a, b). Importantly, post-transcriptional downregulation of mRNAs Dlgap3 (0.61±0.20 FC, p = 0.049) and Gabrb2 (0.51±0.24 FC, p = 0.02) was verified (Fig. 3e) and translation of the mRNAs was inhibited resulting in a significant decrease of 54% and 30% for GABA(A)b2 and SAPAP3 respectively (Fig. 3f), suggesting miR-101a-3p specifically targets Gabrb2 and Dlgap3 and successfully inhibits translation.
miR-101a-3p alters dendritic morphology in vivo and in vitro
Bioinformatic analysis identified dendritic spines and post synapses as the compartments affected by miR-101a-3p-mediated processes thus we sought to visualize the mouse midbrain dendritic spines with the Golgi-Cox staining (Fig. 4a, Supplementary Figure 3a). Although the absolute number of dendritic spines was not altered among Wt (6.471±0.1583 spines / 10μm) and Tg animals (6.485±0.3969 spines / 10μm) (Fig. 4b), classification of dendritic spines showed that in Tg mice the mushroom and thin spines, which are considered the more mature and plastic structures, were reduced by 24% (p = 0.0429) and 35% (p = 0.0007) respectively, while the more immature stubby spines, were increased by 69% (p = 0.0002) (Fig. 4c). Representative classification image is presented in Supplementary Figure 3b.
Fig. 4
miR-101a-3p reduces dendritic length and alters dendritic spine morphology in vivo and in vitro. a) Representative Golgi-Cox staining images of the analyzed brain region in Wt mouse; brightfield; scale bar = 200μm; and dendritic spine segments of Wt and Tg animals; brightfield; scale bar = 10μm. b) Quantification of total dendritic spines per 10μm dendrite and c. classified as mushroom, thin and stubby in Wt (n = 3) and Tg (n = 3) mice. (n≥45×10μm segments per condition manually counted with Fiji software). d) Photo of the custom made MFD; upper wells and chamber are filled with red dye and the bottom with blue dye. Fluorescent image of neurons cultured in the bottom chamber and the dendrites growing to the upper chamber through the microgrooves; MAP2 - red; scale bar = 200μm. e) Bar graph of average length (μm) of distal dendrites growing through the microgrooves of MFDs of neurons infected with control vector expressing only GFP (control), vector expressing GFP and scrambled miRNA sequence (scrambled) and vector expressing GFP and miR-101a-3p (miR-101a-3p) (n = 3 individual experiments×3 MFDs per condition). f) Bar graph of average length (μm) of apical dendrites in sparsely cultured infected neurons (n≥25 cells from 4 individual experiments per condition). g) Representative images of dendrites at the exit point to the upper chamber of the MFDs; MAP2 - red; scale bar = 50μm, single infected neurons; GFP – green; MAP2 - red; Hoechst – blue; scale bar = 10μm and dendritic spine segments; MAP2 – red; scale bar = 50μm. h) Quantification of total dendritic spine number and i) classification of mushroom, thin and stubby dendritic spines per 10μm dendrite of infected neurons (n≥32×10μm segments per condition manually counted with Fiji software). All data are expressed as mean±SEM; Student’s t-test; *p < 0.05, **p < 0.01, ***p < 0.001).
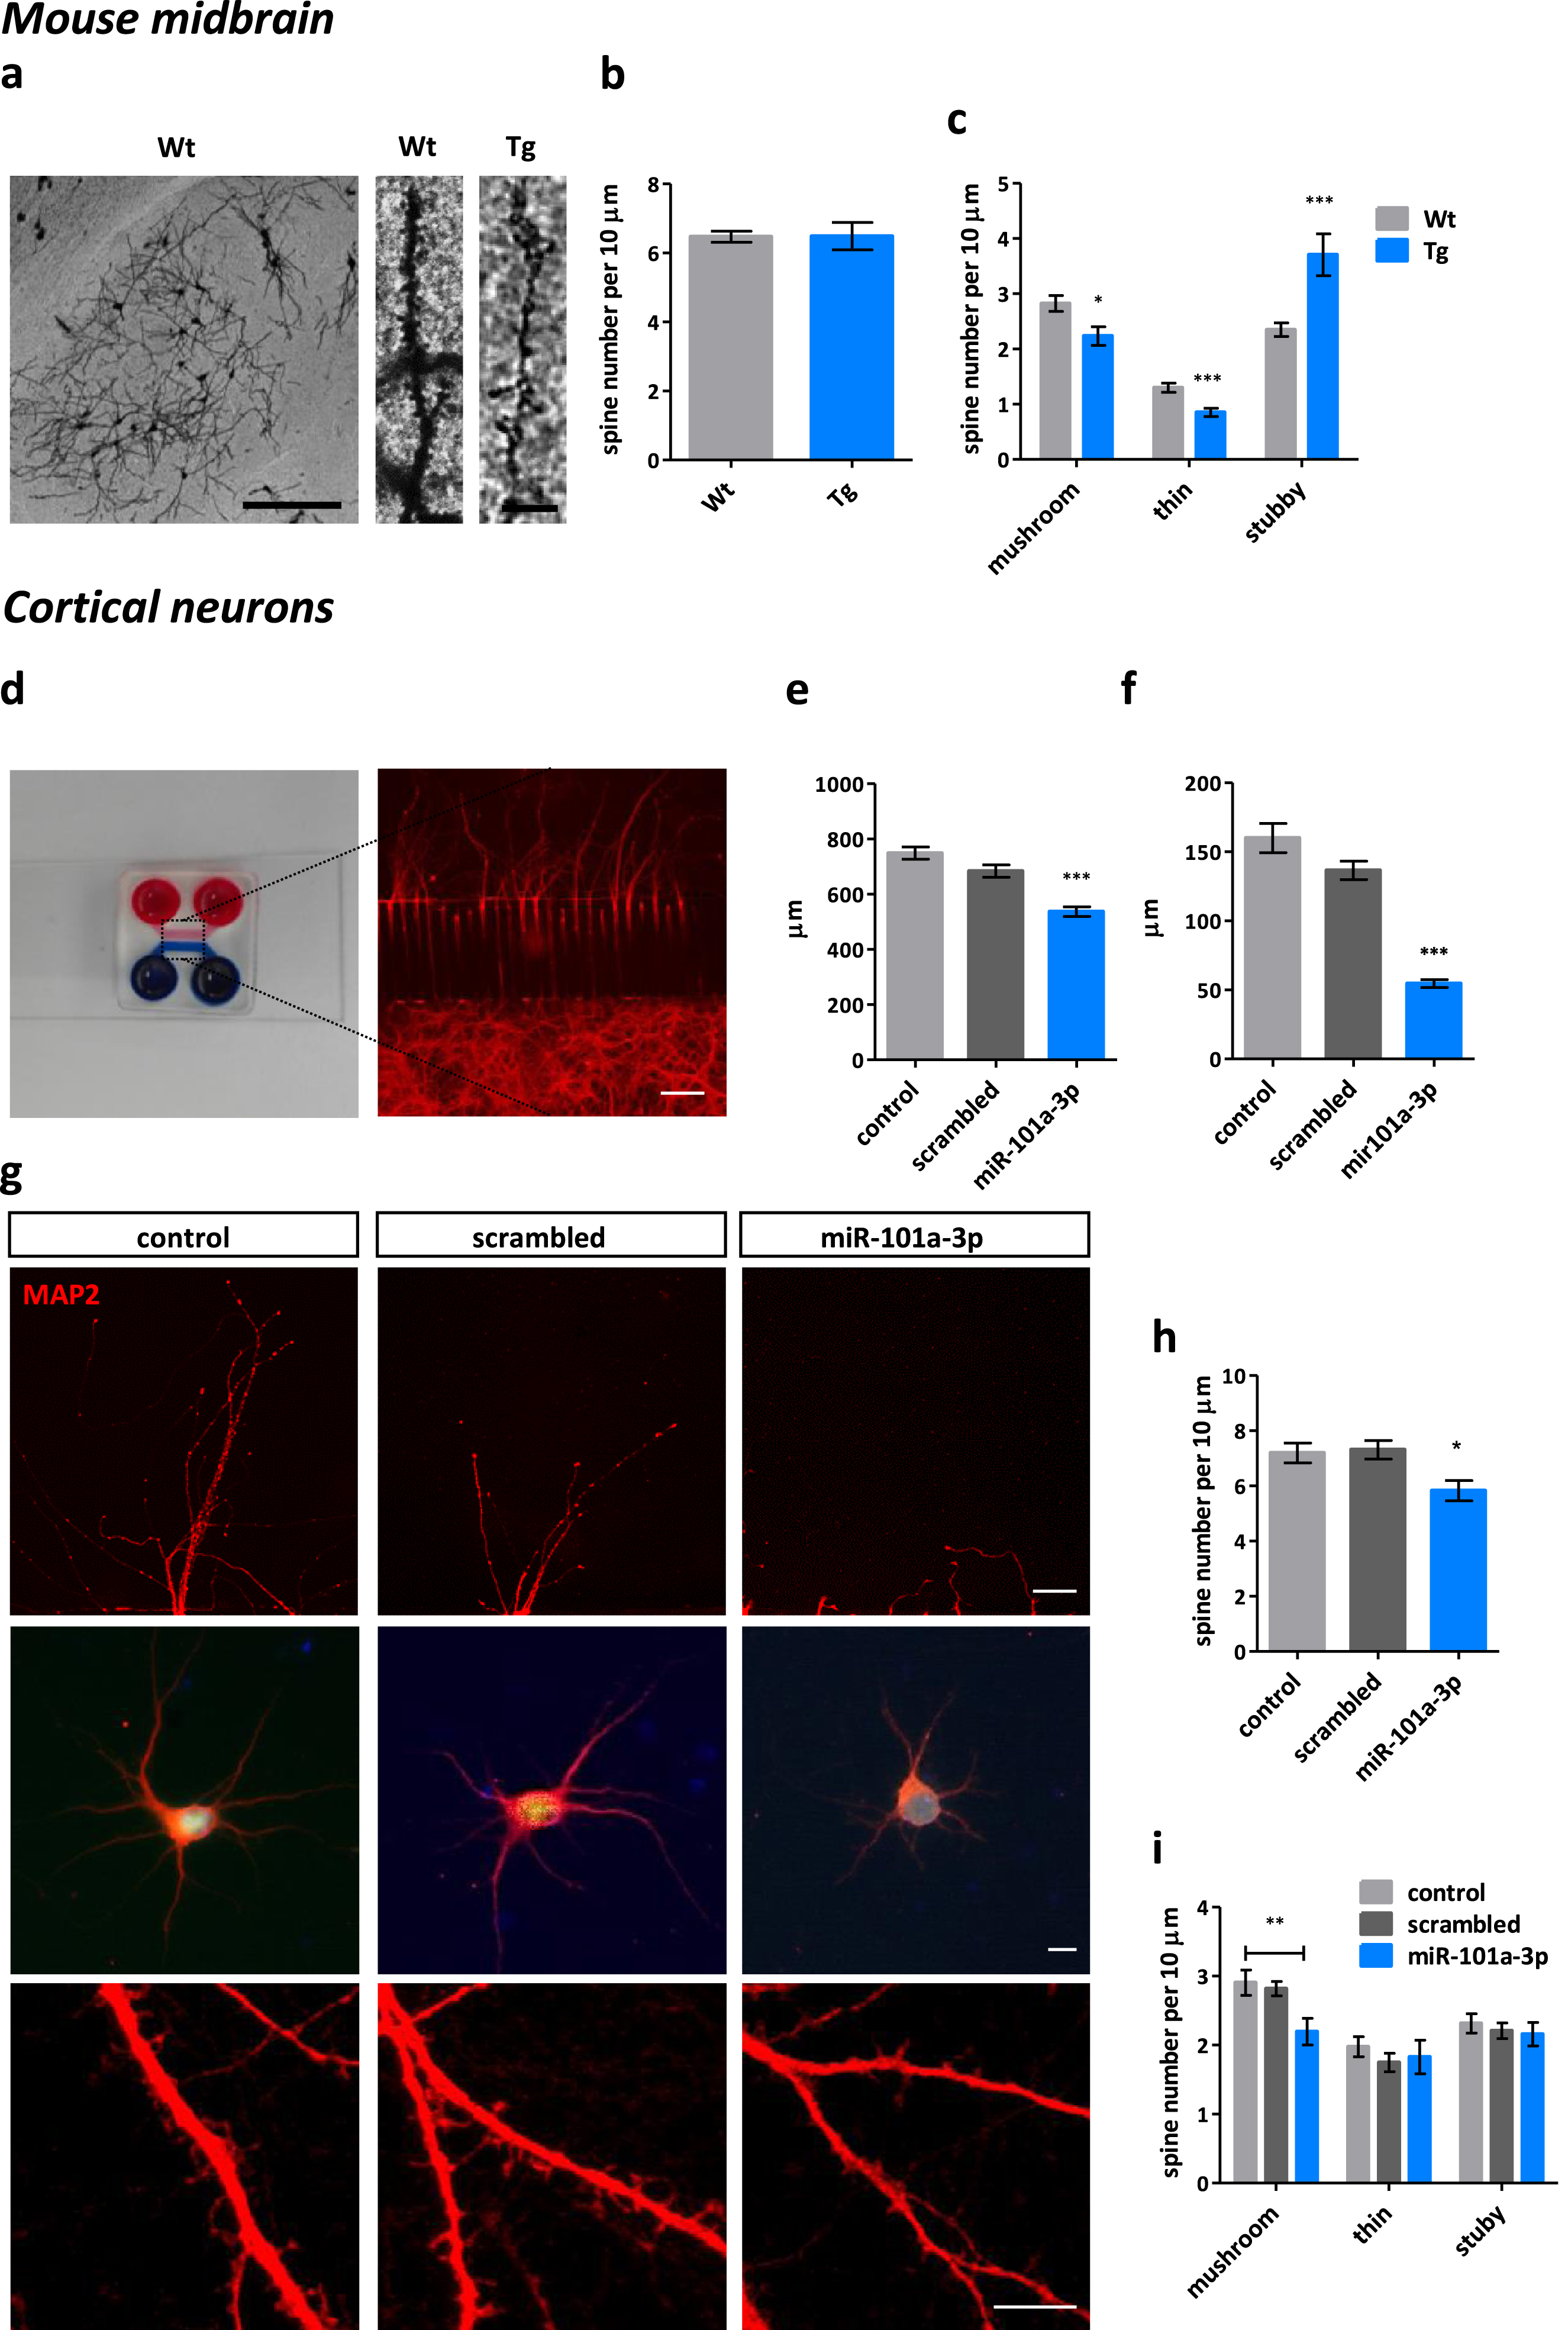
To study the direct effects of miR-101a-3p on neuronal morphology, neurons were cultured in the custom-made MFDs to allow the separation and visualization of neuronal dendrites which growing through the microgrooves away of the cell bodies (Fig. 4d). miR-101a-3p induction resulted in significantly shorter dendrites (537.2±17.4μm) compared to the scrambled miRNA (683.8±22.11μm) (Fig. 4e). As these numbers account for the distal dendrites, we cultured neurons sparsely in order to assess the apical dendrites which were significantly shorter upon miR-101a-3p expression (54.6±2.8μm) compared to scrambled miRNA (136.6±6.7μm) (Fig. 4g, f).
Dendritic spine assessment in vitro indicated absolute spine number was significantly decreased upon miR-101a-3p expression (5.8±0.4 spines / 10μm) compared to scrambled miRNA (7.3±0.3 spines / 10μm) (Fig. 4g, h). Classification of dendritic spines showed 30% reduction of mushroom spines which accounted for the total spine number reduction as the thin and stubby spines remained unchanged (Fig. 4i). Representative classification image is presented in Supplementary Figure 3c. Collectively, these data confirm miR-101a-3p increase drives the observed post-transcriptional deregulation and the synaptic phenotype linked with early synaptic damage or synaptic plasticity impairments. A direct link between miRNA deregulation and aSyn pathology remains to be examined.
miR-101a-3p expression is triggered by aSyn species and miR-101a-3p shows a dynamic role in neuronal plasticity
To confirm the mechanistic role of miR-101a-3p on synaptic impairments involved in synucleinopathy, we assessed a direct correlation between aSyn and miR-101a-3p. For this, primary neurons were exposed to forms of wt raSyn thought to accumulate during the aggregation process (monomeric, oligomeric, and PFFs) as in Mahul-Mellier et al. [12]. Following incubation, a significant miR-101a-3p increase was identified by qPCR in neuronal cells exposed to monomeric and oligomeric aSyn species (1.75±0.38 FC and 1.75±0.09 FC respectively) but not to PFFs (1.02±0.06 FC) (Fig. 5a). This coincided with synaptic loss in the PFF exposed neurons, estimated by synaptic markers PSD95 and synaptophysin (Fig. 5b), suggesting miR-101a-3p that is enriched in synapses is lost parallel to synaptic loss. With this, we confirm a direct effect of aSyn levels/pathology on the miRNA levels while the opposite interaction was not confirmed as miR-101a-3p induction failed to induce any change in aSyn levels (Supplementary Figure 2c).
Fig. 5
miR-101a-3p is reduced in a model of synaptic plasticity and induced by aSyn. a) Real-time qPCR assessment of miR-101a-3p levels in neurons exposed to monomeric or oligomeric aSyn species and PFFs. b) Representative Immunoblot of synaptic markers in neurons exposed to the different aSyn species. β-actin is used for normalization. c) Real-time qPCR assessment of miR-101a-3p levels in midbrain of mice grown in standard environment (n = 4) or enriched environment (n = 4). All data are expressed as mean±SEM; Student’s t-test; *p < 0.05, **p < 0.01, ***p < 0.001).
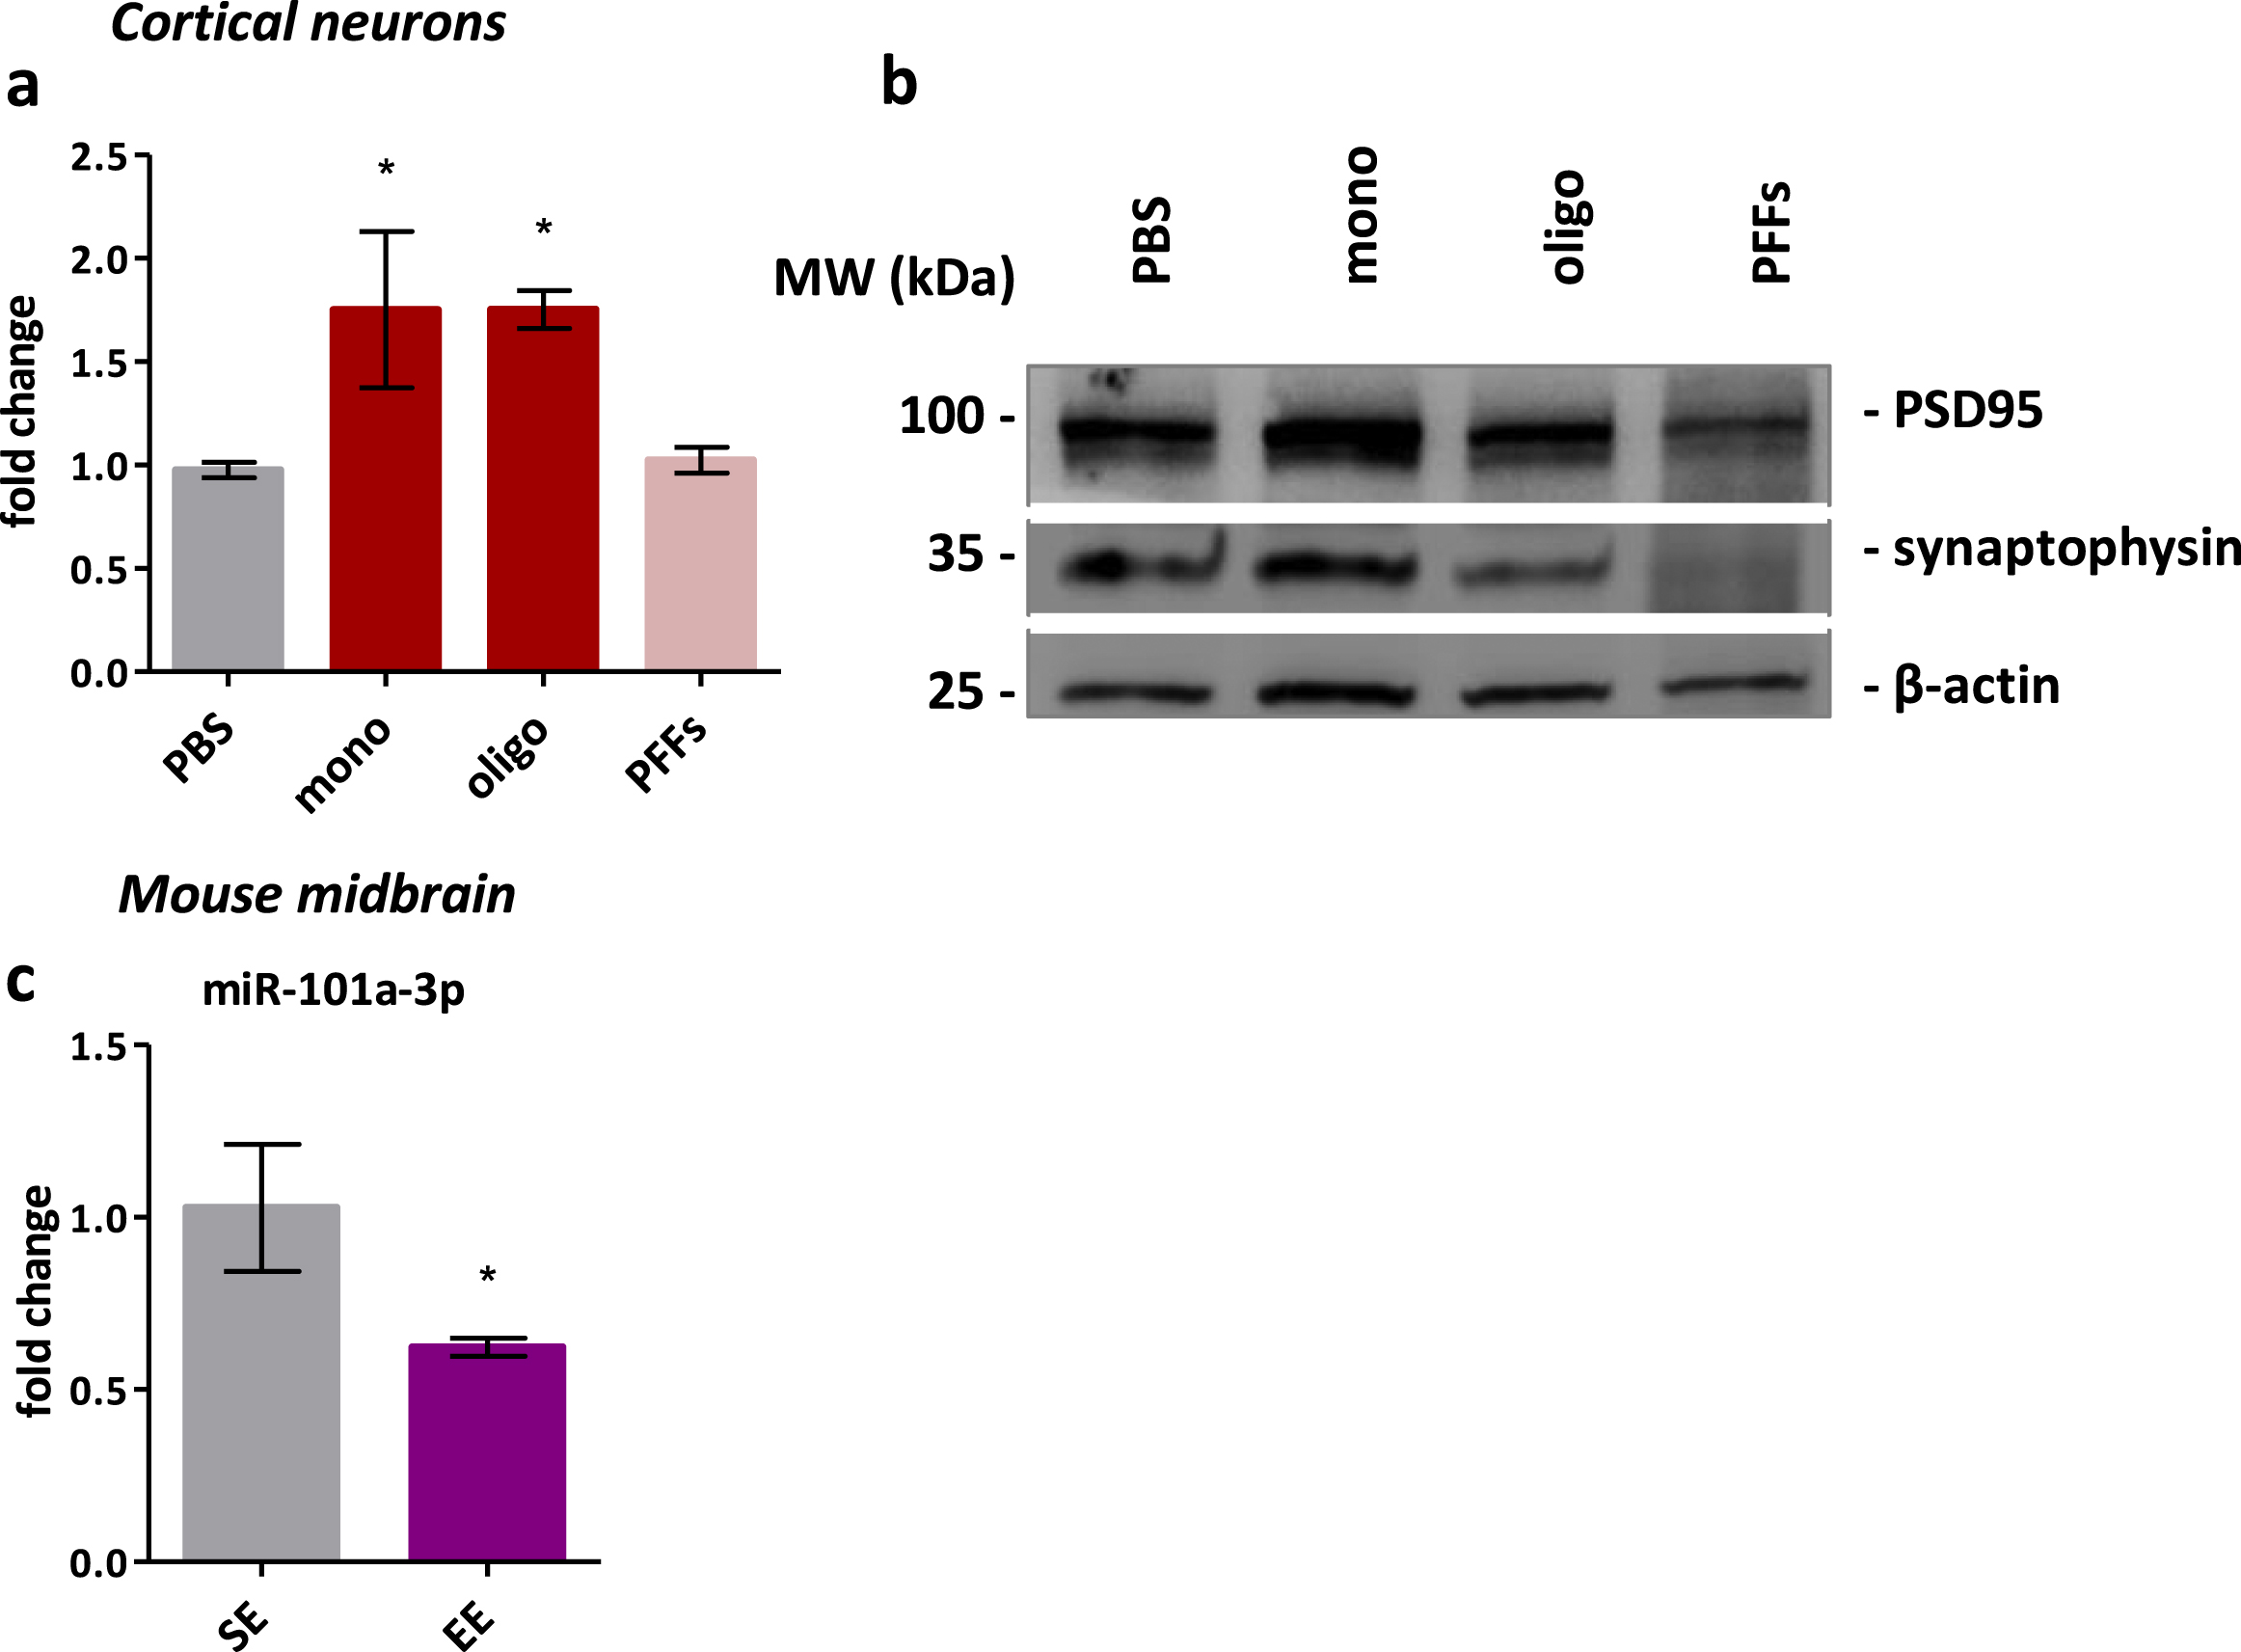
Finally, to confirm the role of miR-101a-3p in synaptic physiology, we performed a proof-of-concept experiment by assessing miR-101a-3p levels in a model of enhanced synaptic plasticity. We used midbrain from 12-month-old Wt animals housed in an enriched environment (EE) or in a standard environment (SE), and found a significant reduction in the EE group (0.6235±0.02611 FC) (Fig. 5c) confirming the role of this miRNA in synapse physiology and its potential to be modulated by environmental factors and lifestyle choices.
DISCUSSION
The late diagnosis and the poor understanding of the molecular underpinnings of synucleinopathies are major hurdles for the development of effective therapeutic strategies. Therefore, it is essential to maintain an open mind and to focus on the study of early disease-associated alterations [14, 36–39]. Importantly, existing data points to the synapse as a neuronal compartment affected at early stages in synucleinopathies.
Our study provides further evidence that synapse physiology is disrupted early in synucleinopathies. Focusing on epigenetic regulation, we identified and validated in mouse and human tissue, upregulation of miR-101a-3p. This resulted in a significant reduction of GABA(A)b2 and SAPAP3 protein levels, of dendritic length and of mushroom spines, consistent with early synaptic damage and/or synaptic plasticity impairments. Importantly, we confirmed miR-101a-3p is directly modulated by aSyn levels in vitro, indicating a direct effect of aSyn burden on synapses mediated by the miRNA increase. Finally, analysis of miR-101a-3p in midbrain of mice housed in EE, to enhance synaptic plasticity, showed a reduction of miR-101a-3p upon EE suggesting a potential for modulation under physiological conditions.
To the best of our knowledge, our study is the first attempt to analyze the midbrain miRNAome in A30P aSyn mouse. The selected age of 6 months is when aSyn starts to aggregate while neuronal loss is not evident and synaptic function alterations are occurring [33, 40]. We identified significant deregulation of the miRNAome, in addition to direct protein effects. Our hypothesis that miRNAs participate in pathways related in synaptic compartment prior to neuronal loss was validated by pathway analysis, showing strong correlation with the pre- and post-synapse.
Among the deregulated miRNAs identified, miR-101a-3p was the most potent in terms of expression levels and number of target genes. While our approach restricts miRNA signatures, it significantly increases the validity of the selected targets and related phenotypes. miR-101a-3p was previously studied in the context of synucleinopathy and was found increased in the striatum of multiple system atrophy patients and in oligodendrocytes, where it inhibits autophagy and promotes aSyn accumulation [41]. The diverse effects of miR-101a-3p highlight the different effects of a single miRNA in distinct cellular backgrounds and indicate a potentially specific role of miR-101a-3p in neuronal cells. Importantly, aSyn accumulation in neurons was found to increase miR-101 via the downregulation of the miR-101 sponge lncRNA-T199678, resulting in neuronal injury but downstream gene targets were not studied [42]. miR-101 is also involved in the post-transcriptional deregulation in spinocerebellar ataxia, Huntington’s disease, and Alzheimer’s disease via deregulation of unique pathways in each disorder [43–45]. miR-101 is correlated with neurodegenerative diseases in adult brain, while it plays a physiological role in postnatal brain. In particular, miR-101 regulates the maturation of the GABAergic signaling, limiting spontaneous activity, dendritic growth, and synaptic density increase [46]. Increased levels of miR-101 were also found in the cortex suggesting a physiological role in other regions of postnatal brain [47].
Bioinformatic analysis indicated miR-101a-3p might have a synaptic topology due to the direct link with synaptic processes, fact that was confirmed by the miRNA enrichment in synaptosomes. Previous studies reported miR-101a-3p enrichment in hippocampal synaptosomes at 3-month-old mice and forebrain synaptosomes at 11-month-old mice [32, 48] confirming miR-101a-3p localizes at synapses in different ages and regions pointing its importance in synaptic physiology. miRNAs identified in the pre- and post-synaptic compartment and their role in synaptic physiology is continuously increasing [20, 49, 50]. In Alzheimer’s and prion diseases, miRNAs are implicated in disturbances in synaptic plasticity and dendritic spine morphology [51, 52]. Our data suggest miR-101a-3p alters dendritic morphology in synucleinopathy as well, by targeting and reducing the levels of post-synaptic proteins GABA(A)b2 and SAPAP3. We found mushroom spines are reduced in the mouse midbrain and confirmed this phenotype is mediated exclusively by miR-101a-3p. Dendritic spine loss is typically mediated by presynaptic input alterations or autonomous neuronal function changes [53]. In PD, alterations in dendritic spine number and morphology are attributed to neurotransmission blockage due to aSyn burden [1, 54, 55]. Here we show, dendritic spine alterations are mediated by direct modulation of post-synaptic proteins by miR-101a-3p even with physiological aSyn levels.
A correlation between aSyn and miR-101a-3p levels is provided by in vitro experiments employing wt raSyn. miR-101a-3p is upregulated in primary neurons exposed to oligomeric or monomeric wt raSyn species. miR-101a-3p is upregulated in the midbrain of A30P aSyn mice and is increased DLB human brain tissue. Cortical aSyn pathology, a hallmark of DLB, has been widely documented in the mouse model we used, which expresses the PD-associated A30P aSyn mutation. One caveat of our study is that we compared the alterations in the midbrain region in mice with those in cortical DLB tissue. While our findings suggest consistent alterations, they refer to two distinct brain regions, so this is a limitation that needs to be considered.
The induction of the miRNA by different aSyn species and in different experimental settings provides strong proof that miR-101a-3p can be modulated by both wt and A30P mutant aSyn.
miR-101a-3p is linked with plasticity events in mouse postnatal brain physiology and adult brain disorders [43, 46, 56]. Our proof of principle experiment linked miR-101a-3p with synaptic plasticity in adult brain physiology. Synaptic plasticity is modelled by caging the animals in EE to increase activity and mental input [57, 58]. EE promotes synaptic protein production, brain neurotrophin stimulation and enhance dendritic branching and synaptogenesis [59–61]. We found that miR-101a-3p is reduced in EE, indicating a dynamic role of miR-101a-3p in synaptic plasticity. Accumulating evidence highlight the benefits of EE in neurodegenerative disorders mediated by both transcriptional and translational neuroprotective events [25, 62, 63].
Here, we report a dynamic role of miR-101a-3p in synaptic physiology, decreased in enhanced plasticity conditions and increased due to aSyn pathology. MiR-101a-3p participates in two parallel developmental programs in mice regulating both GABAergic and glutamatergic signaling maturation and thus holds the potential of affecting both excitatory and inhibitory neurotransmission both of which are relevant to aSyn pathology [46, 64]. Electrophysiology experiments assessing the synaptic function by will be needed to further characterize miR-101a-3p effects in neurotransmission in adult and evaluate the miRNA influence in physiology and disease. In addition, further research using anti-miRNA approaches is required to identify the exact mechanism leading to increased miR-101a-3p in synucleinopathies and whether blocking miR-101a-3p could rescue the produced phenotype in dendritic morphology. Synaptic plasticity and neurotransmission are finely-tuned processes not only regulated by miRNAs and anti-miRNA approaches should be cautiously conducted after extensive characterization to preserve synaptic health. Successful targeting of miRNA that mediate synaptic impairments hold the potential of developing therapeutic strategies that improve synaptic plasticity and ameliorate impairments in many neurodegenerative diseases. Finally, as miR-101a-3p is increased in early disease stages, we posit it should be further investigated as a candidate biomarker for early diagnosis and intervention in synucleinopathies.
ACKNOWLEDGMENTS
We thank Dr. Robert Epple for the MFD preparation protocol, Anke Gregus for the Luciferase assay protocol, Benedict Atzler for his help on the qPCRs and immunoblots, and Christiane Fahlbusch for the viral production.
Part of this work was published as a dissertation: Xylaki M., 2022, The role of RNA in synapse physiology and neurodegeneration in models of Parkinson’s disease, PhD thesis, Georg-August-Universität, Göttingen, https://dx.doi.org/10.53846/goediss-9275.
FUNDING
TFO was supported by the Deutsche Forschungsgemeinschaft (DFG, German Research Foundation) under Germany’s Excellence Strategy (EXC 2067/1-390729940) and by SFB1286 (Projects B6 and B8).
CONFLICT OF INTEREST
The authors declare that the research was conducted in the absence of any commercial or financial relationships that could be construed as a potential conflict of interest.
TFO received consulting fees from Bial.
SUPPLEMENTARY MATERIAL
[1] The supplementary material is available in the electronic version of this article: https://dx.doi.org/10.3233/JPD-225055.
REFERENCES
[1] | Nemani VM , Lu W , Berge V , Nakamura K , Onoa B , Lee MK , Chaudhry FA , Nicoll RA , Edwards RH ((2010) ) Increased expression of α-synuclein reduces neurotransmitter release by inhibiting synaptic vesicle reclustering after endocytosis. Neuron 65: , 66–79. |
[2] | Abeliovich A , Schmitz Y , Fariñas I , Choi-Lundberg D , Ho W-H , Castillo PE , Shinsky N , Verdugo JMG , Armanini M , Ryan A , Hynes M , Phillips H , Sulzer D , Rosenthal A ((2000) ) Mice lacking α-synuclein display functional deficits in the nigrostriatal dopamine system. Neuron 25: , 239–252. |
[3] | Spillantini MG , Goedert M ((2006) ) The α-synucleinopathies: Parkinson’s disease, dementia with Lewy bodies, and multiple system atrophy. Ann N Y Acad Sci 920: , 16–27. |
[4] | Spillantini MG , Schmidt ML , Lee VM-Y , Trojanowski JQ , Jakes R , Goedert M ((1997) ) α-Synuclein in Lewy bodies. Nature 388: , 839–840. |
[5] | Spillantini MG ((1999) ) Parkinson’s disease, dementia with Lewy bodies and multiple system atrophy are alpha-synucleinopathies. Parkinsonism Relat Disord 5: , 157–62. |
[6] | Dauer W , Przedborski S ((2003) ) Parkinson’s disease: Mechanisms and models. Neuron 39: , 889–909. |
[7] | Mayo MC , Bordelon Y ((2014) ) Dementia with Lewy bodies. Semin Neurol 34: , 182–188. |
[8] | Iwai A , Masliah E , Yoshimoto M , Ge N , Flanagan L , de Silva Rohan HA , Kittel A , Saitoh T ((1995) ) The precursor protein of non-Aβ component of Alzheimer’s disease amyloid is a presynaptic protein of the central nervous system. Neuron 14: , 467–475. |
[9] | Marui W , Iseki E , Nakai T , Miura S , Kato M , Uéda K , Kosaka K ((2002) ) Progression and staging of Lewy pathology in brains from patients with dementia with Lewy bodies. J Neurol Sci 195: , 153–159. |
[10] | Kramer ML , Schulz-Schaeffer WJ ((2007) ) Presynaptic alpha-synuclein aggregates, not Lewy bodies, cause neurodegeneration in dementia with Lewy bodies. J Neurosci 27: , 1405–1410. |
[11] | Szegő ÉM , Dominguez-Meijide A , Gerhardt E , König A , Koss DJ , Li W , Pinho R , Fahlbusch C , Johnson M , Santos P , Villar-Piqué A , Thom T , Rizzoli S , Schmitz M , Li J , Zerr I , Attems J , Jahn O , Outeiro TF ((2019) ) Cytosolic trapping of a mitochondrial heat shock protein is an early pathological event in synucleinopathies. Cell Rep 28: , 65–77. |
[12] | Mahul-Mellier AL , Burtscher J , Maharjan N , Weerens L , Croisier M , Kuttler F , Leleu M , Knott GW , Lashuel HA ((2020) ) The process of Lewy body formation, rather than simply α-synuclein fibrillization, is one of the major drivers of neurodegeneration. Proc Natl Acad Sci U S A 117: , 4971–4982. |
[13] | Wu , Takano H , Riddle DM , Trojanowski JQ , Coulter DA , Lee VM-Y ((2019) ) α-Synuclein (αSyn) preformed fibrils induce endogenous αSyn aggregation, compromise synaptic activity and enhance synapse loss in cultured excitatory hippocampal neurons. J Neurosci 39: , 5080–5094. |
[14] | Schirinzi T , Madeo G , Martella G , Maltese M , Picconi B , Calabresi P , Pisani A ((2016) ) Early synaptic dysfunction in Parkinson’s disease: Insights from animal models. Mov Disord 31: , 802–813. |
[15] | Pavlou MAS , Pinho R , Paiva I , Outeiro TF ((2017) ) The yin and yang of α-synuclein-associated epigenetics in Parkinson’s disease. Brain 140: , 878–886. |
[16] | Wassouf Z , Schulze-Hentrich JM ((2019) ) Alpha-synuclein at the nexus of genes and environment: The impact of environmental enrichment and stress on brain health and disease. J Neurochem 150: , 591–604. |
[17] | Sutton MA , Schuman EM ((2006) ) Dendritic protein synthesis, synaptic plasticity, and memory. Cell 127: , 49–58. |
[18] | Lugli G , Larson J , Demars MP , Smalheiser NR ((2012) ) Primary microRNA precursor transcripts are localized at post-synaptic densities in adult mouse forebrain. J Neurochem 123: , 459–466. |
[19] | Fiore R , Khudayberdiev S , Saba R , Schratt G ((2011) ) MicroRNA function in the nervous system. Prog Mol Biol Transl Sci 102: , 47–100. |
[20] | Lugli G , Torvik VI , Larson J , Smalheiser NR ((2008) ) Expression of microRNAs and their precursors in synaptic fractions of adult mouse forebrain. J Neurochem 106: , 650–661. |
[21] | Singh A , Sen D ((2017) ) MicroRNAs in Parkinson’s disease. Exp Brain Res 235: , 2359–2374. |
[22] | Recasens A , Perier C , Sue CM ((2016) ) Role of microRNAs in the regulation of α-synuclein expression: A systematic review. Front Mol Neurosci 9: , 128. |
[23] | Majidinia M , Mihanfar A , Rahbarghazi R , Nourazarian A , Bagca BG , Avci ÇB ((2016) ) The roles of non-coding RNAs in Parkinson’s disease. Mol Biol Rep 43: , 1193–1204. |
[24] | Kahle PJ , Neumann M , Ozmen L , Müller V , Jacobsen H , Schindzielorz A , Okochi M , Leimer U , Van Der Putten H , Probst A , Kremmer E , Kretzschmar HA , Haass C ((2000) ) Subcellular localization of wild-type and Parkinson’s disease-associated mutant α-synuclein in human and transgenic mouse brain. J Neurosci 20: , 6365–6373. |
[25] | Wassouf Z , Hentrich T , Samer S , Rotermund C , Kahle PJ , Ehrlich I , Riess O , Casadei N , Schulze-Hentrich JM ((2018) ) Environmental enrichment prevents transcriptional disturbances induced by alpha-synuclein overexpression. Front Cell Neurosci 12: , 112. |
[26] | Vasili E , Dominguez-Meijide A , Flores-León M , Al-Azzani M , Kanellidi A , Melki R , Stefanis L , Outeiro TF ((2022) ) Endogenous levels of alpha-synuclein modulate seeding and aggregation in cultured cells. Mol Neurobiol 59: , 1273–1284. |
[27] | Follenzi A , Naldini L ((2002) ) [26] Generation of HIV-1 derived lentiviral vectors. Methods Enzymol 346: , 454–465. |
[28] | Hsu JB , Chiu CM , Hsu S da , Huang WY , Chien CH , Lee TY , Huang H da ((2011) ) MiRTar: An integrated system for identifying miRNA-target interactions in human. BMC Bioinformatics 12: , 300 |
[29] | Griffiths-Jones S , Grocock RJ , van Dongen S , Bateman A , Enright AJ ((2006) ) miRBase: MicroRNA sequences, targets and gene nomenclature. Nucleic Acids Res 34: , D140–D144. |
[30] | Livak KJ , Schmittgen TD ((2001) ) Analysis of relative gene expression data using real-time quantitative PCR and the 2-ΔΔCT method. Methods 25: , 402–408. |
[31] | Schindelin J , Arganda-Carreras I , Frise E , Kaynig V , Longair M , Pietzsch T , Preibisch S , Rueden C , Saalfeld S , Schmid B , Tinevez JY , White DJ , Hartenstein V , Eliceiri K , Tomancak P , Cardona A ((2012) ) Fiji: An open-source platform for biological-image analysis. Nat Methods 9: , 676–682. |
[32] | Epple R , Krüger D , Berulava T , Brehm G , Ninov M , Islam R , Köster S , Fischer A ((2021) ) The coding and small non-coding hippocampal synaptic RNAome. Mol Neurobiol 58: , 2940–2953. |
[33] | Freichel C , Neumann M , Ballard T , Müller V , Woolley M , Ozmen L , Borroni E , Kretzschmar HA , Haass C , Spooren W , Kahle PJ ((2007) ) Age-dependent cognitive decline and amygdala pathology in α-synuclein transgenic mice. Neurobiol Aging 28: , 1421–1435. |
[34] | Kahle PJ , Neumann M , Ozmen L , Müller V , Odoy S , Okamoto N , Jacobsen H , Iwatsubo T , Trojanowski JQ , Takahashi H , Wakabayashi K , Bogdanovic N , Riederer P , Kretzschmar HA , Haass C ((2001) ) Selective insolubility of α-synuclein in human Lewy body diseases is recapitulated in a transgenic mouse model. Am J Pathol 159: , 2215–2225. |
[35] | Paiva I , Jain G , Lázaro DF , Jerčić KG , Hentrich T , Kerimoglu C , Pinho R , Szegő ÈM , Burkhardt S , Capece V , Halder R , Islam R , Xylaki M , Caldi Gomes LA , Roser AE , Lingor P , Schulze-Hentrich JM , Borovečki F , Fischer A , Outeiro TF ((2018) ) Alpha-synuclein deregulates the expression of COL4A2 and impairs ER-Golgi function. Neurobiol Dis 119: , 121–135. |
[36] | Rocha EM , De Miranda B , Sanders LH ((2018) )Alpha-synuclein: Pathology, mitochondrial dysfunction and neuroinflammation in Parkinson’s disease. Neurobiol Dis 109: , 249–257. |
[37] | Navarro-Sánchez L , Águeda-Gómez B , Aparicio S , Pérez-Tur J ((2018) ) Epigenetic study in Parkinson’s disease: A pilot analysis of DNA methylation in candidate genes in brain. Cells 7: , 150–159. |
[38] | Ghiglieri V , Calabrese V , Calabresi P ((2018) ) Alpha-synuclein: From early synatic dysfunction to neurodegeneration. Front Neurol 9: , 295. |
[39] | Urbizu A , Beyer K ((2020) ) Epigenetics in lewy body diseases: Impact on gene expression, utility as a biomarker, and possibilities for therapy. Int J Mol Sci 21: , 4718 |
[40] | Ekmark-Lewén S , Lindström V , Gumucio A , Ihse E , Behere A , Kahle PJ , Nordström E , Eriksson M , Erlandsson A , Bergström J , Ingelsson M ((2018) ) Early fine motor impairment and behavioral dysfunction in (Thy-1)-h[A30P] alpha-synuclein mice. Brain Behav 8: , e00915. |
[41] | Valera E , Spencer B , Mott J , Trejo M , Adame A , Mante M , Rockenstein E , Troncoso JC , Beach TG , Masliah E , Desplats P ((2017) ) MicroRNA-101 modulates autophagy and oligodendroglial alpha-synuclein accumulation in multiple system atrophy. Front Mol Neurosci 10: , 329. |
[42] | Bu L-L , Xie Y-Y , Lin D-Y , Chen Y , Jing X-N , Liang Y-R , Peng S-D , Huang K-X , Tao E-X ((2020) ) LncRNA-T199678 mitigates α-synuclein-induced dopaminergic neuron injury via miR-101-3p. Front Aging Neurosci 12: , 599246. |
[43] | Lee Y , Samaco RC , Gatchel JR , Thaller C , Orr HT , Zoghbi HY ((2008) ) miR-19, miR-101 and miR-130 co-regulate ATXN1 levels to potentially modulate SCA1 pathogenesis. Nat Neurosci 11: , 1137–1139. |
[44] | Mizuno H , Taketomi A ((2018) ) MicroRNA-101 inhibits the expression of Rhes, a striatal-enriched small G-protein, at the post-transcriptional level. BMC Res Notes 11: , 528–532. |
[45] | Long JM , Lahiri DK ((2011) ) MicroRNA-101 downregulates Alzheimer’s amyloid-β precursor protein levels in human cell cultures and is differentially expressed. Biochem Biophys Res Commun 404: , 889–895. |
[46] | Lippi G , Fernandes CC , Ewell LA , John D , Romoli B , Curia G , Taylor SR , Frady EP , Jensen AB , Liu JC , Chaabane MM , Belal C , Nathanson JL , Zoli M , Leutgeb JK , Biagini G , Yeo GW , Berg DK ((2016) ) MicroRNA-101 regulates multiple developmental programs to constrain excitation in adult neural networks. Neuron 92: , 1337–1351. |
[47] | Chi SW , Zang JB , Mele A , Darnell RB ((2009) ) Argonaute HITS-CLIP decodes microRNA-mRNA interaction maps. Nature 460: , 479–486. |
[48] | Zongaro S , Hukema R , D’Antoni S , Davidovic L , Barbry P , Catania MV , Willemsen R , Mari B , Bardoni B ((2013) ) The 3’ UTR of FMR1 mRNA is a target of miR-101, miR-129-5p and miR-221: Implications for the molecular pathology of FXTAS at the synapse. Hum Mol Genet 22: , 1971–1982. |
[49] | Cohen JE , Lee PR , Chen S , Li W , Fields RD ((2011) ) MicroRNA regulation of homeostatic synaptic plasticity. Proc Natl Acad Sci U S A 108: , 11650–11655. |
[50] | Lugli G , Larson J , Martone ME , Jones Y , Smalheiser NR ((2005) ) Dicer and eIF2c are enriched at postsynaptic densities in adult mouse brain and are modified by neuronal activity in a calpain-dependent manner. J Neurochem 94: , 896–905. |
[51] | Boese AS , Saba R , Campbell K , Majer A , Medina S , Burton L , Booth TF , Chong P , Westmacott G , Dutta SM , Saba JA , Booth SA ((2016) ) MicroRNA abundance is altered in synaptoneurosomes during prion disease. Mol Cell Neurosci 71: , 13–24. |
[52] | Reza-Zaldivar EE , Hernández-Sápiens MA , Minjarez B , Gómez-Pinedo U , Sánchez-González VJ , Márquez-Aguirre AL , Canales-Aguirre AA ((2020) ) Dendritic spine and synaptic plasticity in Alzheimer’s disease: A focus on microRNA. Front Cell Dev Biol 8: , 255. |
[53] | Herms J , Dorostkar MM ((2016) ) Dendritic spine pathology in neurodegenerative diseases. Annu Rev Pathol 11: , 221–250. |
[54] | Diogenes MJ , Dias RB , Rombo DM , Vicente Miranda H , Maiolino F , Guerreiro P , Nasstrom T , Franquelim HG , Oliveira LMA , Castanho MARB , Lannfelt L , Bergstrom J , Ingelsson M , Quintas A , Sebastiao AM , Lopes LV , Outeiro TF ((2012) ) Extracellular alpha-synuclein oligomers modulate synaptic transmission and impair LTP via NMDA-receptor activation. J Neurosci 32: , 11750–11762. |
[55] | Pozo K , Goda Y ((2010) ) Unraveling mechanisms of homeostatic synaptic plasticity. Neuron 66: , 337–351. |
[56] | Vilardo E , Barbato C , Ciotti MT , Cogoni C , Ruberti F ((2010) ) MicroRNA-101 regulates amyloid precursor protein expression in hippocampal neurons. J Biol Chem 285: , 18344–18351. |
[57] | Wang C-J , Wu Y , Zhang Q , Yu K-W , Wang Y-Y ((2019) ) An enriched environment promotes synaptic plasticity and cognitive recovery after permanent middle cerebral artery occlusion in mice. Neural Regen Res 14: , 462–469. |
[58] | Bayat M , Sharifi MD , Haghani M , Shabani M ((2015) ) Enriched environment improves synaptic plasticity and cognitive deficiency in chronic cerebral hypoperfused rats. Brain Res Bull 119: , 34–40. |
[59] | Nithianantharajah J , Hannan AJ ((2006) ) Enriched environments, experience-dependent plasticity and disorders of the nervous system. Nat Rev Neurosci 7: , 697–709. |
[60] | Frick KM , Fernandez SM ((2003) ) Enrichment enhances spatial memory and increases synaptophysin levels in aged female mice. Neurobiol Aging 24: , 615–626. |
[61] | van Praag H , Kempermann G , Gage FH ((2000) ) Neural consequences of environmental enrichment. Nat Rev Neurosci 1: , 191–198. |
[62] | Li L , Bor LT ((2005) ) Environmental enrichment and neurodegenerative diseases. Biochem Biophys Res Commun 334: , 293–297. |
[63] | Laviola G , Hannan AJ , Macrì S , Solinas M , Jaber M ((2008) ) Effects of enriched environment on animal models of neurodegenerative diseases and psychiatric disorders. Neurobiol Dis 31: , 159–168. |
[64] | Villalba RM , Mathai A , Smith Y ((2015) ) Morphological changes of glutamatergic synapses in animal models of Parkinson’s disease. Front Neuroanat 9: , 117. |


