
Distinct Patterns of Gene Expression Changes in the Colon and Striatum of Young Mice Overexpressing Alpha-Synuclein Support Parkinson’s Disease as a Multi-System Process
Abstract
Background:
Evidence supports a role for the gut-brain axis in Parkinson’s disease (PD). Mice overexpressing human wild type α– synuclein (Thy1-haSyn) exhibit slow colonic transit prior to motor deficits, mirroring prodromal constipation in PD. Identifying molecular changes in the gut could provide both biomarkers for early diagnosis and gut-targeted therapies to prevent progression.
Objective:
To identify early molecular changes in the gut-brain axis in Thy1-haSyn mice through gene expression profiling.
Methods:
Gene expression profiling was performed on gut (colon) and brain (striatal) tissue from Thy1-haSyn and wild-type (WT) mice aged 1 and 3 months using 3′ RNA sequencing. Analysis included differential expression, gene set enrichment and weighted gene co-expression network analysis (WGCNA).
Results:
At one month, differential expression (Thy1-haSyn vs. WT) of mitochondrial genes and pathways related to PD was discordant between gut and brain, with negative enrichment in brain (enriched in WT) but positive enrichment in gut. Linear regression of WGCNA modules showed partial independence of gut and brain gene expression changes. Thy1-haSyn-associated WGCNA modules in the gut were enriched for PD risk genes and PD-relevant pathways including inflammation, autophagy, and oxidative stress. Changes in gene expression were modest at 3 months.
Conclusions:
Overexpression of haSyn acutely disrupts gene expression in the colon. While changes in colon gene expression are highly related to known PD-relevant mechanisms, they are distinct from brain changes, and in some cases, opposite in direction. These findings are in line with the emerging view of PD as a multi-system disease.
INTRODUCTION
Parkinson’s disease (PD) is a significant source of disability and morbidity among the aging population. Current therapeutic approaches largely treat motor symptoms. By the time motor symptoms occur, 50% of dopaminergic neurons have been lost [1]. Studies in rodent models support Braak’s hypothesis that PD may begin in the gastrointestinal (GI) tract [2–4]. Human studies also strongly indicate involvement of the GI tract in patients with PD, including a high prevalence of GI symptoms, prodromal constipation, and the presence of Lewy type synucleinopathy in the colon of these patients [5]. Improved understanding of early changes in the gut in PD may lead to identification of gut-biomarkers for early diagnosis as well as gut-directed therapies targeting the premotor phase.
Mice overexpressing human wild-type α−synuclein (haSyn) under the neuron-specific Thy1 promoter (Thy1-haSyn) are a well-established model of PD [6]. In this model, haSyn expression begins at about 1 month. At three months there is microglial activation in the striatum, which is the earliest brain region affected in this manner [7]. A gastrointestinal phenotype, characterized by prolonged distal colonic transit, is evident at three to five months [8, 9].
To identify pathways that are dysregulated in early disease, we performed gene expression profiling by RNA sequencing of the gut and the brain from young (1 and 3 months) Thy1-haSyn and wild type (WT) mice. We chose to study regions that are affected early in this model— the striatum and the distal colon. Our analysis of these data used a quantitative genome-wide approach, including gene set enrichment analysis (GSEA) [10, 11] and weighted gene coexpression network analysis (WGCNA) [12]. Our findings demonstrate that ubiquitous neuronal overexpression of haSyn elicits robust changes in gut gene expression. These changes are thematically related to PD; however, they are distinct from concurrent changes in the brain. We present functional annotation of gene networks involved in this response and discuss gut alterations induced by alpha-synuclein overexpression in the context of PD pathology. We anticipate that these data, together with user-friendly networks accessible on the Network Data Exchange [13], will be a valuable resource in identifying novel therapeutic targets along gut-brain axis for PD.
METHODS
PD mouse model
Thy1-haSyn and WT mice were generated by breeding female BDF1 background mice heterozygotic for the Thy1-aSyn transgene on the X-chromosome (developed by E. Masliah, UCSD) with wild-type male BDF1 mice (Charles River, Hollister, CA) [6, 14]. In this model, haSyn expression begins at about 1 month. At three months, there is microglial activation in the striatum, which is the earliest brain region affected in this manner [7]. In addition, prolonged distal colonic transit is evident at three months [8, 9]. Thy1-haSyn mice show a progressive phenotype, with motor deficits characteristic of PD occurring around 14 months [6]. In order to identify early changes, mice at one and three months of age were used in this study. Male mice are used because the transgene is located on the X chromosome, and female mice exhibit a variable phenotype likely due to random X inactivation [15]. The genotype of all mice was determined at 21 days and verified at the end of the study with polymerase chain reaction (PCR) amplification analysis of tail DNA. Animal care was conducted in accordance with the United States Public Health Service Guide for the Care and Use of Laboratory Animals, and procedures were approved by the Institutional Animal Care and Use Committee at the University of California Los Angeles (UCLA).
RNA sequencing
Mice were deeply anesthetized with sodium pentobarbital [100 mg/kg, intraperitoneal] and transcardially perfused with 0.1 M phosphate buffered saline (PBS; 137 mM NaCl, 2.7 mM KCl, 4.3 mM Na2HPO4, 1.47 mM KH2P04, pH 7.4). Brain and colon were both quickly removed and simultaneously dissected by team-members experienced in tissue preparation of gut or brain. A 5 mm segment of distal colon (distal extent 5 mm from anus) was stored in RNAlater (Invitrogen, Carlsbad, CA) or frozen directly on powdered dry ice. Coronal blocks of the striatum were micro-dissected using an acrylic mouse brain slicer matrix with 1.0 mm coronal intervals (Mouse Brain Matrix, AL-1175; Roboz Surgical Instrument Co., USA) and frozen on powdered dry ice. All samples were stored at – 80°C. Distal colon and striatum were homogenized in QIAzol and an RNeasy Plus kit was used to purify the RNA (Qiagen). A Quant-iTtrademark RiboGreentrademark RNA Assay Kit (Fisher Scientific) was used to determine the quantity of RNA. For sequencing, samples were normalized to a concentration of 25 ng/μL. RNA quality (RNA integrity number > 9 for all samples) was confirmed by Agilent TapeStation capillary electrophoresis. RNA sequencing (RNA-seq) was performed in the UCLA Neuroscience Genomics Core Laboratory. A QuantSeq 3′ FWD cDNA library synthesis kit (Lexogen, Vienna, Austria) was used to reverse transcribe the RNA [16]. Multiplex DNA sequencing was performed using an Illumina HiSeq 4000 instrument with single-strand 65nt sequence reads following standard manufacturer protocols. Samples yielded > 3 million reads. Mean (standard deviation) unique read rates were 72.0% (4.24%) in the colon and 30.5% (4.78%) for striatum [17].
A limitation of 3’ single-end sequencing in mouse brain is the high abundance of non-coding brain cytoplasmic RNA (BC1) [17], which is polyadenylated and resulted in a large number of multi-mapping reads (mean, sd: 65.8%, 4.3%) in the striatum. Following correction for sequencing artifacts (described below), the number of multi-mapping reads did not correlate with the top five principal components for gene expression (Supplementary Figure 1 in Supplementary File 1). Genes (n = 25) containing BC1 in the 3’ region are shown in Supplementary Table 1 (in Supplementary File 1).
Generation of normalized counts and removal of sequencing artifacts
BBDuk was used to trim adapter and polyA sequences, as well as low quality nucleotides from de-multiplexed raw reads (FASTQs) [18]. STAR RNA-seq aligner (v2.7.0e) [19] was used to align trimmed reads against the mouse genome (GRCh38, GENCODE release MM22) and generate gene level counts. Initial processing included retention of genes with counts of at least 5 in 30% of samples and removal of sample outliers using standardized sample network connectivity (Z < 2) [20]. Count data were prepared for linear modeling with the getVarianceStabilizedData function in the DESeq2 package for R [21]. The Picard Tools suite was used to generate sequence-level metrics for quality control [22], which were combined with count information from the alignment and summarized by principal component analysis (Supplementary Table 2 in Supplementary File 1). The sequencing artifacts that affected the top four principal components of normalized expression were removed by linear regression as described previously [23] (Supplementary Table 3 in Supplementary File 1). For differential expression analysis, normalization and removal of sequencing artifacts was performed for each tissue and time point (colon at 1 and 3 months, striatum at 1 and 3 months) to improve detection of genotype-related differences. However, for gene set enrichment analysis (GSEA) and weighted gene coexpression analysis (WGCNA), the time points were analyzed together in each tissue to increase sample size.
Differential expression analysis
The Linear Models for Microarray Analysis (limma) package in R v3.6.1 was used to determine differential gene expression [24, 25]. A two-sided adjusted-p value threshold (Benjamini-Hochberg) of 0.05 determined statistical significance. Expression of the haSyn transgene was measured with an nCounter (NanoString Technologies, Seattle, WA) probe targeting the human alpha synuclein transgene. A set of six genes was validated with qPCR using SYBR green signal detected on a CFX384 (Bio-Rad Laboratories, Hercules, CA) in 15 Thy1-haSyn and 12 WT at 1 month. Primers and SNCA probe sequences are shown in Supplementary Table 4 (in Supplementary File 1). Stratified rank-rank hypergeometric overlap to identify concordant and discordant overlap in differential expression was performed using the hypergeometric method in the RRHO2 package in R [26]. Genes were ranked by p-value and effect size/direction (-log10(p value)*sign(effect)).
Gene set enrichment analysis (GSEA)
GSEA was performed with processed expression data as the input against the KEGG, GO and hallmark gene sets obtained from Molecular Signatures Database (v7.0) using default parameters in GSEA v4.0 [10, 11, 27, 28]. The GSEA-recommended FDR-q value cutoff of 0.25 was used to determine statistical significance. To compare enrichment across tissue, expression values from colon and striatum (the same values used for WGCNA) were scaled and combined into one matrix, which was used as the input for the analysis. Enrichment results were visualized using the Enrichment map add-on for Cytoscape v3.8 [29, 30].
Weighted gene co-expression network analysis (WGCNA)
Network construction. WGCNA was performed in R [12]. Genes on the X chromosome, which contains the transgene, were excluded. For colon samples, a signed network was constructed based on biweight midcorrelations with a soft power threshold of eight. The percent of outliers for biweight midcorrelations was restricted to 5%. Module detection used a cut height of 0.995, a minimum module size of 60, and a deep split level of 1. Highly correlated modules (>0.75) were merged. Analysis for striatum used the same parameters except for a soft threshold power of 12 and restriction of outliers for biweight midcorrelations to 1%.
Module annotation and association with traits. Overrepresented gene ontology (GO) terms were determined using the hypergeometric function in the GOstats package in R [31]. Visualization was performed using Cytoscape v3.8 and the Clue GO add-on for Cytoscape [30, 32]. Edge weights were derived from the adjacency matrix used for WGCNA. Enrichment for gene signatures from single cell sequencing data was determined using the hypergeometric test. Cell type signatures were obtained from the Panglao and CellMarker databases [33, 34]. Analysis was performed both with database entries from only tissue relevant sources (“GI tract,” “Brain”) as well as with other relevant contexts such as immune cells and mesentery. Risk variant annotations were obtained from the EMBL-EBI GWAS catalog. For cell type and risk variant enrichment, a module membership (MM, correlation with module eigengene) threshold of 0.2 was used for inclusion in the module. For GO enrichment, an MM threshold of 0.6 was used initially. To improve annotation of small and large modules, analysis was also performed on all module genes and with thresholds of 0.7 and 0.8. Association of MEs with traits was evaluated initially by Pearson correlation. Univariate and multivariate associations between module eigengenes and genotype were determined with linear regression [35]. For age-associated modules, age and the age*module interaction effect were also included. Thy1-haSyn-associated modules in univariate analysis (unadjusted p < 0.05) were included in multivariate models. Co-linearity was assessed prior to multivariate regression. Backwards stepwise regression was used to determine the strongest prediction model based on Akaike information criterion (AIC). Due to the large differences in one and three months in the colon and significant genotype*age interaction effects, regression was also performed separately by time point in the colon. Regression models including both colon and striatum modules were determined in the subset of sample with RNA-seq data from both tissues [n = 10 Thy1-haSyn (4 1 m, 6 3 m), n = 6 WT (3 1 m, 3 3 m)].
Respirometry in freshly isolated colonic crypts
Isolation of crypts. Mice were euthanized with isoflurane followed by cervical dislocation. Colons were removed and everted, and crypts were dissociated by incubating in prewarmed 20 mM EDTA (Life Technologies, Carlsbad, CA) in Hanks Balanced Salt Solution without calcium and magnesium (Corning, Corning, NY) at 37°C in a water bath for 30 min. Colons were then transferred to a conical tube containing 30 ml cold HBSS and vortexed with eight 5-s pulses. Fetal Bovine Serum (Sigma F4135, St Louis, MO) was added to a final concentration of 10% and the solution was centrifuged at 125 g for 3 min. Crypts were washed in Seahorse ADF medium consisting of Advanced DMEM/F12 (Corning, Corning, NY) with 2 mM Glutamax (Gibco, Billings, MT) and 1% penicillin-streptomycin (GenClone, San Diego, CA) and then resuspended in Seahorse Assay Medium composed of unbuffered DMEM (Sigma, D5030) supplemented with 2 mM Glutamax, 1 mM sodium pyruvate, 5 mM HEPES, and 15 mM glucose.
Respirometry. Oxygen consumption rates (OCR) of freshly isolated colonic crypts were measured as previously described with minor modifications [36]. Crypts were seeded in 5-6 replicate wells at a density of 150 crypts per well in prewarmed Seahorse XF96 culture plates (Agilent Technologies, Santa Clara, CA), which had been incubated with Matrigel (Corning) diluted 1 : 10 in Seahorse ADF medium for 1 h at room temperature and then overnight at 4°C. The plate was centrifuged for 3 min at 125 g to bring the crypts to the base of the wells. Prior to respirometry measurements, plates were incubated for 30–45 min at 37°C (without CO2). OCR and extracellular acidification rate (ECAR) were measured in a Seahorse XF96 analyzer. The following compounds were used for injections during the assay: 4μM oligomycin A (Calbiochem, San Diego, CA), 1.8μM Carbonyl cyanide 4-(trifluoromethoxy)phenylhydrazone (FCCP; Sigma, C2920), 4μM antimycin A (Sigma, A8674), 4μM rotenone (R8875). After the assay, crypts were fixed with 4% paraformaldehyde (Thermo Fisher Scientific, Waltham, MA). Manual counts of the number of crypts per well were used for data normalization.
Data analysis. We first excluded wells (one of five replicates for three samples) that did not show the appropriate response to the injections (e.g., where the following was not true for OCR measurements: OCR after FCCP > basal OCR > OCR after oligomycin > OCR after Antimycin A/Rotenone). Calculations used standard protocols and are shown in a schematic in Supplementary Figure 2 (in Supplementary File 1) [37]. The number of wells per sample is shown in Supplementary Table 5 (in Supplementary File 1). One well was excluded prior to normalization because it was an outlier among replicate wells (>1.5 times the interquartile range above the third or below the first quartile). Two samples contained a well for which the crypt count for normalization was an outlier. As crypt count was strongly associated with maximal OCR strongly (F = 84.2, p < 2×10–16, estimate for OCR 0.83, p = 9×10–11), we imputed crypt count for two wells where crypt counts were outliers. Following normalization, an additional four outlier wells were removed.
Statistical analysis
Except where noted, samples sizes are those shown in Table 1, group differences were determined with t-tests, and two-sided p-values were used to determine statistical significance. All measurements shown are from distinct samples. Where shown, adjusted p values were determined with the Benjamini-Hochberg method unless otherwise noted. For respirometry, linear regression was used to determine the effect of genotype, age and the genotype*age interaction on calculated measures (e.g., basal respiration). Time series data was analyzed with general additive models using the ‘mgcv’ package in R.[38, 39] The significance of the time*genotype interaction effect was determined by a likelihood ratio test comparing the model fit with and without this term.
Table 1
Greater differential gene expression between Thy1-haSyn and WT at 1 versus 3 months in both gut (colon) and brain (striatum) (FDR < 0.05)
| Time | Tissue | n | DEGs | ||
| Thy1-haSyn | WT | Up | down | ||
| 1 month | Colon | 9 | 7 | 367 | 336 |
| Striatum | 4 | 5 | 444 | 412 | |
| 3 months | Colon | 9 | 7 | 137 | 143 |
| Striatum | 6 | 4 | 186 | 226 | |
DEG, differentially expressed gene; Thy1-haSyn, alpha-synuclein overexpressing; WT, wild type.
RESULTS
Differential gene expression in Thy1-haSyn vs. WT is prominent at one month of age
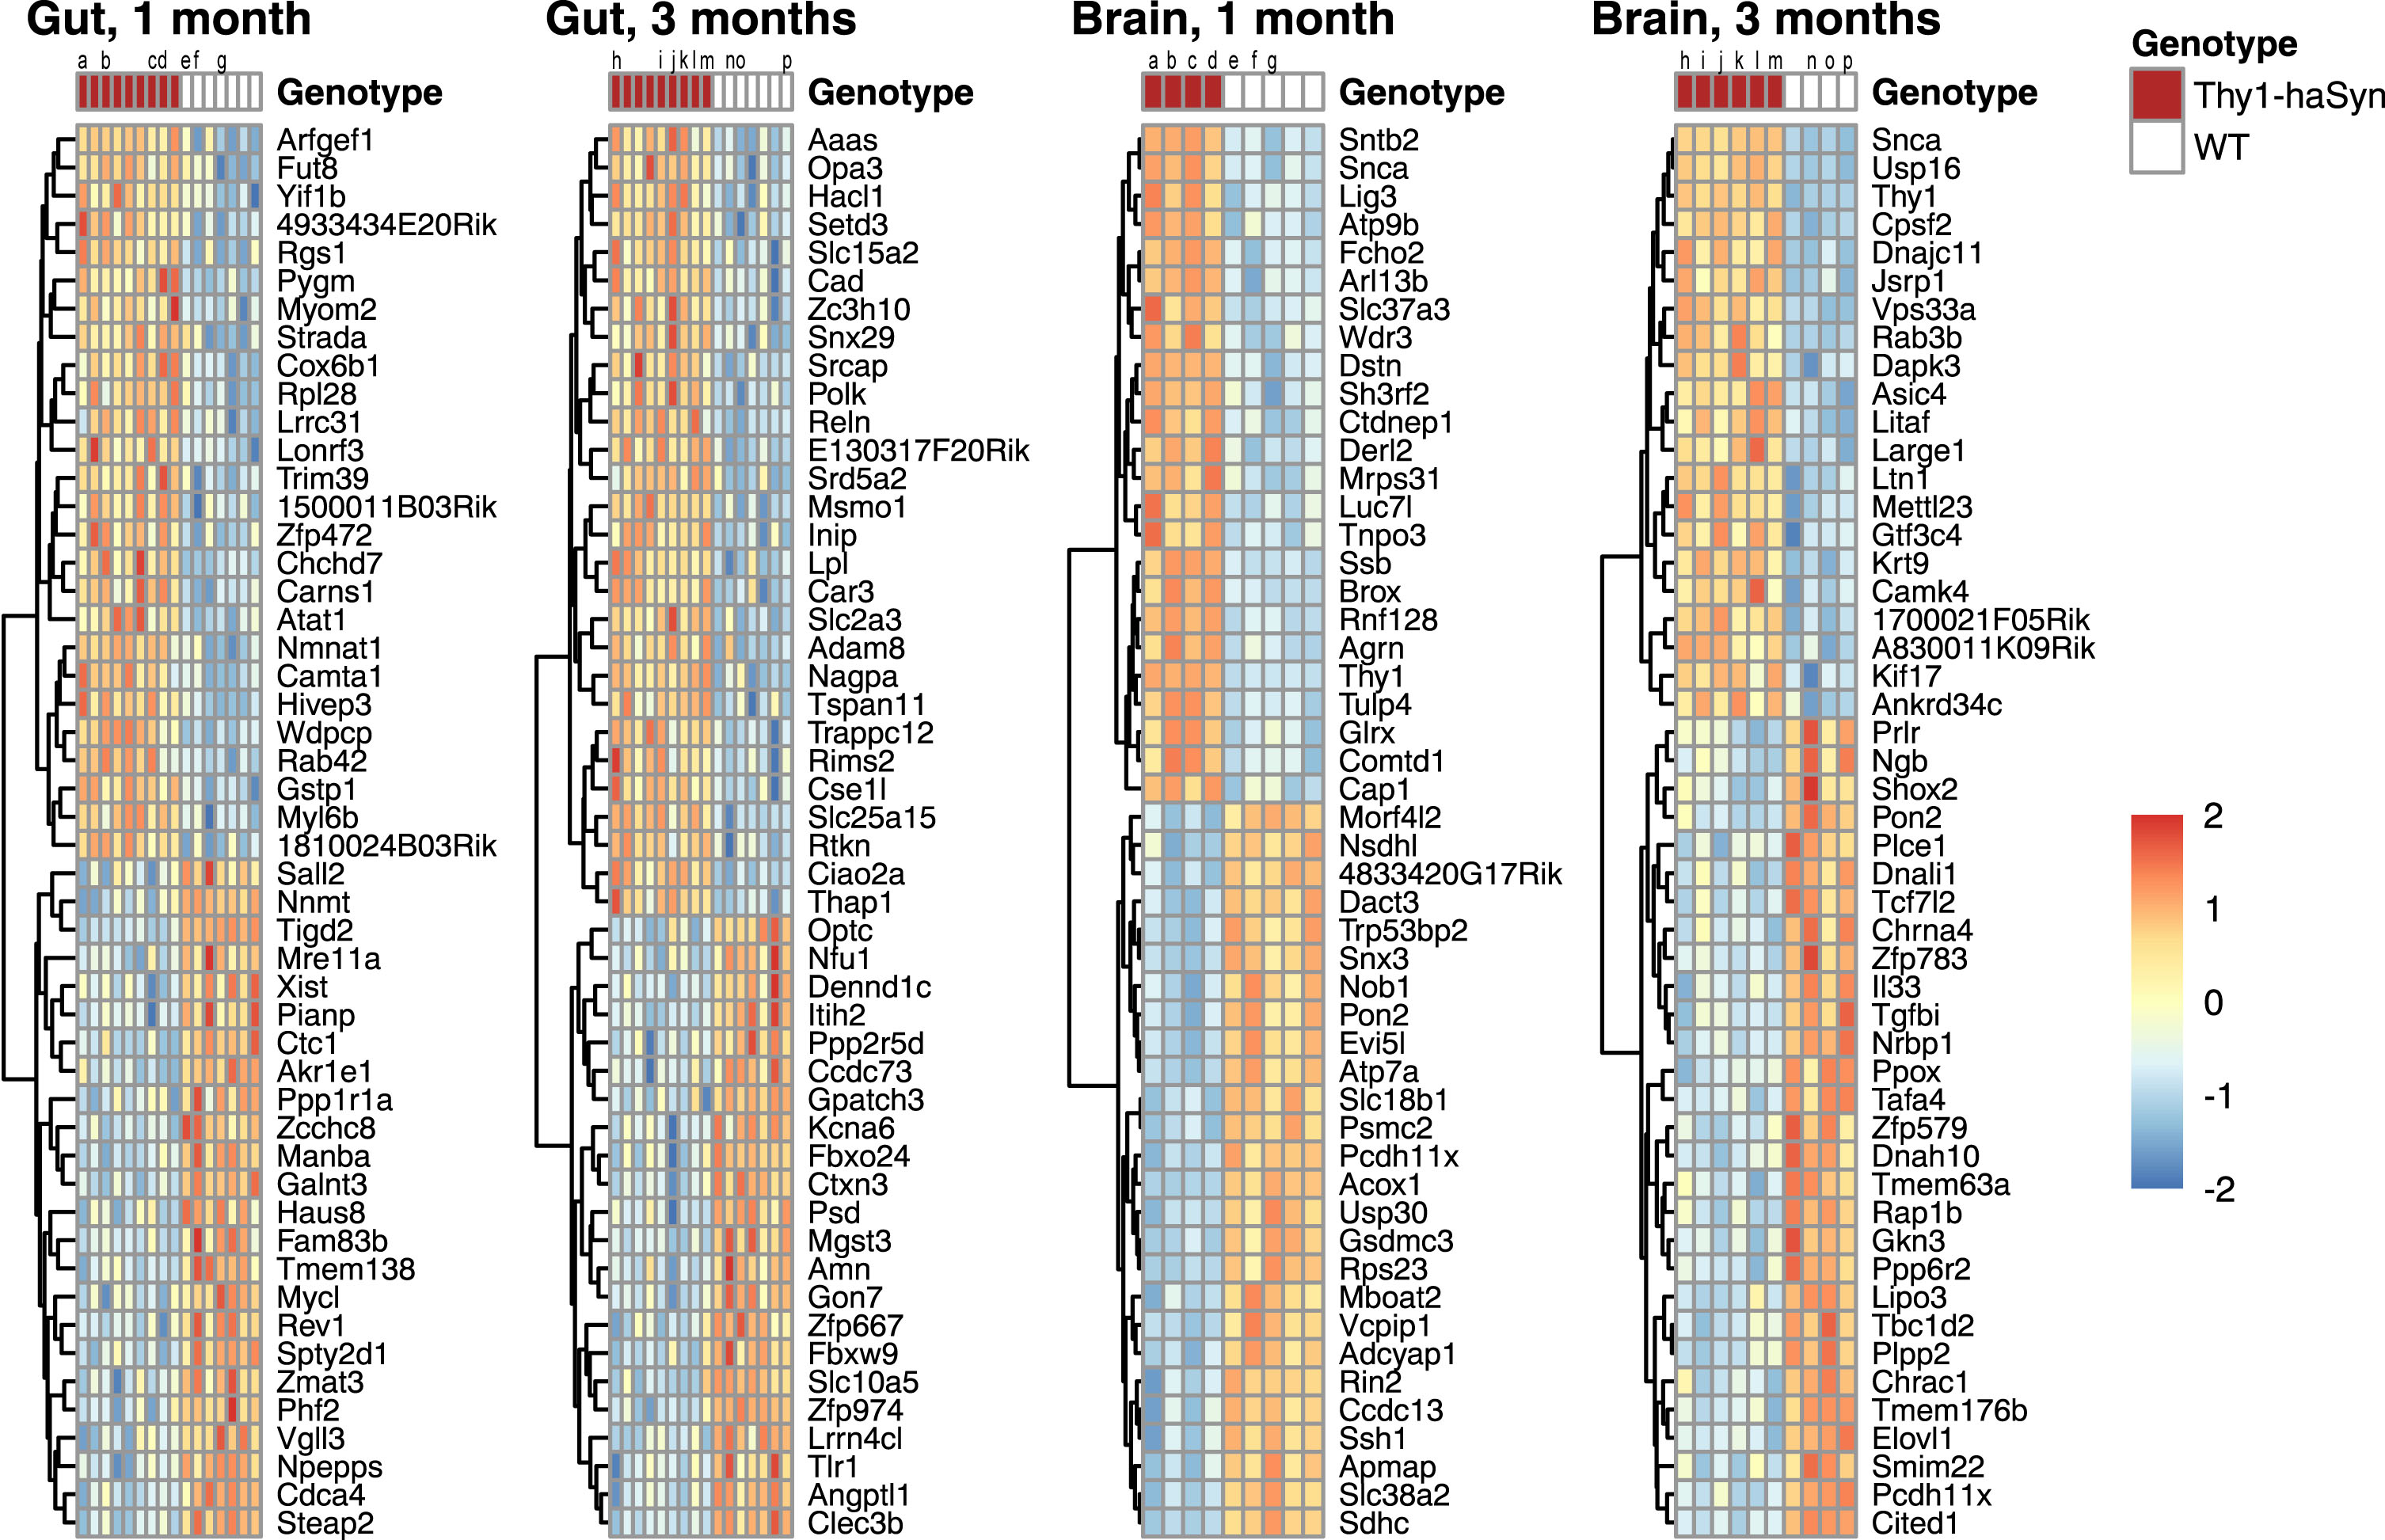
To identify early changes in gene expression, we performed RNA sequencing of the gut and the brain at one month of age, corresponding to the onset of haSyn expression, and at three months of age. At three months of age, Thy1-haSyn mice show striatal microglial activation and prolonged distal colonic transit [7–9]. The number of differentially expressed genes (DEGs) comparing Thy1-haSyn vs. WT in the gut (distal colon) and brain (striatum) at each time point is shown in Table 1. Heat maps of the top 50 genes with NCBI IDs are shown in Fig. 1. The number of DEGs between Thy1-haSyn and WT was greater at one month than at three months in both the gut and the brain. Top differentially expressed genes for each tissue and time point are provided in Supplementary File 2). Three of six selected differentially expressed genes were also differentially expressed (one-sided p < 0.05) by qPCR (Supplementary Figure 3 and Supplementary Table 6, in Supplementary File 1).
Fig. 1
Top differentially expressed genes. Heat map of scaled expression for the top 50 genes with NCBI IDs in each tissue and time point. Rows are clustered by distance. Lower case letters identify individual animals for which matched (gut, brain) samples are present. All differentially expressed genes are provided in a supplement. Samples sizes are shown in Table 1. Thy1-haSyn, alpha-synuclein overexpressing; WT, wild type.
The haSyn transgene is expressed in the colon
Pathological aSyn is present in the gut (enteric) nervous system of PD patients [40, 41]. To confirm expression in our model, we created a custom nCounter (NanoString Technologies, Seattle, WA) probe matching the human-specific portion of the alpha-synuclein gene (SNCA), which was unlikely to be found in our 3’ reads. Human SNCA expression was apparent in the gut at both time-points, indicating active Thy1 promoter in enteric neurons (Supplementary Figure 4 in Supplementary File 1).
Dysregulation of PD genes in the gut and the brain is discordant
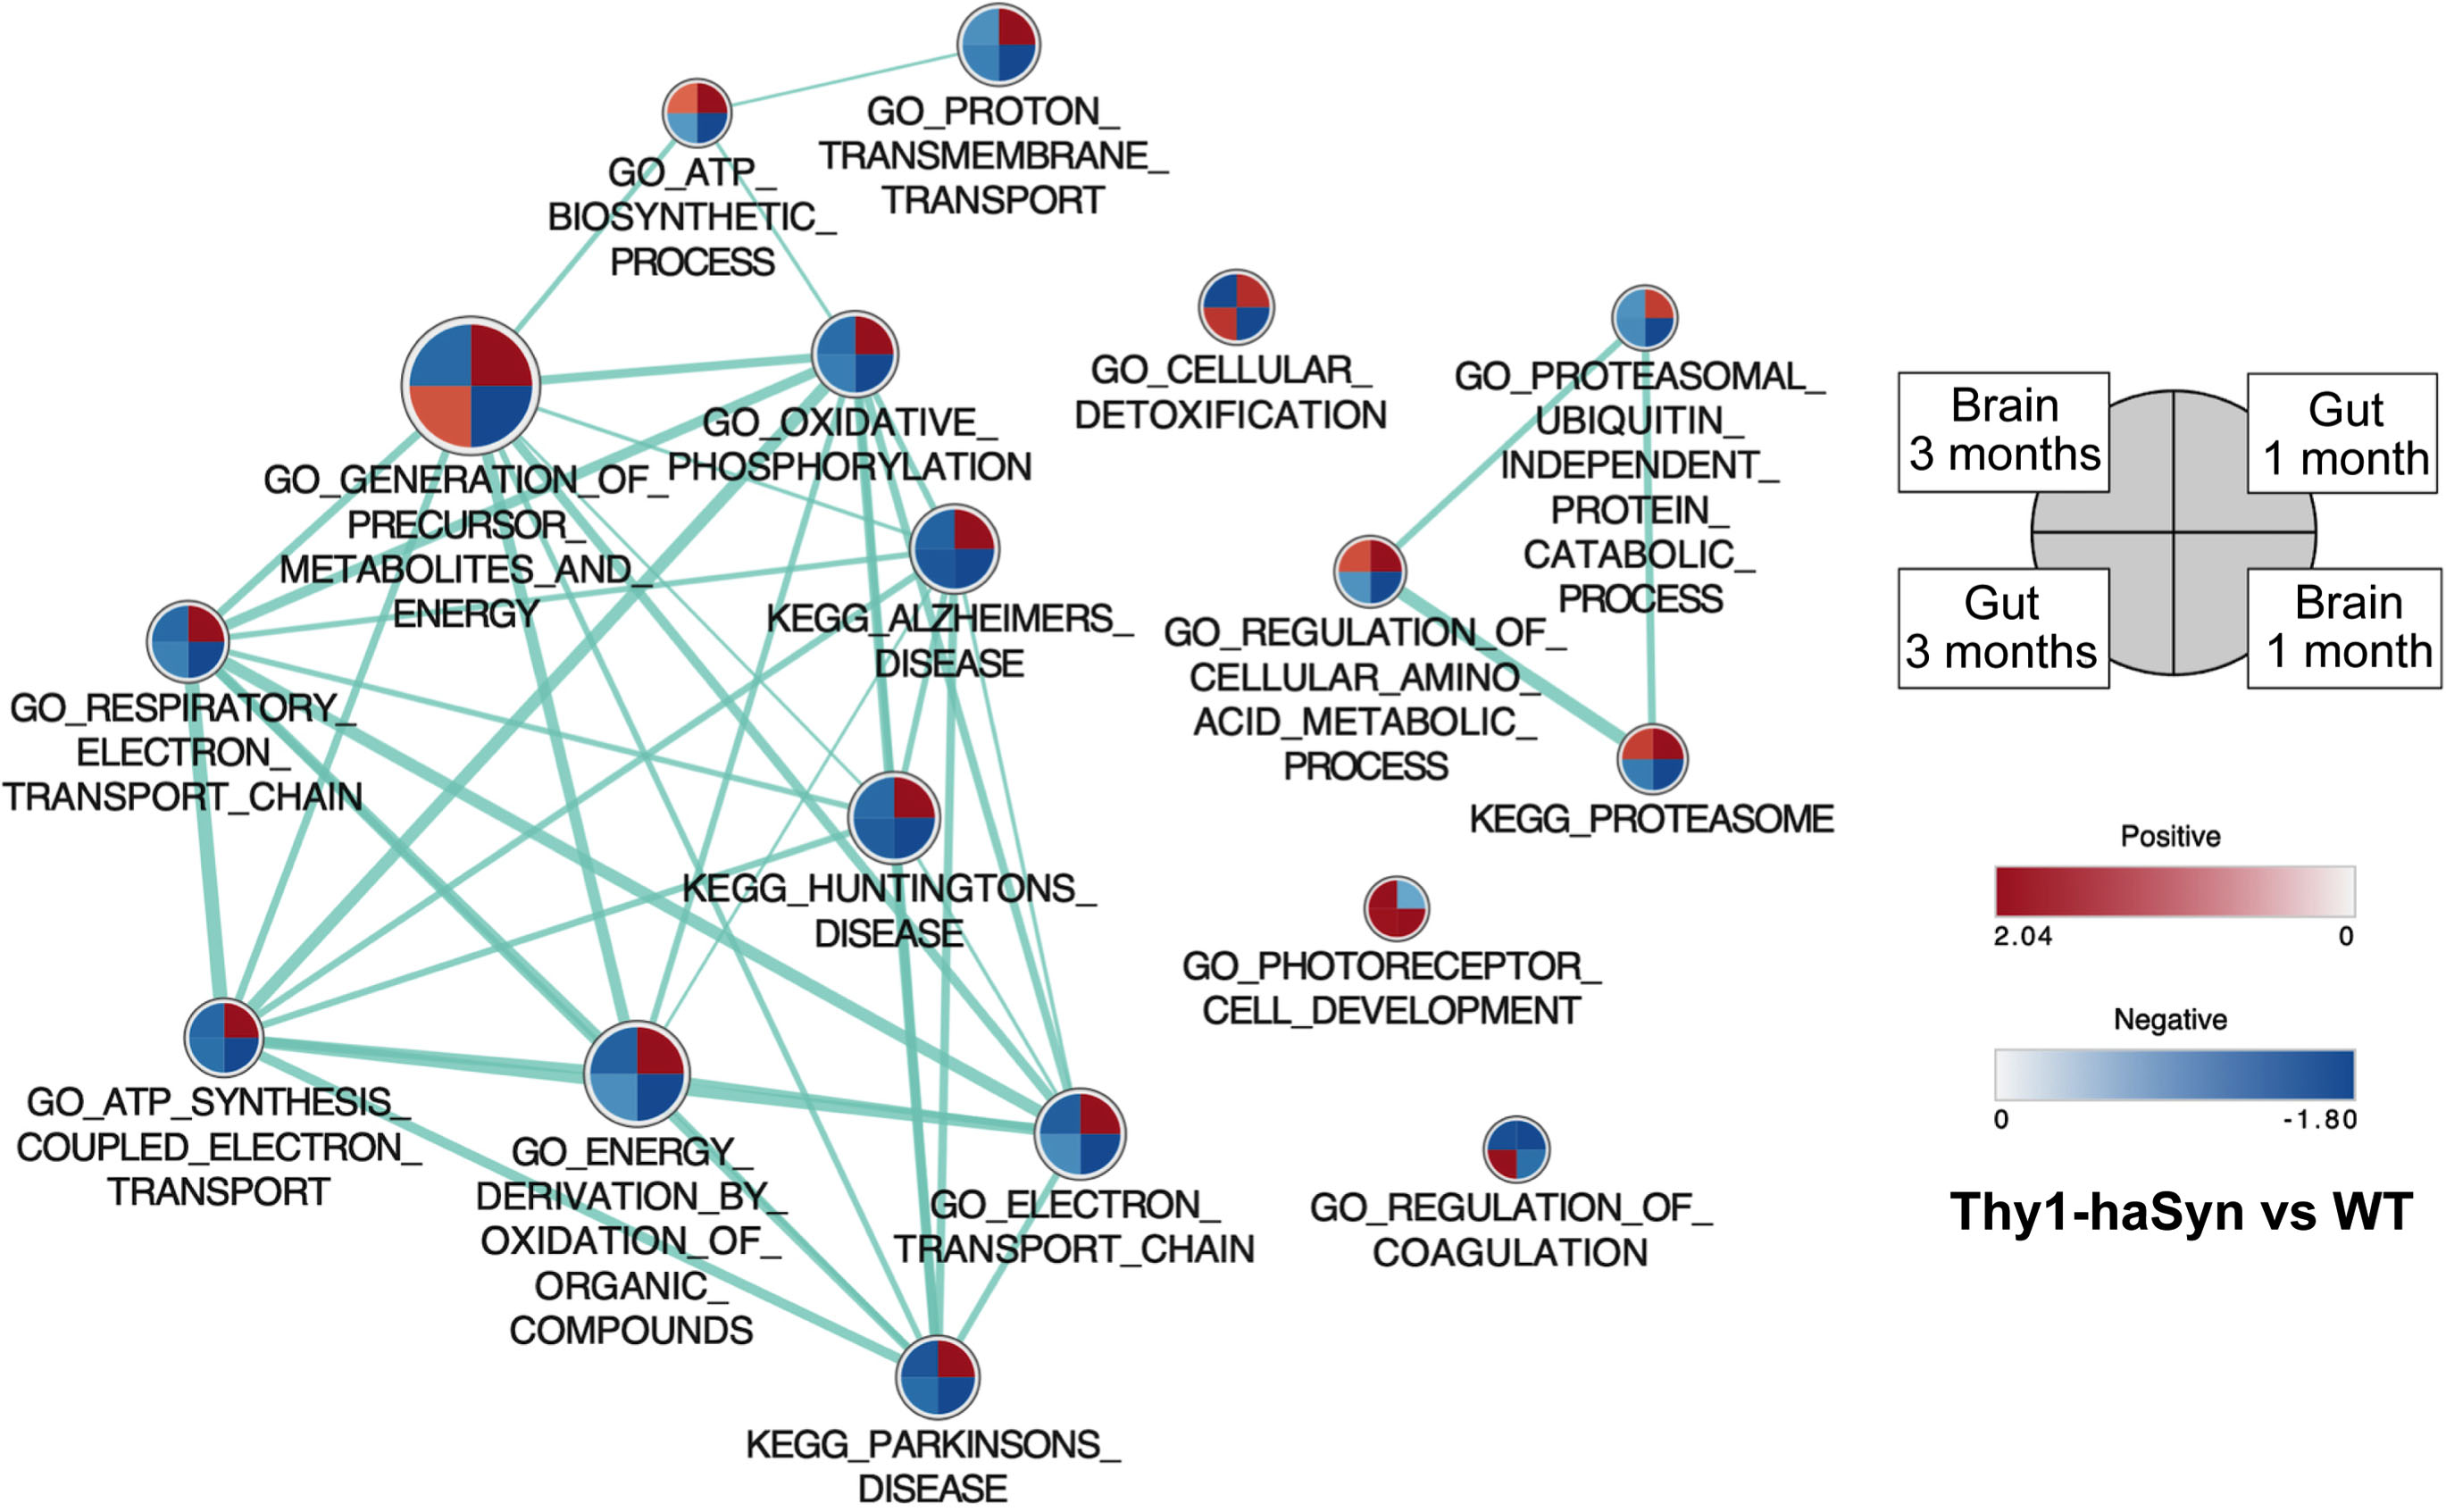
Gene set enrichment analysis (GSEA) was used to compare pathway and ontology enrichment in Thy1-haSyn vs. WT. Gene sets enriched at the recommended threshold for GSEA (FDR q value < 0.25) [11] are shown in Table 2 and all gene sets enriched with either FDR q value < 0.25 or nominal p value < 0.05 are provided in a supplemental file (see Supplementary File 3). We saw an opposite pattern of enrichment for PD-relevant gene sets (KEGG-Parkinson’s Disease, GO Oxidative phosphorylation) in the gut and the brain at one month. In the striatum, PD-relevant gene sets were enriched in WT, which is expected, as expression of these genes is primarily decreased in the brain in PD. However, in the colon, these same gene sets were enriched in Thy1-haSyn mice. Normalized enrichment scores for Thy1-haSyn vs. WT are shown in Fig. 2.
Table 2
Gene set enrichment analysis
| Gene set | NES | p | FDR q |
| Colon, 1 month, enriched in Thy1-haSyn | |||
| Hallmark Oxidative Phosphorylation | 1.75 | 0.02 | 0.02 |
| KEGG Oxidative Phosphorylation | 1.81 | 0.01 | 0.02 |
| KEGG Butanoate Metabolism | 1.77 | 0.01 | 0.03 |
| KEGG Parkinson’s Disease | 1.81 | 0.01 | 0.03 |
| KEGG Huntington’s Disease | 1.89 | 0.00 | 0.03 |
| KEGG Alzheimer’s Disease | 1.81 | 0.01 | 0.04 |
| KEGG Drug Metabolism Cytochrome P450 | 1.56 | 0.02 | 0.20 |
| Striatum, 1 month, enriched in WT | |||
| KEGG Oxidative Phosphorylation | 1.88 | 0.00 | 0.02 |
| Hallmark Oxidative Phosphorylation | 1.80 | 0.02 | 0.02 |
| KEGG Parkinson’s Disease | 1.71 | 0.04 | 0.09 |
| KEGG Starch and Sucrose Metabolism | 1.58 | 0.04 | 0.13 |
| GO Golgi Vesicle Budding | 1.81 | 0.00 | 0.15 |
| KEGG Ribosome | 1.64 | 0.05 | 0.15 |
| KEGG Huntington’s Disease | 1.58 | 0.03 | 0.16 |
| GO Anaphase Promoting Complex Dependent Catabolic Process | 1.85 | 0.00 | 0.16 |
| KEGG Proteasome | 1.60 | 0.02 | 0.17 |
| GO Negative Regulation of cAMP Mediated Signaling | 1.73 | 0.00 | 0.17 |
| GO Proton Transmembrane Transport | 1.80 | 0.00 | 0.18 |
| GO ATP Synthesis Coupled Electron Transport | 1.73 | 0.05 | 0.18 |
| GO Respiratory Electron Transport Chain | 1.74 | 0.03 | 0.19 |
| GO COPII Coated Vesicle Budding | 1.74 | 0.00 | 0.21 |
| KEGG Alzheimer’s Disease | 1.51 | 0.05 | 0.22 |
| GO Oxidative Phosphorylation | 1.88 | 0.00 | 0.22 |
| GO Protein K11 Linked Ubiquitination | 1.69 | 0.00 | 0.23 |
| GO Electron Transport Chain | 1.70 | 0.00 | 0.23 |
| GO Vesicle Targeting to From or Within Golgi | 1.74 | 0.00 | 0.23 |
| GO Vesicle Budding from Membrane | 1.68 | 0.00 | 0.24 |
| KEGG Arachidonic Acid Metabolism | 1.46 | 0.03 | 0.24 |
| GO Cytochrome Complex Assembly | 1.76 | 0.00 | 0.25 |
| Striatum, 3 months, enriched in WT | |||
| Hallmark Pancreas Beta Cells | 1.73 | 0.00 | 0.02 |
| Hallmark KRAS Signaling Down | 1.39 | 0.08 | 0.20 |
| Hallmark Fatty Acid Metabolism | 1.41 | 0.07 | 0.20 |
| Hallmark MTORC1 Signaling | 1.37 | 0.01 | 0.20 |
| Hallmark Oxidative Phosphorylation | 1.40 | 0.15 | 0.22 |
| Hallmark Glycolysis | 1.34 | 0.06 | 0.22 |
Gene sets enriched at the recommended threshold for GSEA (FDR q-value < 0.25) are shown. There were none meeting this threshold for the following: colon 1 month enriched in WT, colon 3 months enriched in Thy1-haSyn or WT, striatum 1 and 3 months enriched in Thy1-haSyn. Enrichments with nominal p < 0.05 or FDR q-value < 0.25 are provided in a Supplementary File. Thy1-haSyn, alpha-synuclein overexpressing; WT, wild type; NES, normalized enrichment score.
Fig. 2
PD-relevant gene sets have opposite enrichment in colon and striatum. Normalized enrichment scores are shown for Thy1-haSyn vs. WT in colon and striatum at one and three months. Sets shown are selected from those that are significant for any comparison at the GSEA-recommended significance cutoff of FDR q value < 0.25 (Table 2). Each circle represents a gene set with the quadrants corresponding to the different tissues and time points. The shading of the quadrant reflects the enrichment score in Thy1-haSyn vs. WT at that time in that tissue, with darker shading indicating a larger enrichment score. Quadrants with a “+” represent positive enrichment scores while those without this annotation are negative enrichment scores (gene set was enriched in WT). Samples sizes are shown in Table 1. Thy1-haSyn, alpha-synuclein overexpressing; WT, wild type; NES, normalized enrichment score.
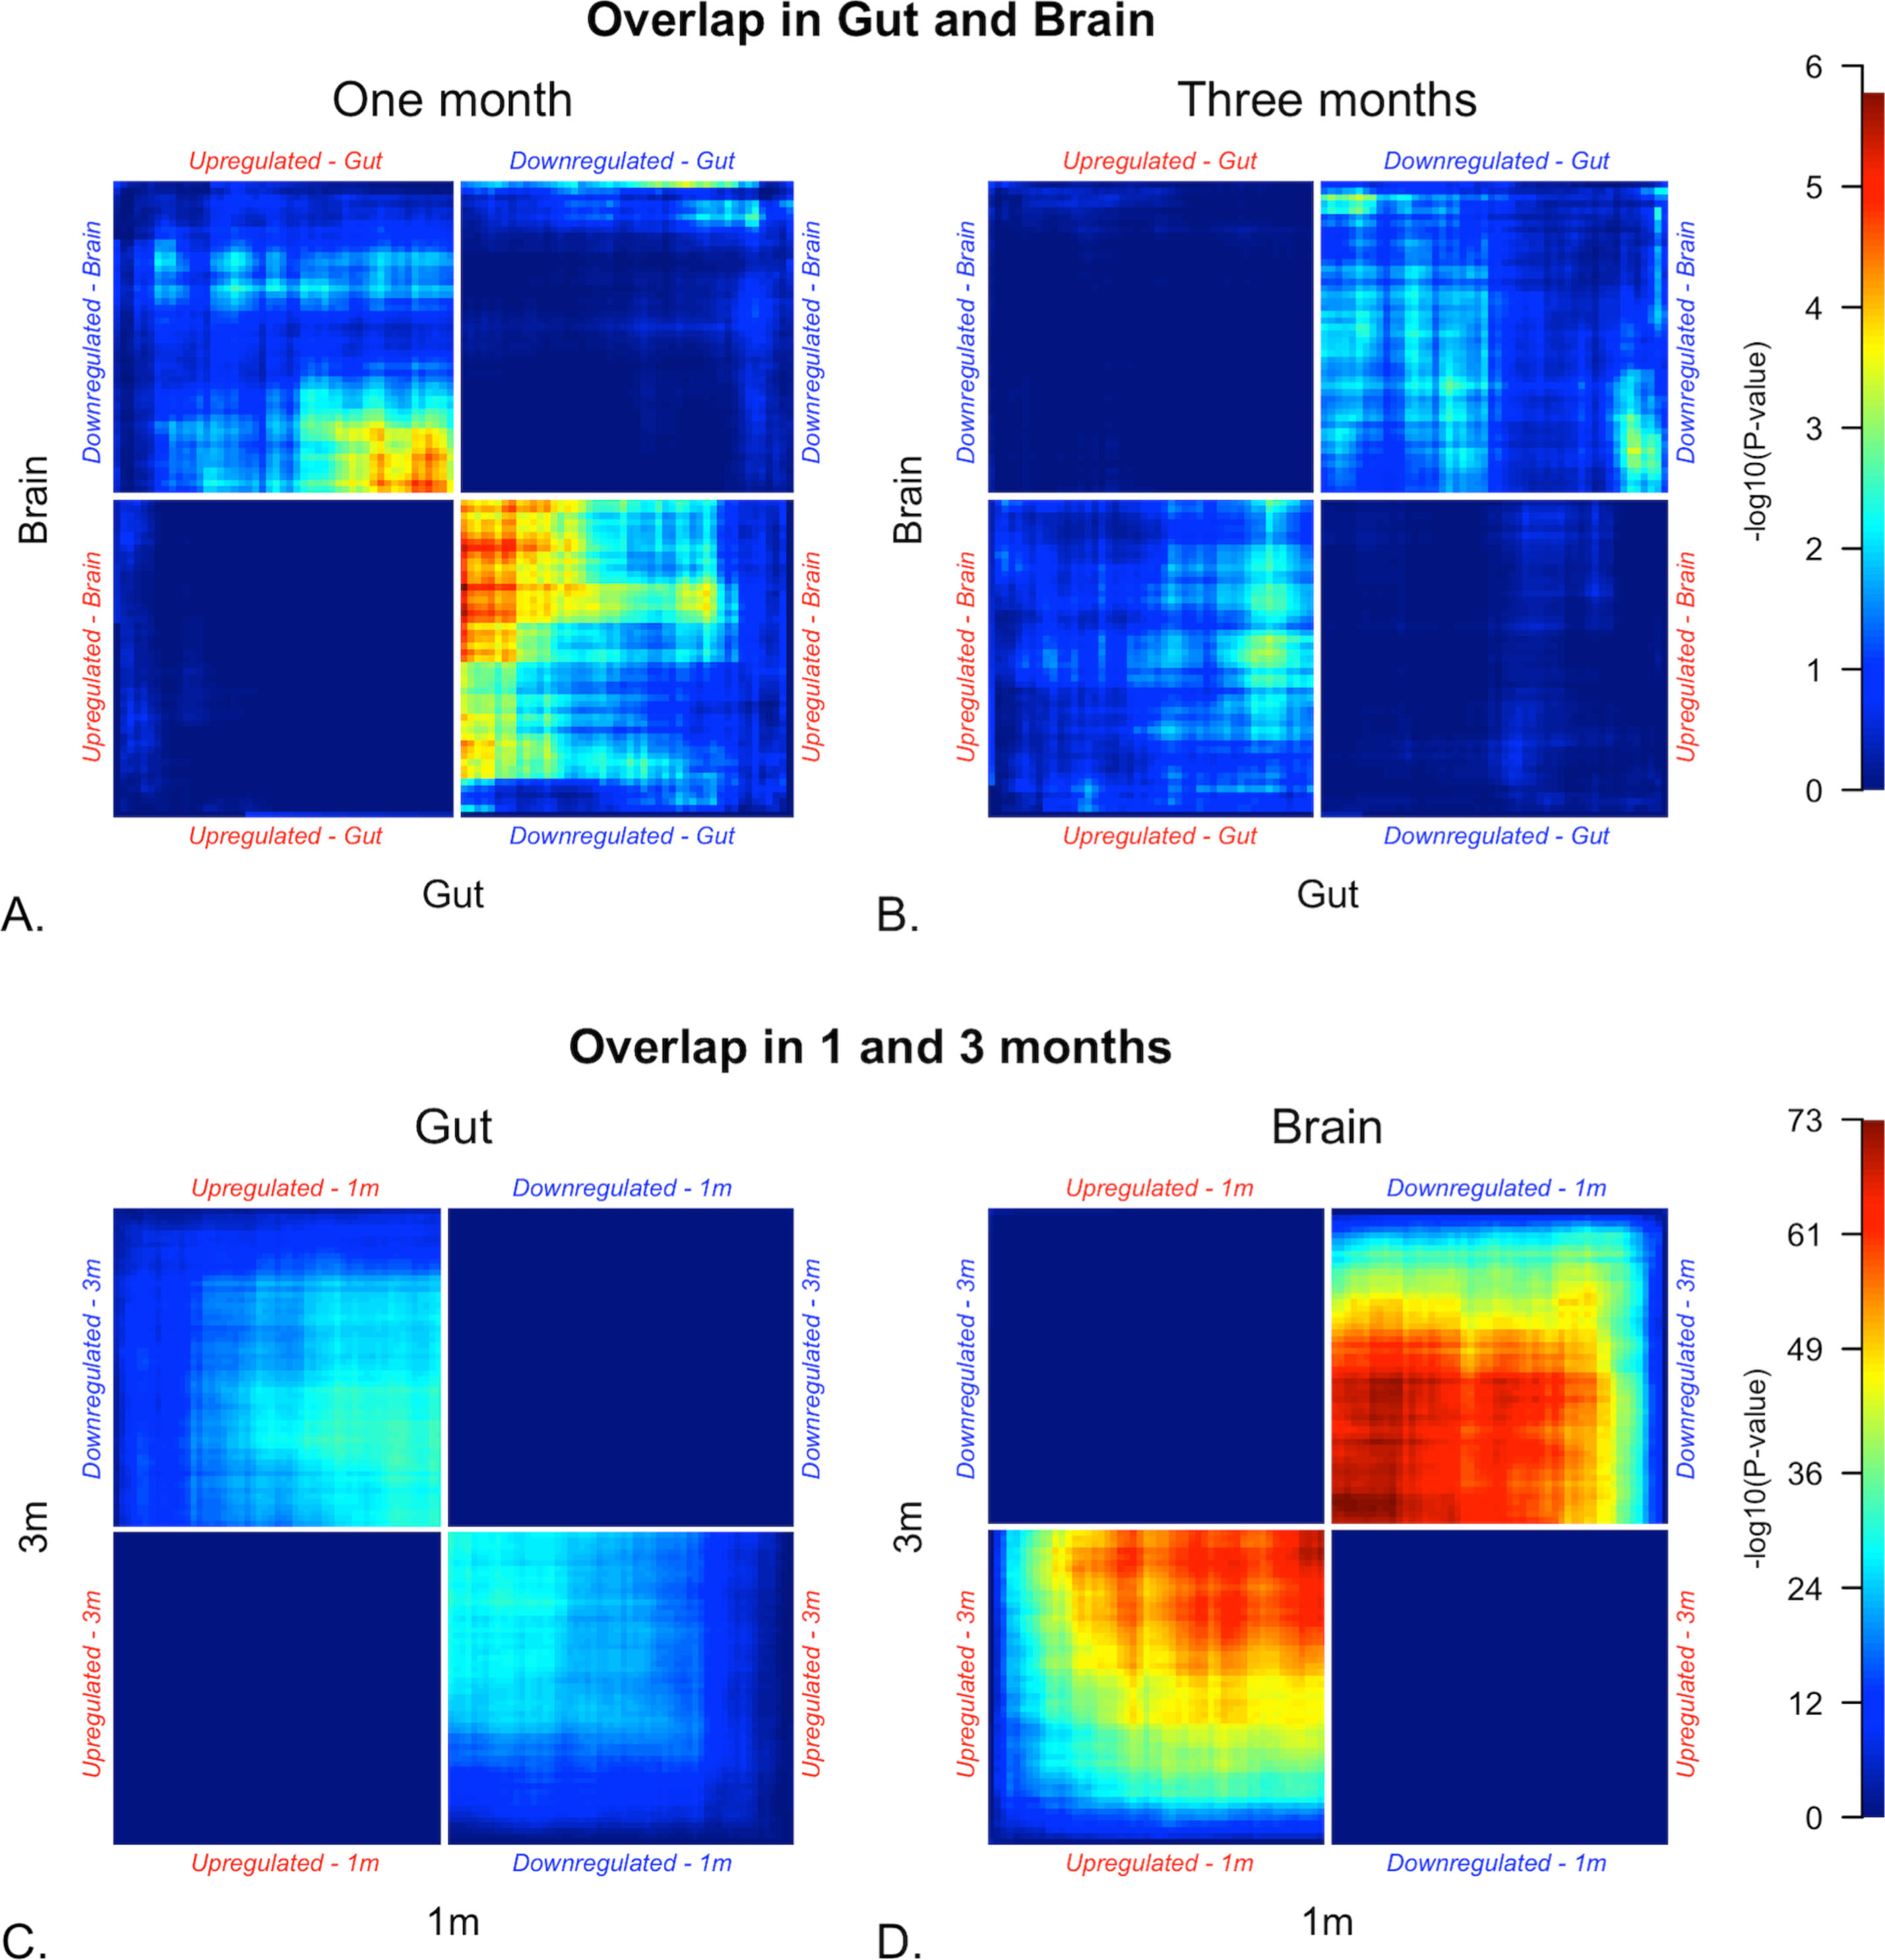
To verify this discordant pattern of gene expression, we used stratified rank-rank hypergeometric overlap (RRHO) [26]. RRHO identifies concordant or discordant differential gene expression between data sets by identifying enrichment of DEGs from one set within DEGs from another. All genes were ranked by -log10 p value multiplied by the effect sign (1/-1 for upregulated/downregulated). Figure 3 shows unadjusted p-values for overlap of DEGs between tissues and between time points within tissue. At one month, striatum and colon DEGs (Thy1-haSyn vs. WT) overlap, but these genes are upregulated in the colon and downregulated in the striatum, similar to our GSEA findings. Plots with adjusted p values (Benjamini-Yekutieli) are shown in Supplementary Figure 5 (in Supplementary File 1).
Fig. 3
Rank-rank hypergeometric overlap (RRHO) heatmaps. RRHO identifies concordant/discordant differential gene expression between data sets by identifying enrichment of DEGs from one set within DEGs from another. All genes were ranked by -log10 p value multiplied by the effect sign (1/-1 for upregulated/downregulated). The plot is a heatmap of unadjusted p-values for overlap of DEGs (Thy1-haSyn vs. WT) between tissues and between time-points within tissue. For each plot, bright areas represent concordant (top right and bottom left quadrants) and divergent (top left and bottom right quadrants) differential gene expression (Thy1-haSyn vs. WT) between colon and striatum at one month (A) and three months (B), and between one month and three months in colon (C) and striatum (D). This analysis also shows that patterns of differential expression are discordant in the colon and striatum at one month. In addition, while there is high concordance between differential expression in striatum and 1 and 3 months, there is slight discordance in the colon. p-values are unadjusted; plots with adjusted p values (Benjamini-Yekutieli) are shown in Supplementary Figure 4. Samples sizes are shown in Table 1.
Gene expression changes in the gut and the brain are statistically independent
Weighted gene coexpression network analysis (WGCNA) was used to identify groups of highly correlated genes (modules). After filtering of genes with low expression, WGCNA was performed on expression data from the colon (12,376 genes) and striatum (10,353 genes). This yielded networks consisting of 36 and 29 modules, respectively. Gene dendrograms as well as hierarchical clustering of samples and modules are shown in Supplementary Figure 6 (see Supplementary File 1). Correlation of module eigengenes (MEs, first principal component) with genotype and time point are shown in Fig. 4 (modules with significant associations) and Supplementary Figure 7 (all modules, see Supplementary File 1). Top enriched GO terms and cell type signatures for a subset of modules are shown in Table 3. These modules have been given short names to improve clarity of the manuscript; however, it should be emphasized that clustering is unbiased and modules may represent a combination of processes rather than a single pathway. Ontologies and cell type signatures for all modules are available in a supplemental file (see Supplementary File 4). Univariate followed by multivariate analyses, with backwards stepwise regression, identified modules independently associated with Thy1-haSyn vs. WT (Fig. 4 and Supplementary Tables 7 and 8 in Supplementary File 1). In order to determine whether changes in the gut were independent of those in the brain, we performed multiple regression combining both colon and striatum modules in the subset of mice with RNA sequencing data for both tissues (Table 4). This subset was similar to the full sample with regard to Thy1-haSyn-associated modules (Supplementary Tables 9 and 10 in Supplementary File 1). While striatum modules explained the majority of variance, inclusion of the Gut-enteric nervous system (Gut-ENS) module did marginally improve the model fit (Likelihood Ratio Test: F = 4.1, p = 0.048), suggesting that changes in the gut and brain may be distinct. At one month, the model included Brain-unfolded protein response (Brain-UPR) and Gut-proteolysis, and the contribution of Gut-proteolysis was significant (Table 4, Likelihood Ratio Test: F = 21.1, p = 0.01). Selected modules were visualized in Cytoscape (Fig. 5). Modules independently associated with Thy1-haSyn status included several that were upregulated and enriched for terms related to metabolism and mitochondria, such as Gut-mitochondrial quality control (Gut-mito-QC), Gut-immune, and Gut-mitochondrial stress (Gut-mito-stress), which mirrors gene set enrichment. The Gut-mito-QC module contains hub genes involved in mitochondrial quality control, including PTEN induced putative kinase 1 (Pink1), which causes autosomal recessive PD, and ariadne RBR E3 ubiquitin protein ligase 1 (Arih1), which triggers PINK1-dependent mitophagy [42] and is present in Lewy bodies [43]. Gut-mito-stress is enriched for terms related to proapoptotic signaling and oxidative phosphorylation. It includes late endosomal/lysosomal adaptor, MAPK and MTOR activators 2 and 4 (Lamtor2, Lamtor4), as well as coiled-coil-helix-coiled-coil-helix domain containing 2 (Chchd2), which causes autosomal dominant PD, and is involved in regulation of apoptosis in response to mitochondrial stress [44]. The combination of enriched ontologies for Gut-proteolysis (upregulated) and Gut-proliferation, which was colinear with Gut-proteolysis but downregulated, support increased proinflammatory signaling, proteolysis and decreased growth factor signaling. Gut-proteolysis hub genes include v-rel reticuloendotheliosis viral oncogene homolog A (avian) (Rela, nuclear factor kappa B p65), and cathepsin D (CtsD), which is the main cathepsin involved in the lysosomal degradation of aSyn [45, 46].
Table 3
Functional annotation of key modules
| Module Name (color, dira) | Annotation |
| Gut-ENS (yellow, down) | GO Terms: negative regulation of RNA biosynthetic process (1.1e-04), positive regulation of nervous system development (2.1e-04), negative regulation of peptidyl-lysine acetylation (5.8e-04), positive regulation of oligodendrocyte differentiation (1.5e-03), negative regulation of TOR signaling (3.1e-03), blood vessel remodeling (3.5e-03), gene silencing (4.2e-03), response to hypoxia (4.3e-03), modification of synaptic structure (4.3e-03), cellular response to amyloid-beta (5.0e-03) |
| Risk genes: PD: Pam; IBD: Pla2g4a, Hif3a, Cpxm2 | |
| Brain-UPR (red, down) | GO Terms: translational initiation (1.5e-03), response to unfolded protein (3.2e-03), cellular response to interferon-gamma (0.006), reactive oxygen species metabolic process (0.01), lipid modification (0.018) |
| Cell signatures: Cajal-Retzius cell (0.023) | |
| Risk genes: IBD: Slc2a13, Zfp831 | |
| Gut-proteolysis (darkmagenta, up) | GO Terms: regulation of proteolysis (2.1e-04), ER to Golgi vesicle-mediated transport (1.3e-03), response to radiation (0.006), regulation of inflammatory response (0.012), amide biosynthetic process (0.013) |
| Risk genes: PD: Fyn, Elovl7; IBD: Cdkal1, Rela | |
| Gut-mito-QC (violet, up) | GO Terms: purine-containing compound metabolic process (5.2e-07), respiratory electron transport chain (3.2e-05), protein localization to mitochondrion (2.8e-04), ribonucleotide biosynthetic process (3.3e-04), lysosomal transport (9.4e-04), heme biosynthetic process (1.2e-03), cellular response to oxidative stress (1.5e-03), lipid metabolic process (1.7e-03), presynapse assembly (1.8e-03), response to bacterium (2.3e-03) |
| Cell signatures: Goblet cell (3.2e-06), Transit amplifying (TA) cell (9.7e-04), Enteroendocrine precursor cell (0.021), Paneth cell (0.029) | |
| Risk genes: PD: Slc44a4, Scarb2; IBD: Slc43a3, Capzb, Rpl3, Gatd3a, Tmem258, Sec11c, Commd7, Brd2, Fads2, Fgfr1op, Gipc2, Tm9sf4, Notch21m, Zfp36l1 | |
| Gut-immune (brown, up) | GO Terms: basic amino acid transport (5.5e-04), defense response to Gram-negative bacterium (6.8e-04), digestive system development (0.007), calcium ion regulated exocytosis (0.008), positive regulation of extrinsic apoptotic signaling pathway via death domain receptors (0.008), respiratory electron transport chain (0.012) |
| Cell signatures: Enterocytes (5.2e-03), Enteroendocrine precursor cell (0.025) | |
| Gut-mito-stress (sienna3, up) | GO Terms: cytosolic large ribosomal subunit (CC) (2.2e-06), inner mitochondrial membrane organization (2.4e-04), purine nucleoside monophosphate metabolic process (2.7e-04), extrinsic apoptotic signaling pathway via death domain receptors (4.3e-04), mitochondrial respiratory chain complex I assembly (1.5e-03), G protein-coupled receptor internalization (1.8e-03) |
| Cell signatures: Transit amplifying (TA) cell (4.8e-06), Neurons (Tissue: Brain, 3.5e-03) | |
| Risk genes: PD: Lamtor2; IBD: Ccdc85b, Ltbr, Pdlim4, Uqcr10 | |
| Gut-proliferation (cyan, down) | GO Terms: DNA damage checkpoint (6.9e-06), cell cycle checkpoint (7.3e-04), epidermal growth factor receptor signaling pathway (1.7e-03), negative regulation of proteasomal ubiquitin-dependent protein catabolic process (2.8e-03), activation of JUN kinase activity (3.6e-03), regulation of stress-activated protein kinase signaling cascade (4.1e-03) |
| Risk genes: PD: Qser1, Rabep2; IBD: Npepps, Cul1 | |
| Gut-lysosome (greenyellow, down) | GO Terms: lysosome (CC) (6.7e-04), response to growth factor (2.3e-03), phosphatidylinositol-mediated signaling (2.6e-03), regulation of ion transport (3.0e-03), glycoprotein metabolic process (3.7e-03), protein ubiquitination (4.2e-03) |
| IBD risk genes: Fap, Tlr4 | |
| Brain-Snca (cyan, up) | GO Terms: regulation of calcium ion transmembrane transport (4.9e-04), regulation of cytoskeleton organization (1.0e-03), cytoskeleton-dependent intracellular transport (2.8e-03), cell junction assembly (3.9e-03), positive regulation of cell migration (0.006), regulation of mitotic sister chromatid segregation (0.008), regulation of metal ion transport (0.009), protein depolymerization (0.01), positive regulation of nervous system development (0.013), synapse assembly (0.014), positive regulation of JNK cascade (0.016), immune response-regulating signaling pathway (0.016), Golgi vesicle transport (0.017) |
| Risk genes: PD: Snca |
aThy1-haSyn vs. WT. Enriched gene ontology (GO), cell-type signatures, and risk genes for PD and inflammatory bowel disease (IBD) for selected modules. P values shown are unadjusted. Cell-type signatures are only shown for enriched cell-types with adjusted p value < 0.1 where there was an overlap of >1 gene. Signatures shown here are from GI tract (colon) or Brain (striatum) related tissues unless specified otherwise. GO terms are biological processes unless noted (e.g., CC, cellular component; MF, molecular function). Risk genes are from the EMBL-EBI GWAS catalog. References and risk genes in additional modules are shown in Tables S11-S12 (see Supplement 1) Numbers in parentheses are unadjusted P values. Ontologies and cell-type signatures for all modules are available in a supplemental file. ENS, enteric nervous system; UPR, unfolded protein response.
Fig. 4
Weighted gene coexpression network analysis (WGCNA). Correlation of module eigengenes with genotype and time point. Values are Pearson correlation coefficients and Benjamini-Hochberg adjusted p-values. Only modules with significant correlations for Thy1-haSyn vs. WT or 3 m vs. 1 m in Thy1-haSyn are shown. Darker shading indicates a stronger correlation and the direction of the correlation is indicated by the sign of the correlation coefficient. Inter-modular connectivity and correlation of module eigengenes (MEs, first principal component) with genotype and time point for all modules is shown in Supplementary Figure 6. Samples sizes are shown in Table 1. Thy1-haSyn, alpha-synuclein overexpressing; WT, wild type; m, month; GF, growth factor; ECM, extracellular matrix; TOR, target of rapamycin; resp., response; ox-phos, oxidative phosphorylation; org, organization.
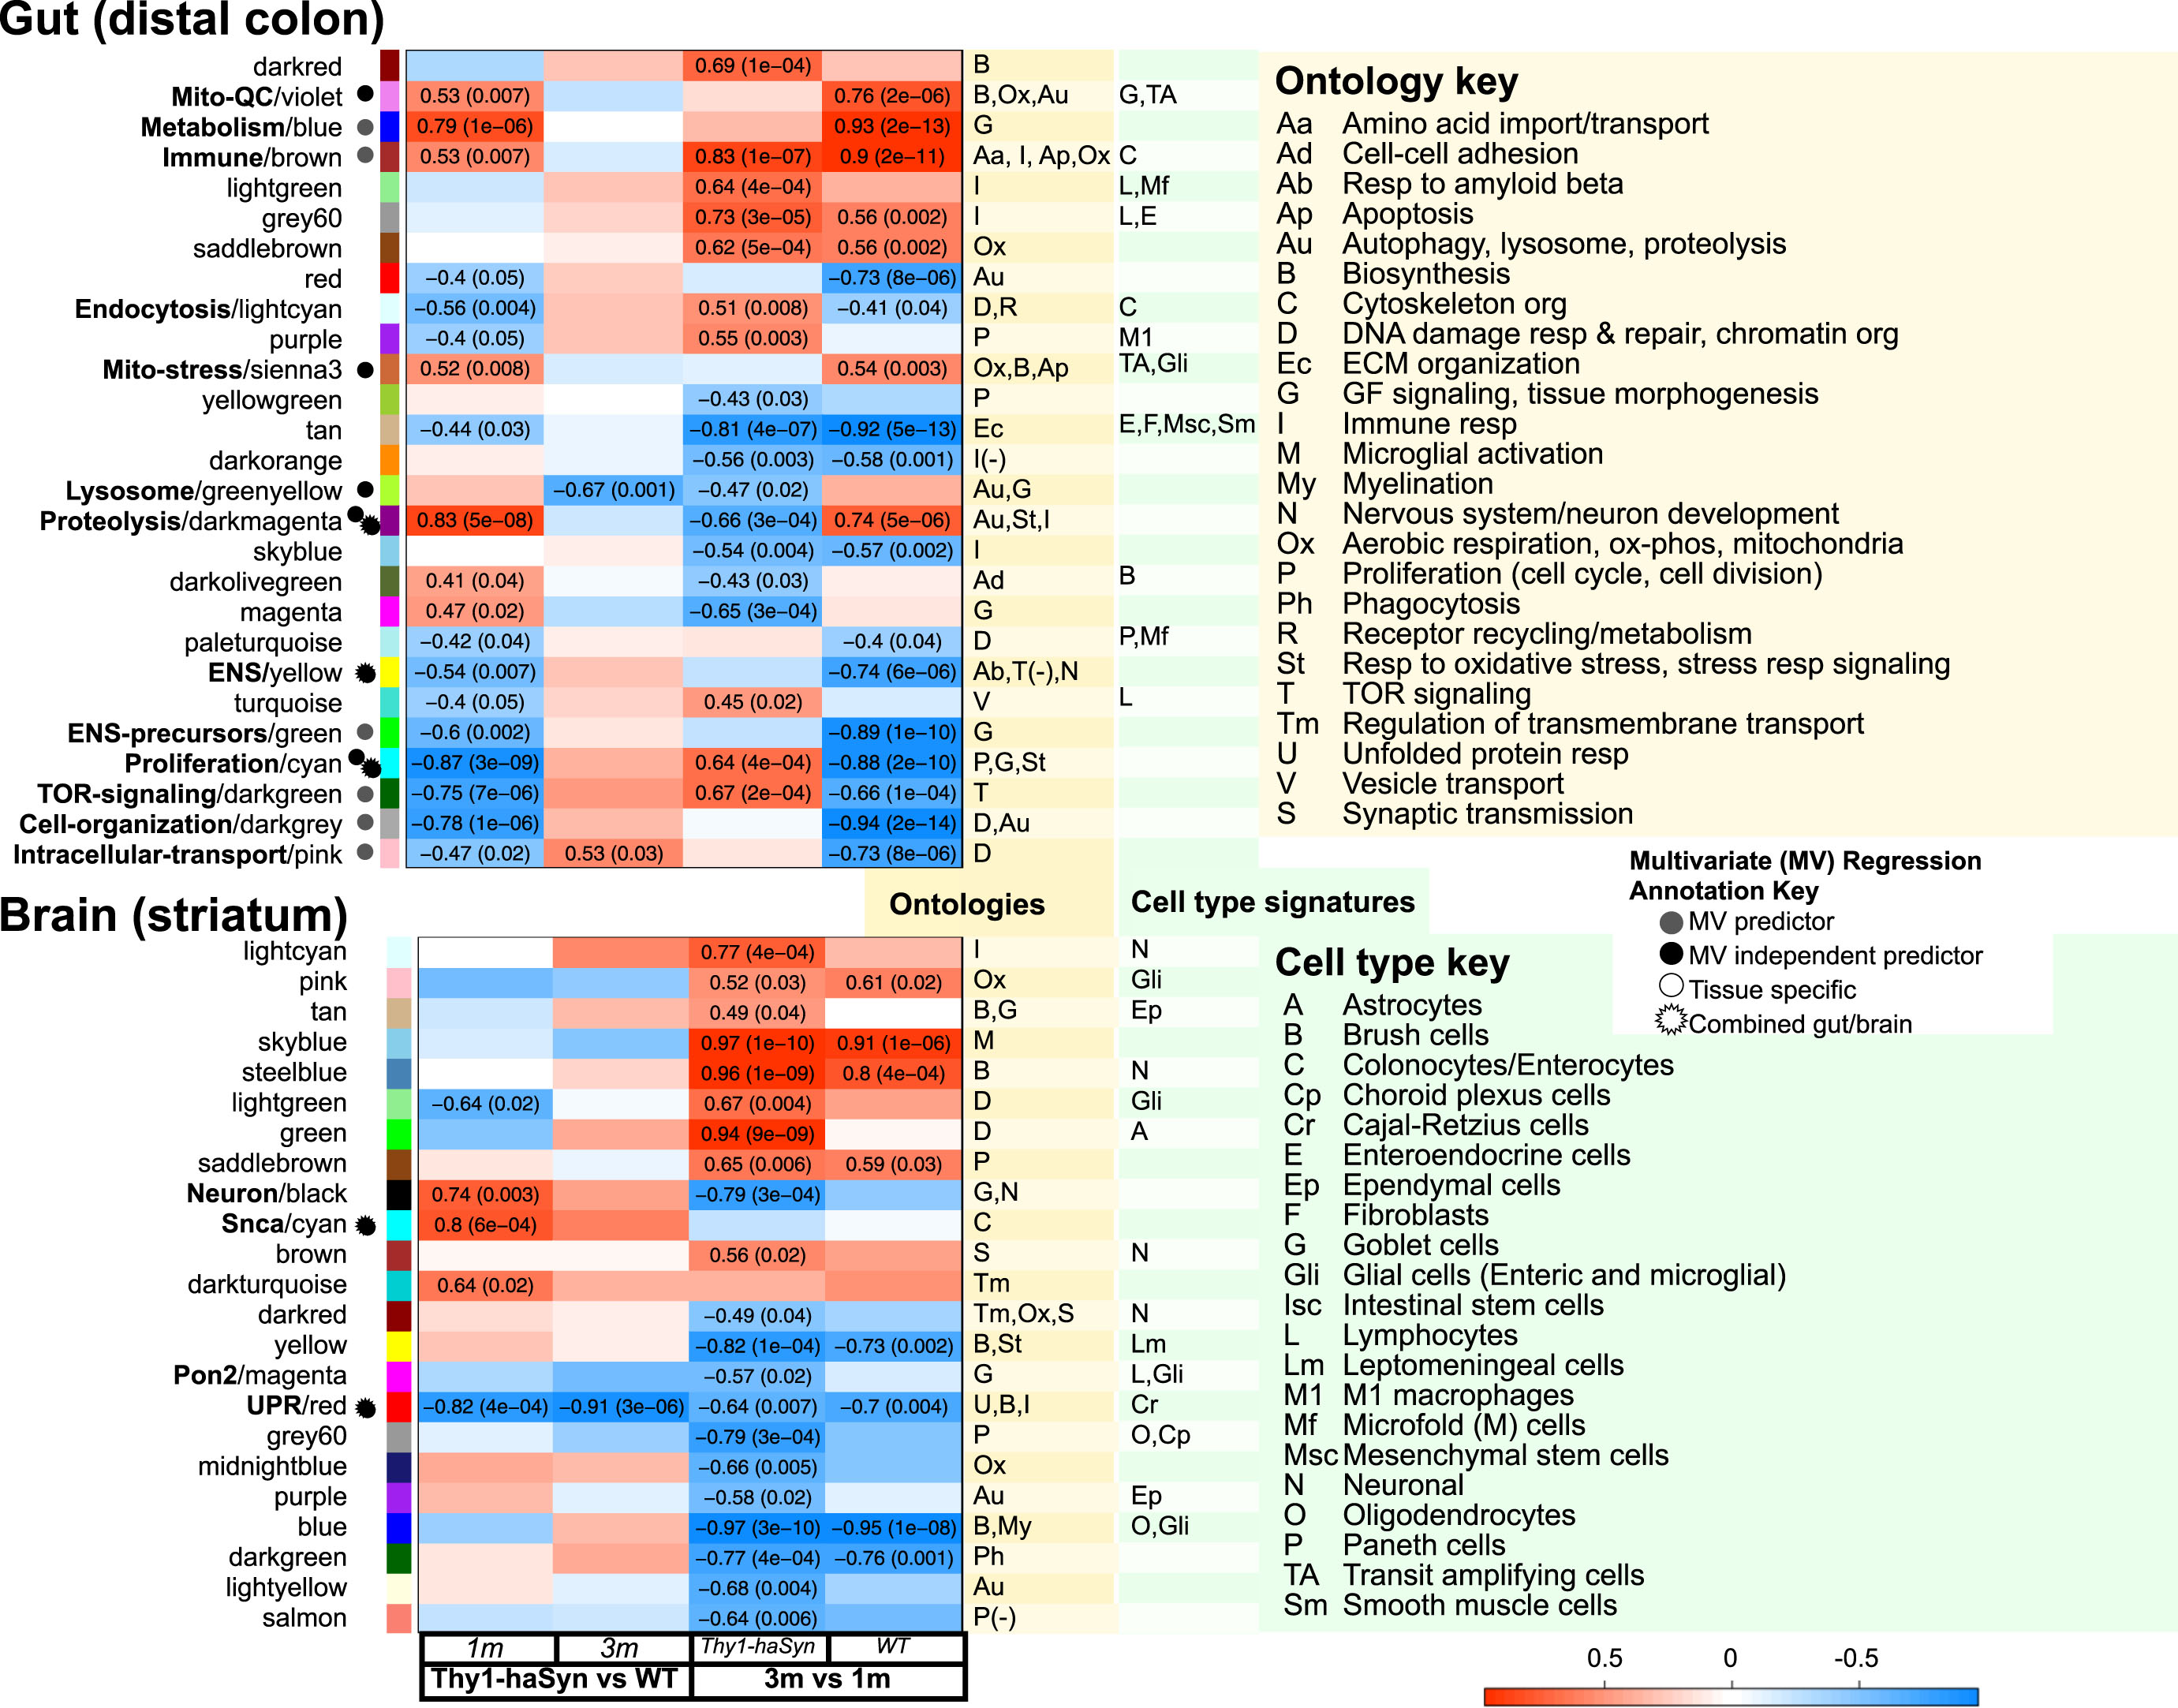
Fig. 5
Key modules. Cytoscape networks of colon and striatum modules that were multivariate predictors of Thy1-haSyn. Selected genes with module membership at least 0.6 are shown. Annotations were generated by the ClueGO Plugin [32]. While they have a nominal p-value of <0.05, they are included for illustrative purposes only. Edge weights are from the WGCNA adjacency matrix and are proportional to line thickness. These networks are available on the Network Data Exchange (NDEx) at the following urls: a) https://doi.org/10.18119/N94K65, b) https://doi.org/10.18119/N97C8S c) https://doi.org/10.18119/N98C9G, d) https://doi.org/10.18119/N9RC9T, e) https://doi.org/10.18119/N9C320, f) https://doi.org/10.18119/N9GW37. Full WGCNA networks are also available (urls under Data Availability).
![Key modules. Cytoscape networks of colon and striatum modules that were multivariate predictors of Thy1-haSyn. Selected genes with module membership at least 0.6 are shown. Annotations were generated by the ClueGO Plugin [32]. While they have a nominal p-value of <0.05, they are included for illustrative purposes only. Edge weights are from the WGCNA adjacency matrix and are proportional to line thickness. These networks are available on the Network Data Exchange (NDEx) at the following urls: a) https://doi.org/10.18119/N94K65, b) https://doi.org/10.18119/N97C8S c) https://doi.org/10.18119/N98C9G, d) https://doi.org/10.18119/N9RC9T, e) https://doi.org/10.18119/N9C320, f) https://doi.org/10.18119/N9GW37. Full WGCNA networks are also available (urls under Data Availability).](https://ip.ios.semcs.net:443/media/jpd/2023/13-7/jpd-13-7-jpd223568/jpd-13-jpd223568-g005.jpg)
Table 4
Combined colon and striatum module association with Thy1-haSyn
| Predictors | Striatum | Colon | Combined | ||||||
| Estimates | CI | p | Estimates | CI | p | Estimates | CI | p | |
| All matched samples (n = 16) | |||||||||
| (Intercept) | 0.72 | 0.50, 0.93 | <0.001 | 0.88 | 0.44, 1.33 | 0.001 | 0.82 | 0.63, 1.02 | <0.001 |
| age | –0.3 | –0.60, 0.00 | 0.051 | –0.15 | –0.75, 0.45 | 0.599 | –0.42 | –0.71, – 0.14 | 0.009 |
| Striatum modules | |||||||||
| royalblue | 0.53 | –0.27, 1.33 | 0.175 | 0.41 | –0.27, 1.08 | 0.204 | |||
| Brain-UPR | –1.41 | –2.25, – 0.58 | 0.003 | –0.73 | –1.67, 0.22 | 0.113 | |||
| Brain-Snca | 0.79 | 0.16, 1.42 | 0.018 | 0.65 | 0.13, 1.17 | 0.021 | |||
| age*Brain-UPR | –1.06 | –2.12, 0.01 | 0.051 | ||||||
| Colon modules | |||||||||
| Gut-ENS | –2.52 | –4.63, – 0.40 | 0.024 | –1.38 | –2.41, – 0.35 | 0.015 | |||
| age* Gut-ENS | 3.17 | 0.04, 6.30 | 0.048 | 1.52 | 0.12, 2.91 | 0.036 | |||
| R2/R2 adjusted | 0.848/0.793 | 0.378/0.222 | 0.940/0.888 | ||||||
| One month (n = 7) | |||||||||
| (Intercept) | 0.73 | 0.37, 1.09 | 0.003 | 0.5 | 0.26, 0.74 | 0.003 | 0.6 | 0.41, 0.79 | 0.001 |
| Brain-UPR | –1.91 | –3.52, – 0.31 | 0.028 | –0.99 | –1.94, – 0.03 | 0.046 | |||
| Gut-proteolysis | 1.7 | 0.82, 2.59 | 0.004 | 1.25 | 0.49, 2.00 | 0.01 | |||
| R2/R2 adjusted | 0.653/0.584 | 0.831/0.797 | 0.945/0.917 | ||||||
Regression model following backwards stepwise regression based on Akaike information criterion (AIC). Thy1-haSyn-associated modules (univariate, unadjusted p < 0.05) were included following assessment for co-linearity. For age-associated modules, age and the age*module interaction effect were included. Analysis included the subset of samples with RNA-seq data from both tissues [n = 10 Thy1-haSyn (4 1 m, 6 3 m), n = 6 WT (3 1 m, 3 3 m)]. This subset was similar to the full sample with regard to Thy1-haSyn-associated modules (Supplementary Tables 9 and 10). CI, confidence interval.
Although aSyn is expressed in neurons, Thy1-haSyn-associated gut modules were either enriched for, or contained markers for, non-neuronal cell types, including epithelial cells (Gut-mito-QC, Gut-immune), macrophages (Gut-immune: CD68, Gpmnb, Emcn [47, 48]), enteroendocrine cells (Gut-ENS: Pam), and Paneth cells (Gut-mito-QC: Fabp4, Adipoq, Cfd, Agr2, Atg16l1 [49, 50]). While there are no Paneth cells in the colon, Paneth-cell-like cells may play roles in homeostasis and mucosal immune responses [51, 52].
We further explored the independence of gut changes in gene expression by constructing consensus WGCNA networks. These consensus networks contained modules that were present in both the colon and striatum (Supplementary Figure 8 in Supplementary File 1). One module (Supplementary Figure 9 in Supplementary File 1), enriched for terms related to mitochondria and aerobic respiration, was upregulated in the colon but downregulated in the striatum at one month and contained genes accounting for divergent GSEA results. Calculation of module preservation between the tissue-specific and consensus networks (Supplementary Figures 10 and 11 in Supplementary File 1) revealed that this module was specific to the consensus network as it did not correspond to a single module in the colon network. Gut modules independently associated with Thy1-haSyn in the combined gut-brain regression model were not preserved in the consensus network, further supporting that these modules represent gut-specific biology. Differences in the consensus and tissue-specific networks may partially be due to the smaller set of genes (n = 9,052) expressed in both tissues.
Colon and striatum modules are enriched for PD risk genes
We used the EMBL-EBI GWAS catalog to annotate genes in loci associated with increased risk of disease in GWA studies. In addition to PD, we annotated risk genes for inflammatory bowel disease (IBD) because of the epidemiological association between IBD and PD in some studies [53–55] and the presence of increased inflammation in colon biopsies from PD patients [56–63]. Risk genes for both PD and IBD were present in Thy1-haSyn-associated modules for striatum and colon (Table 3, Supplementary Tables 11 and 12 in Supplementary File 1). Thy1-haSyn-associated modules significantly enriched for PD risk genes (hypergeometric test) included (p): Brain-neuron (0.001), gut-ENS-precursors (0.029), and gut-cell-organization (0.033).
Bioenergetic profiling suggests increased metabolic demand in Thy1-haSyn colonic epithelium
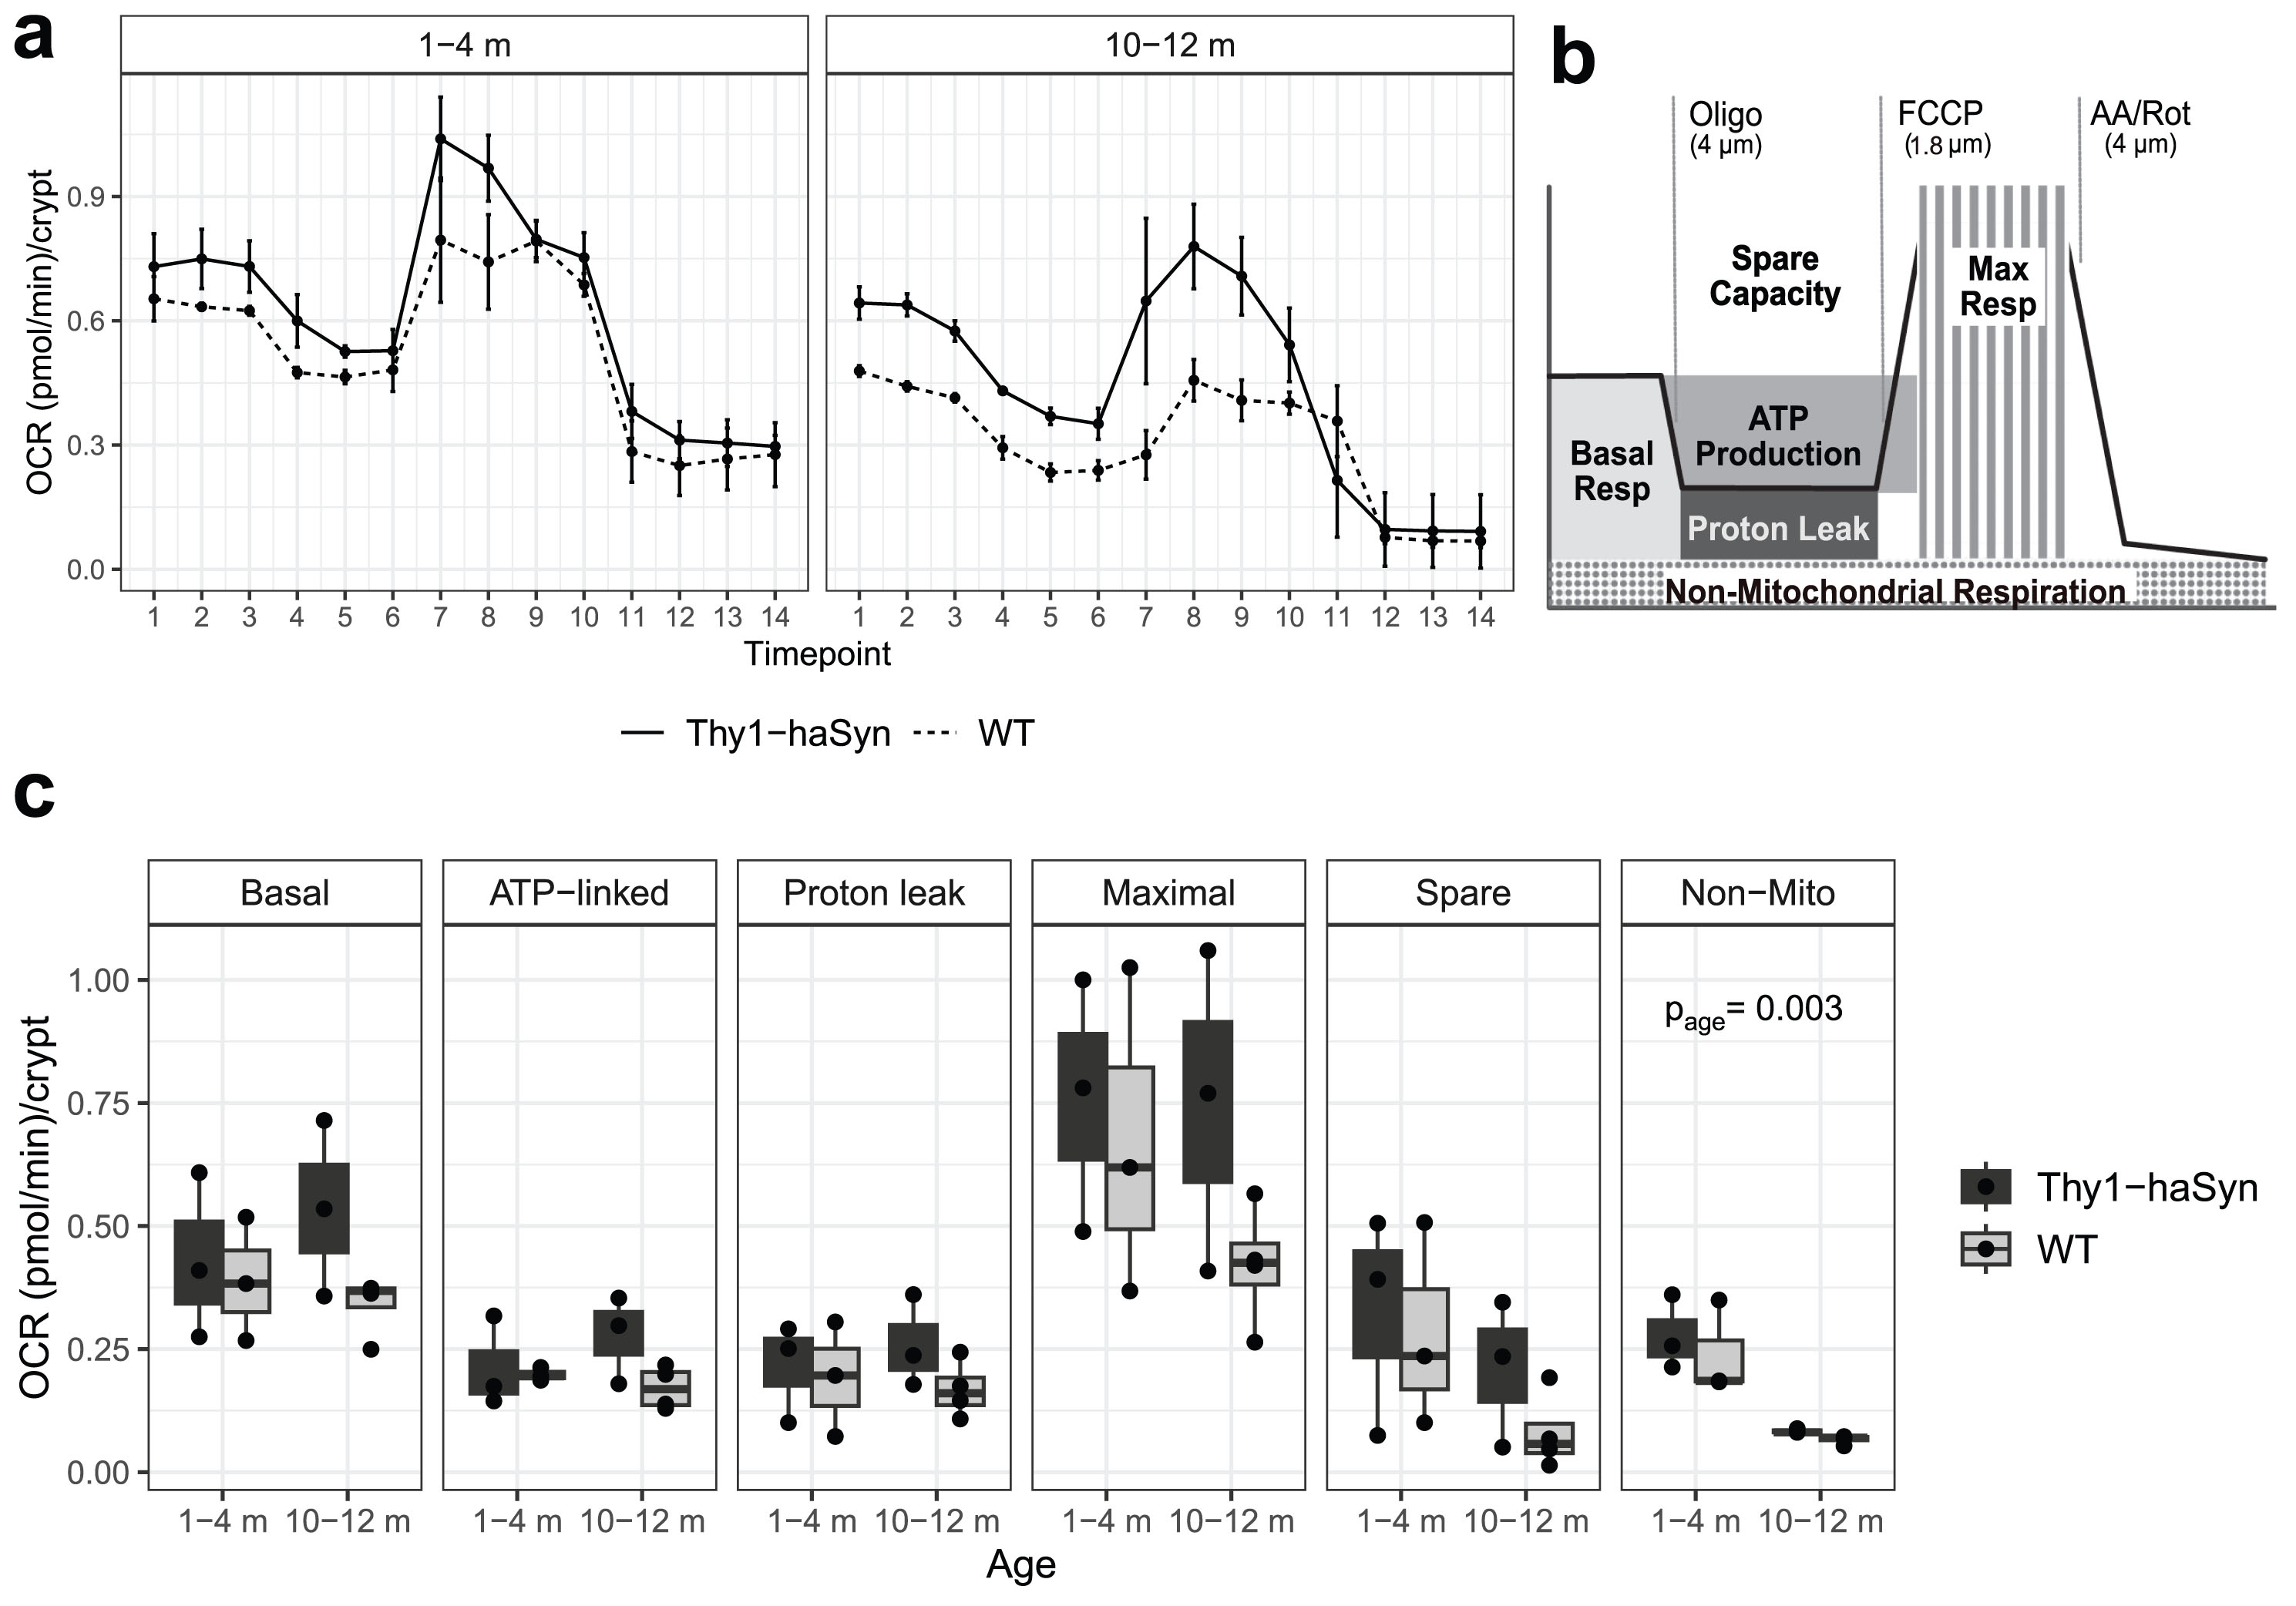
To further test whether mitochondrial metabolism was altered gut epithelial cells, we measured cellular respiration of freshly isolated colonic crypts from young (1–3 months) and adult (10–12 months) Thy1-haSyn and WT mice (Fig. 6, Supplementary Table 13 in Supplementary File 1). There were main effects of both age and genotype on oxygen consumption rate (OCR). OCR was decreased in adult vs. young mice and in Thy1-haSyn vs. WT (p < 0.005 for both). The genotype difference was most pronounced in adult mice, though the interaction effect of age and genotype was not statistically significant, likely due to sample size (Supplementary Table 5 in Supplementary File 1). Though only reaching statistical significance for non-mitochondrial respiration (p = 0.03), in adult mice, OCR was increased in Thy-haSyn vs. WT for all components of the bioenergetic profile: basal respiration (p = 0.09), ATP-linked respiration (p = 0.08), maximal respiration (p = 0.12), spare capacity (p = 0.19), and proton-leak-linked respiration (p = 0.17). This pattern suggests a state of overall increased metabolic activity that can be associated with increased energy demands [37]. Extracellular acidification rates mirrored OCR and were likely secondary to respiration and not glycolytic activity (Supplementary Figure 12 in Supplementary File 1).
Fig. 6
Increased oxygen consumption in Thy1-haSyn vs. WT colonic crypts. Oxygen consumption rate (OCR) of freshly isolated colonic crypts was measured by a Seahorse XF Analyzer. (A) OCR traces from n = 3-4 mice per group. Samples sizes and replicate wells per sample are shown in Supplementary Table 5. Error bars represent±SEM. (B) Schematic indicating timing of injections and description of rates in (C). m, months; Oligo, oligomycin; FCCP, carbonilcyanide p-triflouromethoxyphenylhydrazone; AA, antimycinn A; Rot, rotenone, Resp, respiration, Non-Mito, non-mitochondrial respiration; Thy1-haSyn, alpha-synuclein overexpressing; WT, wild type.
DISCUSSION
The main findings of this study are: 1) gene expression is dysregulated in both the gut and the brain in Thy1-haSyn mice at one month of age, which corresponds to the onset of haSyn overexpression, 2) gut and brain differential gene expression and enrichment of PD-relevant pathways is highly divergent at one month, and 3) gene expression and preliminary functional analyses support altered mitochondrial metabolism in colonic intestinal epithelial cells.
The results of this study support distinct gut and brain responses to haSyn. This is best supported by our regression analysis. If gut changes were simply a reflection of disease processes in the brain, we would expect Thy1-haSyn associated modules from each tissue to explain overlapping variance and to be strongly correlated, but addition of gut modules to the regression model significantly improved the fit. In addition, Thy1-haSyn-associated modules in the gut and brain were not highly correlated; rather, the strongest Thy1-haSyn striatum module (red) correlated with colon modules that were enriched for immune-related terms, which may implicate the gut-brain-immune axis in PD (Supplementary Table 14 in Supplementary File 1).
In cases where there was overlap in the genes that were dysregulated, the direction of dysregulation was opposite in the gut and the brain. In Thy1-haSyn mice (predominantly at one month), PD-relevant gene sets are downregulated (enriched in WT) in the brain but are upregulated (enriched in Thy1-haSyn) in the gut. The differences between gut and brain could be due to greater cellular heterogeneity in the colon including a smaller proportion of neurons; however, similarly opposite patterns have also been reported, specifically between dopaminergic neurons isolated from the enteric nervous system (ENS) and central nervous system (CNS) in an MPTP model [64].
The genes accounting for the observed discordant response are mostly related to mitochondrial function. Mitochondrial dysfunction is strongly implicated in the pathogenesis of both genetic and sporadic forms of PD as well as in aging and inflammatory bowel disease, both associated with PD [65–68]. Aging-related changes in mitochondrial and lysosomal pathways may contribute to increased disease susceptibility in aged animal models of disease [2, 69, 70]. While differences in the mitochondrial mass of enteric neurons from PD patients, and differences in expression of mitochondrial genes in PD colon biopsies have been previously reported [71, 72], we see evidence for alterations in epithelial cells both from gene expression profiling and respirometry in freshly isolated colon crypts. One possible functional consequence of these alterations is impaired intestinal homeostasis [73–76] resulting in reduced barrier integrity, which is seen in PD [57–59, 61, 63].
Most of our findings of differential gene expression between Thy1-haSyn and WT are at the one-month time point. While this was true in both the gut and the brain, the difference between genotypes was more pronounced in the colon. We can understand what accounts for the loss of differential expression at three months by looking at patterns of differential gene expression over time, which is best visualized in the third and fourth columns of the heatmap in Fig. 4 (“3 m vs. 1m” in Thy1-haSyn and WT). In the brain, the genotypes show the same direction of change from one to three months for all modules (modules increase or decrease in expression in both genotypes). In contrast, there is a genotype x time interaction effect for multiple gut modules— the direction of change with time is opposite in Thy1-haSyn and WT. In some cases, the lack of differential expression at three months is due to normalization of expression in the Thy1-haSyn mice between 1 and 3 months (expression in Thy1-haSyn becomes similar to WT); Gut-proteolysis is an example of such a case. In other cases, apparent normalization is due to WT expression ‘catching up’ with a persistent level of expression in the haSyn from 1 to 3 months. The former scenario can be thought of as an attenuation of the response to aSyn over time, which has been shown in other models of PD, including several using gut-seeded aSyn preformed fibrils [2, 77, 78].
Importantly, this normalization of differential gene expression over time is likely to represent attenuation of an early response to the increase in haSyn. Changes in gene expression resulting from phenotype progression are likely small at three months but would be expected to increase over time. Early changes in gene expression may represent adaptive changes to clear aSyn. This may explain why, despite increased gene expression differences in young mice, functional metabolic differences are larger in adult mice. Within our gene expression data, this is supported by increased proteolysis (Gut-proteolysis), decreased mammalian Target of Rapamycin (mTOR, Gut-TOR-signaling) signaling, and decreased growth factor signaling (Gut-proliferation), as TOR signaling is activated by growth factors. The combination of these modules suggest signaling that may both promote and release inhibition of autophagy, which is known to be an important protective mechanism in response to aSyn [79, 80]. Pro-inflammatory signaling (Gut-proteolysis) may also be protective, as acute but not chronic colitis reduced the amount of aSyn in mouse colon lysates [81]. In the same study, inflammation downregulated aSyn in primary rat ENS but not CNS cultures providing an additional example of distinct PD-related mechanisms in the gut and brain [81]. Our findings are in line with others in support of the overall relevance of gut inflammation in PD. Increased intestinal production of proinflammatory cytokines as well as increased intestinal permeability and enteric gliosis is evident in human PD [57, 59, 61, 63, 82, 83] and animal PD models [2, 61, 84–86], and in rodent models, intestinal inflammation is associated with microglial activation [87, 88], including in PD models [61, 84]. In addition, GI inflammation and increased epithelial permeability affect the severity or manifestation of PD phenotypes in rodent models [61, 84, 89, 90]. It is not clear why we do not see this dynamic response to haSyn (dysregulation at one month with normalization at three months) in the brain, but it is possible that it relates to the increased immune regulation of the gut vs. the brain. It is also not clear what accounts for some normalization of gut modules resulting from changes in WT from one to three months, but this is potentially due to maturation of the microbiome resulting in changes in both composition and metabolite production [91]. Our results suggest that aSyn may disrupt normal changes in the gut associated with age and the microbiome, both factors associated with PD [92–94].
Two other studies have used unbiased approaches to evaluate the gut in mouse models of PD and showed functional enrichment of terms and pathways similar to those in our study, such as protein ubiquitination [95], oxidative or cellular stress [95, 96], and apoptosis [96]. One study used a proteomic approach to look at the prodromal phase of PD in a mutated aSyn overexpression model (Thy1-SNCA-A30P) [95]. Of proteins differentially expressed in the colon, 138 were encoded by genes that were detected in our study and 115 were matched in direction of dysregulation (Supplementary Table 15 in Supplementary File 1). Nine were also differentially expressed in the gut in our study at 1 month (S100a10, Scgn, Endod1, Nsf, Mtpn, Tomm70a, Npepps, Pcbd1, Glod4, p value < 0.1, adjusted for n = 115). Using an unadjusted p value threshold of 0.05, an additional 13 and 5 were differentially expressed at one and three months, respectively.
A limitation of the current study is the smaller sample size for the brain relative to the gut. While the difference in sample size was by design (RNA was collected from brain tissue of about half of the mice) and not representative of bias, there was a notable difference in the unique read rate between the tissue with a much higher rate in the gut. This was due to the presence of BC1 RNA. A BC1 removal kit is currently recommended with 3’ sequencing in mouse brain samples, but this was not available when the current samples were sequenced. The decreased sample size and decreased depth of sequencing owing to the BC1 RNA may have contributed to reduced ability to detect differences in the brain. This limitation may account for the absence of strong signals related to microglial activation, as striatal microglial activation has been described in this mouse model at three months (increased proportion of microglial cells with larger diameters) [7]; however, increased cell body diameter may not be reflected in gene expression [97]. An additional limitation, potentially influencing the analysis of the results, is that the sample numbers per group differ, and that the sample size is limited for matched samples. Consequently, we may not detect biologically meaningful gut-brain interactions. An additional important consideration is that we used bulk RNA sequencing and findings can be due to changes in cell type composition. This may be particularly relevant for comparison of time points. Additional limitations are that we did not confirm reported central pathology at three months, that neither the gut nor the brain contain Lewy-type pathologies at the timepoints studied [7, 9, 92, 98, 99], and that respirometry in young mice did not distinguish between the time points studied in RNA-sequencing.
Importantly, Thy1-haSyn mice have simultaneous overexpression of haSyn in the central and peripheral nervous systems. Much recent research has explored brain-first versus body-first hypotheses of PD pathogenesis [100–102]. While evidence supports the existence of both mechanisms, recent evidence from humans strongly supports that these are distinct paradigms of disease pathogenesis, and that while disease my originate in the brain or the periphery, it does not start simultaneously in both places [103, 104]. This is a significant limitation to the interpretation of results from the animal model used in this study.
In conclusion, overexpression of aSyn results in distinct changes in the gut and brain, and thus, our findings add support to the view of PD as a multi-system disease. Our findings suggest the presence of gut-specific pathophysiologic mechanisms. Further understanding of these mechanisms may lead to the development of gut-targeted therapies, which hold the promise of slowing progression of PD or even stopping PD before debilitating motor symptoms occur.
ACKNOWLEDGMENTS
We would like to thank following groups and individuals: UCLA Neuroscience Genomics Core, Joe DeYoung, UCLA Center for Systems Biomedicine, Emmanuel Faure-Kumar, UCLA Mitochondrial and Metabolism Core, UCLA Drug Discovery Laboratory, Chris Elias, Michael Jun, Patricia Spillman, Geschwind Laboratory, Gokul Ramaswami, Yuyan Cheng, Jennifer Sakai, Jessica Rexach, Yvette Taché, Lixin Wang, Eric Esralian.
FUNDING
This work was supported by a UCLA CURE Digestive Diseases Research Center (P30DK041301) Pilot and Feasibility Study Award to EJV, a Rapid Pilot Award from the UCLA Claude Pepper Older Americans Independence Center (P30AG028748) to EJV, the NIH National Center for Advancing Translational Science (NCATS) UCLA CTSI Grant Number UL1TR001881, and the Vatche and Tamar Manoukian Division of Digestive Diseases at UCLA. EJV also received support from the Chan Zuckerberg Initiative Neurodegeneration Challenge Network, the NIH Loan Repayment Program (L30DK106759) and the UCLA Gastroenterology Training Grant (T32DK07180).
CONFLICT OF INTEREST
The authors have no conflict of interest to report.
DATA AVAILABILITY
Sequence data that support the findings of this study have been deposited in the NCBI SRA archive with the primary accession code PRJNA837335.
Interactive WGCNA networks are deposited on The Network Data Exchange (NDEx), Viewable at https://doi.org/10.18119/N9D31X (Colon) and https://doi.org/10.18119/N93K77 (Striatum).
All code used is available at https://github.com/videlock/Thy1-haSyn-Gut-Brain and https://github.com/videlock/SeahorseR.
SUPPLEMENTARY MATERIAL
[1] The supplementary material is available in the electronic version of this article: https://dx.doi.org/10.3233/JPD-223568.
REFERENCES
[1] | Schapira AHV , Chaudhuri KR , Jenner P ((2017) ) Non-motor features of Parkinson disease. Nat Rev Neurosci 18: , 509. |
[2] | Challis C , Hori A , Sampson TR , Yoo BB , Challis RC , Hamilton AM , Mazmanian SK , Volpicelli-Daley LA , Gradinaru V ((2020) ) Gut-seeded alpha-synuclein fibrils promote gut dysfunction and brain pathology specifically in aged mice. Nat Neurosci 23: , 327–336. |
[3] | Kim S , Kwon SH , Kam TI , Panicker N , Karuppagounder SS , Lee S , Lee JH , Kim WR , Kook M , Foss CA , Shen C , Lee H , Kulkarni S , Pasricha PJ , Lee G , Pomper MG , Dawson VL , Dawson TM , Ko HS ((2019) ) Transneuronal propagation of pathologic alpha-Synuclein from the gut to the brain models parkinson’s disease. Neuron 103: , 627–641.e7. |
[4] | Ahn EH , Kang SS , Liu X , Chen G , Zhang Z , Chandrasekharan B , Alam AM , Neish AS , Cao X , Ye K ((2020) ) Initiation of Parkinson’s disease from gut to brain by δ-secretase. Cell Res 30: , 70–87. |
[5] | Travagli RA , Browning KN , Camilleri M ((2020) ) Parkinson disease and the gut: new insights into pathogenesis and clinical relevance. Nat Rev Gastroenterol Hepatol 17: , 673–685. |
[6] | Chesselet M-F , Richter F , Zhu C , Magen I , Watson MB , Subramaniam SR ((2012) ) A progressive mouse model of Parkinson’s disease: the Thy1-aSyn (“Line 61”) mice. Neurotherapeutics 9: , 297–314. |
[7] | Watson MB , Richter F , Lee SK , Gabby L , Wu J , Masliah E , Effros RB , Chesselet MF ((2012) ) Regionally-specific microglial activation in young mice over-expressing human wildtype alpha-synuclein. Exp Neurol 237: , 318–334. |
[8] | Wang L , Fleming SM , Chesselet MF , Tache Y ((2008) ) Abnormal colonic motility in mice overexpressing human wild-type alpha-synuclein. Neuroreport 19: , 873–876. |
[9] | Wang L , Magen I , Yuan PQ , Subramaniam SR , Richter F , Chesselet MF , Tache Y ((2012) ) Mice overexpressing wild-type human alpha-synuclein display alterations in colonic myenteric ganglia and defecation. Neurogastroenterol Motil 24: , e425–36. |
[10] | Mootha VK , Lindgren CM , Eriksson KF , Subramanian A , Sihag S , Lehar J , Puigserver P , Carlsson E , Ridderstrale M , Laurila E , Houstis N , Daly MJ , Patterson N , Mesirov JP , Golub TR , Tamayo P , Spiegelman B , Lander ES , Hirschhorn JN , Altshuler D , Groop LC ((2003) ) PGC-1alpha-responsive genes involved in oxidative phosphorylation are coordinately downregulated in human diabetes. Nat Genet 34: , 267–273. |
[11] | Subramanian A , Tamayo P , Mootha VK , Mukherjee S , Ebert BL , Gillette MA , Paulovich A , Pomeroy SL , Golub TR , Lander ES , Mesirov JP ((2005) ) Gene set enrichment analysis: a knowledge-based approach for interpreting genome-wide expression profiles. Proc Natl Acad Sci U S A 102: , 15545–15550. |
[12] | Langfelder P , Horvath S ((2008) ) WGCNA: an R package for weighted correlation network analysis. BMC Bioinformatics 9: , 559. |
[13] | Pillich RT , Chen J , Rynkov V , Welker D , Pratt D ((2017) ) NDEx: a community resource for sharing and publishing of biological networks. Methods Mol Biol Clifton NJ 1558: , 271–301. |
[14] | Rockenstein E , Mallory M , Hashimoto M , Song D , Shults CW , Lang I , Masliah E ((2002) ) Differential neuropathological alterations in transgenic mice expressing alpha-synuclein from the platelet-derived growth factor and Thy-1 promoters. J Neurosci Res 68: , 568–578. |
[15] | Gabrielyan L , Liang H , Minalyan A , Hatami A , John V , Wang L ((2021) ) Behavioral deficits and brain α-Synuclein and phosphorylated serine-129 α-Synuclein in male and female mice overexpressing human α-Synuclein. J Alzheimers Dis 79: , 875–893. |
[16] | Moll P , Ante M , Seitz A , Reda T ((2014) ) QuantSeq 3′ mRNA sequencing for RNA quantification. Nat Methods 11: , i–iii. |
[17] | Robeck T , Skryabin BV , Rozhdestvensky TS , Skryabin AB , Brosius J ((2016) ) BC1 RNA motifs required for dendritic transport. Sci Rep 6: , 28300. |
[18] | Bushnell B , Rood J , Singer E ((2017) ) BBMerge – Accurate paired shotgun read merging via overlap. PLoS One 12: , e0185056. |
[19] | Dobin A , Davis CA , Schlesinger F , Drenkow J , Zaleski C , Jha S , Batut P , Chaisson M , Gingeras TR ((2013) ) STAR: ultrafast universal RNA-seq aligner. Bioinformatics 29: , 15–21. |
[20] | Oldham MC , Langfelder P , Horvath S ((2012) ) Network methods for describing sample relationships in genomic datasets: application to Huntington’s disease. BMC Syst Biol 6: , 63. |
[21] | Love MI , Huber W , Anders S ((2014) ) Moderated estimation of fold change and dispersion for RNA-seq data with DESeq2. Genome Biol 15: , 550. |
[22] | Broad Institute Picard Tools. https://broadinstitute.github.io/picard/. |
[23] | Ramaswami G , Won H , Gandal MJ , Haney J , Wang JC , Wong CCY , Sun W , Prabhakar S , Mill J , Geschwind DH ((2020) ) Integrative genomics identifies a convergent molecular subtype that links epigenomic with transcriptomic differences in autism. Nat Commun 11: , 4873. |
[24] | R Core Team ((2021) ) R: A language and environment for statistical computing, Vienna, Austria. |
[25] | Ritchie ME , Phipson B , Wu D , Hu Y , Law CW , Shi W , Smyth GK ((2015) ) limma powers differential expression analyses for RNA-sequencing and microarray studies. Nucleic Acids Res 43: , e47. |
[26] | Cahill KM , Huo Z , Tseng GC , Logan RW , Seney ML ((2018) ) Improved identification of concordant and discordant gene expression signatures using an updated rank-rank hypergeometric overlap approach. Sci Rep 8: , 9588. |
[27] | Ashburner M , Ball CA , Blake JA , Botstein D , Butler H , Cherry JM , Davis AP , Dolinski K , Dwight SS , Eppig JT , Harris MA , Hill DP , Issel-Tarver L , Kasarskis A , Lewis S , Matese JC , Richardson JE , Ringwald M , Rubin GM , Sherlock G ((2000) ) Gene ontology: tool for the unification of biology. The Gene Ontology Consortium. Nat Genet 25: , 25–29. |
[28] | Kanehisa M , Goto S ((2000) ) KEGG: kyoto encyclopedia of genes and genomes. Nucleic Acids Res 28: , 27–30. |
[29] | Merico D , Isserlin R , Stueker O , Emili A , Bader GD ((2010) ) Enrichment map: a network-based method for gene-set enrichment visualization and interpretation. PloS One 5: , e13984. |
[30] | Shannon P , Markiel A , Ozier O , Baliga NS , Wang JT , Ramage D , Amin N , Schwikowski B , Ideker T ((2003) ) Cytoscape: a software environment for integrated models of biomolecular interaction networks. Genome Res 13: , 2498–2504. |
[31] | Falcon S , Gentleman R ((2007) ) Using GOstats to test gene lists for GO term association. Bioinformatics 23: , 257–258. |
[32] | Bindea G , Mlecnik B , Hackl H , Charoentong P , Tosolini M , Kirilovsky A , Fridman W-H , Pagès F , Trajanoski Z , Galon J ((2009) ) ClueGO: a Cytoscape plug-in to decipher functionally grouped gene ontology and pathway annotation networks. Bioinformatics 25: , 1091–1093. |
[33] | Franzán O , Gan L-M , Björkegren JLM ((2019) ) PanglaoDB: a web server for exploration of mouse and human single-cell RNA sequencing data. Database J Biol Databases Curation 2019: , baz046. |
[34] | Zhang X , Lan Y , Xu J , Quan F , Zhao E , Deng C , Luo T , Xu L , Liao G , Yan M , Ping Y , Li F , Shi A , Bai J , Zhao T , Li X , Xiao Y ((2019) ) CellMarker: a manually curated resource of cell markers in human and mouse. Nucleic Acids Res 47: , D721–D728. |
[35] | Hellevik O ((2009) ) Linear versus logistic regression when the dependent variable is a dichotomy. Qual Quant 43: , 59–74. |
[36] | Fan Y-Y , Davidson LA , Callaway ES , Wright GA , Safe S , Chapkin RS ((2015) ) A bioassay to measure energy metabolism in mouse colonic crypts, organoids, and sorted stem cells. Am J Physiol Gastrointest Liver Physiol 309: , G1–G9. |
[37] | Divakaruni AS , Paradyse A , Ferrick DA , Murphy AN , Jastroch M ((2014) ) Analysis and interpretation of microplate-based oxygen consumption and pH data. Methods Enzymol 547: , 309–354. |
[38] | Wood SN ((2011) ) Fast stable restricted maximum likelihood and marginal likelihood estimation of semiparametric generalized linear models. J R Stat Soc Ser B Stat Methodol 73: , 3–36. |
[39] | Spurlock B , Gupta P , Basu MK , Mukherjee A , Hjelmeland AB , Darley-Usmar V , Parker D , Foxall ME , Mitra K ((2019) ) New quantitative approach reveals heterogeneity in mitochondrial structure– function relations in tumor-initiating cells. J Cell Sci 132: , jcs230755. |
[40] | Beach TG , Corbille AG , Letournel F , Kordower JH , Kremer T , Munoz DG , Intorcia A , Hentz J , Adler CH , Sue LI , Walker J , Serrano G , Derkinderen P ((2016) ) Multicenter assessment of immunohistochemical methods for pathological alpha-synuclein in sigmoid colon of autopsied parkinson’s disease and control subjects. J Parkinsons Dis 6: , 761–770. |
[41] | Wakabayashi K , Takahashi H , Ohama E , Ikuta F ((1990) ) Parkinson’s disease: an immunohistochemical study of Lewy body-containing neurons in the enteric nervous system. Acta Neuropathol (Berl) 79: , 581–583. |
[42] | Villa E , Proïcs E , Rubio-Patiño C , Obba S , Zunino B , Bossowski JP , Rozier RM , Chiche J , Mondragón L , Riley JS , Marchetti S , Verhoeyen E , Tait SWG , Ricci J-E ((2017) ) Parkin-independent mitophagy controls chemotherapeutic response in cancer cells. Cell Rep 20: , 2846–2859. |
[43] | Parelkar SS , Cadena JG , Kim C , Wang Z , Sugal R , Bentley B , Moral L , Ardley HC , Schwartz LM ((2012) ) The parkin-like human homolog of Drosophila ariadne-1 (HHARI) can induce aggresome formation in mammalian cells and is immunologically detectable in Lewy bodies. J Mol Neurosci 46: , 109–121. |
[44] | Meng H , Yamashita C , Shiba-Fukushima K , Inoshita T , Funayama M , Sato S , Hatta T , Natsume T , Umitsu M , Takagi J , Imai Y , Hattori N ((2017) ) Loss of Parkinson’s disease-associated protein CHCHD2 affects mitochondrial crista structure and destabilizes cytochrome c. Nat Commun 8: , 15500. |
[45] | McGlinchey RP , Lee JC ((2015) ) Cysteine cathepsins are essential in lysosomal degradation of α-synuclein. Proc Natl Acad Sci U S A 112: , 9322–9327. |
[46] | Cullen V , Lindfors M , Ng J , Paetau A , Swinton E , Kolodziej P , Boston H , Saftig P , Woulfe J , Feany MB , Myllykangas L , Schlossmacher MG , Tyynelä J ((2009) ) Cathepsin D expression level affects alpha-synuclein processing, aggregation, and toxicity. Mol Brain 2: , 5. |
[47] | De Schepper S , Stakenborg N , Matteoli G , Verheijden S , Boeckxstaens GE ((2018) ) Muscularis macrophages: Key players in intestinal homeostasis and disease. Cell Immunol 330: , 142–150. |
[48] | Sasaki F , Kumagai K , Uto H , Takami Y , Kure T , Tabu K , Nasu Y , Hashimoto S , Kanmura S , Numata M , Moriuchi A , Sakiyama T , Tsubouchi H , Ido A ((2015) ) Expression of glycoprotein nonmetastatic melanoma protein B in macrophages infiltrating injured mucosa is associated with the severity of experimental colitis in mice. Mol Med Rep 12: , 7503–7511. |
[49] | de Lange KM , Moutsianas L , Lee JC , Lamb CA , Luo Y , Kennedy NA , Jostins L , Rice DL , Gutierrez-Achury J , Ji S-G , Heap G , Nimmo ER , Edwards C , Henderson P , Mowat C , Sanderson J , Satsangi J , Simmons A , Wilson DC , Tremelling M , Hart A , Mathew CG , Newman WG , Parkes M , Lees CW , Uhlig H , Hawkey C , Prescott NJ , Ahmad T , Mansfield JC , Anderson CA , Barrett JC ((2017) ) Genome-wide association study implicates immune activation of multiple integrin genes in inflammatory bowel disease. Nat Genet 49: , 256–261. |
[50] | McGovern DPB , Gardet A , Törkvist L , Goyette P , Essers J , Taylor KD , Neale BM , Ong RTH , Lagac’e C , Li C , Green T , Stevens CR , Beauchamp C , Fleshner PR , Carlson M , D’Amato M , Halfvarson J , Hibberd ML , Lördal M , Padyukov L , Andriulli A , Colombo E , Latiano A , Palmieri O , Bernard E-J , Deslandres C , Hommes DW , de Jong DJ , Stokkers PC , Weersma RK , Sharma Y , Silverberg MS , Cho JH , Wu J , Roeder K , Brant SR , Schumm LP , Duerr RH , Dubinsky MC , Glazer NL , Haritunians T , Ippoliti A , Melmed GY , Siscovick DS , Vasiliauskas EA , Targan SR , Annese V , Wijmenga C , Pettersson S , Rotter JI , Xavier RJ , Daly MJ , Rioux JD , Seielstad M ((2010) ) Genome-wide association identifies multiple ulcerative colitis susceptibility loci. Nat Genet 42: , 332–337. |
[51] | Qi H , Wei J , Gao Y , Yang Y , Li Y , Zhu H , Su L , Su X , Zhang Y , Yang R ((2020) ) Reg4 and complement factor D prevent the overgrowth of E. coli in the mouse gut. Commun Biol 3: , 483. |
[52] | Sasaki N , Sachs N , Wiebrands K , Ellenbroek SI , Fumagalli A , Lyubimova A , Begthel H , van den Born M , van Es JH , Karthaus WR , Li VS , Lopez-Iglesias C , Peters PJ , van Rheenen J , van Oudenaarden A , Clevers H ((2016) ) Reg4+ deep crypt secretory cells function as epithelial niche for Lgr5+ stem cells in colon. Proc Natl Acad Sci U S A 113: , E5399–E5407. |
[53] | Lai S-W , Kuo Y-H , Liao K-F ((2019) ) Increased risk of parkinson disease in inflammatory bowel disease patients. Inflamm Bowel Dis 25: , e125–e126. |
[54] | Lin JC , Lin CS , Hsu CW , Lin CL , Kao CH ((2016) ) Association between parkinson’s disease and inflammatory bowel disease: a nationwide taiwanese retrospective cohort study. Inflamm Bowel Dis 22: , 1049–1055. |
[55] | Peter I , Dubinsky M , Bressman S , Park A , Lu C , Chen N , Wang A ((2018) ) Anti-tumor necrosis factor therapy and incidence of parkinson disease among patients with inflammatory bowel disease. JAMA Neurol 75: , 939–946. |
[56] | Aho VTE , Houser MC , Pereira PAB , Chang J , Rudi K , Paulin L , Hertzberg V , Auvinen P , Tansey MG , Scheperjans F ((2021) ) Relationships of gut microbiota, short-chain fatty acids, inflammation, and the gut barrier in Parkinson’s disease. Mol Neurodegener 16: , 6. |
[57] | Devos D , Lebouvier T , Lardeux B , Biraud M , Rouaud T , Pouclet H , Coron E , Bruley des Varannes S , Naveilhan P , Nguyen JM , Neunlist M , Derkinderen P ((2013) ) Colonic inflammation in parkinson’s disease. Neurobiol Dis 50: , 42–48. |
[58] | Dumitrescu L , Marta D , Dănău A , Lefter A , Tulbă D , Cozma L , Manole E , Gherghiceanu M , Ceafalan LC , Popescu BO ((2021) ) Serum and fecal markers of intestinal inflammation and intestinal barrier permeability are elevated in Parkinson’s disease. Front Neurosci 15: , 689723. |
[59] | Forsyth CB , Shannon KM , Kordower JH , Voigt RM , Shaikh M , Jaglin JA , Estes JD , Dodiya HB , Keshavarzian A ((2011) ) Increased intestinal permeability correlates with sigmoid mucosa alpha-synuclein staining and endotoxin exposure markers in early Parkinson’s disease. PLoS One 6: , e28032. |
[60] | Mulak A , Koszewicz M , Panek-Jeziorna M , Koziorowska-Gawron E , Budrewicz S ((2019) ) Fecal calprotectin as a marker of the gut immune system activation is elevated in parkinson’s disease. Serotonin Recept Neurobiol 13: , 992. |
[61] | Perez-Pardo P , Dodiya HB , Engen PA , Forsyth CB , Huschens AM , Shaikh M , Voigt RM , Naqib A , Green SJ , Kordower JH , Shannon KM , Garssen J , Kraneveld AD , Keshavarzian A ((2019) ) Role of TLR4 in the gut-brain axis in Parkinson’s disease: a translational study from men to mice. Gut 68: , 829–843. |
[62] | Rolli-Derkinderen M , Leclair-Visonneau L , Bourreille A , Coron E , Neunlist M , Derkinderen P ((2020) ) Is Parkinson’s disease a chronic low-grade inflammatory bowel disease? J Neurol 267: , 2207–2213. |
[63] | Schwiertz A , Spiegel J , Dillmann U , Grundmann D , Burmann J , Fassbender K , Schafer KH , Unger MM ((2018) ) Fecal markers of intestinal inflammation and intestinal permeability are elevated in Parkinson’s disease. Parkinsonism Relat Disord 50: , 104–107. |
[64] | Liu X , Du Z-R , Wang X , Luk K-H , Chan C-H , Cao X , Zhao Q , Zhao F , Wong W-T , Wong K-H , Dong X-L ((2021) ) Colonic dopaminergic neurons changed reversely with those in the midbrain via gut microbiota-mediated autophagy in a chronic Parkinson’s disease mice model. Front Aging Neurosci 13: , 649627. |
[65] | Billingsley KJ , Barbosa IA , Bandrás-Ciga S , Quinn JP , Bubb VJ , Deshpande C , Botia JA , Reynolds RH , Zhang D , Simpson MA , Blauwendraat C , Gan-Or Z , Gibbs JR , Nalls MA , Singleton A ; International Parkinson’s Disease Genomics Consortium (IPDGC); Ryten M , Koks S ((2019) ) Mitochondria function associated genes contribute to Parkinson’s disease risk and later age at onset. NPJ Parkinsons Dis 5: , 8. |
[66] | Santhanam S , Rajamanickam S , Motamarry A , Ramakrishna BS , Amirtharaj JG , Ramachandran A , Pulimood A , Venkatraman A ((2012) ) Mitochondrial electron transport chain complex dysfunction in the colonic mucosa in ulcerative colitis. Inflamm Bowel Dis 18: , 2158–2168. |
[67] | Khaloian S , Rath E , Hammoudi N , Gleisinger E , Blutke A , Giesbertz P , Berger E , Metwaly A , Waldschmitt N , Allez M , Haller D ((2020) ) Mitochondrial impairment drives intestinal stem cell transition into dysfunctional Paneth cells predicting Crohn’s disease recurrence. Gut 69: , 1939–1951. |
[68] | Vincent G , Novak EA , Siow VS , Cunningham KE , Griffith BD , Comerford TE , Mentrup HL , Stolz DB , Loughran P , Ranganathan S , Mollen KP ((2020) ) Nix-mediated mitophagy modulates mitochondrial damage during intestinal inflammation. Antioxid Redox Signal 33: , 1–19. |
[69] | Klæstrup IH , Just MK , Holm KL , Alstrup AKO , Romero-Ramos M , Borghammer P , Van Den Berge N ((2022) ) Impact of aging on animal models of Parkinson’s disease. Front Aging Neurosci 14: , 909273. |
[70] | Van Den Berge N , Ferreira N , Mikkelsen TW , Alstrup AKO , Tamgüney G , Karlsson P , Terkelsen AJ , Nyengaard JR , Jensen PH , Borghammer P ((2021) ) Ageing promotes pathological alpha-synuclein propagation and autonomic dysfunction in wild-type rats. Brain 144: , 1853–1868. |
[71] | Baumuratov AS , Antony PM , Ostaszewski M , He F , Salamanca L , Antunes L , Weber J , Longhino L , Derkinderen P , Koopman WJ , Diederich NJ ((2016) ) Enteric neurons from Parkinson’s disease patients display ex vivo aberrations in mitochondrial structure. Sci Rep 6: , 33117. |
[72] | Cossais F , Schaeffer E , Heinzel S , Zimmermann J , Niesler B , Röth R , Rappold G , Scharf A , Zorenkov D , Lange C , Barrenschee M , Margraf NG , Ellrichmann M , Berg D , Böttner M , Wedel T ((2021) ) Expression profiling of rectal biopsies suggests altered enteric neuropathological traits in Parkinson’s disease patients. J Parkinsons Dis 11: , 171–176. |
[73] | Berger E , Rath E , Yuan D , Waldschmitt N , Khaloian S , Allgauer M , Staszewski O , Lobner EM , Schottl T , Giesbertz P , Coleman OI , Prinz M , Weber A , Gerhard M , Klingenspor M , Janssen KP , Heikenwalder M , Haller D ((2016) ) Mitochondrial function controls intestinal epithelial stemness and proliferation. Nat Commun 7: , 13171. |
[74] | Rath E , Moschetta A , Haller D ((2018) ) Mitochondrial function - gatekeeper of intestinal epithelial cell homeostasis. Nat Rev Gastroenterol Hepatol 15: , 497–516. |
[75] | Rodríguez-Colman MJ , Schewe M , Meerlo M , Stigter E , Gerrits J , Pras-Raves M , Sacchetti A , Hornsveld M , Oost KC , Snippert HJ , Verhoeven-Duif N , Fodde R , Burgering BMT ((2017) ) Interplay between metabolic identities in the intestinal crypt supports stem cell function. Nature 543: , 424–427. |
[76] | Barker N ((2014) ) Adult intestinal stem cells: critical drivers of epithelial homeostasis and regeneration. Nat Rev Mol Cell Biol 15: , 19–33. |
[77] | Manfredsson FP , Luk KC , Benskey MJ , Gezer A , Garcia J , Kuhn NC , Sandoval IM , Patterson JR , O’Mara A , Yonkers R , Kordower JH ((2018) ) Induction of alpha-synuclein pathology in the enteric nervous system of the rat and non-human primate results in gastrointestinal dysmotility and transient CNS pathology. Neurobiol Dis 112: , 106–118. |
[78] | Uemura N , Yagi H , Uemura MT , Hatanaka Y , Yamakado H , Takahashi R ((2018) ) Inoculation of alpha-synuclein preformed fibrils into the mouse gastrointestinal tract induces Lewy body-like aggregates in the brainstem via the vagus nerve. Mol Neurodegener 13: , 21. |
[79] | Kim C , Rockenstein E , Spencer B , Kim H-K , Adame A , Trejo M , Stafa K , Lee H-J , Lee S-J , Masliah E ((2015) ) Antagonizing neuronal toll-like receptor 2 prevents synucleinopathy by activating autophagy. Cell Rep 13: , 771–782. |
[80] | Heras-Sandoval D , Párez-Rojas JM , Pedraza-Chaverri J ((2020) ) Novel compounds for the modulation of mTOR and autophagy to treat neurodegenerative diseases. Cell Signal 65: , 109442. |
[81] | Prigent A , Gonzales J , Durand T , Le Berre-Scoul C , Rolli-Derkinderen M , Neunlist M , Derkinderen P ((2019) ) Acute inflammation down-regulates alpha-synuclein expression in enteric neurons. J Neurochem 148: , 746–760. |
[82] | Clairembault T , Leclair-Visonneau L , Coron E , Bourreille A , Le Dily S , Vavasseur F , Heymann M-F , Neunlist M , Derkinderen P ((2015) ) Structural alterations of the intestinal epithelial barrier in Parkinson’s disease. Acta Neuropathol Commun 3: , 12. |
[83] | Clairembault T , Kamphuis W , Leclair-Visonneau L , Rolli-Derkinderen M , Coron E , Neunlist M , Hol EM , Derkinderen P ((2014) ) Enteric GFAP expression and phosphorylation in Parkinson’s disease. J Neurochem 130: , 805–815. |
[84] | Dodiya HB , Forsyth CB , Voigt RM , Engen PA , Patel J , Shaikh M , Green SJ , Naqib A , Roy A , Kordower JH , Pahan K , Shannon KM , Keshavarzian A ((2020) ) Chronic stress-induced gut dysfunction exacerbates Parkinson’s disease phenotype and pathology in a rotenone-induced mouse model of Parkinson’s disease. Neurobiol Dis 135: , 104352. |
[85] | Feng XY , Yang J , Zhang X , Zhu J ((2019) ) Gastrointestinal non-motor dysfunction in Parkinson’s disease model rats with 6-hydroxydopamine. Physiol Res 68: , 295–303. |
[86] | Kelly LP , Carvey PM , Keshavarzian A , Shannon KM , Shaikh M , Bakay RAE , Kordower JH ((2014) ) Progression of intestinal permeability changes and alpha-synuclein expression in a mouse model of Parkinson’s disease. Mov Disord 29: , 999–1009. |
[87] | Do J , Woo J ((2018) ) From gut to brain: alteration in inflammation markers in the brain of dextran sodium sulfate-induced colitis model mice. Clin Psychopharmacol Neurosci 16: , 422–433. |
[88] | Riazi K , Galic MA , Kentner AC , Reid AY , Sharkey KA , Pittman QJ ((2015) ) Microglia-dependent alteration of glutamatergic synaptic transmission and plasticity in the hippocampus during peripheral inflammation. J Neurosci 35: , 4942–4952. |
[89] | Kishimoto Y , Zhu W , Hosoda W , Sen JM , Mattson MP ((2019) ) Chronic mild gut inflammation accelerates brain neuropathology and motor dysfunction in alpha-Synuclein mutant mice. Neuromolecular Med 21: , 239–249. |
[90] | Matheoud D , Cannon T , Voisin A , Penttinen A-M , Ramet L , Fahmy AM , Ducrot C , Laplante A , Bourque M-J , Zhu L , Cayrol R , Le Campion A , McBride HM , Gruenheid S , Trudeau L-E , Desjardins M ((2019) ) Intestinal infection triggers Parkinson’s disease-like symptoms in Pink1– /– mice. Nature 571: , 565–569. |
[91] | van Best N , Rolle-Kampczyk U , Schaap FG , Basic M , Olde Damink SWM , Bleich A , Savelkoul PHM , von Bergen M , Penders J , Hornef MW ((2020) ) Bile acids drive the newborn’s gut microbiota maturation. Nat Commun 11: , 3692. |
[92] | Sampson TR , Debelius JW , Thron T , Janssen S , Shastri GG , Ilhan ZE , Challis C , Schretter CE , Rocha S , Gradinaru V , Chesselet MF , Keshavarzian A , Shannon KM , Krajmalnik-Brown R , Wittung-Stafshede P , Knight R , Mazmanian SK ((2016) ) Gut microbiota regulate motor deficits and neuroinflammation in a model of Parkinson’s disease. Cell 167: , 1469–1480 e12. |
[93] | Sampson T ((2020) ) The impact of indigenous microbes on Parkinson’s disease. Neurobiol Dis 135: , 104426. |
[94] | Elfil M , Kamel S , Kandil M , Koo BB , Schaefer SM ((2020) ) Implications of the gut microbiome in parkinson’s disease. Mov Disord 35: , 921–933. |
[95] | Gries M , Christmann A , Schulte S , Weyland M , Rommel S , Martin M , Baller M , Röth R , Schmitteckert S , Unger M , Liu Y , Sommer F , Mühlhaus T , Schroda M , Timmermans J-P , Pintelon I , Rappold GA , Britschgi M , Lashuel H , Menger MD , Laschke MW , Niesler B , Schäfer K-H ((2021) ) Parkinson mice show functional and molecular changes in the gut long before motoric disease onset. Mol Neurodegener 16: , 34. |
[96] | Gil-Martinez AL , Cuenca-Bermejo L , Gonzalez-Cuello AM , Sanchez-Rodrigo C , Parrado A , Vyas S , Fernandez-Villalba E , Herrero MT ((2020) ) Identification of differentially expressed genes profiles in a combined mouse model of Parkinsonism and colitis. Sci Rep 10: , 13147. |
[97] | Roshanbin S , Aniszewska A , Gumucio A , Masliah E , Erlandsson A , Bergström J , Ingelsson M , Ekmark-Lewán S ((2021) ) Age-related increase of alpha-synuclein oligomers is associated with motor disturbances in L61 transgenic mice. Neurobiol Aging 101: , 207–220. |
[98] | Sampson TR , Challis C , Jain N , Moiseyenko A , Ladinsky MS , Shastri GG , Thron T , Needham BD , Horvath I , Debelius JW , Janssen S , Knight R , Wittung-Stafshede P , Gradinaru V , Chapman M , Mazmanian SK ((2020) ) A gut bacterial amyloid promotes alpha-synuclein aggregation and motor impairment in mice. Elife 9: , e53111. |
[99] | Gorecki AM , Preskey L , Bakeberg MC , Kenna JE , Gildenhuys C , MacDougall G , Dunlop SA , Mastaglia FL , Akkari PA , Koengten F , Anderton RS ((2019) ) Altered gut microbiome in Parkinson’s disease and the influence of lipopolysaccharide in a human α-synuclein over-expressing mouse model. Front Neurosci 13: , 839. |
[100] | Borghammer P , Horsager J , Andersen K , Van Den Berge N , Raunio A , Murayama S , Parkkinen L , Myllykangas L ((2021) ) Neuropathological evidence of body-first vs. brain-first Lewy body disease. Neurobiol Dis 161: , 105557. |
[101] | Horsager J , Andersen KB , Knudsen K , Skjaerbaek C , Fedorova TD , Okkels N , Schaeffer E , Bonkat SK , Geday J , Otto M , Sommerauer M , Danielsen EH , Bech E , Kraft J , Munk OL , Hansen SD , Pavese N , Goder R , Brooks DJ , Berg D , Borghammer P ((2020) ) Brain-first versus body-first Parkinson’s disease: a multimodal imaging case-control study. Brain 143: , 3077–3088. |
[102] | Van Den Berge N , Ulusoy A ((2022) ) Animal models of brain-first and body-first Parkinson’s disease. Neurobiol Dis 163: , 105599. |
[103] | Borghammer P , Just MK , Horsager J , Skjærbæk C , Raunio A , Kok EH , Savola S , Murayama S , Saito Y , Myllykangas L , Van Den Berge N ((2022) ) A postmortem study suggests a revision of the dual-hit hypothesis of Parkinson’s disease. NPJ Parkinsons Dis 8: , 166. |
[104] | Knudsen K , Fedorova TD , Horsager J , Andersen KB , Skjærbæk C , Berg D , Schaeffer E , Brooks DJ , Pavese N , Van Den Berge N , Borghammer P ((2021) ) Asymmetric dopaminergic dysfunction in brain-first versus body-first Parkinson’s disease subtypes. J Parkinsons Dis 11: , 1677–1687. |


