
Quantitative Sleep Electroencephalogram in Parkinson’s Disease: A Case-Control Study
Abstract
Background:
Sleep disorders are common in Parkinson’s disease (PD) and include alterations in sleep-related EEG oscillations.
Objective:
This case-control study tested the hypothesis that patients with PD would have a lower density of Scalp-Slow Wave (SW) oscillations and higher slow-to-fast frequencies ratio in rapid eye movement (REM) sleep than non-PD controls. Other sleep-related quantitative EEG (qEEG) features were also examined, including SW morphology, sleep spindles, and Scalp-SW spindle phase-amplitude coupling.
Methods:
Polysomnography (PSG)-derived sleep EEG was compared between PD participants (n = 56) and non-PD controls (n = 30). Following artifact rejection, sleep qEEG analysis was performed in frontal and central leads. Measures included SW density and morphological features of SW and sleep spindles, SW-spindle phase-amplitude coupling, and spectral power analysis in Non-REM (NREM) and REM. Differences in qEEG features between PD and non-PD controls were compared using two-tailed Welch’s t-tests, and correction for multiple comparisons was performed per the Benjamini-Hochberg method.
Results:
SW density was lower in PD than in non-PD controls (F = 13.5, p’ = 0.003). The PD group also exhibited higher ratio of slow REM EEG frequencies (F = 4.23, p’ = 0.013), higher slow spindle peak frequency (F = 24.7, p’ < 0.002), and greater SW-spindle coupling angle distribution non-uniformity (strength) (F = 7.30, p’ = 0.034).
Conclusion:
This study comprehensively evaluates sleep qEEG including SW-spindle phase amplitude coupling in PD compared to non-PD controls. These findings provide novel insights into how neurodegenerative disease disrupts electrophysiological sleep rhythms. Considering the role of sleep oscillatory activity on neural plasticity, future studies should investigate the influence of these qEEG markers on cognition in PD.
INTRODUCTION
The fundamental biological process of sleep is governed by neurophysiological rhythms in the brain [1]. Sleep serves a variety of vital functions across an individual’s lifespan and is severely compromised in neurodegenerative diseases such as Parkinson’s disease (PD) and Alzheimer’s disease (AD) [2, 3]. While PD was historically defined primarily as a neurodegenerative motor disorder, we have gained increased understanding of the disorder’s non-motor manifestations [4]. In particular, there is a crucial connection between PD and sleep dysfunction [5]. Indeed, sleep disorders are the second most frequent non-motor complaint among a large cohort of PD patients (PRIAMO study), affecting 64% of patients [6]. A better understanding of how PD disrupts electrophysiological rhythms of sleep may lead to new therapeutic options for treating this significant and disabling symptom. With this goal in mind, the objective of this case-control study was to comprehensively compare quantitative sleep electroencephalograms (qEEGs) between PD patients and non-PD group-matched controls. This qEEG analysis encompasses evaluation of the density and morphology of oscillations during non-rapid eye movement (NREM) sleep, including slow waves and sleep spindles; slow wave-spindle phase amplitude coupling; and spectral power analysis during NREM stage 3 (N3) and REM (Table 1).
Table 1
Variables Analyzed
| Morphology | Illustration | Relevance |
| Scalp Slow Wave (SW)<1Hz | 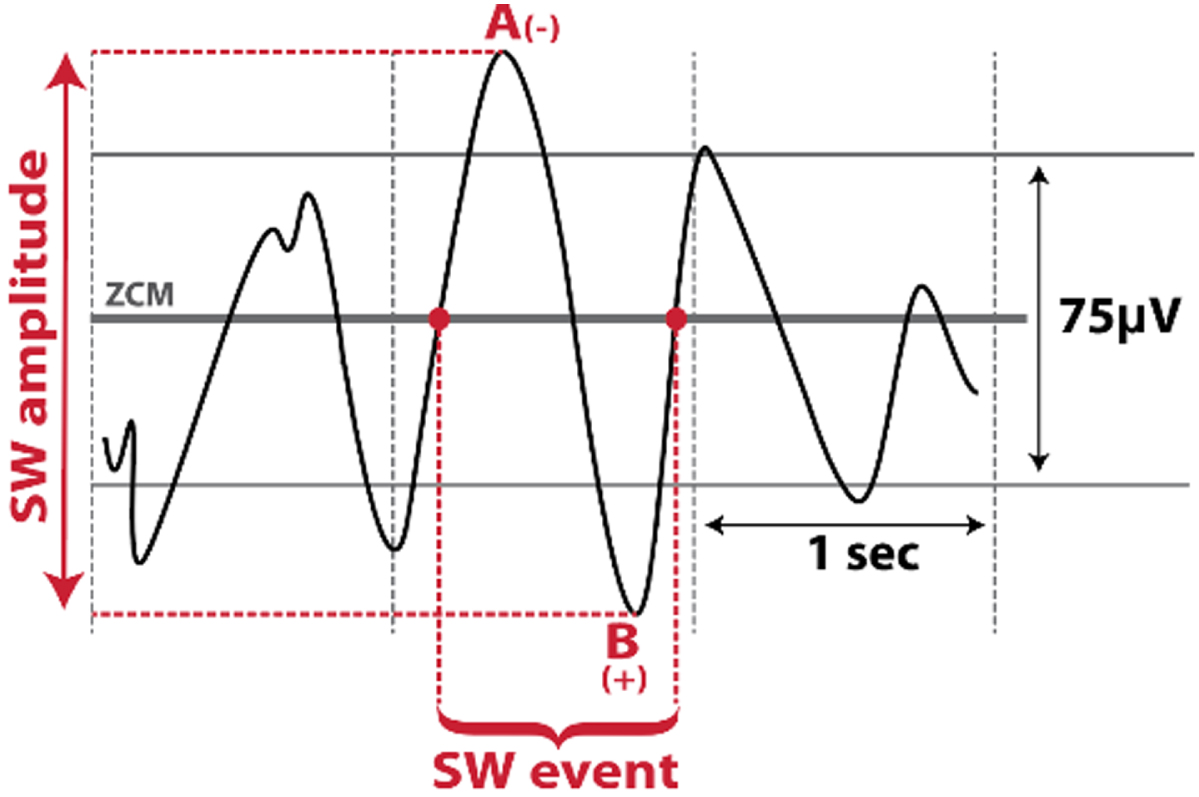 | Altered with aging and cognitive impairment [11, 12] |
| •Density (SW/min) | ||
| •Amplitude (μV) | ||
| •Slope (μV/s): Amplitude/s | ||
| Sleep Spindles | 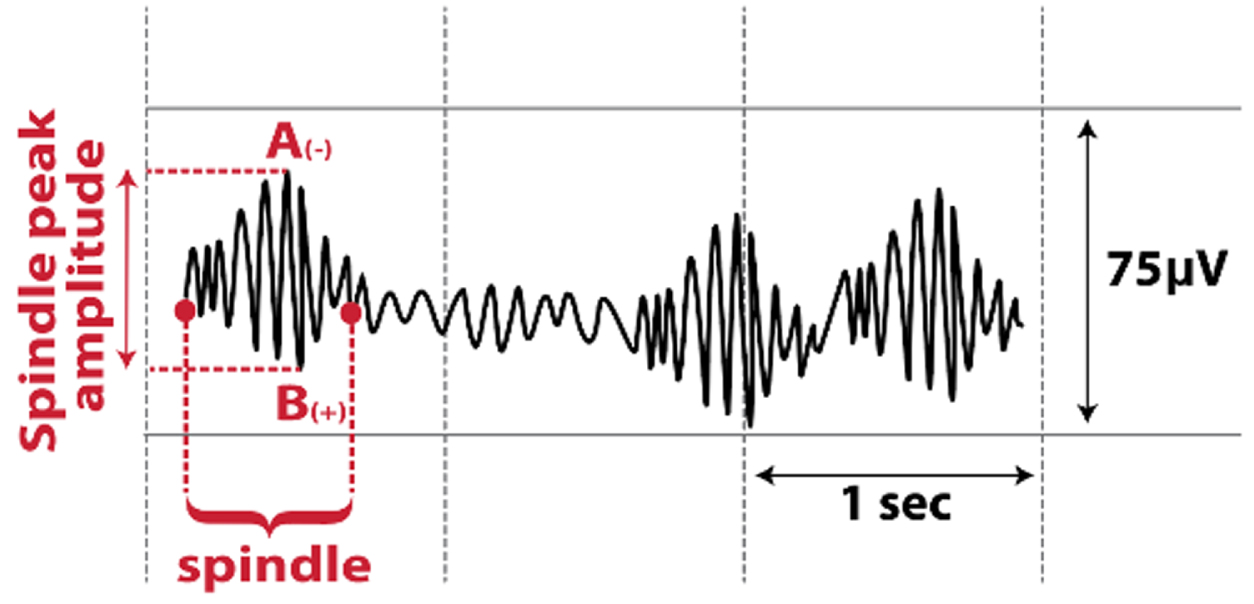 | Altered with aging and cognitive impairment, and may be altered in PD [16–19] |
| •Density (spindles/min) | ||
| •Peak amplitude (μV) | ||
| •Peak frequencies (Hz): highest number of waves/s within the spindle | ||
| SW-Spindle Phase Amplitude Coupling (at spindle’s peak amplitude) | 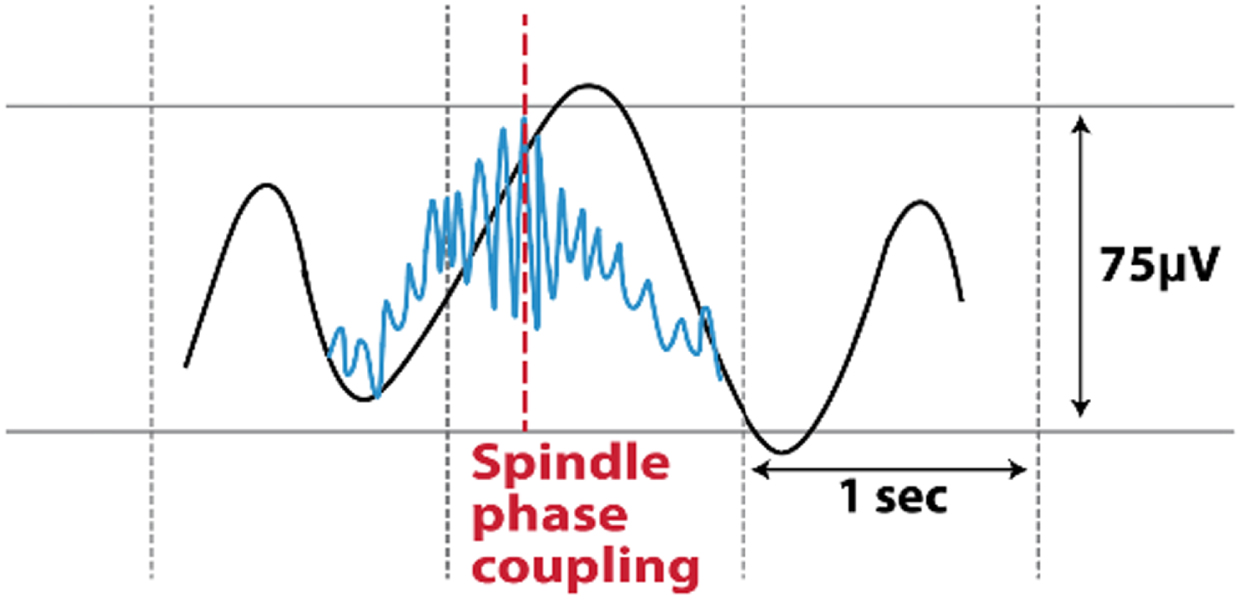 | May be important for neural plasticity and memory consolidation [20, 21] |
| •Angle distribution non-uniformity (strength) | ||
| •Co-occurrence percent (%) | ||
| •Mean coupling angle (°) | ||
| Spectral power | Relevance | |
| Spectral power during N3 | May be reduced in PD compared to controls [13, 14]; correlates with cognitive performance in PD [42, 43] | |
| •Delta power (1–4 Hz) | ||
| •Theta power (4–8 Hz) | ||
| •Alpha power (9–12 Hz) | ||
| •Beta power (12–30 Hz) | ||
| Spectral power during REM | May be altered with cognitive impairment [12]; inconsistent results in PD [14, 24, 25] | |
| •Slow-to-fast frequencies ratio: [(delta + theta)/(alpha + beta)] | ||
| •Delta power (1–4 Hz) | ||
| •Theta power (4–8 Hz) | ||
| •Alpha power (9–12 Hz) | ||
| •Beta power (12–30 Hz) | ||
N3, non-rapid eye movement stage 3; PD, Parkinson’s disease; SW, scalp slow wave; ZCM, zero-crossing.
NREM sleep exhibits distinct electrophysiological characteristics that have attracted considerable attention regarding brain plasticity. Sleep-related slow wave activity (SWA; 0.5–4 Hz) is one brain activity pattern detectable at the human scalp during sleep [7]. This EEG pattern occurs predominantly in NREM stage 3 (N3) and consists of two independent components, namely Scalp-Slow wave (SW) (< 1 Hz) [8] and delta power (1.0–4 Hz) [9]. Studies in middle-aged adults have shown that slow wave sleep declines over time, and this trend becomes increasingly pronounced with advancing age [10]. More specifically, the frequency and density of slow waves are altered, resulting in fewer SWs with smaller amplitudes [11]. Furthermore, slow wave sleep is reduced in patients with AD and mild cognitive impairment (MCI) [12]. To date, there have only been two case-control studies investigating SWA in PD, with inconsistent results. In one, low delta spectral power was reduced in nine de novo PD patients compared to ten controls [13]. In contrast, another study found no differences in delta spectral power in eight PD patients compared to nine controls [14]. Further, whether PD alters the morphological features of SW, such as density, slope, and amplitude, remains unknown.
Another hallmark of NREM is the sleep spindle, which predominantly occurs during NREM stage 2 (N2). Sleep spindles are transient EEG rhythms generated by the thalamic reticular nucleus. Spindles consist of waxing and waning 9–15 Hz oscillations that serve an essential function in preserving sleep by inhibiting sensory input [15]. Similar to aging-related changes in SW, normal aging is associated with reduction in sleep spindle density and amplitude [16]. This process appears to be accelerated in cognitive decline including MCI and AD [17]. Despite this, understanding of the neurophysiology of sleep spindles is still in its infancy, particularly in PD. Of the two studies investigating sleep spindles in PD, both reported decreased spindle density and one reported reduced spindle amplitude in PD patients compared to controls [18, 19]. Further, while sleep electrophysiologic studies have demonstrated selective loss of fast spindles in AD and MCI [17], no published studies have reported differences in the peak frequency of slow and fast spindles in PD compared to controls.
In addition to the potential significance of these individual NREM EEG oscillations, the temporal relationship between SWs and spindles also plays a significant role in determining brain plasticity. Specifically, phase-amplitude coupling between SWs and spindles promotes memory consolidation in younger and older individuals and declines with physiological aging [20, 21]. Further, SW-spindle phase-amplitude coupling is impaired in AD [22]. The occurrence of the spindle along the phase of the SW as well as the uniformity of spindle phase distribution may play important roles in understanding disease effects. However, to our knowledge this marker has not been investigated in PD. Investigating the SW-spindle coupling is the logical next step in improving our understanding of sleep-related electrophysiological changes in PD.
In addition to NREM, REM-related EEG features can also inform disease state. In a recent comprehensive cross-sectional study involving brain imaging and a battery of neuropsychological tests, slowing during REM sleep [defined as (delta + theta)/(alpha + beta)] was found to be a more powerful indicator of MCI or AD than waking EEG [12]. Interestingly, this slow-to-fast frequencies ratio [(delta + theta)/(alpha + beta)] has also been shown to predict longitudinal development of dementia in PD [23]. However, three case-control studies investigating REM spectral power in PD have produced inconsistent results. Two studies reported higher REM alpha power in de novo PD patients [14, 24] and one reported no difference in REM spectral power in mild to moderate PD patients compared with controls [25]. Therefore further investigation is needed to understand changes in REM sleep microstructure in PD. In this largest-to-date case-control study, laboratory-based polysomnography-derived scalp EEG was used to comprehensively evaluate NREM and REM qEEG in PD. Specifically, we tested the hypothesis that individuals with PD would have lower SW density and higher slow-to-fast frequencies ratio during REM compared to non-PD group-matched controls. In addition, we examined other qEEG morphological features of SW, sleep spindles, and phase-amplitude coupling between SW and spindles.
METHODS
Participants
In this case-control study, baseline polysomnography (PSG) assessments of PD participants in an ongoing longitudinal study of sleep in PD were compared to clinically-acquired PSG from age- and sex-matched individuals without PD (controls). PD participants were recruited at the University of Alabama at Birmingham (UAB) Movement Disorders Center. PD was diagnosed based on the Movement Disorders Society’s clinical diagnostic criteria [26]. PD participants were eligible if they were≥45 years of age, taking stable medications for at least four weeks prior to study entry, and had Montreal Cognitive Assessment (MoCA) score≥18. PD participants with untreated sleep apnea, atypical or secondary Parkinsonism, or deep brain stimulation surgery were excluded. The UAB Sleep/Wake Disorders Center clinical sleep study database was used to identify 30 age- and sex-matched controls who underwent diagnostic polysomnography between 2009 and 2021. Control individuals were excluded if they had BMI ≥36 or if PSG demonstrated sleep apnea (apnea hypopnea index: AHI ≥5 events per hour) or presence of REM sleep without atonia. PSG for both PD and controls were performed at the UAB Sleep/Wake Disorders Center as described below. The UAB Institutional Review Board approved this study. PD participants signed written informed consent and control individuals’ PSGs were included with waiver of consent.
Polysomnography
Each participant underwent laboratory-based PSG under the supervision of a polysomnography technician. PSG was recorded with Natus Sandman Elite™ with 32-channel capability, and the recordings included EEG; electrooculogram; submental and bilateral anterior tibialis electromyograms; respiratory effort using polyvinylidene fluoride belts at the chest and abdomen; airflow monitoring with thermocouple and nasal pressure; and pulse oximetry. PSG for PD participants also included bilateral extensor digitorum electromyogram. EEG included frontal (F3, F4), central (C3, C4), and occipital (O1, O2) leads, all referenced to the contralateral mastoid. EEG signals were digitized through Natus Sandman Elite™ (Middleton, WI, USA) with a sampling rate of 512 Hz. A certified sleep technician and a board-certified sleep physician (AWA) staged sleep in 30 s epochs according to the American Academy of Sleep Medicine’s (AASM’s) Manual for the Scoring of Sleep and Associated Events [27].
Quantitative sleep EEG analysis during NREM
Preprocessing
All EEG data were converted to European Data Format (EDF), imported into MATLAB (version R2020b), and 30 s epochs were inspected for various artifacts. The EEG evaluator (AAM) was blinded to the participant’s group. The F3 and C3 channels were evaluated visually for the entire PSG recording, and electrical and movement artifacts were detected and extracted. If F3/C3 leads had continuous artifacts, F4/C4 channels were used. In the PD group, the mean total time in N2 was 210.7 min, with 3.1% rejected due to artifact; the median duration of N3 was 44.2 min, with 0.9% rejected; and the mean duration of REM was 53.8 min, with 9.5% rejected. In the non-PD control group, the mean total time in N2 was 200 min, with 0.6% rejected due to artifact; the median duration of N3 was 44.2 min, with 0.3% rejected; and the mean duration of REM was 66.1 min, with 1.5% rejected. Based on the spatiotemporal properties of SW and spindles [15, 28], SW and delta spectral power were analyzed in frontal leads and averaged over N3, sleep spindles were analyzed in central leads and averaged over N2, SW-spindle coupling was assessed throughout N2 and N3 in central channels [21], and spectral power during REM was analyzed in central leads.
Spectral analysis
The spectral power was determined using a Hamming window of 512 ms with 50% overlap to produce a resolution of 1 Hz. The absolute spectral power in the delta (1–4 Hz), theta (4–8 Hz), alpha (9–12 Hz), and beta (12–30 Hz) frequency ranges was determined and averaged separately in N3 and REM sleep. Due to a prior study showing a reduction in low-delta spectral power (< 2 Hz) in de novo PD patients, we divided the delta power during N3 into three frequency bands: 1.0–2.0 Hz, 2.0–3.0 Hz, and 3.0–4.0 Hz [13]. In addition, we calculated a slow-to-fast frequencies ratio [(delta + theta)/(alpha + beta)] during REM based on a previous longitudinal study demonstrating that EEG slowing during REM sleep was associated with future dementia in patients with PD [23].
Scalp-SW and sleep spindle event detection
First, artifacts were manually detected and extracted by an investigator blinded to participant group (AAM). Then, artifact-free EEG was used for detection of individual SW and sleep spindle events using a custom-made MATLAB script that was developed using well-established algorithms previously validated in aging populations [21, 29, 30]. Specifically, for SW detection, all zero crossings were identified in the frontal channel with the least amount of artifact. SW events were defined using the following parameters: 1) frequency filter = 0.16–1.25 Hz, 2) duration = 0.8–2 s, and 3) amplitude threshold from negative to positive polarity = 75th percentile of amplitude over all N3 epochs. Artifact-free individual SW events meeting these parameters were then extracted from the raw signal. Finally, the following SW characteristics were calculated and averaged across all N3 epochs from the full night of PSG: 1) density (events/minute), 2) amplitude (peak to peak, expressed in μV), and 3) slope (expressed in μV per millisecond). For sleep spindle event detection, the following parameters were applied in the most artifact-free central channel: 1) frequency filter = 9–15 Hz, 2) amplitude threshold = 75th percentile of amplitude over all N2 epochs, 3) duration = 0.5–3 s. Using Hilbert’s transformation, analytical amplitude was calculated and events that met the above parameters were retrieved. Finally, the following sleep spindle characteristics were calculated and averaged over all N2 epochs from the full night of PSG: 1) density (events/min), 2) amplitude (peak to peak, expressed in μV), and 3) peak frequency (number of cycles/second, expressed in Hz) for spindles (9–15 Hz), slow spindles (9–11 Hz), and fast spindles (12–15 Hz). We divided spindles into slow and fast frequency bins because prior work has shown that fast spindles are decreased in neurodegenerative disease, specifically AD [17].
SW locked sleep spindle phase-amplitude coupling
Using the filter and parameters mentioned above, we first detected individual SW events. We then calculated the instantaneous phase angle of SW events after applying the Hilbert transformation. The raw signal was then filtered between 9–15 Hz (spindle frequency), and the instantaneous amplitude was derived from the Hilbert transformation. We detected the maximum spindle amplitude and corresponding SW phase angle [30, 31]. The following characteristics were calculated during combined N2 and N3:1) mean SW phase angle in degrees calculated with CircStat toolbox [32] and 2) coupling angle distribution non-uniformity (strength) using the Rayleigh test statistic.
SW-spindle co-occurrence percent
Using the parameters described above, SW and sleep spindle events were detected separately. The SW-spindle co-occurrence percentage (normalized over SW events) was determined from events where the center of the spindle was within the SW event.
Statistical analysis
The statistical analysis was performed using JMP Statistical Discovery Pro version 16.0 and MATLAB version R2020b (for mean circular direction differences). In descriptive statistics, Shapiro-Wilk tests were used to assess the normality of all variables. The median and interquartile range were reported for non-normally distributed data. The demographic and polysomnographic characteristics between the PD and non-PD group matched controls were compared using Fischer’s exact test for categorical variables and Welch’s two-tailed t-test for continuous variables. The qEEG outcomes between the PD and non-PD controls were compared using Welch’s two-tailed t-test to account for unequal sample size and to adjust for unequal variance. Due to multiple comparisons, p-values were adjusted using the Benjamini-Hochberg method [33]. Adjusted p-values (P’)< 0.05 were considered significant.
RESULTS
Participant characteristics
The demographics and disease characteristics are presented in Table 2. There were no significant differences between the groups regarding age, sex, or use of medications that affect sleep. However, there were more white participants in the PD group compared to the control group (p = 0.029; Fisher’s exact test).
Table 2
Demographics and Clinical Characteristics
| Characteristics | Controls | Parkinson’s disease | F ratio/U | p |
| N | 30 | 56 | ||
| Age (y) | ||||
| Mean±SD | 67.2±8.9 | 66.1±7.1 | 0.41 | 0.53 |
| Range | 46 –86 | 45 –84 | ||
| Sex: N (%) | ||||
| Male | 16 (53.3) | 37 (66.0) | 1.32 | 0.24 |
| Female | 14 (46.7) | 19 (34.0) | ||
| Race: N (%) | ||||
| Caucasian | 23 (76.7) | 53 (94.6) | 6.6 | 0.029 |
| African American | 6 (20) | 3 (5.4) | ||
| Asian | 1 (3.3) | 0 (0) | ||
| Medications that affect sleep: N (%) | 6 (20) | 18 (32) | 1.48 | 0.22 |
| Benzodiazepines | 2 (7) | 12 (21) | 3.52 | 0.06 |
| Non-benzodiazepines hypnotics | 0 (0) | 1 (2) | 0.86 | 0.35 |
| Narcotics | 0 (0) | 1 (2) | 0.86 | 0.35 |
| Antipsychotics | 0 (0) | 2 (3.6) | 1.74 | 0.18 |
| Melatonin | 2 (7) | 1 (2) | 1.30 | 0.25 |
| Trazodone | 2 (7) | 2 (3.6) | 0.40 | 0.53 |
| Gabapentin | 3 (10) | 3 (5.5) | 0.59 | 0.44 |
| Oxybutynin | 0 (0) | 1 (2) | 0.86 | 0.35 |
| Barbiturates | 0 (0) | 1 (2) | 0.86 | 0.35 |
| Duration of Disease (DOD) (y) | ||||
| Median (IQR) | - | 5 (2.0 –8.7) | ||
| Hoehn & Yahr: N (%) | ||||
| 1 | - | 5 (8.9) | ||
| 2 | 41 (73.2) | |||
| 3 | 10 (17.9) | |||
| Levodopa Equivalent Dose (LED) | ||||
| Median (IQR) | - | 609 (317 –887) | ||
| MDS-UPDRS | ||||
| Part I | ||||
| Median (IQR) | - | 9.0 (5.2 –12) | ||
| Part II | ||||
| Mean+SD | - | 10.4±5.3 | ||
| Range | - | 0 –24 | ||
| Part III | ||||
| Mean+SD | - | 31.4±13.6 | ||
| Range | - | 4 –70 | ||
| Part IV | ||||
| Median (IQR) | - | 3 (0 –5) | ||
| Total | ||||
| Mean+SD | - | 54.4±19.1 | ||
| Range | - | 17 –105 |
Mean±SD reported for normally distributed data. Median (IQR) reported for non-normally distributed data. MDS-UPDRS, Movement Disorders Society-Unified Parkinson’s Disease Rating Scale.
Polysomnographic characteristics
The sleep characteristics for PD and non-PD participants are shown in Table 3. As expected, sleep efficiency and percentage of REM were significantly higher in non-PD compared to PD, and wake after sleep onset (WASO) and time spent in N1 (light sleep) were significantly higher in PD compared to non-PD. There were no significant group differences in total sleep time, latency to sleep onset, N2%, N2 time, N3%, N3 time, REM time, or apnea-hypopnea index.
Table 3
Objective Polysomnographic Findings
| Characteristics | Controls | Parkinson’s disease | F ratio/U | p |
| Sleep Efficiency (%) | 84.1 (80.2 –88.2) | 78.8 (68.9 –86.1) | 13.6 | 0.0004 |
| Total Sleep Time (min) | 353.4 (321.2 –374.1) | 377.7 (332.8 –414.0) | 1.07 | 0.30 |
| Wake After Sleep Onset (WASO) (min) | 53.1 (33.0 –68.5) | 81 (58.5 –129.2) | 22.8 | < 0.0001 |
| Sleep Latency (min) | 7.5 (3.4 –17.3) | 9.1 (4.2 –16.3) | 1.8 | 0.18 |
| N1% | 8.8 (5.5 –11.9) | 10.4 (7.0 –15.3) | 5.7 | 0.02 |
| N1 time (min) | 27.5 (20.7 –41.1) | 37.2 (28.0 –51.6) | 5.7 | 0.02 |
| N2% | 57.2±11.0 | 57.7±11.2 | 0.04 | 0.85 |
| N2 time (min) | 200.0±40.6 | 210.7±61.4 | 0.93 | 0.33 |
| N3% | 12.9 (8.0 –18.2) | 11.2 (2.2 –56.7) | 0.04 | 0.84 |
| N3 time (min) | 45.2 (26.6 –72.2) | 44.2 (19 –247.7) | 0.23 | 0.63 |
| REM % | 18.6±7.4 | 14.4±7.43 | 6.45 | 0.013 |
| REM time (min) | 66.1±28.4 | 53.8±28.4 | 3.65 | 0.060 |
| Apnea Hypopnea Index (events per hour) | 1.1 (0.5 –2.7) | 0.3 (0.0 –14.7) | 0.68 | 0.411 |
| Periodic Limb Movements of Sleep | 5.9 (0.0 –14.1) | 1.5 (0.2 –79.9) | 1.13 | 0.28 |
Mean±SD reported for normally distributed data. Median (IQR) reported for non-normally distributed data. N1, non-REM stage 1; N2, non-REM stage 2; N3, non-REM stage 3; REM, rapid eye movement sleep.
Quantitative sleep EEG analysis
Scalp-SW characteristics during N3
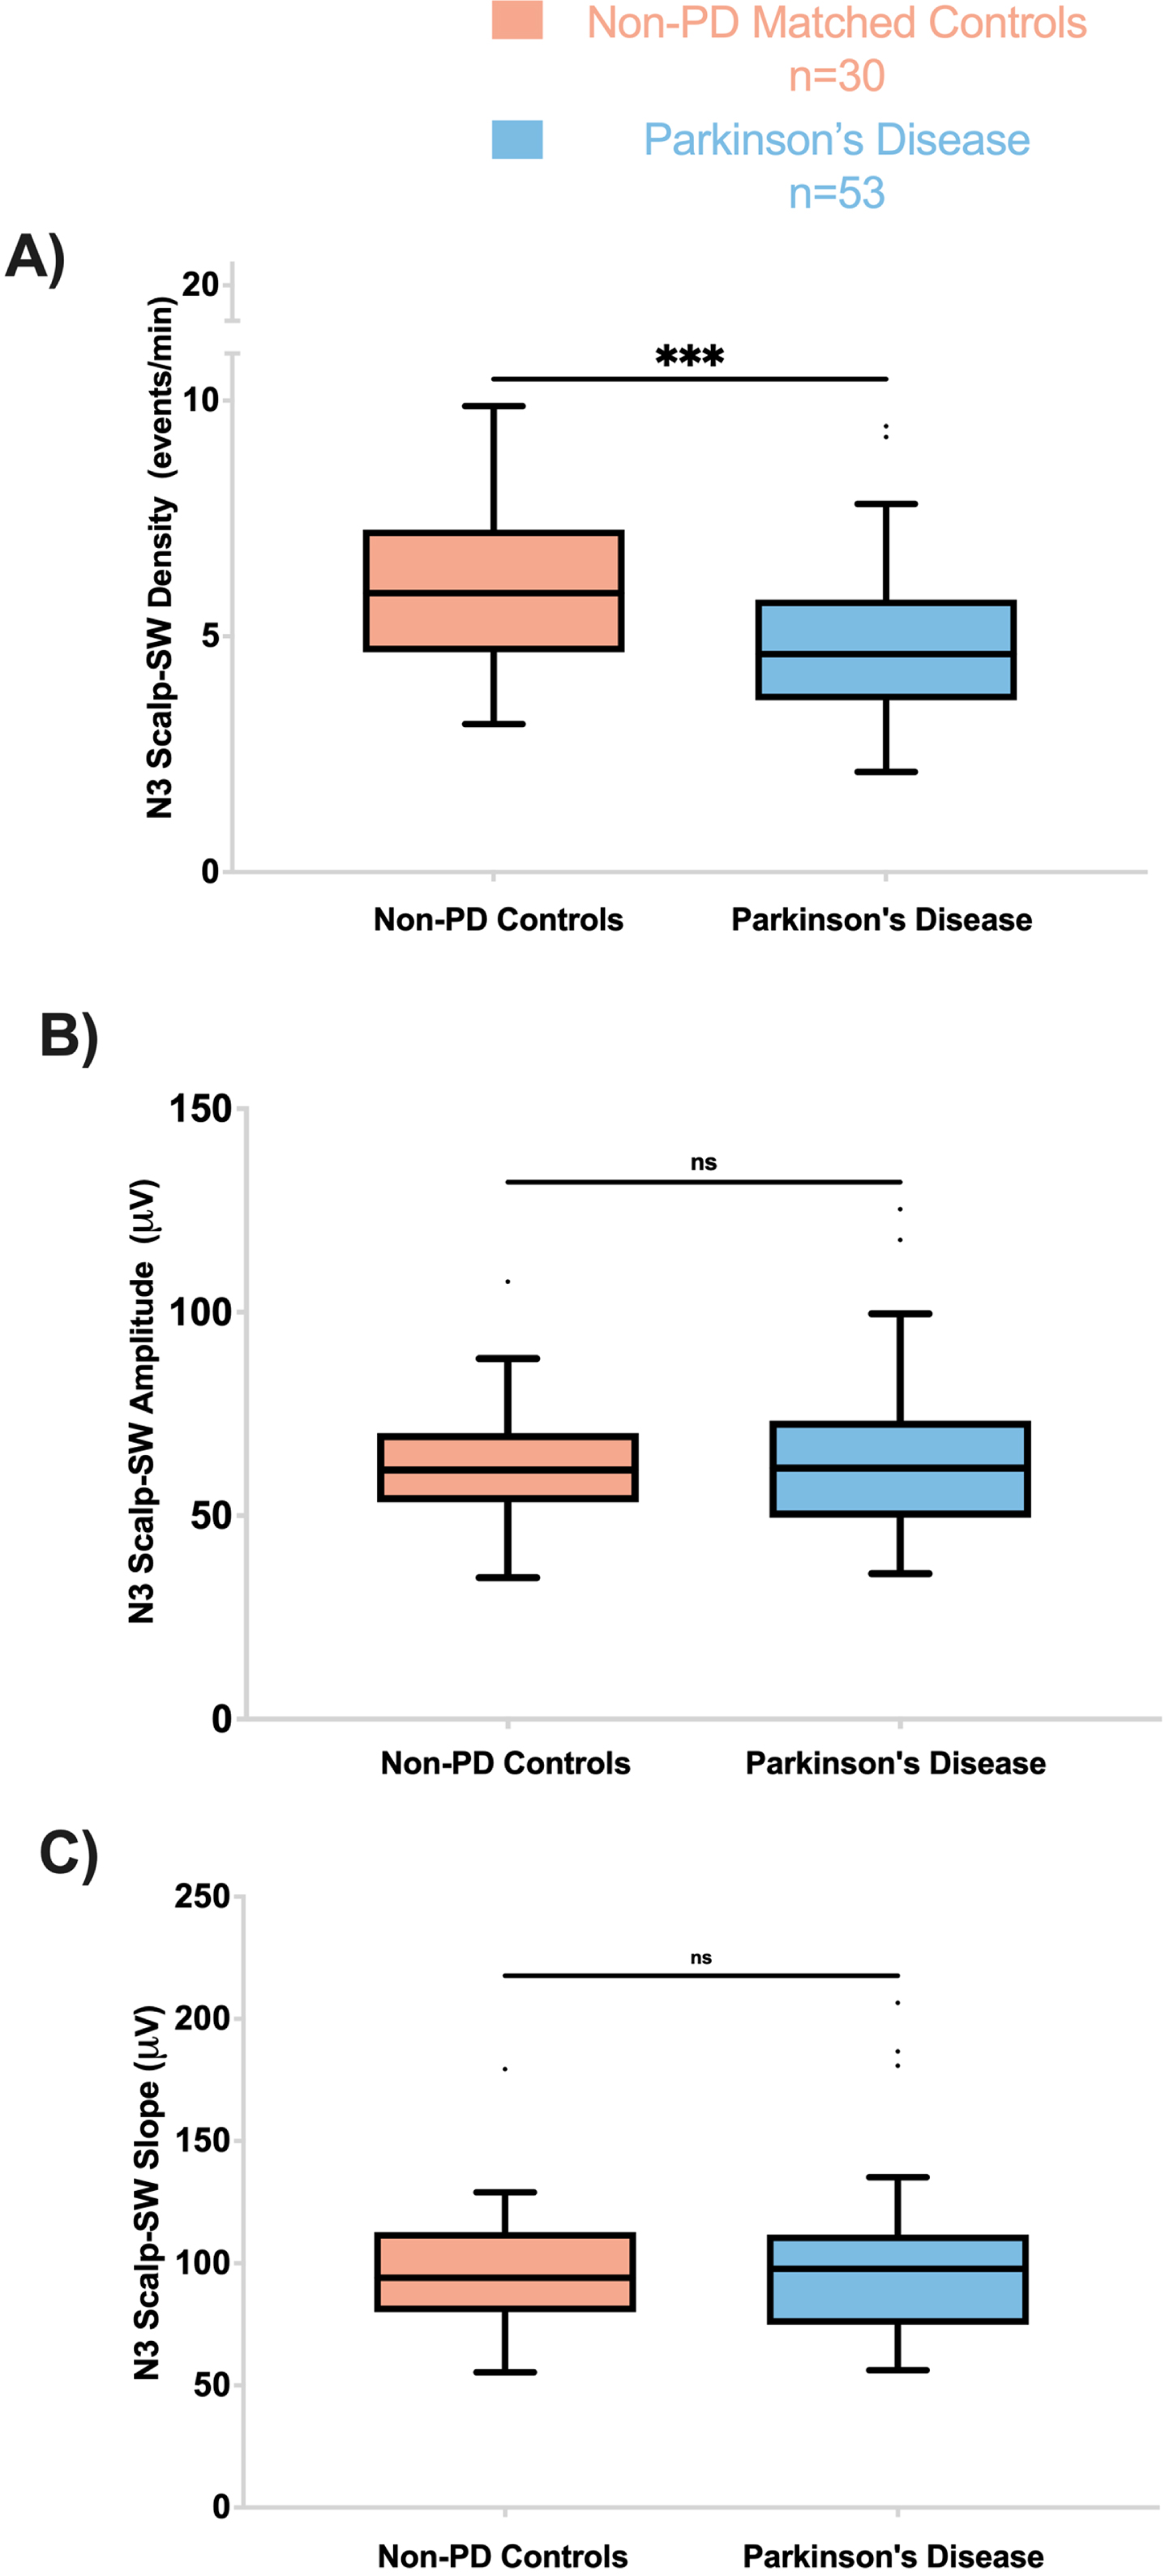
SW density was significantly lower in the PD group than in the non-PD group (F = 13.4, p’ = 0.003) (Fig. 1). However, other SW morphological features including peak to peak amplitude and slope (amplitude divided by the time between SW peak and trough) did not differ significantly between PD and non-PD groups (Fig. 1).
Fig. 1
PD participants have lower Scalp-SW density during N3. A) Frontal Scalp-SW density during N3 was significantly lower in PD compared to controls (F = 13.5; p’ = 0.003). The amplitude (B) and slope (C) of the Fontal Scalp-SW were not different between the two groups during N3. On all panels, box plots are Tukey-style. ns, not significant; p’, adjusted p-value.
Spectral power during N3
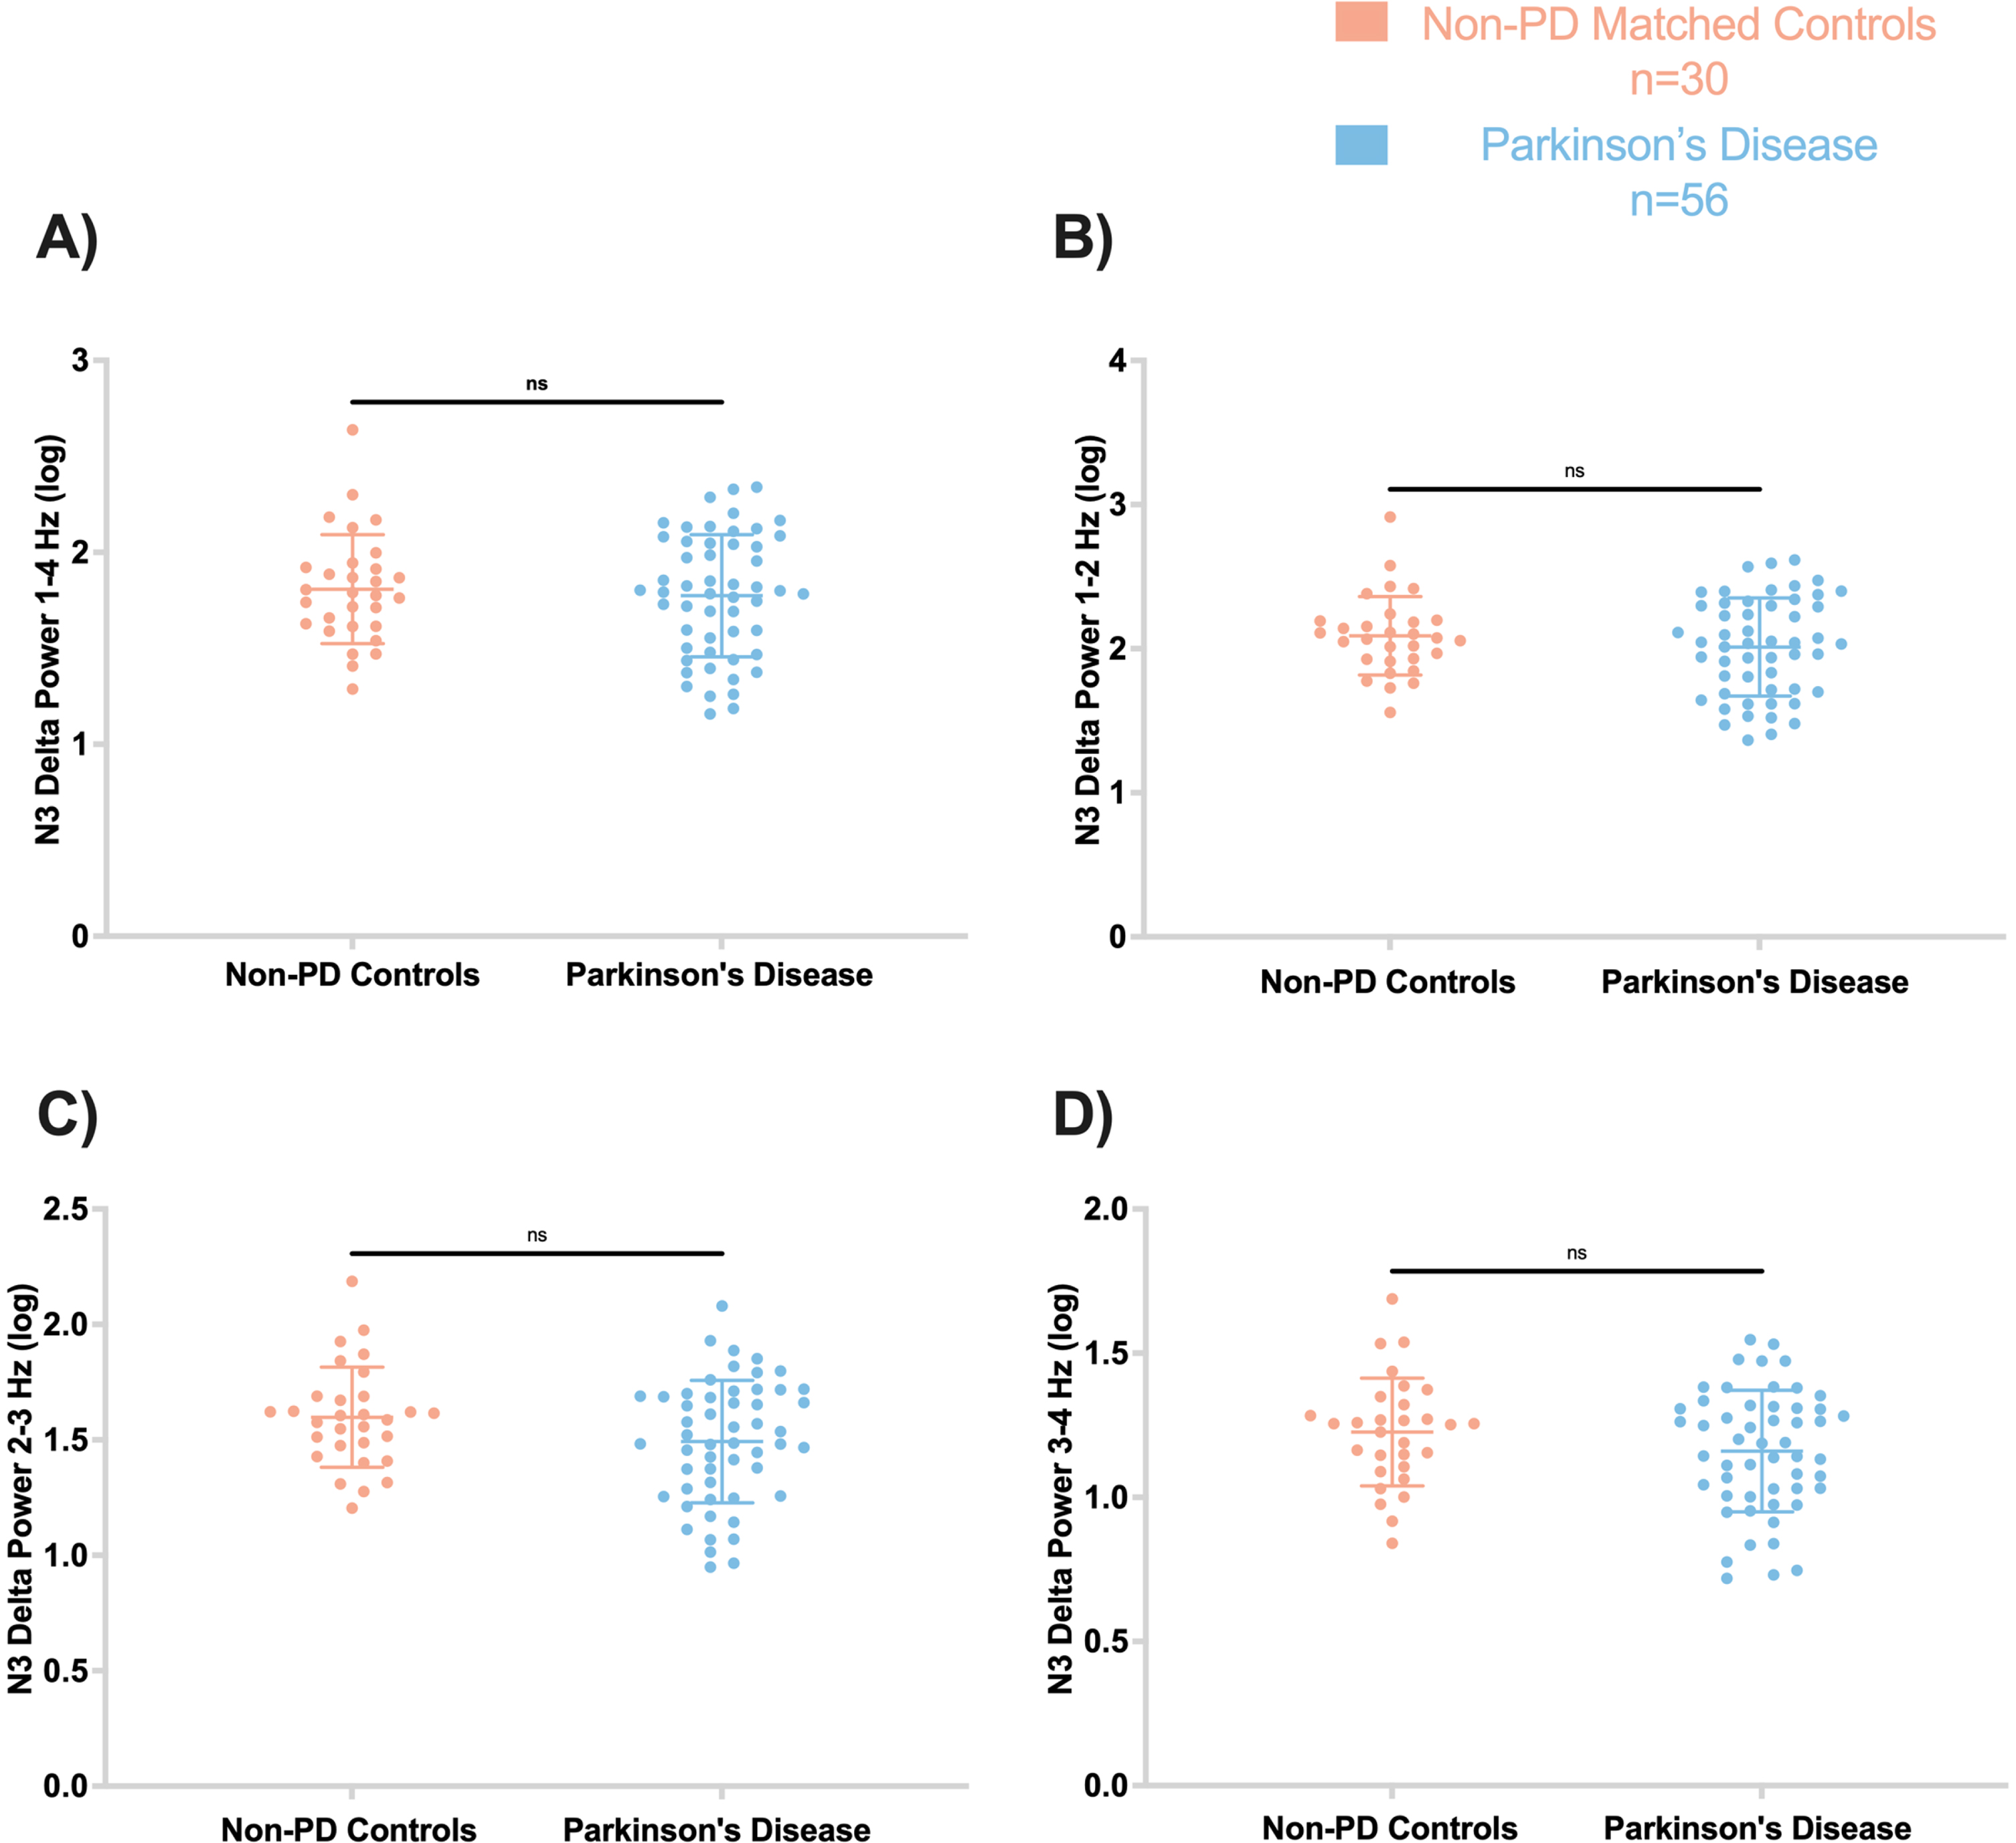
No significant differences were observed between non-PD and PD participants in delta spectral power at 1–4 Hz (F = 2.137, p’ = 0.72) (Fig. 2). Furthermore, other delta frequency bins showed no significant difference between PD and non-PD, including 1-2 Hz (F = 2.063, p’ = 0.64), 2-3 Hz (F = 1.470, p’ = 0.25), and 3-4 Hz (F = 1.17, p’ = 0.25). In addition, no significant differences were found in theta, alpha, and beta spectral frequencies between the groups (all p > 0.05) (Supplementary Figure 1).
Fig. 2
Frontal absolute delta spectral power during N3 was not different between PD and controls. Log-transformed delta spectral power are displayed by frequency: A) 1–4 Hz, B) 1-2 Hz, C) 2-3 Hz, D) 3-4 Hz. In all panels, the figures are scatter plots, and error bars represent the mean and standard deviation. ns, not significant.
Sleep spindle characteristics during N2
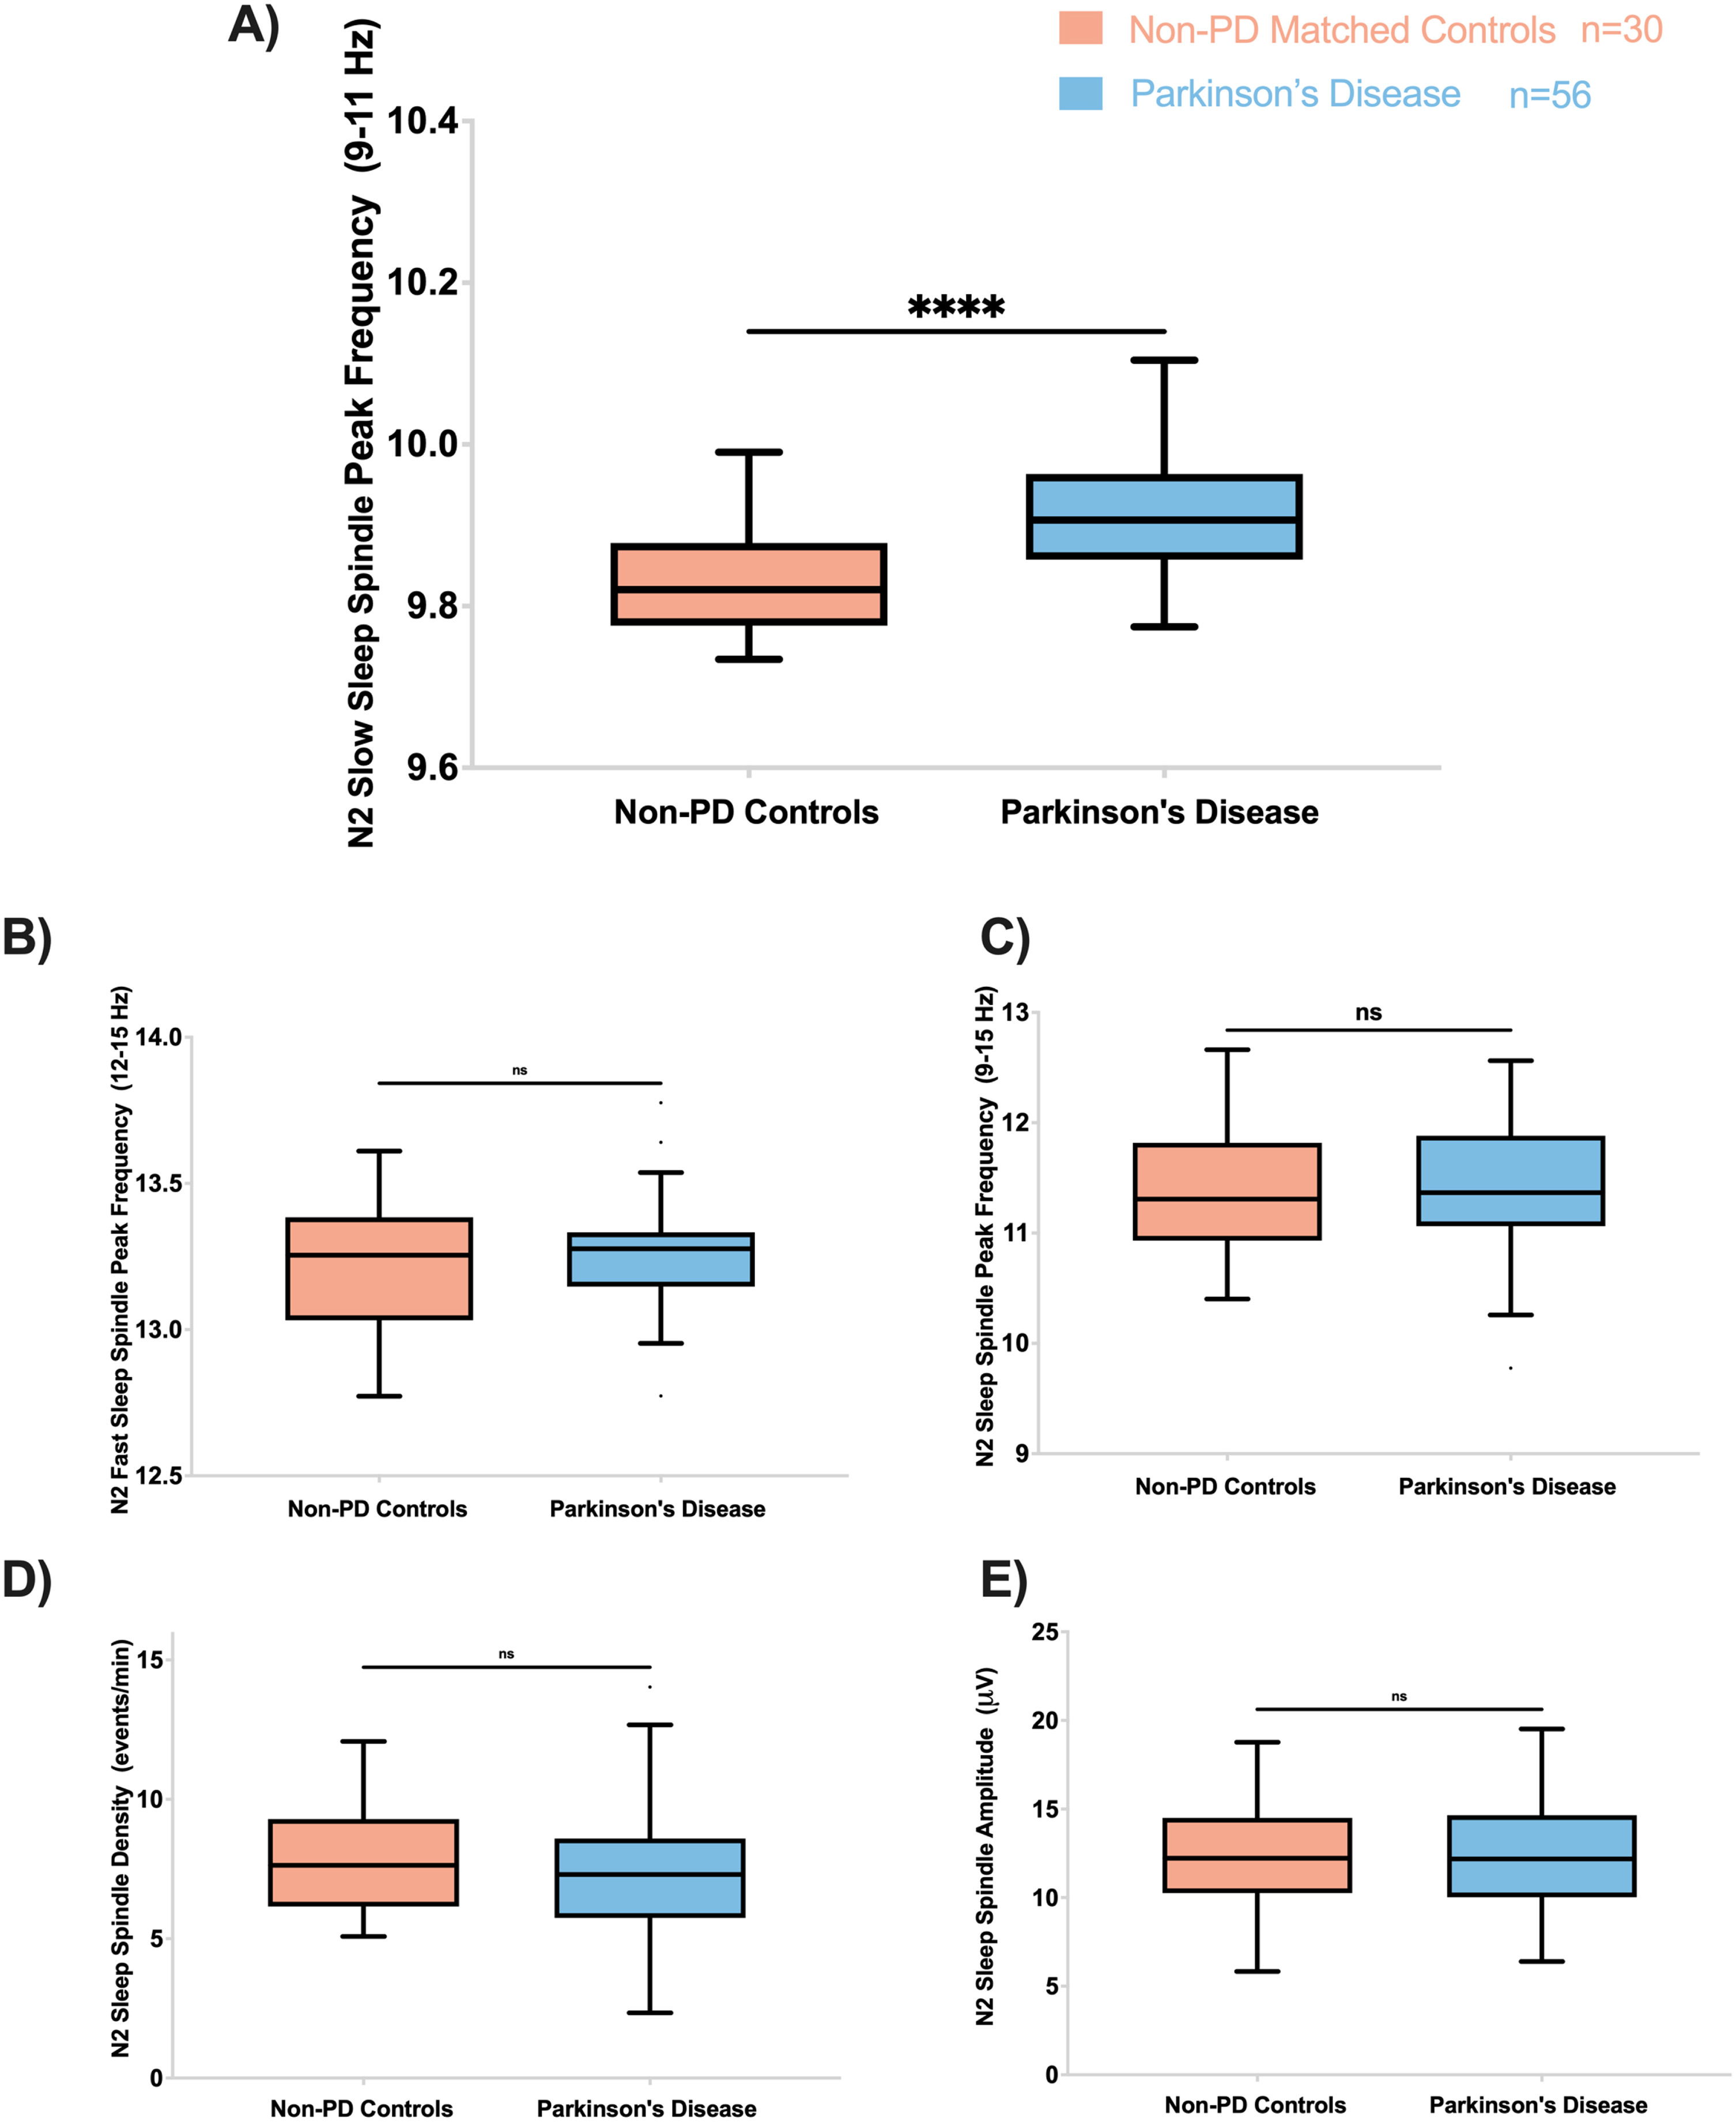
Slow spindle peak frequency (9–11 Hz) was significantly higher in PD than non-PD (F = 24.7, p’< 0.002) (Fig. 3). Other sleep spindle morphological features, including fast spindle peak frequency (12–15 Hz), spindle peak frequency (9–15 Hz), spindle density, and spindle amplitude, were not significantly different between PD and non-PD controls (Fig. 3). Our exploratory analyses did not reveal any significant differences in slow and fast frequency amplitude or density between the groups.
Fig. 3
PD participants have higher slow spindle peak frequency (9–11 Hz) during N2. A) Slow spindle peak frequency during N2 was higher in PD compared to controls (F = 24.7; p’ < 0.002). The fast spindle peak frequency (12–15 Hz) (B), spindle peak frequency (C), spindle density (D), and spindle amplitude (E) were not different between PD and controls. On all panels, box plots are Tukey-style. ns, not significant; p’, adjusted p-value.
SW-spindle phase-amplitude coupling characteristics during N2 and N3
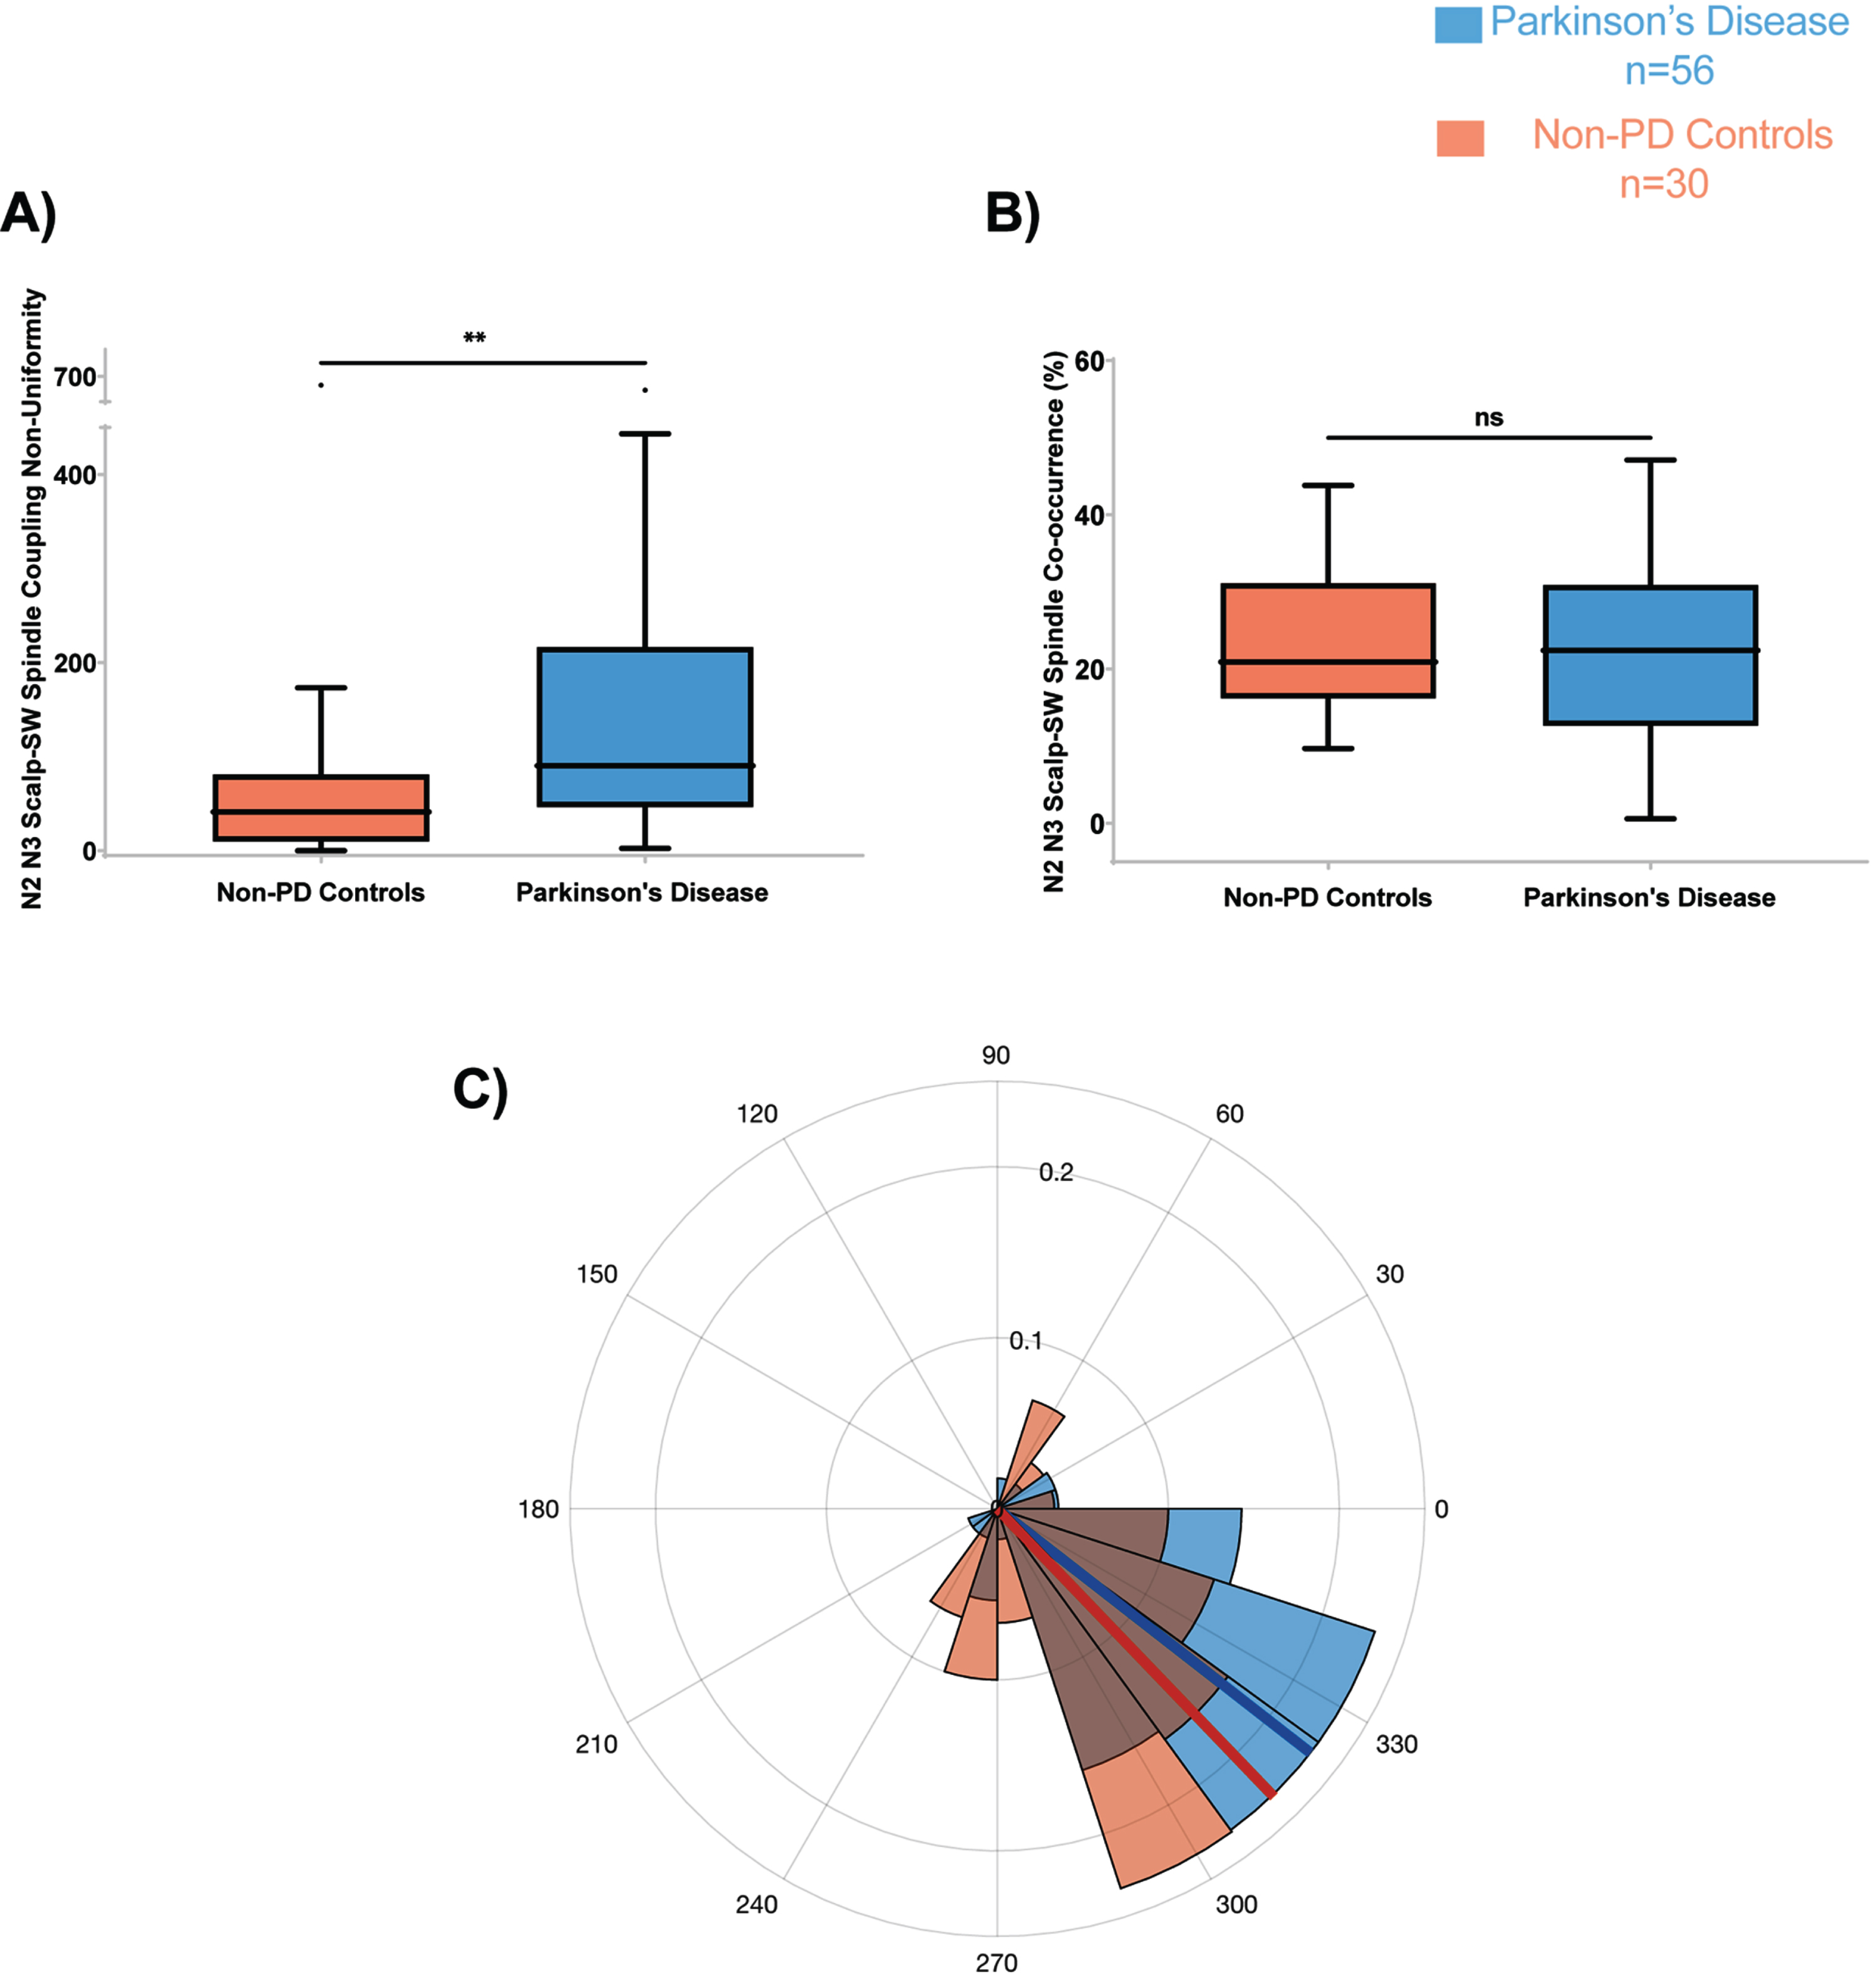
The SW-spindle phase-amplitude coupling angle distribution non-uniformity (strength) was significantly higher in PD than non-PD (F = 7.30, p’ = 0.034) (Fig. 4A). The other morphological features, including co-occurrence percent (Fig. 4B) and the mean coupling angle (Fig. 4C) were not significantly different between the two groups.
Fig. 4
PD participants have higher Scalp-SW spindle phase amplitude coupling non-uniformity during N2 and N3. A) Scalp-SW spindle coupling strength during N2 and N3 was higher in PD compared to controls (F = 7.30; p’ = 0.034). The spindle coupling co-occurrence percent (B), and mean coupling angle (C), were not different between PD and controls. On all panels, box plots are Tukey-style. ns, not significant; p’, adjusted p-value.
Spectral power during REM
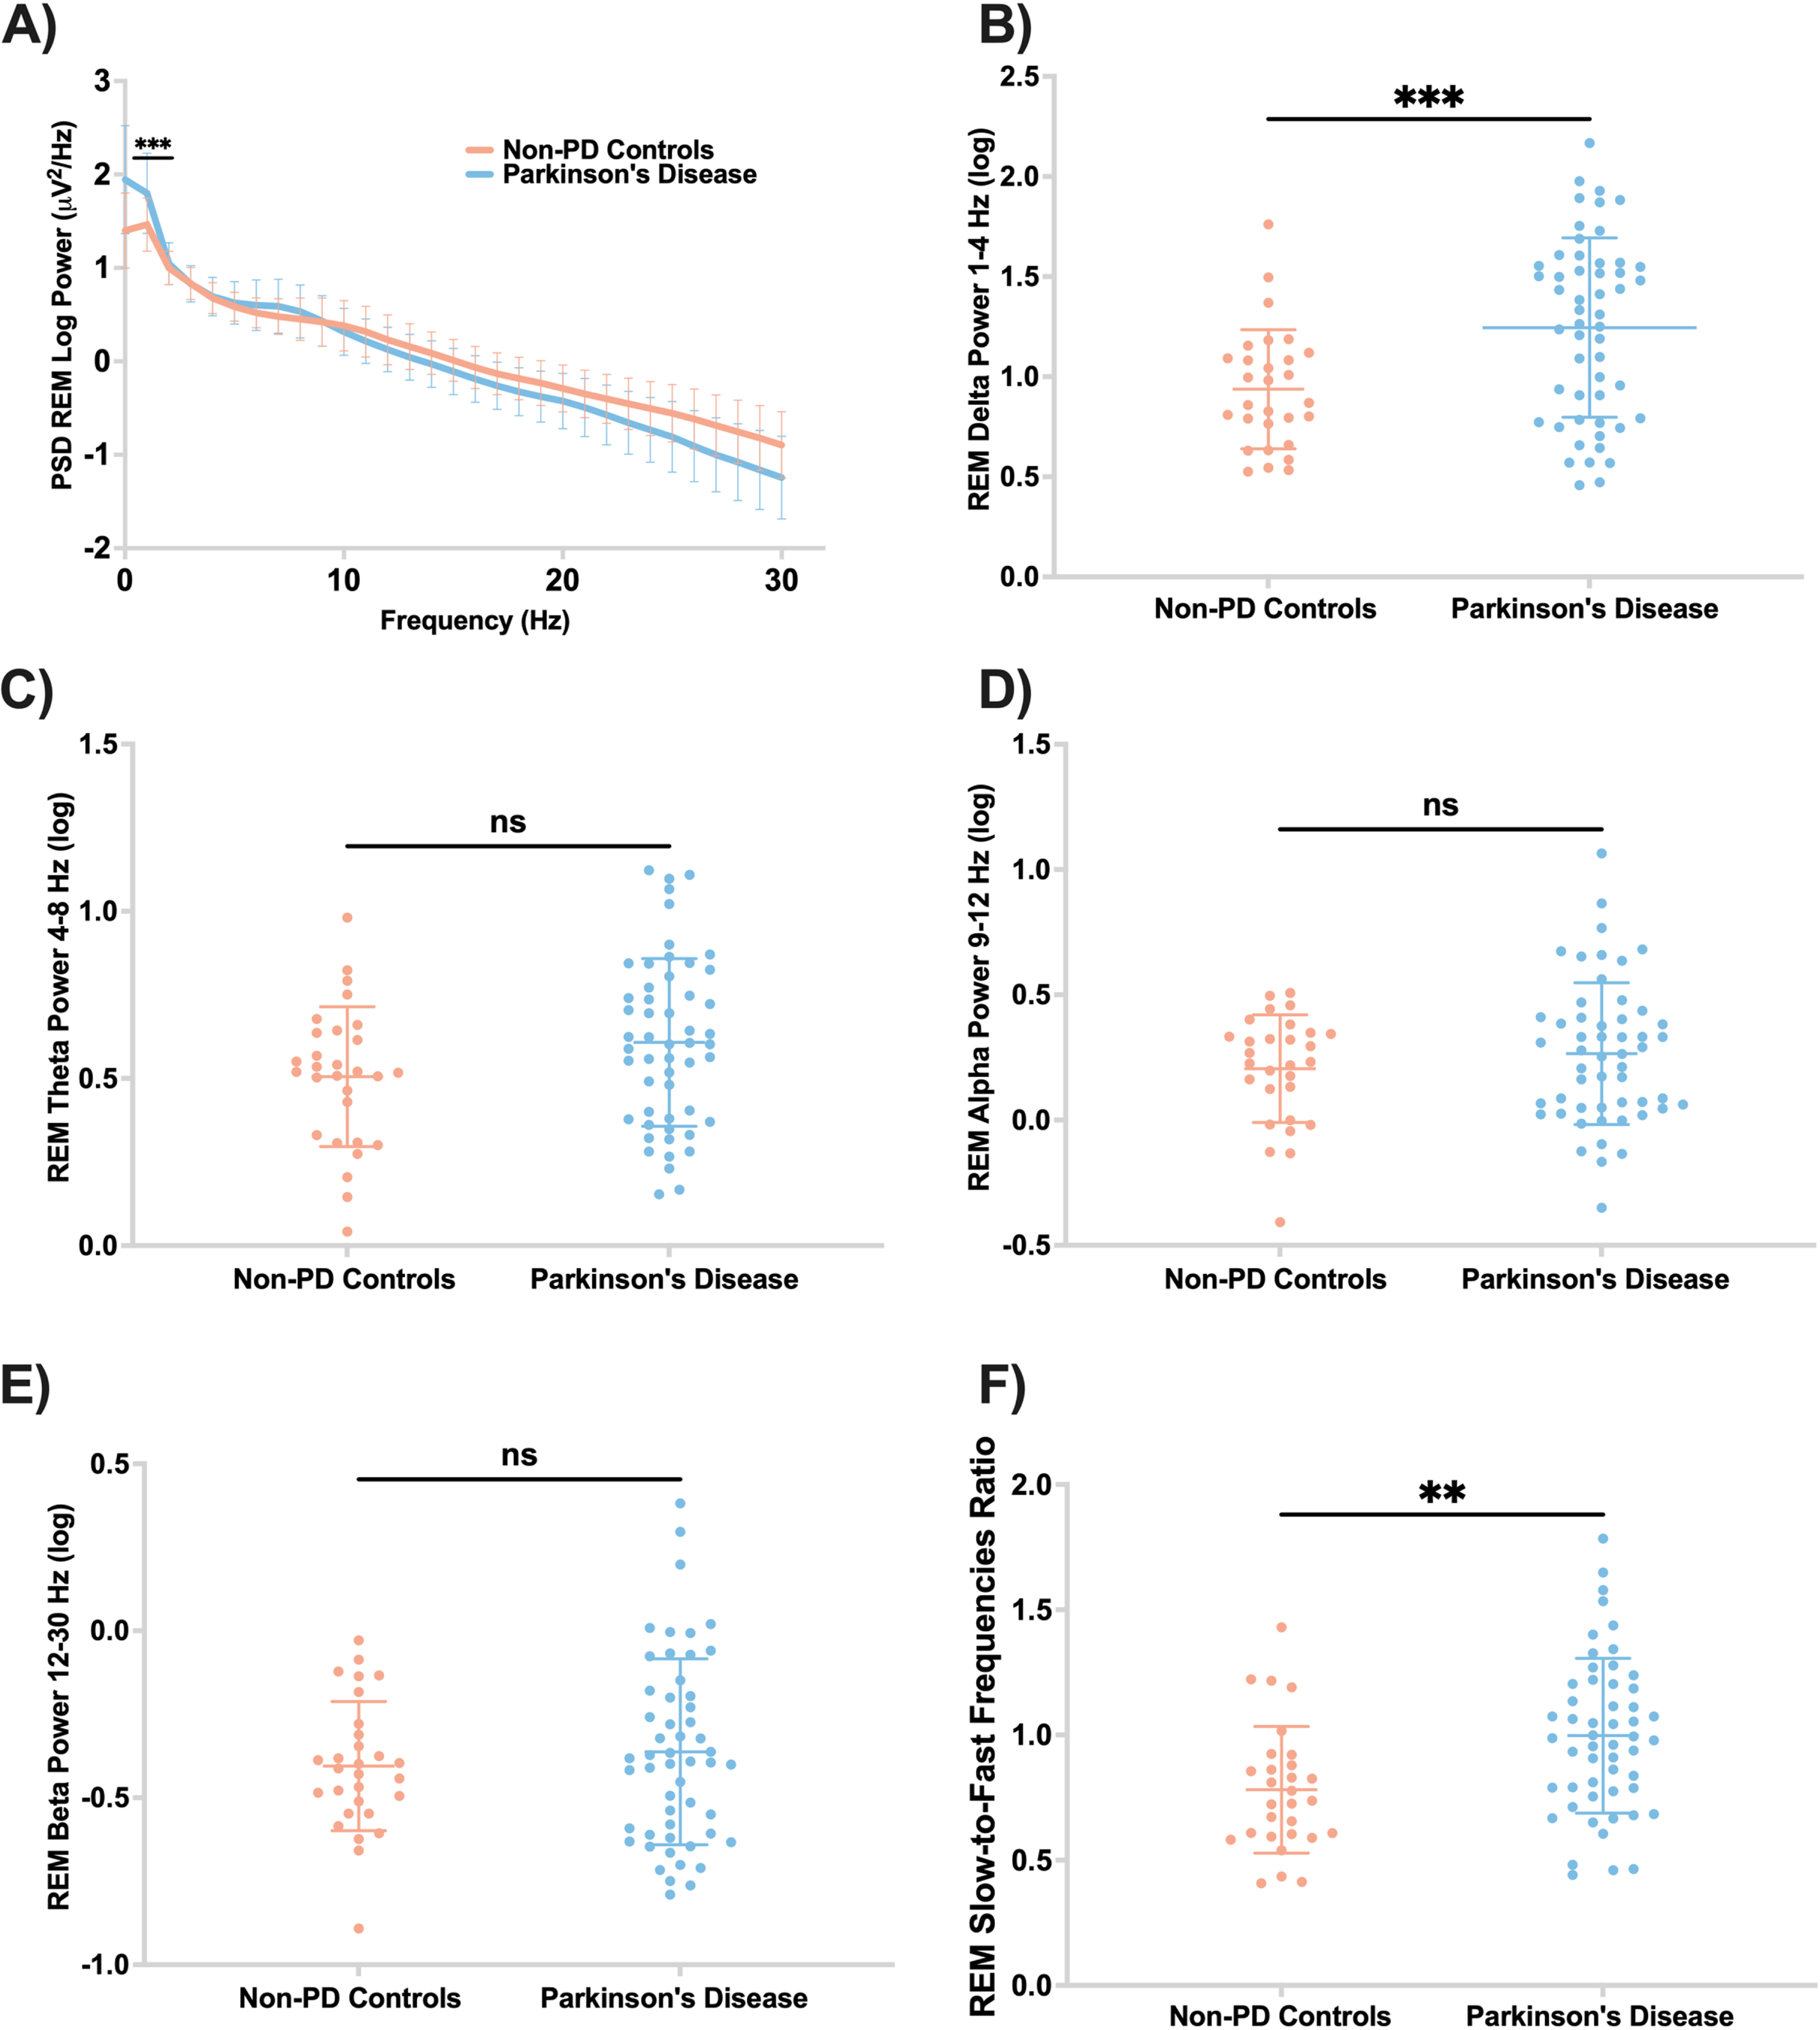
PD participants had higher delta power and higher slow-to-fast frequencies ratio during REM than non-PD controls (F = 2.27, p’ = 0.002; F = 4.23, p’ = 0.013, respectively) (Fig. 5B, F). There were no significant differences between theta, alpha, and beta spectral powers during REM sleep between the two groups (Fig. 5).
Fig. 5
PD participants have higher ratio of slow-to-fast REM EEG frequencies. A) Central EEG log power spectrum during REM. B) Central absolute delta spectral power during REM was significantly higher in PD compared to controls (F = 13.40; p’ = 0.002). Absolute spectral power in theta (C), alpha (D), and beta (E) were not different between the two groups during REM. F) PD participants have higher ratio of slow-to-fast REM frequencies (F = 4.23; p’ = 0.013). Panels B-F are scatter plots with mean and standard deviation. ns, not significant; p’, adjusted p-value.
DISCUSSION
In light of substantial evidence demonstrating a role for sleep neurophysiology in brain plasticity [15, 30], we studied how sleep qEEG features differ between individuals with PD and non-PD group-matched controls. To our knowledge, this is the first study showing that PD patients have lower N3 SW density, higher REM slow-to-fast frequencies ratio, and higher REM delta spectral power compared to non-PD controls. These findings may have implications for disease severity or cognitive function. In addition, the PD group had a higher slow spindle peak frequency and greater SW-spindle coupling angle distribution non-uniformity.
As part of polysomnography, EEG recordings are used to determine the depth of sleep. In N3, the scalp-EEG is characterized by slow wave activity (SWA; 0.5–4 Hz), which consists of two independent components: Scalp-SW (SW;< 1 Hz) [8, 34] and delta waves (1–4 Hz) [9]. Although the mechanism underlying SW is unknown, it is believed to be generated by cortical membrane potential transitions between the silent (DOWN) and active (UP) states, originating primarily in the frontal cortex [8]. During the DOWN state, cortical neurons are hyperpolarized and appear inactive, whereas during the UP state, the neurons are depolarized and exhibit excitatory as well as inhibitory synaptic activity [35]. A major function of slow wave sleep is memory processing, which is supported by both the sleep homeostasis hypothesis via synaptic downscaling/pruning, and by the active system consolidation theory via managing the dialogue between the hippocampus and neocortex [36, 37]. Despite this, the role of slow wave morphological features in PD is not clear as it has been evaluated in a case-control design in only one prior study, which showed decreased SWA (0.5–4 Hz) amplitude in PD patients compared to non-PD controls [19]. The present study is the first to examine both SWA components (SW and delta power) in the context of PD, whereby we determined that SW (< 1 Hz) density was significantly reduced in PD compared to non-PD controls. Moreover, we were surprised to find no significant differences between PD and non-PD in terms of the amplitude and slope of SW, measures that represent synaptic strength and synchrony of excitatory post synaptic potentials. A prior study found cortical thinning, particularly in the prefrontal cortex, was associated with reduced SWA during aging [38]. Furthermore, longitudinal studies of normal aging have shown that the volume of the prefrontal cortex, where the SW are generated, declines with age [39–41]. Consequently, it is possible that since we have age-matched controls, the amplitude and slope were similar between groups. Hence, the fact that we detected fewer SW events in PD might be indicative of altered sleep thalamocortical circuit dynamics.
Our group recently found that absolute delta spectral power (1–4 Hz) during N3 is correlated with cognitive performance in PD [42] and these findings were replicated in another study showing that low-delta spectral power frequency (1-2 Hz) drives this relationship with cognition [43]. However, only two prior studies have compared delta spectral power during NREM sleep between PD patients and non-PD controls, with inconsistent results. According to Brunner and colleagues, low-delta spectral power was significantly reduced in nine PD patients compared to ten non-PD controls [24]. In contrast, Margis and colleagues did not find differences in delta spectral power between nine PD patients and eight controls [14]. In the current study, we found no differences in absolute delta spectral power during N3 in the 1–4 Hz range or in other frequency ranges (1-2 Hz, 2-3 Hz, and 3-4 Hz) between PD and non-PD. Based on these findings, Scalp-SW (< 1 Hz) appears to be a better electrophysiological marker in distinguishing PD from non-PD.
A growing body of evidence suggests that there is more than one type of human sleep spindle. These two types of spindles include fast spindles (>12 Hz), typically originating from the centroparietal region, as well as slow spindles (<12 Hz), which originate from the frontal region [44]. The peak frequency of sleep spindles increases from childhood to adolescence, with the slow spindle peak frequency plateauing earlier than the fast spindle peak frequency [45]. Literature exploring spindles in MCI and AD has not found differences in sleep spindle peak frequency between the two groups [46]. Nevertheless, AD patients had a lower density of fast spindles as compared to amnestic MCI patients [17]. The present study showed that slow spindle peak frequency was higher in PD than in non-PD controls; however, there was no difference in spindle density or amplitude. Interestingly, Christensen and colleagues identified spindles through manual detection and found lower sleep spindle density and frequency, but higher spindle amplitudes in PD compared to controls, speculating that this might be due to degeneration of thalamic neurons, resulting in the generation of only highly synchronized spindles [18]. Compared to that study, our study is methodologically different as we employed automated spindle detection. Additionally, the lack of difference in spindle density between the two groups may have been influenced by a trend toward more participants in the PD group taking benzodiazepines. Because benzodiazepines can increase spindles [47], this may have led to an underestimation of the differences between the two groups. Despite this, the findings from the present study suggest that slow spindle peak frequency could be sensitive to PD pathology.
The influence of PD pathology on SW-spindle coupling has not previously been explored. These relationships are also understudied in MCI and AD, though a recent study by Winer and colleagues found that tau pathological burden in the mesial temporal lobe is associated with reduced SW-spindle coupling [22]. In studies on physiological aging, SW-spindle coupling played an important role in memory consolidation during sleep. Additionally, spindles were coupled to SW farther away from the depolarizing UP state of the slow oscillation cycle in older compared to younger individuals [21]. Furthermore, this impaired coupling was associated with age-related grey matter atrophy of the prefrontal cortex [21]. The current study provides the first indication that PD patients have higher coupling angle distribution non-uniformity than non-PD controls (Fig. 4A). However, no significant differences were detected in terms of SW-spindle mean coupling angle or co-occurrence percent. Considering that the prefrontal cortex is more atrophied in PD than controls [48], we speculated that in addition to contributing to generation of fewer SWs, prefrontal atrophy may also alter the timing of the sleep spindles in relation to SW phase. This is consistent with prior work showing that medial prefrontal cortical atrophy is associated with misaligned SW spindle coupling in the aging brain [21]. In summary, these findings provide evidence that the ability of the PD brain to couple the two dominant oscillations of NREM sleep (SWs and spindles) is significantly non-uniform in contrast to the coupling in controls. Nevertheless, these data do not necessarily suggest that this non-uniform dynamic coupling profile is responsible for any functional decline in PD. Future studies should explore whether this may contribute to disease severity or cognitive impairment.
This study also found higher ratio of slow to fast frequencies in REM in PD compared to controls, which may have implications for cognition. While cholinergic activity is reduced in NREM sleep, cholinergic signaling increases during and regulates REM sleep [49]. The few case-control studies examining REM sleep qEEG activity in PD have had small sample sizes and conflicting results. In de novo PD, two studies found that REM sleep alpha power was greater in PD than in controls [14, 24]. In contrast, Gagnon and colleagues did not observe any differences in the REM spectral power between controls and PD participants who were on dopaminergic therapy [25]. The present study is the largest case-control study to date examining REM spectral power in PD, showing that PD patients have a higher ratio of slow to fast frequencies compared to non-PD controls. This difference was due to the higher delta spectral power in PD patients. Although brain atrophy, and thus increased scalp-brain distance, has potential to affect some spectral frequency bands more than others [50], this is not likely to explain the changes noted here since there were no differences in delta power during N3 between PD and controls in this study (Fig. 2 and Supplementary Figure 1). In light of its role in cognitive decline, as shown by a longitudinal study [23], REM EEG slowing is an important finding, underlining the importance of cholinergic degeneration to PD.
This study has several strengths including the case-control design, the large sample size relative to previous sleep qEEG case-control studies in PD, the comprehensive qEEG analysis of NREM sleep, blinding of EEG analysis to case/control, and the use of conservative statistical methods. A limitation of the study is that it was retrospective in design, and that it did not account for the impact of the first night effect (poor sleep in an unfamiliar environment). Nevertheless, in our prior research, the first night effect did not adversely affect sleep in patients with PD [51]. Another potential limitation is that the non-PD controls were selected from individuals who had undergone a clinically indicated sleep study. Although we excluded control sleep studies that showed sleep apnea, REM sleep without atonia, or other significant sleep disorders, these non-PD control individuals underwent PSG due to a sleep-related complaint. Therefore, this control cohort may not represent a true healthy sample of older adults. This may have led to underestimation of the qEEG differences between PD and non-PD individuals. Future studies should evaluate qEEG in non-PD matched individuals without sleep complaints. Additionally, the electrode impedance may have been altered by changes in body temperature and skin conductance associated with autonomic dysfunction in PD. Therefore, this may have resulted in more baseline sway and drift artifacts, thereby increasing the delta frequency spectral power in REM. We think this had minimal effect on the outcomes due to our exclusion of EEG sections containing artifacts and because sweat-induced (sway) oscillations have a smaller frequency range than the analyzed delta band (1–4 Hz). Finally, the heterogeneity and clinical characteristics of the participants (use of dopaminergic medications, range of disease duration and severity, use of medications that may influence sleep), may have influenced the qEEG outcomes in ways that could not be specifically measured. Additional study in larger prospective cohorts will be needed to address this.
In conclusion, this study is the first to demonstrate a lower Scalp-SW density, a higher slow spindle peak frequency, a greater scalp-SW spindle coupling angle distribution non-uniformity, and slower REM frequencies in PD patients compared to non-PD controls. Future studies could investigate the role of these neurophysiological markers in predicting cognitive decline in PD and the impact of pharmacological and non-pharmacological interventions on sleep qEEG PD. Given the prevalence of sleep disorders among people with PD, this is a particularly critical area of research.
ACKNOWLEDGMENTS
Dr. Adeel Memon received funding from NINDS R25NS079188 Training Fellowship; Dr. Kimberly Wood received funding from NIH: T32 HD071866 Training Fellowship; Dr. Amy W Amara received funding from NIH (K23NS080912 and R01HD100670). Dr. Svjetlana Miocinovic received funding from NIH (K23NS097576). We are grateful to the research participants, without whom this study would not have been possible.
CONFLICT OF INTEREST
The authors have no conflict of interest to report.
DATA AVAILABILITY
The data supporting the findings of this study are available on request from the corresponding author.
SUPPLEMENTARY MATERIAL
[1] The supplementary material is available in the electronic version of this article: https://dx.doi.org/10.3233/JPD-223565.
REFERENCES
[1] | Weber F , Dan Y ((2016) ) Circuit-based interrogation of sleep control. Nature 538: , 51–59. |
[2] | Iranzo A ((2016) ) Sleep in neurodegenerative diseases. Sleep Med Clin 11: , 1–18. |
[3] | Malhotra RK ((2018) ) Neurodegenerative disorders and sleep. Sleep Med Clin 13: , 63–70. |
[4] | Schapira AHV , Chaudhuri KR , Jenner P ((2017) ) Non-motor features of Parkinson disease. Nat Rev Neurosci 18: , 435–450. |
[5] | Chahine LM , Amara AW , Videnovic A ((2017) ) A systematic review of the literature on disorders of sleep and wakefulness in Parkinson’s disease from 2005 to 2015. Sleep Med Rev 35: , 33–50. |
[6] | Barone P , Antonini A , Colosimo C , Marconi R , Morgante L , Avarello TP , Bottacchi E , Cannas A , Ceravolo G , Ceravolo R , Cicarelli G , Gaglio RM , Giglia RM , Iemolo F , Manfredi M , Meco G , Nicoletti A , Pederzoli M , Petrone A , Pisani A , Pontieri FE , Quatrale R , Ramat S , Scala R , Volpe G , Zappulla S , Bentivoglio AR , Stocchi F , Trianni G , Dotto PD , PRIAMO study group ((2009) ) The PRIAMO study: A multicenter assessment of nonmotor symptoms and their impact on quality of life in Parkinson’s disease. Mov Disord 24: , 1641–1649. |
[7] | Davis H , Davis PA , Loomis AL , Harvey EN , Hobart G ((1937) ) Changes in human brain potentials during the onset of sleep. Science 86: , 448–450. |
[8] | Steriade M , Nuñez A , Amzica F ((1993) ) A novel slow (<1 Hz) oscillation of neocortical neurons in vivo: Depolarizing and hyperpolarizing components. J Neurosci 13: , 3252–3265. |
[9] | Steriade M , Nuñez A , Amzica F ((1993) ) Intracellular analysis of relations between the slow (<1 Hz) neocortical oscillation and other sleep rhythms of the electroencephalogram. J Neurosci 13: , 3266–3283. |
[10] | Dijk D-J , Groeger JA , Stanley N , Deacon S ((2010) ) Age-related reduction in daytime sleep propensity and nocturnal slow wave sleep. Sleep 33: , 211–223. |
[11] | Landolt HP , Borbély AA ((2001) ) Age-dependent changes in sleep EEG topography. Clin Neurophysiol 112: , 369–377. |
[12] | D’Atri A , Scarpelli S , Gorgoni M , Truglia I , Lauri G , Cordone S , Ferrara M , Marra C , Rossini PM , De Gennaro L ((2021) ) EEG alterations during wake and sleep in mild cognitive impairment and Alzheimer’s disease. iScience 24: , 102386. |
[13] | Brunner H , Wetter TC , Hogl B , Yassouridis A , Trenkwalder C , Friess E ((2002) ) Microstructure of the non-rapid eye movement sleep electroencephalogram in patients with newly diagnosed Parkinson’s disease: Effects of dopaminergic treatment. Mov Disord 17: , 928–933. |
[14] | Margis R , Schönwald SV , Carvalho DZ , Gerhardt GJL , Rieder CRM ((2015) ) NREM sleep alpha and sigma activity in Parkinson’s disease: Evidence for conflicting electrophysiological activity? Clin Neurophysiol 126: , 951–958. |
[15] | Fernandez LMJ , Lüthi A ((2020) ) Sleep spindles: Mechanisms and functions. Physiol Rev 100: , 805–868. |
[16] | Fogel SM , Smith CT ((2011) ) The function of the sleep spindle: A physiological index of intelligence and a mechanism for sleep-dependent memory consolidation. Neurosci Biobehav Rev 35: , 1154–1165. |
[17] | Gorgoni M , Lauri G , Truglia I , Cordone S , Sarasso S , Scarpelli S , Mangiaruga A , D’Atri A , Tempesta D , Ferrara M , Marra C , Rossini PM , De Gennaro L ((2016) ) Parietal fast sleep spindle density decrease in alzheimer’s disease and amnesic mild cognitive impairment. Neural Plast 2016: , 8376108. |
[18] | Christensen JAE , Nikolic M , Warby SC , Koch H , Zoetmulder M , Frandsen R , Moghadam KK , Sorensen HBD , Mignot E , Jennum PJ ((2015) ) Sleep spindle alterations in patients with Parkinson’s disease. Front Hum Neurosci 9: , 233. |
[19] | Latreille V , Carrier J , Lafortune M , Postuma RB , Bertrand J-A , Panisset M , Chouinard S , Gagnon J-F ((2015) ) Sleep spindles in Parkinson’s disease may predict the development of dementia. Neurobiol Aging 36: , 1083–1090. |
[20] | Muehlroth BE , Sander MC , Fandakova Y , Grandy TH , Rasch B , Shing YL , Werkle-Bergner M ((2019) ) Precise slow oscillation-spindle coupling promotes memory consolidation in younger and older adults. Sci Rep 9: , 1940. |
[21] | Helfrich RF , Mander BA , Jagust WJ , Knight RT , Walker MP ((2018) ) Old brains come uncoupled in sleep: Slow wave-spindle synchrony, brain atrophy, and forgetting. Neuron 97: , 221–230.e4. |
[22] | Winer JR , Mander BA , Helfrich RF , Maass A , Harrison TM , Baker SL , Knight RT , Jagust WJ , Walker MP ((2019) ) Sleep as a potential biomarker of tau and β-amyloid burden in the human brain. J Neurosci 39: , 6315–6324. |
[23] | Latreille V , Carrier J , Gaudet-Fex B , Rodrigues-Brazète J , Panisset M , Chouinard S , Postuma RB , Gagnon J-F ((2016) ) Electroencephalographic prodromal markers of dementia across conscious states in Parkinson’s disease. Brain 139: , 1189–1199. |
[24] | Wetter TC , Brunner H , Högl B , Yassouridis A , Trenkwalder C , Friess E ((2001) ) Increased alpha activity in REM sleep in de novo patients with Parkinson’s disease. Mov Disord 16: , 928–933. |
[25] | Gagnon JF , Fantini ML , Bédard MA , Petit D , Carrier J , Rompré S , Décary A , Panisset M , Montplaisir J ((2004) ) Association between waking EEG slowing and REM sleep behavior disorder in PD without dementia. Neurology 62: , 401–406. |
[26] | Postuma RB , Berg D , Stern M , Poewe W , Olanow CW , Oertel W , Obeso J , Marek K , Litvan I , Lang AE , Halliday G , Goetz CG , Gasser T , Dubois B , Chan P , Bloem BR , Adler CH , Deuschl G ((2015) ) MDS clinical diagnostic criteria for Parkinson’s disease. Mov Disord 30: , 1591–1601. |
[27] | The AASM Manual for the Scoring of Sleep and Associated Events: Rules, terminology and technical specifications. |
[28] | Timofeev I , Schoch SF , LeBourgeois MK , Huber R , Riedner BA , Kurth S ((2020) ) Spatio-temporal properties of sleep slow waves and implications for development. Curr Opin Physiol 15: , 172–182. |
[29] | Mölle M , Bergmann TO , Marshall L , Born J ((2011) ) Fast and slow spindles during the sleep slow oscillation: Disparate coalescence and engagement in memory processing. Sleep 34: , 1411–1421. |
[30] | Staresina BP , Bergmann TO , Bonnefond M , van der Meij R , Jensen O , Deuker L , Elger CE , Axmacher N , Fell J ((2015) ) Hierarchical nesting of slow oscillations, spindles and ripples in the human hippocampus during sleep. Nat Neurosci 18: , 1679–1686. |
[31] | Dvorak D , Fenton AA ((2014) ) Toward a proper estimation of phase-amplitude coupling in neural oscillations. J Neurosci Methods 225: , 42–56. |
[32] | Berens P ((2009) ) circstat: Atoolbox for circular statistics. J Stat Softw 31: , 1–21. |
[33] | Benjamini Y , Hochberg Y ((1995) ) Controlling the false discovery rate: A practical and powerful approach to multiple testing. J R Stat Soc Series B Methodol 57: , 289–300. |
[34] | Timofeev I , Grenier F , Bazhenov M , Sejnowski TJ , Steriade M ((2000) ) Origin of slow cortical oscillations in deafferented cortical slabs. Cereb Cortex 10: , 1185–1199. |
[35] | Csercsa R , Dombovári B , Fabó D , Wittner L , Eross L , Entz L , Sólyom A , Rásonyi G , Szucs A , Kelemen A , Jakus R , Juhos V , Grand L , Magony A , Halász P , Freund TF , Maglóczky Z , Cash SS , Papp L , Karmos G , Halgren E , Ulbert I ((2010) ) Laminar analysis of slow wave activity in humans. Brain 133: , 2814–2829. |
[36] | Kennedy H , Van Essen DC , Christen Y , eds. (2016) Micro-, Meso- and Macro-Connectomics of the Brain, Springer, Cham (CH). |
[37] | Sirota A , Buzsáki G ((2005) ) Interaction between neocortical and hippocampal networks via slow oscillations. Thalamus Relat Syst 3: , 245–259. |
[38] | Dubé J , Lafortune M , Bedetti C , Bouchard M , Gagnon JF , Doyon J , Evans AC , Lina J-M , Carrier J ((2015) ) Cortical thinning explains changes in sleep slow waves during adulthood. J Neurosci 35: , 7795–7807. |
[39] | Raz N , Rodrigue KM , Head D , Kennedy KM , Acker JD ((2004) ) Differential aging of the medial temporal lobe: A study of a five-year change. Neurology 62: , 433–438. |
[40] | Driscoll I , Davatzikos C , An Y , Wu X , Shen D , Kraut M , Resnick SM ((2009) ) Longitudinal pattern of regional brain volume change differentiates normal aging from MCI. Neurology 72: , 1906–1913. |
[41] | Neske GT ((2015) ) The slow oscillation in cortical and thalamic networks: Mechanisms and functions. Front Neural Circuits 9: , 88. |
[42] | Wood KH , Memon AA , Memon RA , Joop A , Pilkington J , Catiul C , Gerstenecker A , Triebel K , Cutter G , Bamman MM , Miocinovic S , Amara AW ((2021) ) Slow wave sleep and EEG delta spectral power are associated with cognitive function in Parkinson’s disease. J Parkinsons Dis 11: , 703–714. |
[43] | Schreiner SJ , Imbach LL , Valko PO , Maric A , Maqkaj R , Werth E , Baumann CR , Baumann-Vogel H ((2021) ) Reduced regional NREM sleep slow-wave activity is associated with cognitive impairment in Parkinson disease. Front Neurol 12: , 618101. |
[44] | Anderer P , Klösch G , Gruber G , Trenker E , Pascual-Marqui RD , Zeitlhofer J , Barbanoj MJ , Rappelsberger P , Saletu B ((2001) ) Low-resolution brain electromagnetic tomography revealed simultaneously active frontal and parietal sleep spindle sources in the human cortex. Neuroscience 103: , 581–592. |
[45] | Purcell SM , Manoach DS , Demanuele C , Cade BE , Mariani S , Cox R , Panagiotaropoulou G , Saxena R , Pan JQ , Smoller JW , Redline S , Stickgold R ((2017) ) Characterizing sleep spindles in 11,630 individuals from the National Sleep Research Resource. Nat Commun 8: , 15930. |
[46] | Liu S , Pan J , Tang K , Lei Q , He L , Meng Y , Cai X , Li Z ((2020) ) Sleep spindles, K-complexes, limb movements and sleep stage proportions may be biomarkers for amnestic mild cognitive impairment and Alzheimer’s disease. Sleep Breath 24: , 637–651. |
[47] | Plante DT , Goldstein MR , Cook JD , Smith R , Riedner BA , Rumble ME , Jelenchick L , Roth A , Tononi G , Benca RM , Peterson MJ ((2015) ) Effects of oral temazepam on sleep spindles during non-rapid eye movement sleep: A high-density EEG investigation. Eur Neuropsychopharmacol 25: , 1600–1610. |
[48] | Brück A , Kurki T , Kaasinen V , Vahlberg T , Rinne JO ((2004) ) Hippocampal and prefrontal atrophy in patients with early non-demented Parkinson’s disease is related to cognitive impairment. J Neurol Neurosurg Psychiatry 75: , 1467–1469. |
[49] | Platt B , Riedel G ((2011) ) The cholinergic system, EEG and sleep. Behav Brain Res 221: , 499–504. |
[50] | Coutin-Churchman P , Añez Y , Uzcátegui M , Alvarez L , Vergara F , Mendez L , Fleitas R ((2003) ) Quantitative spectral analysis of EEG in psychiatry revisited: Drawing signs out of numbers in a clinical setting. Clin Neurophysiol 114: , 2294–2306. |
[51] | Amara AW , Walker HC , Joop A , Cutter G , DeWolfe JL , Harding SM , Standaert DG ((2017) ) Effects of subthalamic nucleus deep brain stimulation on objective sleep outcomes in Parkinson’s disease. Mov Disord Clin Pract 4: , 183–190. |


