
Increased Effective Connectivity of the Left Parietal Lobe During Walking Tasks in Parkinson’s Disease
Abstract
Background:
In Parkinson’s disease (PD), walking may depend on the activation of the cerebral cortex. Understanding the patterns of interaction between cortical regions during walking tasks is of great importance.
Objective:
This study investigated differences in the effective connectivity (EC) of the cerebral cortex during walking tasks in individuals with PD and healthy controls.
Methods:
We evaluated 30 individuals with PD (62.4±7.2 years) and 22 age-matched healthy controls (61.0±6.4 years). A mobile functional near-infrared spectroscopy (fNIRS) was used to record cerebral oxygenation signals in the left prefrontal cortex (LPFC), right prefrontal cortex (RPFC), left parietal lobe (LPL), and right parietal lobe (RPL) and analyze the EC of the cerebral cortex. A wireless movement monitor was used to measure the gait parameters.
Results:
Individuals with PD demonstrated a primary coupling direction from LPL to LPFC during walking tasks, whereas healthy controls did not demonstrate any main coupling direction. Compared with healthy controls, individuals with PD showed statistically significantly increased EC coupling strength from LPL to LPFC, from LPL to RPFC, and from LPL to RPL. Individuals with PD showed decreased gait speed and stride length and increased variability in speed and stride length. The EC coupling strength from LPL to RPFC negatively correlated with speed and positively correlated with speed variability in individuals with PD.
Conclusion:
In individuals with PD, the left prefrontal cortex may be regulated by the left parietal lobe during walking. This may be the result of functional compensation in the left parietal lobe.
INTRODUCTION
Individuals with Parkinson’s disease (PD) experience gait disorders that result in an increased risk of falling and a substantially decreased life quality [1]. Early gait disorders are characterized by reduced gait speed and stride length and increased gait variability [2, 3], suggesting that changes in walking capabilities in PD are associated with decreased gait automaticity [4]. We noted that gait automaticity involves cortical and subcortical structures [5, 6]. In healthy people, when the movement is automated, brain functional activity in many brain regions—such as the prefrontal lobe, dorsolateral cortex, anterior cingulate gyrus, anterior supplementary motor area, anterior motor area, parietal lobe, and cerebellum—decreases. Simultaneously, the functional connectivity between motor-related brain regions (motor cortex, basal ganglia, cerebellum) is enhanced, and the functional connectivity between motor- and attention-related brain regions is decreased [7], suggesting that the realization of motor automation involves both cortical and subcortical structures. Healthy people can maintain gait consistency quasi-autonomously. Therefore, subcortical striatum dysfunction in individuals with PD leads to impaired gait automation and increased gait variability. The walking process requires either cortical or cognitive control and continuous attention, which may involve compensation for cortical function [6]. Therefore, it is important to obtain a better understanding of the patterns of interaction between different neural regions during walking.
Functional brain imaging has been used to investigate the patterns of interaction between neural regions. Functional connectivity (FC) and effective connectivity (EC) are commonly used concepts when evaluating functional brain imaging. FC is thought to measure temporal correlations and dependence between spatially separated brain regions [8, 9], thus revealing synergism between different brain regions, but it cannot support inferences regarding directed brain connections [8]. In contrast to nondirected FC, EC refers to the impact that one neural system has on another [10]. EC has provided a greater level of information regarding the communication of information across different neural regions and offers a better understanding of the models of interaction between these regions [11–13].
Prior studies have reported EC patterns in PD based on electroencephalogram (EEG), functional magnetic resonance imaging (fMRI), and positron emission tomography (PET) findings [14–16]. However, a major limitation of these studies is that the participants could not walk on a pathway in a realistic environment. Most research utilized basic, single-segment motor tasks (e.g., fingertip tapping or button pushing) or task simulations (e.g., virtual reality or guided imagery) to infer cortical or subcortical activity related to general motor control [17]. There has been little research of EC patterns in the brain cortex in PD during walking tasks.
Functional near-infrared spectroscopy (fNIRS) is an optical neuroimaging technique used to measure local hemodynamic changes in the cerebral cortex [18]. Compared with EEG, fMRI, and PET, portable fNIRS allows the recording of brain signals during walking tasks in real environments. A meta-analysis of PD based on fNIRS including 10 studies that focused on the oxyhemoglobin in the prefrontal cortex (PFC) of individuals with PD during different difficulty levels of ambulatory walking tasks showed that, compared to healthy older individuals, individuals with PD in the on state showed increased mobilization of the PFC, while during the off-state no significant changes were identified [19]. In another review, which included 5 fNIRS studies related to PD, the activation of PFC in individuals with PD was higher than that in older adults during the walking task performed at a comfortable pace [17]. These findings suggest that walking is correlated with frontal brain activity in PD. The PFC is associated with cognitive regulation, working memory, and information synthesis, and all of these are necessary for sophisticated behavior [20]. Additionally, walking is influenced by posture control [21]. Posture control is primarily controlled by the sensory feedback system of the parietal lobe and further affected by other advanced cortical control functions such as sensorimotor integration, adaptation, and anticipation mechanisms [22]. The parietal lobe underlies behavioral control, intermodal integration of attention, and the processing of external incoming sensory signals [23]. Therefore, both the PFC and parietal lobes are involved in walking. However, how the PFC and parietal lobe are connected during walking is currently unknown. It is important to investigate the interaction patterns between the PFC and parietal lobe during walking.
Our study aimed to investigate the EC patterns between the PFC and parietal lobes during walking tasks performed by individuals with PD and healthy older individuals and to compare differences in the EC coupling strength of individuals with PD and healthy older individuals. We hypothesized that PD would show increased EC coupling strength compared to healthy older individuals because walking capabilities in PD may rely on compensation from cortical regions.
MATERIALS AND METHODS
Participants
Thirty individuals with PD and 22 healthy older individuals (i.e., the control group) were enrolled in this study. We used a convenience sample based on previous EC studies with a similar sample size [14, 24]. Everyone in the group was right-hand-dominant. The following were the inclusion criteria for the PD group: a diagnosis of PD based on the 2015 Movement Disorder Society (MDS) clinical diagnostic criteria [25]; stage I to III PD according to the Hoehn-Yahr (H-Y) staging scale [26]; the ability to walk independently without any assistive devices; and on a stable dose of medication for at least 4 weeks. The exclusion criteria were as follows: obvious cognitive impairment (Mini-Mental State Examination [MMSE] score <24); additional conditions impacting gait (e.g., musculoskeletal diseases, poor eyesight, vestibular difficulties); severe postural hypotension; freezing of gait; and limitation of movement for more than 2 min.
This study was approved by the Ethics Committee of Tianjin Huanhu Hospital, and it was registered in the Chinese Clinical Trial Registry as “Analysis of related factors of function of participants with Parkinson’s disease” (the registration number is ChiCTR1900022655; https://www.chictr.org.cn/showprojen.aspx?proj=38201). All participants provided written informed consent before participation. This work was conducted in accordance with the principles of the Declaration of Helsinki and its later amendments.
Procedures
We evaluated the demographic characteristics and cognitive status of the two groups. The MMSE scale was used to evaluate overall cognitive function [27]. The Movement Disorders Society-United Parkinson’s Disease Rating Scale (MDS-UPDRS) Part III was used to evaluate the severity of motor symptoms [28]. The postural instability and gait difficulty (PIGD) score calculated based on the MDS-UPDRS was used to evaluate the PIGD severity [29]. The H-Y staging scale was used to determine the PD stage [26]. The most affected limb was determined based on the bilateral MDS-UPDRS sub scores.
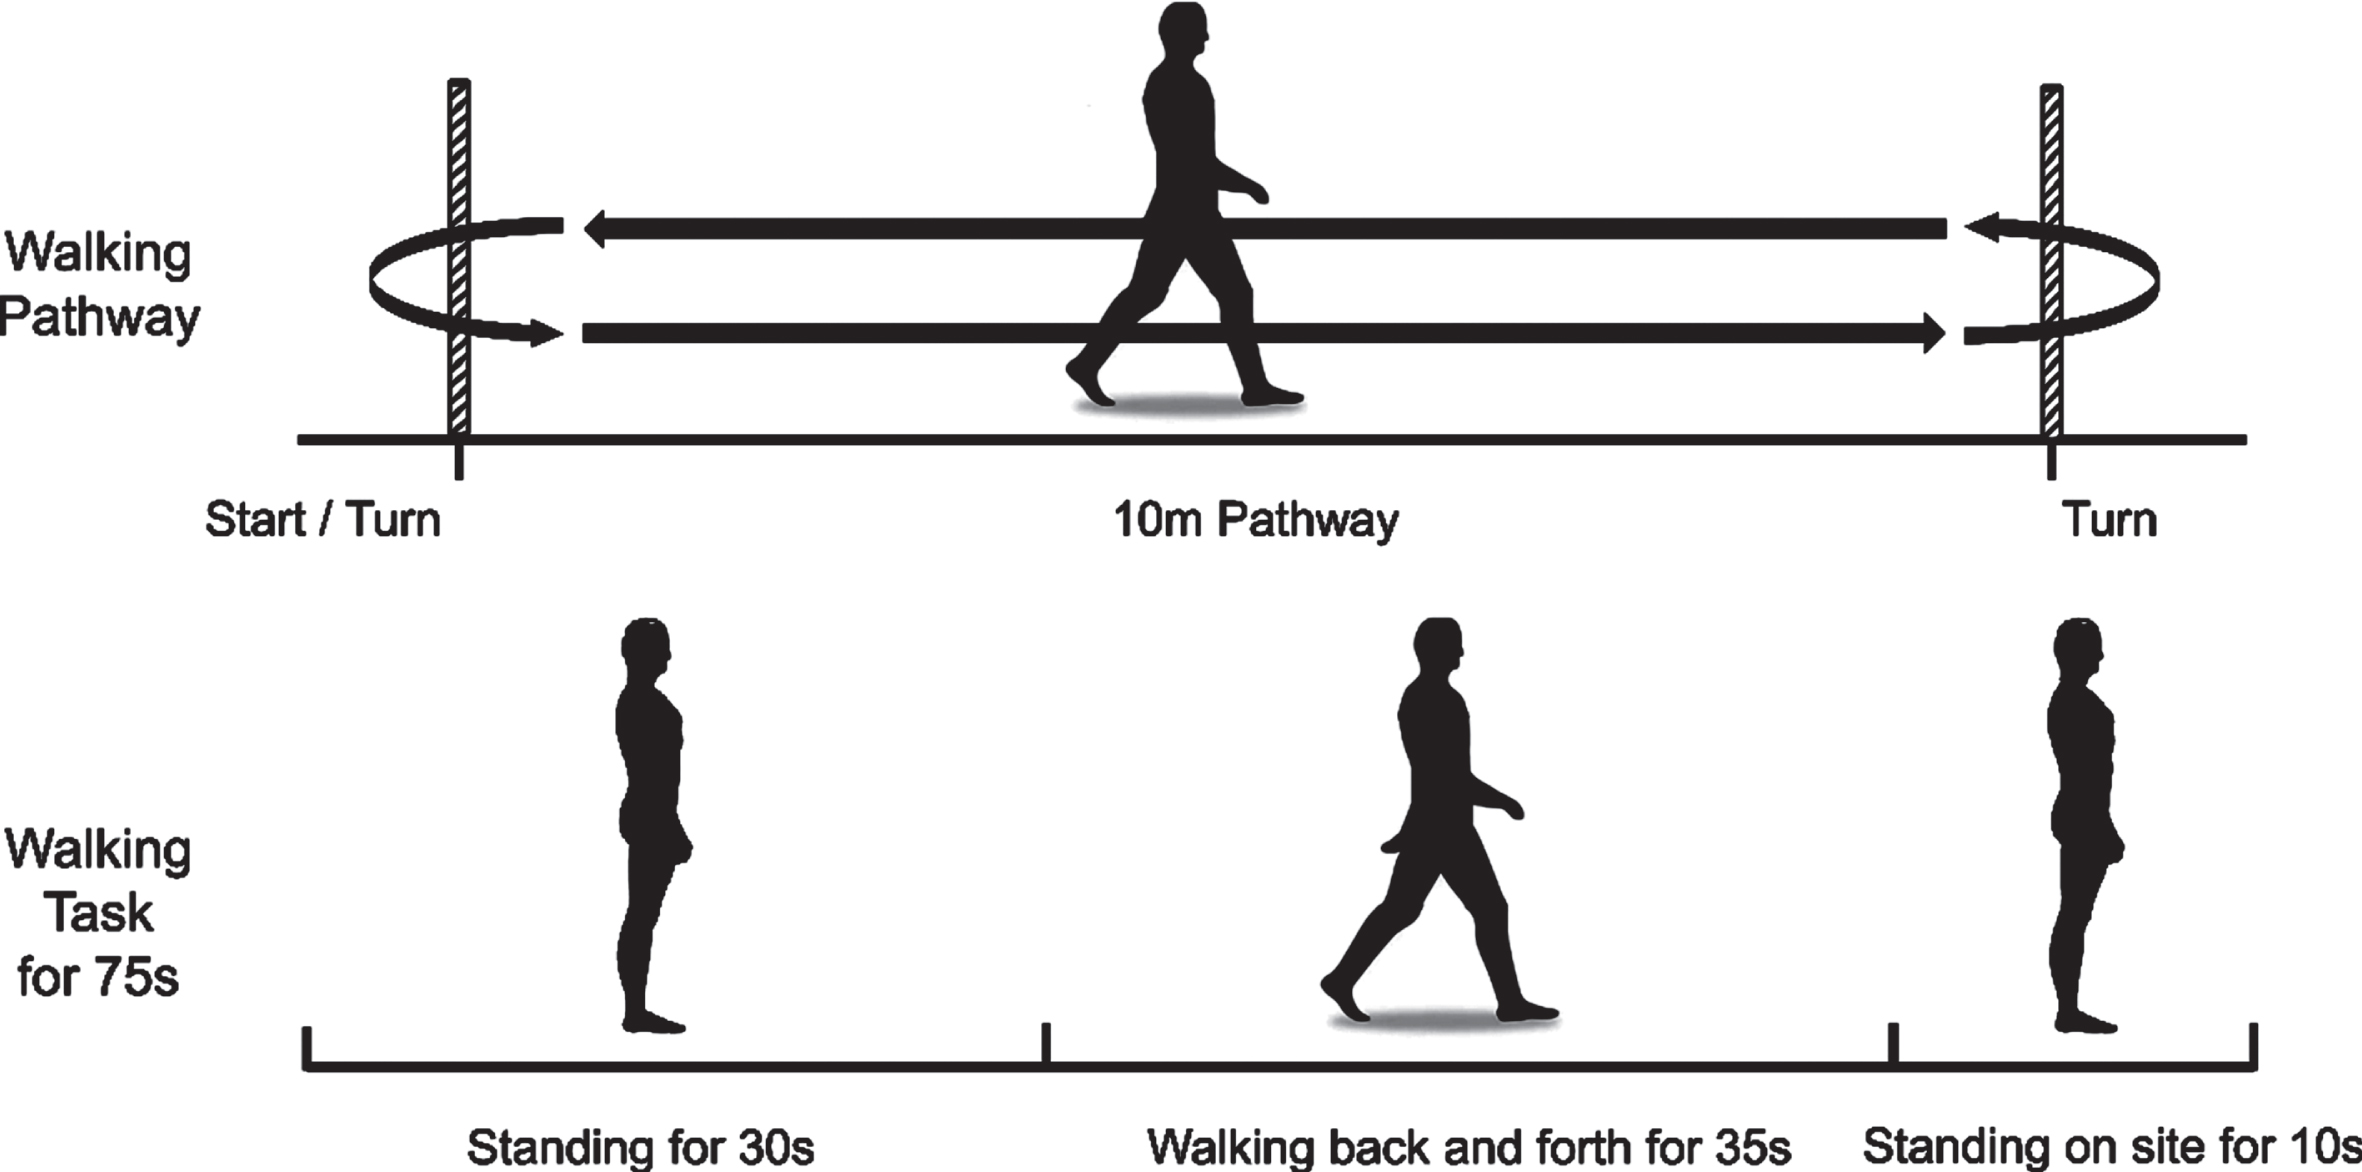
Participants were required to walk at a normal and relaxed speed on a 10-m straight footpath. Each trial was started by standing for 30 s, followed by walking for 35 s, and stopped by standing on site for 10 s (Fig. 1). During this standing time, we asked participants to look straight ahead and not think of anything specific. The participants performed the same walking test three times. A 2-min rest period followed each walking test. Participants needed to complete the whole course. Individuals with PD were evaluated in the off-state because the off-state responds to the pathological state of PD and avoids the influence of drug status on the response.
Fig. 1
Experimental paradigm. Walking at a usual and relaxed speed on a 10-m footpath. Each trial started with standing for 30 s, followed by walking for 35 s, and stopped by standing on site for 10 s. The participants performed the same walking test three times.
fNIRS data recording
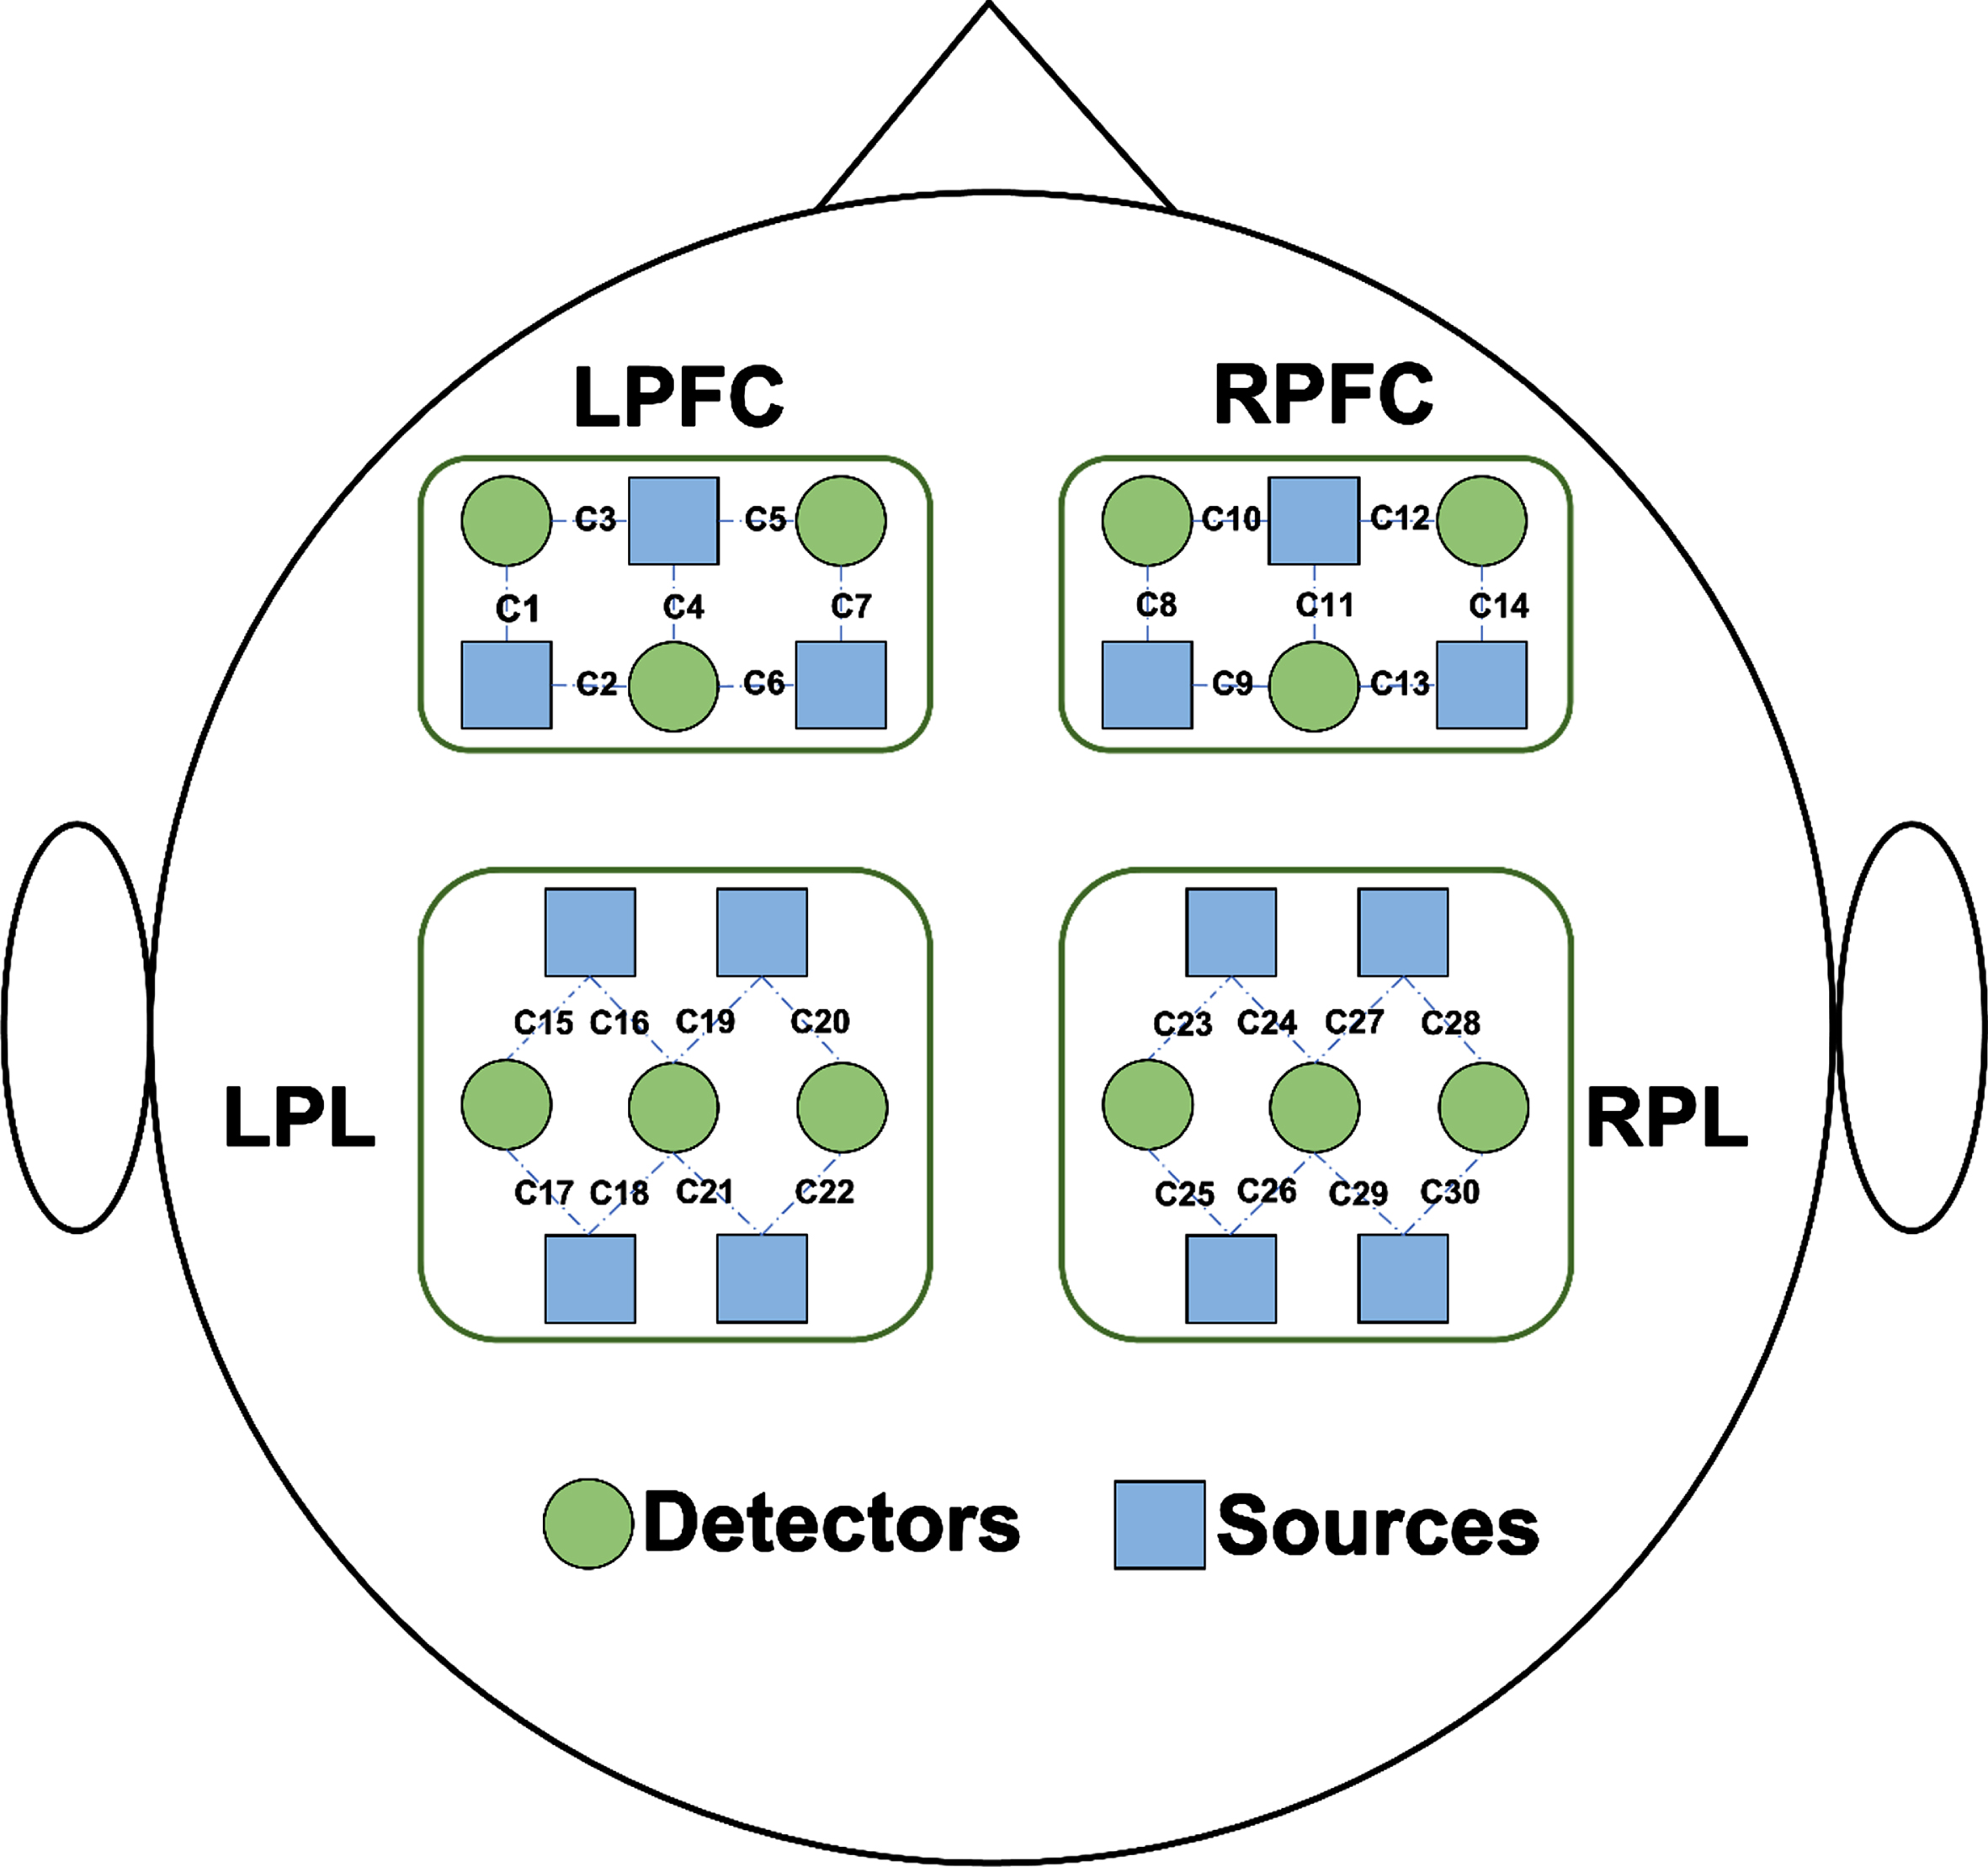
Brain signals were collected using a portable fNIRS system (Nirsmart; Danyang Huichuang Medical Equipment Co., Ltd., Danyang, China). The fNIRS system used near-infrared light at 730 and 850 nm to measure the optical intensities of oxygenated hemoglobin (HbO2) and deoxygenated hemoglobin (HHb) at a sampling rate of 11 Hz; 26 fNIRS probes (14 sources and 12 detectors) were placed on the left prefrontal cortex (LPFC), right prefrontal cortex (RPFC), left parietal lobe (LPL), and right parietal lobe (RPL), resulting in 30 fNIRS channels (Fig. 2). The instrument was based on the principle of three-dimensional positioning and the international 10–20 system of electrode placement. The nasion, inion, and left and right preauricular points were anatomical reference points. The determination of 10–20 system regions of interest (ROI) was based on the standardization of different cap sizes from XS to L sizes to match different head circumferences. The source detector distance was 3 cm. The participants wore black hoods to reduce ambient light interference with light signals. Signal quality was checked by visual inspection.
Fig. 2
Schematic diagram of the experimental setup. Distribution of functional near-infrared spectroscopy (fNIRS) probes. Twenty-six fNIRS probes (14 sources and 12 detectors) were placed on the left prefrontal cortex (LPFC), right prefrontal cortex (RPFC), left parietal lobe (LPL), and right parietal lobe (RPL), resulting in a total of 30 fNIRS channels. Sources and detectors are shown as blue rectangles and green circles.
Data preprocessing
The fNIRS data were preprocessed using Nirspark (Danyang Huichuang Medical Equipment 186 Co., Ltd., China) and Spyder (Python 3.7). The recorded optical intensities were converted to concentration change parameters for oxygenated hemoglobin (HbO2) and deoxygenated hemoglobin (HHb) according to the (modified) Beer-Lambert law [30]. The converted signals were filtered with a 0.01- to 0.2-Hz bandpass Butterworth filter to eliminate physiological noise such as heart rhythms, respiration, and Mayer waves [31, 32]. The motion artifacts of filtered signals were identified by a sliding window with the standard deviation and amplitude thresholds and removed by cubic spline interpolation [33, 34]. The processed ΔHbO2 signals during walking were extracted and evaluated by referring to a 5-s baseline interval before walking. Because a sufficient duration was required to observe the onset (approximately 1-2 s after neural firing) and peak (approximately 4–7 s) of the hemodynamic response [35], the processedΔHbO2 signals between 3 and 33 s during walking were extracted. All fNIRS channels were included in the data analysis. The signal was analyzed as the average of each channel in each trial. The relative change of theΔHbO2 concentration under each experimental condition was evaluated by subtracting the average concentration during task execution from each baseline concentration.
Effective connectivity
Dynamic interactions between different cerebral regions can be analyzed using EC, and a commonly used method for evaluating EC is transfer entropy (TE) [11, 36]. TE considers the common history between two processes by calculating the mutual information of the two conditions. To illustrate, let X and Y represent two random processes. TE from Y to X (TY,X) is defined as follows:
(1)
(2)
(3)
Regional EC and main coupling directions
To investigate the EC between cerebral areas, the calculated TE values of all feasible couples of 30 channels throughout the four cerebral areas were determined (Fig. 2): from LPFC to RPFC; from LPFC to LPL; from LPFC to RPL; from RPFC to LPFC; from RPFC to LPL; from RPFC to RPL; from LPL to LPFC; from LPL to RPFC; from LPL to RPL; from RPL to LPFC; from RPL to RPFC; and from RPL to LPL (from Region 1 to Region 2 indicates the influence of Region 1 on Region 2).
We compared regions against regions. The signal of each region was the average value of the optodes signals contained in the region. For each channel pair coupling (from Region 1 to Region 2 and from Region 2 to Region 1), we defined the main coupling direction (mCD) of the communication between the two regions if there was a statistical difference in the EC strength between the two channels. The mCD indicates that the coupling between two areas is dominated by this direction. One region acts as a major coupling generator and has a major regulatory role, whereas the other region acts as a regulatory target [24]. If there was no statistical difference between the two channels, we considered that there was no mCD between the two regions (meaning that there was no main functional coupling source between the brain regions). Therefore, in this situation, the two cerebral regions were considered bidirectional (i.e., it was concluded that the cerebral regions regulated each other).
Gait assessment
Gait assessment was performed using a wireless APDM Movement Monitoring inertial sensor system (Mobility Lab, APDM Inc., USA). Six APDM sensors were used, they were installed on the left and right wrist, sternum, waist, and left and right foot. Movement monitors were combined with a number of sensors within a single package, including a three-axis accelerometer, gyro, and magnetometer. The APDM and fNIRS data were collected simultaneously during walking. All steps recorded by the APDM were considered for analysis, including the gait cycle duration, gait speed, and stride length. Moreover, variabilities of the gait cycle duration, gait speed, and stride length were calculated using the coefficient of variation, which was defined as follows: (standard deviation/mean value)×100%. The gait results of three trials were averaged.
Statistical analysis
SPSS statistical software (version 25.0, Chicago, IL, USA) was used for statistical analyses. Regarding the participant characteristics, quantitative data conforming to normal distribution were expressed as the mean±standard deviation (x±s), and the difference between the PD and healthy control groups was evaluated by one-way ANOVA. The MDS-UPDRS scores of the “off” and “on” state were evaluated by the paired t test. Qualitative data differences between groups were evaluated by χ2 tests. Significant differences in the EC coupling strength between the PD and healthy control groups were assessed by one-way ANOVA. The Pearson correlation coefficient was used to analyze the correlation between cortical EC coupling strength and walking performance in order to explore the correlation between cerebral cortical activity and behavioral performance. Statistical significance level for all analyses was set as p < 0.05 (two-sided).
RESULTS
Table 1 summarizes the medical and population statistics characteristics. There was no significant difference in sex, age, height, and weight of individuals with PD and healthy controls (p > 0.05). There was no significant difference between the MMSE scores of individuals with PD and healthy controls (p > 0.05), indicating that the cognitive levels of individuals with PD and healthy controls in this study were similar. As expected, the MDS-UPDRS III scores showed statistical differences between the PD “off” and “on” states (p < 0.001).
Table 1
Participant characteristics (mean±SD)
| HC group | PD group | p | Effect size of Cohen d | |
| Age (y) | 61.0±6.4 | 62.4±7.2 | 0.455 | –0.2 |
| Sex (male/female) | 12/10 | 15/15 | 0.752 | |
| Height (cm) | 166.2±8.3 | 165.7±8.1 | 0.808 | 0.06 |
| Weight (kg) | 70.7±8.7 | 68.6±10.9 | 0.453 | 0.21 |
| MMSE (score) | 27.2±1.5 | 27.5±1.9 | 0.579 | –0.16 |
| MDS-UPDRS III, off (score) | 32.8±11.9 | 0.000a | 1.32 | |
| MDS-UPDRS III, on (score) | 19.2±8.5 | |||
| PIGD score of MDS-UPDRS (score) | 2.8±1.7 | |||
| H-Y stage (1/2/3) | 2/6/22 | |||
| Most affected limb (left/right) | 14/16 | |||
| Disease duration (y) | 5.0±3.0 |
MMSE, Mini-Mental State Examination; MDS-UPDRS III, Movement Disorders Society—Unified Parkinson Disease Rating Scale, part III; PIGD, postural instability and gait difficulty; H-Y, Hoehn and Yahr Scale.aDifference between the PD “off” and “on” state, p < 0.05.
Effective connectivity mCD pattern
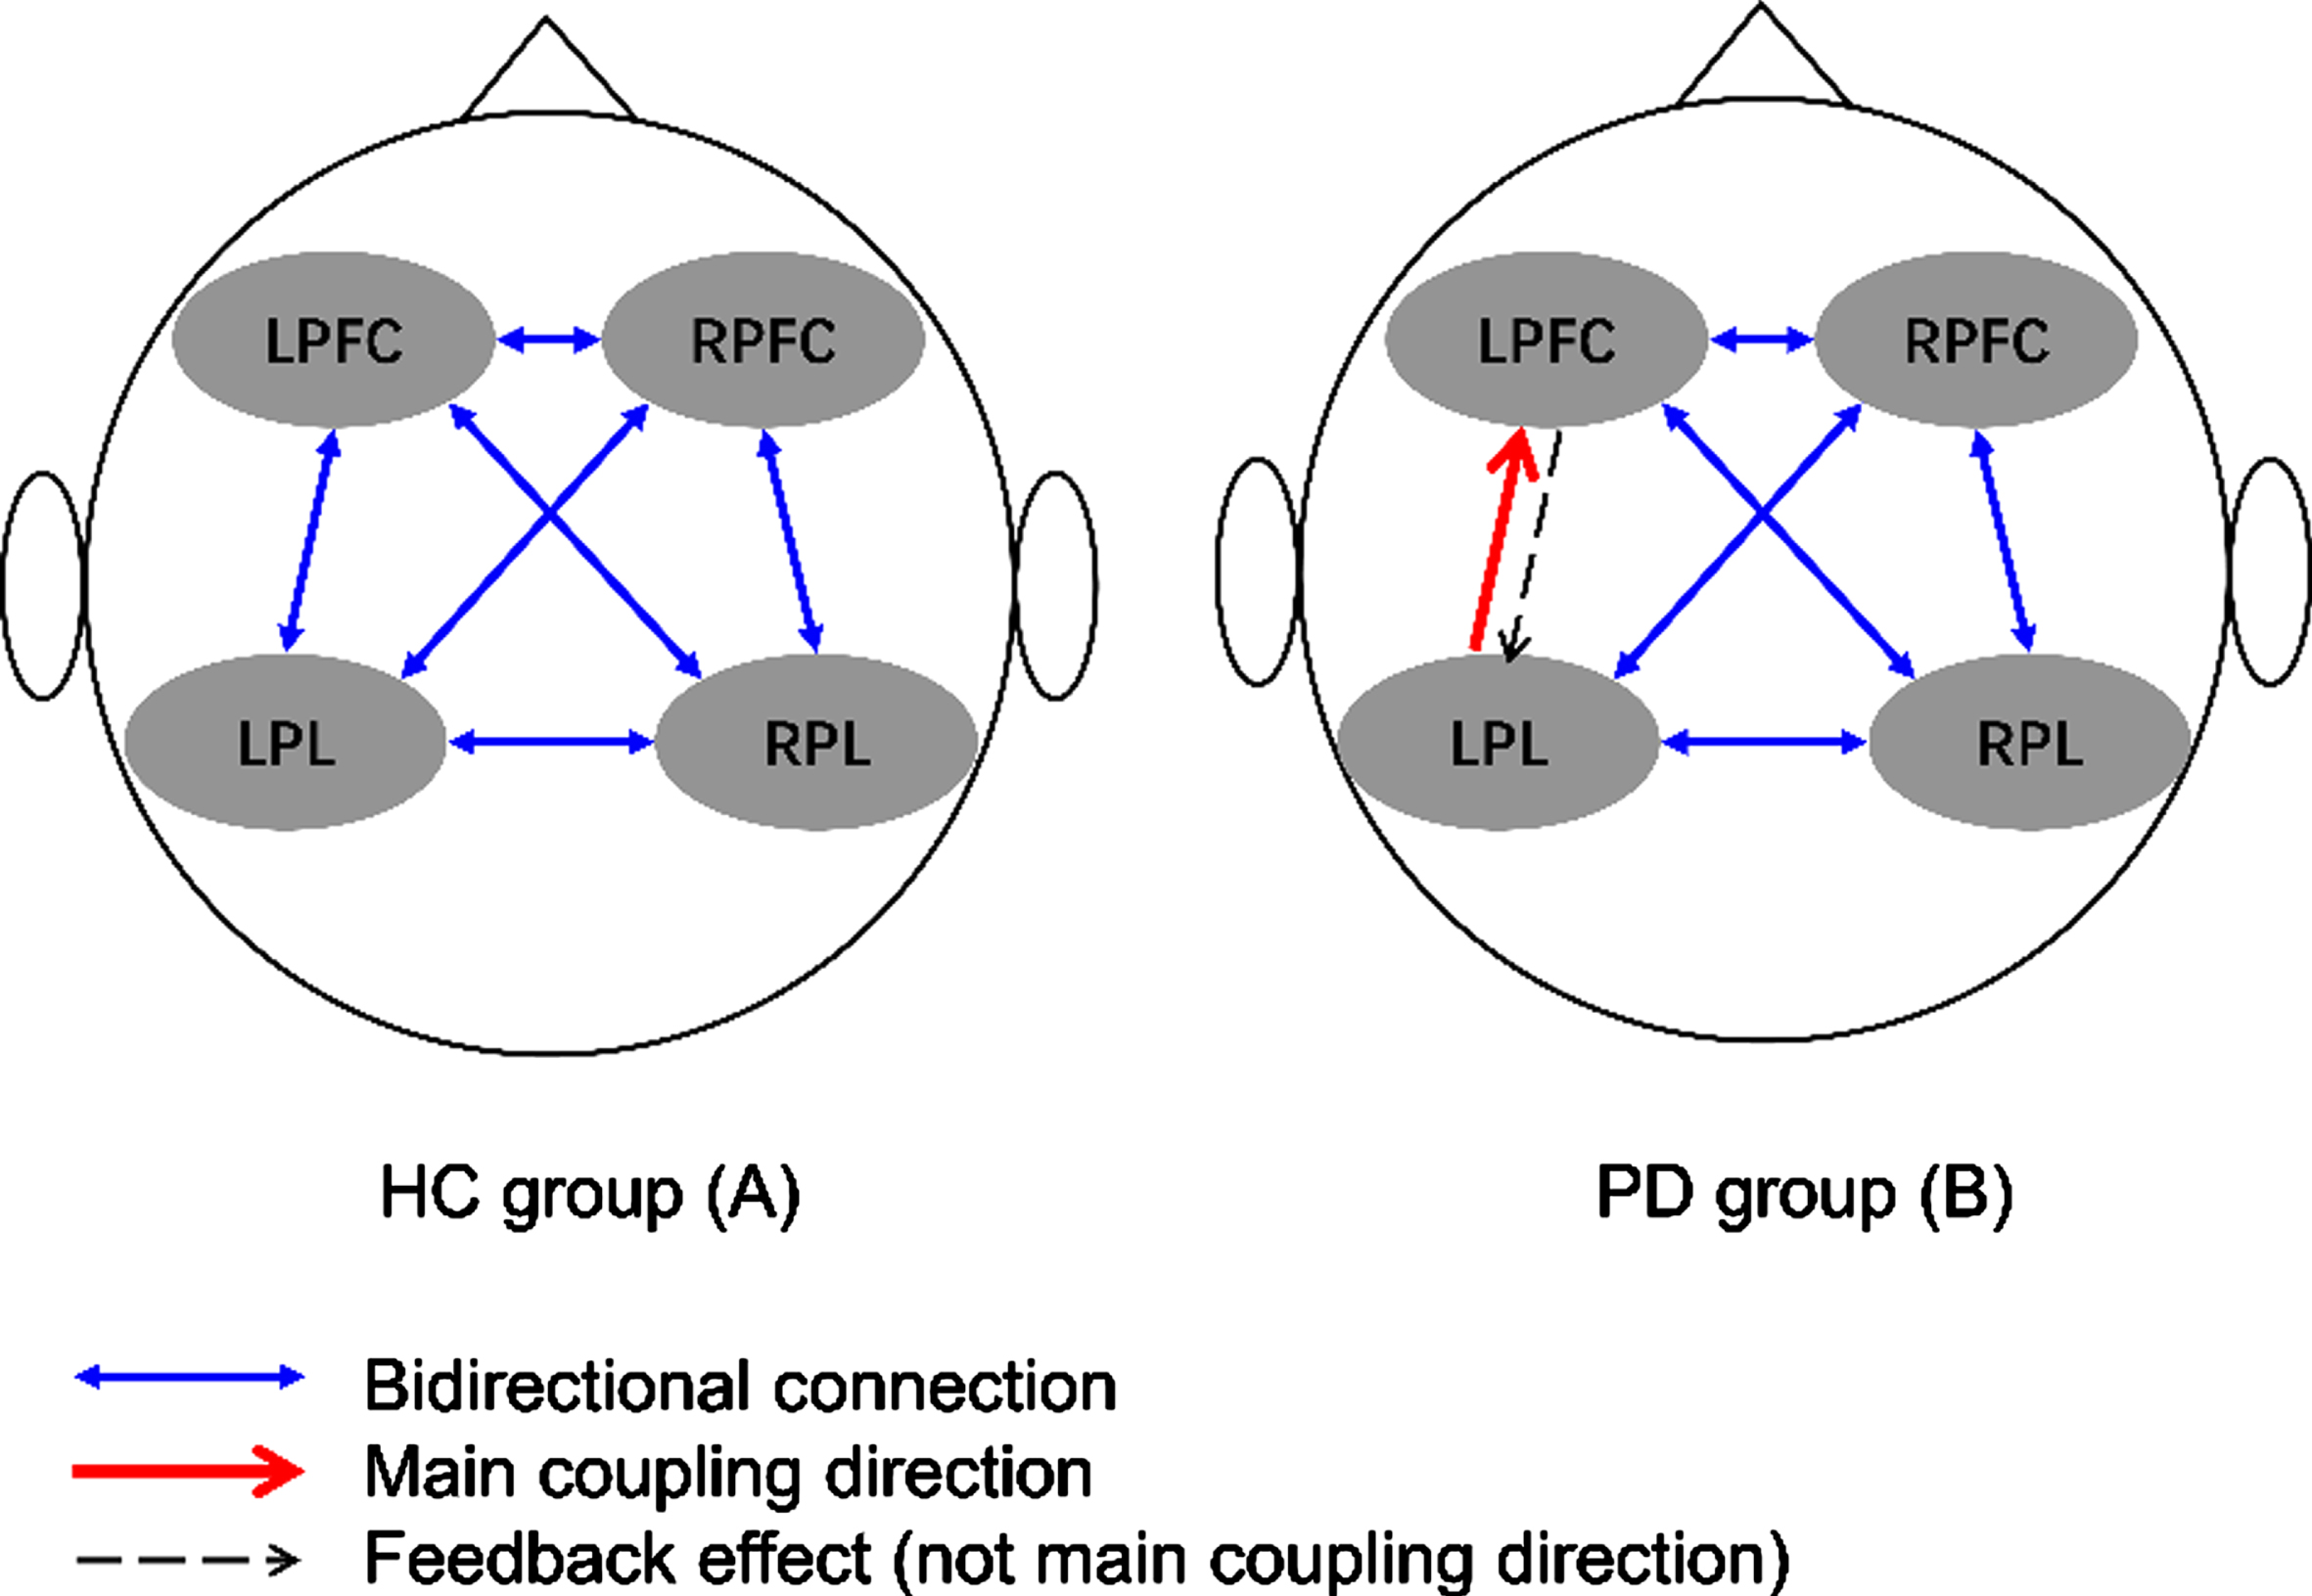
Figure 3 depicts the interregional coupling direction during walking among the four evaluated cerebral regions of healthy controls and individuals with PD. No mCD was observed among the four cerebral regions during walking performed by the healthy controls. In the PD group, the main detected interregional coupling direction was from the LPL to the LPFC.
Fig. 3
Main coupling directions (mCDs) among brain regions in healthy controls (A) and individuals with Parkinson’s disease (B). LPFC, left prefrontal cortex; LPL, left parietal lobe; RFFC, right prefrontal cortex; RPL, right parietal lobe.
EC coupling strength
Figure 4 compares the healthy control and PD groups in terms of regional EC coupling strength. Compared with the healthy control group, the PD group had statistically significantly increased EC coupling strength in the connectivity types from LPL to LPFC (p = 0.008; effect size of Cohen d = –0.77), from LPL to RPFC (p = 0.010; effect size of Cohen d = –0.74), and from LPL to RPL (p = 0.018; effect size of Cohen d = –0.68).
Fig. 4
Comparison of regional effective connectivity (EC) between the healthy controls (HC) and Parkinson’s disease (PD) group. (A) Connectivity from the LPFC to the RPFC, LPL, and RPL. (B) Connectivity from the RPFC to the LPFC, LPL, and RPL. (C) Connectivity from the LPL to the LPFC, RPFC, and RPL. (D) Connectivity from the RPL to the LPFC, RPFC, and LPL. LPFC, left prefrontal cortex; LPL, left parietal lobe; RFFC, right prefrontal cortex; RPL, right parietal lobe. *p<0.05.
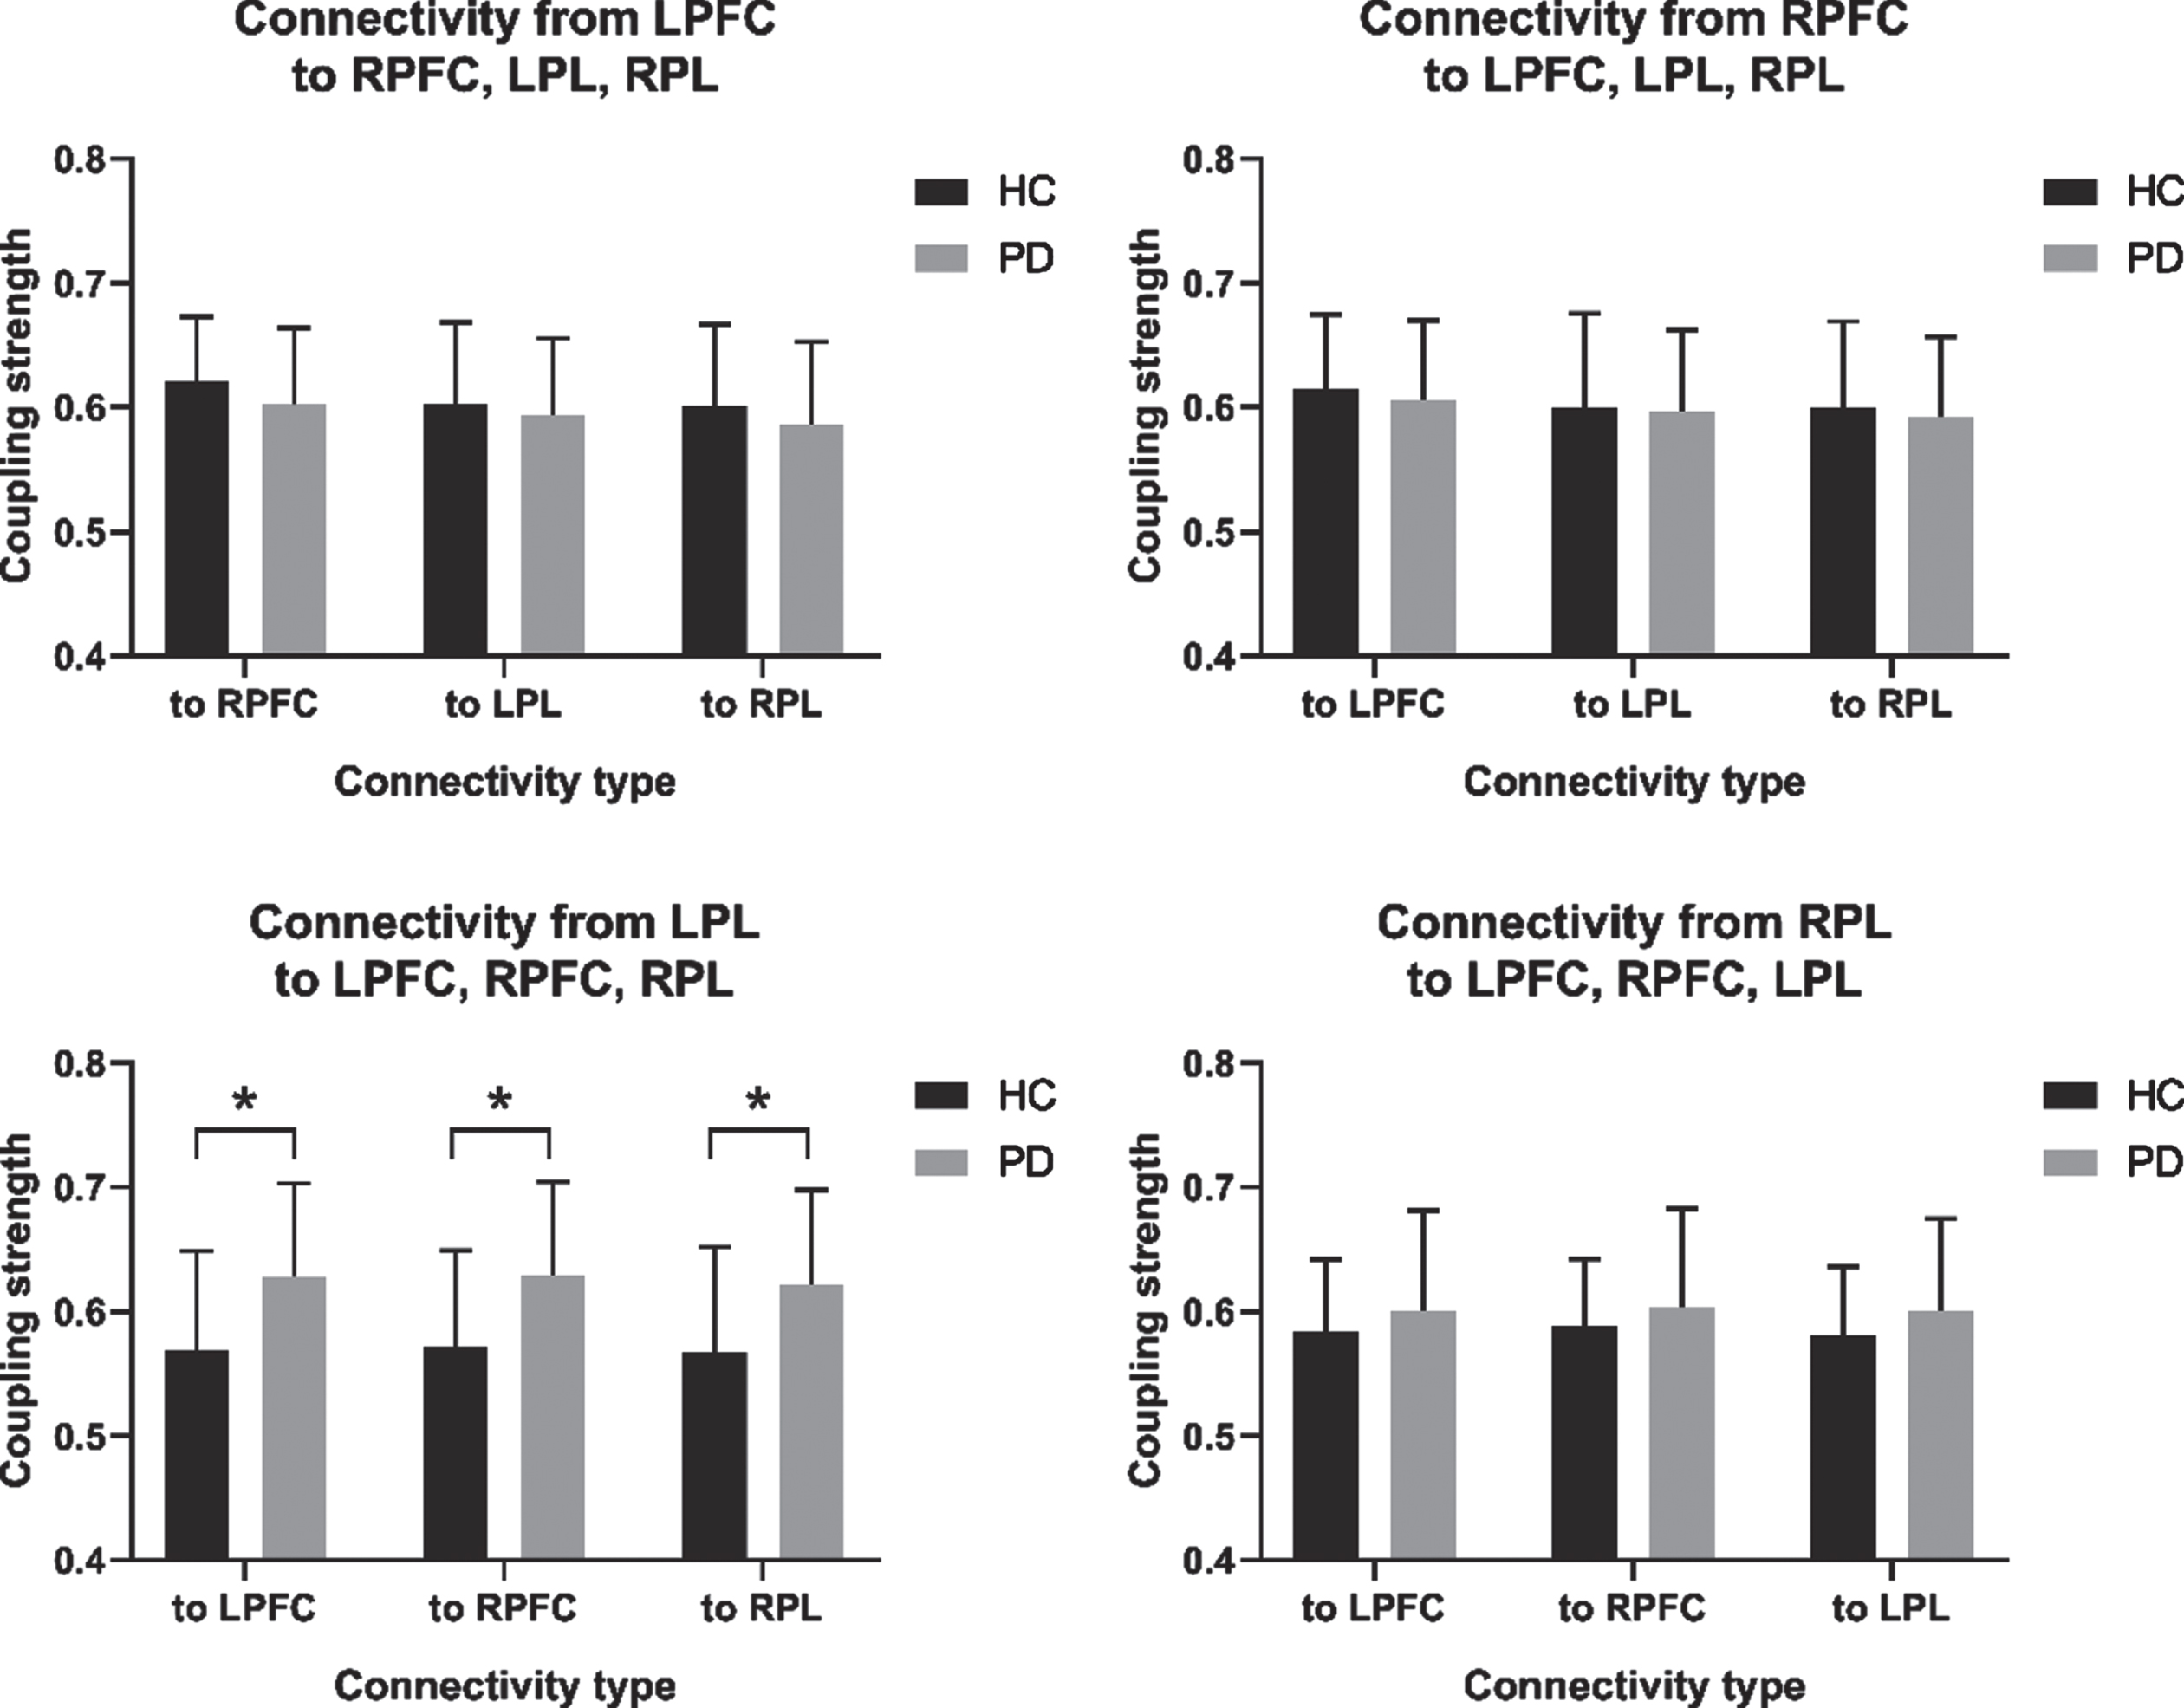
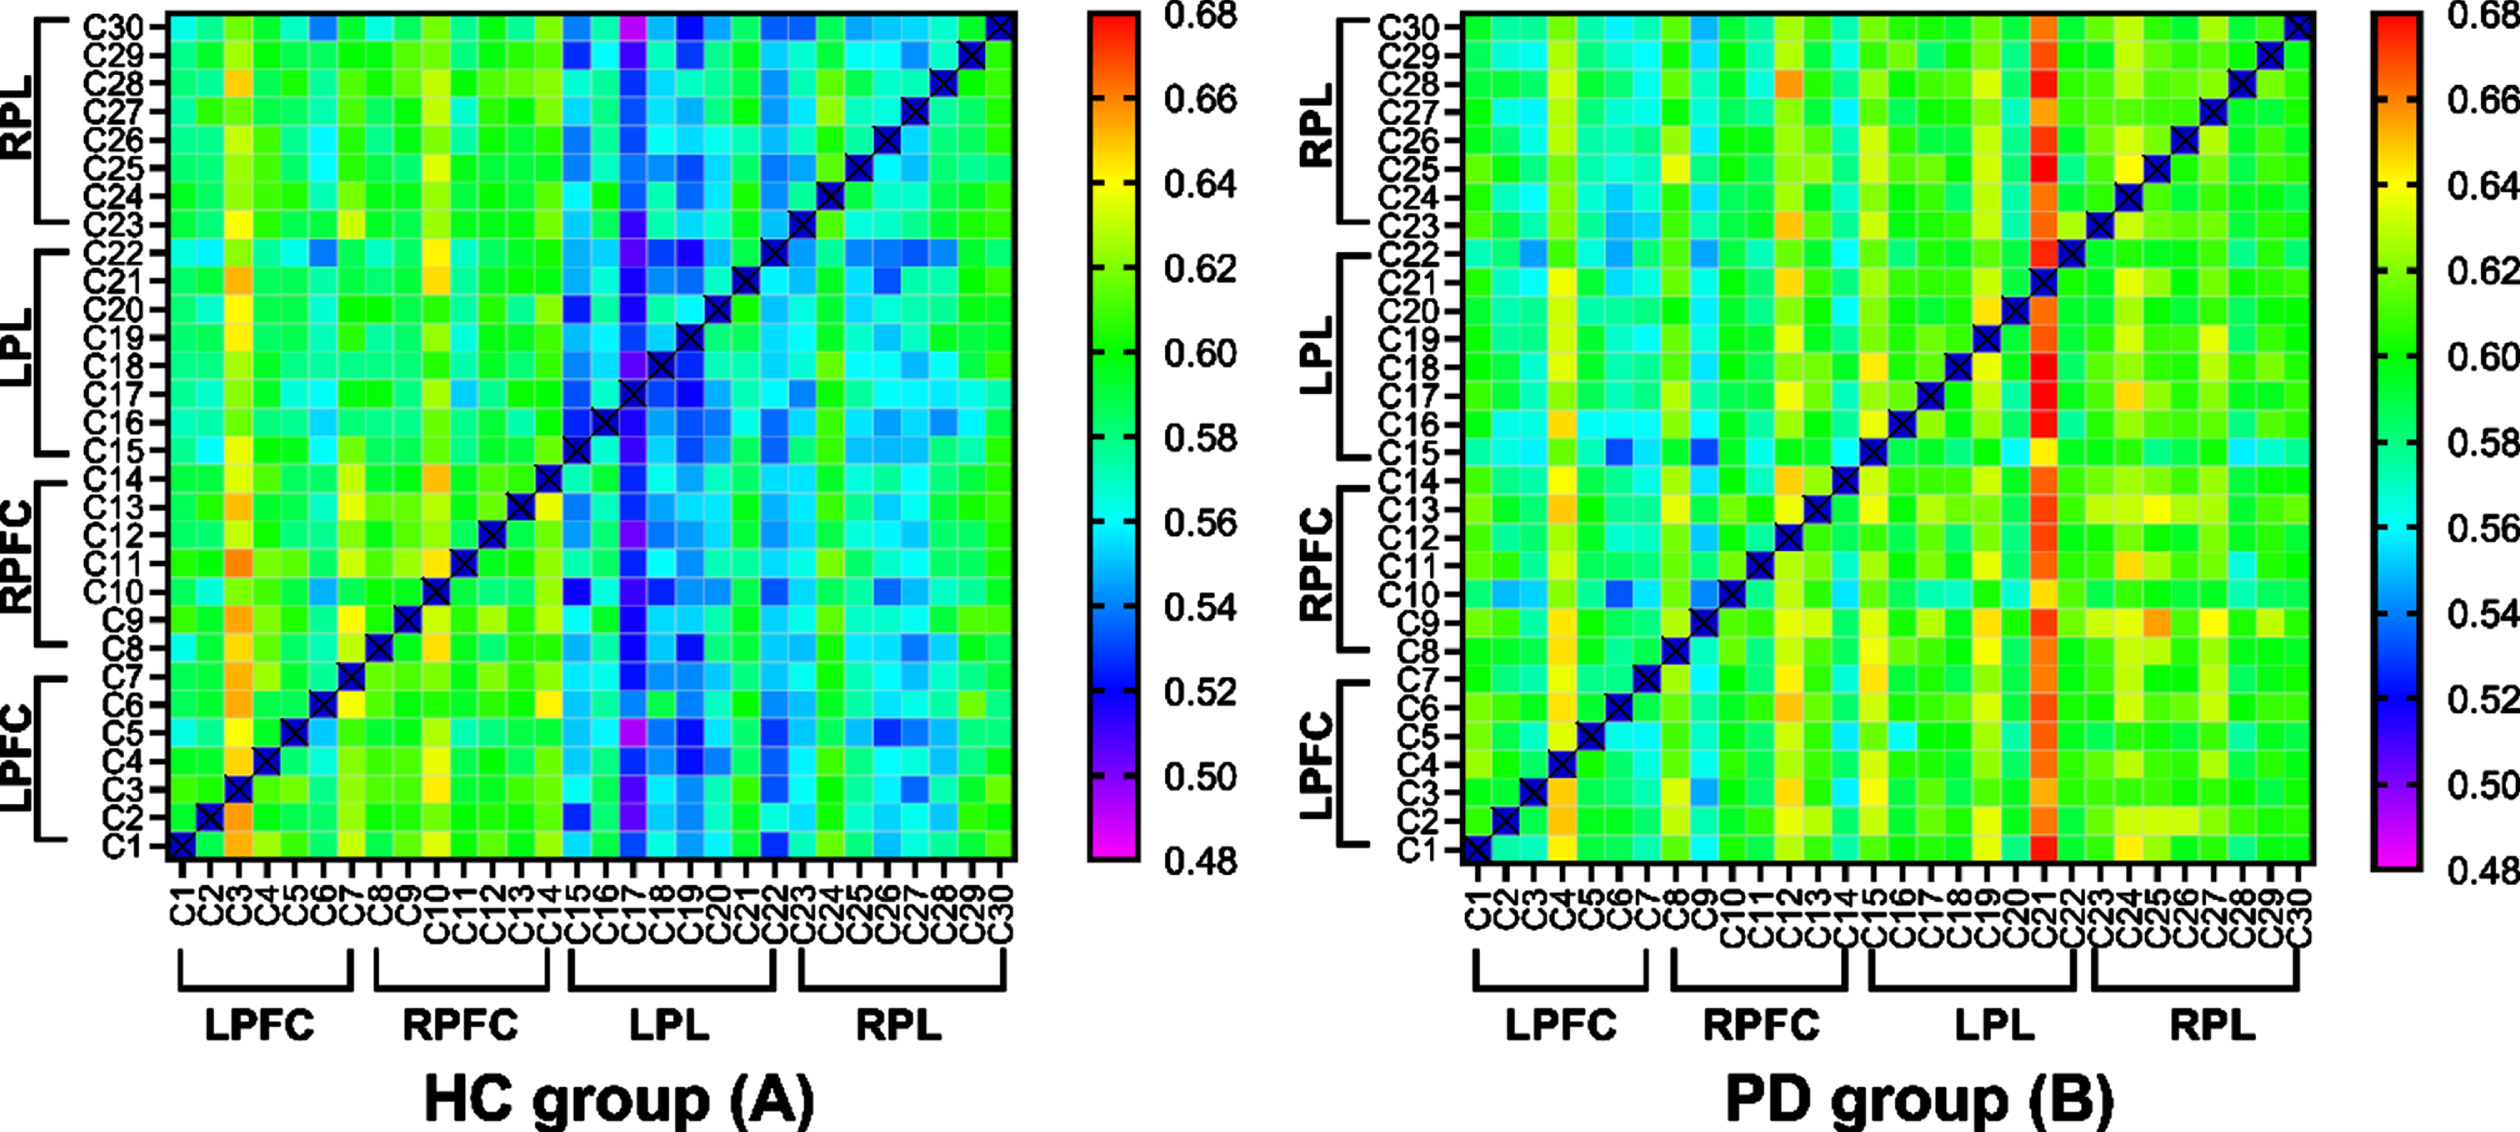
Figure 5 shows the EC matrices calculated from the fNIRS measurements of the healthy controls (A) and PD (B) group in the off state. The x- and y-axes of the square frames show the channel numbers within functional near-infrared spectroscopy (fNIRS), and the color at (x,y) indicates the value of the connectivity matrix (which represents the connectivity strength from channel x to channel y). Warmer colors indicate a higher connection strength. Compared to the healthy controls, the individuals with PD had a warmer color in the following channels: from the LPL to the LPFC; from the LPL to the RPFC; and from the LPL to the RPL.
Fig. 5
Effective connectivity (EC) matrices for healthy controls and PD group. The x-axes and y-axes of the square frames show the channel numbers within functional near-infrared spectroscopy (fNIRS), and the color at (x,y) indicates the value of the connectivity matrix (which represents the connectivity strength from channel x to channel y). LPFC, left prefrontal cortex; LPL, left parietal lobe; RFFC, right prefrontal cortex; RPL, right parietal lobe.
Behavioral performance
Table 2 illustrates the detected differences in behavioral performance between the healthy control and PD groups. As expected, individuals with PD had a slower gait speed (p = 0.004; effect size of Cohen d = 0.85), shorter stride length (p = 0.001; effect size of Cohen d = 1.00), higher speed variability (p = 0.024; effect size of Cohen d = –0.60), and higher stride length variability (p = 0.029; effect size of Cohen d = –0.63) than healthy controls.
Table 2
Gait parameters of the healthy controls and PD groups
| Gait parameters | HC group | PD group | p | Effect size of Cohen d |
| Gait cycle duration (s) | 1.06±0.07 | 1.06±0.10 | 0.890 | –0.04 |
| Gait speed (m/s) | 1.13±0.15 | 0.97±0.22 | 0.004* | 0.85 |
| Stride length (m) | 1.19±0.12 | 1.02±0.21 | 0.001* | 1.00 |
| Double support (% GCT) | 19.38±3.16 | 21.39±4.89 | 0.098 | –0.47 |
| Coefficient of variation | ||||
| Gait cycle duration (%) | 2.19±0.65 | 2.67±1.12 | 0.060 | –0.50 |
| Gait speed (%) | 4.81±1.82 | 6.68±3.78 | 0.024* | –0.60 |
| Stride length (%) | 4.09±1.85 | 6.08±3.83 | 0.029* | –0.63 |
*p < 0.05.
Associations between EC coupling strength and behavioral performance
In the healthy controls group, we found that the EC coupling strength of from RPFC to LPFC (r = –0.523, p = 0.012), from RPFC to LPL (r = –0.574, p = 0.005), and from RPFC to RPL (r = –0.630, p = 0.002) was negatively correlated with gait speed (Table 3). The EC coupling strength of from RPL to LPFC (r = 0.447, p = 0.037) and from RPL to LPL (r = 0.514, p = 0.014) was positively correlated with the coefficient of variation of gait speed (Table 4). However, no significant correlation between gait speed and speed variability was found in the healthy controls group. In individuals with PD, we found that the EC coupling strength from LPL to RPFC (r = –0.379, p = 0.039) was negatively correlated with gait speed. This negative correlation also has a weak trend in the EC type from LPL to LPFC (r = –0,330, p = 0.075) and from LPL to RPL (r = –0.358, p = 0.052). The EC coupling strength of from LPL to RPFC (r = 0.421, p = 0.021) and from LPL to RPL (r = 0.431, p = 0.017) was positively correlated with the coefficient of variation of gait speed. This positive correlation also has a weak trend in the EC type from LPL to LPFC (r = 0,347, p = 0.061). Additionally, we found that gait speed and speed variability were significantly negatively correlated in the PD group (r = –0.570, p = 0.001).
Table 3
Correlation between EC coupling strength and gait speed
| EC type | Healthy controls group | Parkinson’s Disease group | ||
| r | p | r | p | |
| RPFC⟶LPFC | –0.523 | 0.012* | 0.346 | 0.061 |
| RPFC⟶LPL | –0.574 | 0.005* | 0.311 | 0.094 |
| RPFC⟶RPL | –0.630 | 0.002* | 0.344 | 0.062 |
| LPL⟶LPFC | –0.083 | 0.712 | –0.330 | 0.075 |
| LPL⟶RPFC | –0.091 | 0.686 | –0.379 | 0.039* |
| LPL⟶RPL | –0.169 | 0.451 | –0.358 | 0.052 |
*p < 0.05.
Table 4
Correlation between EC coupling strength and coefficient of variation of gait speed
| EC type | Healthy controls group | Parkinson’s Disease group | ||
| r | p | r | p | |
| LPL⟶LPFC | 0.110 | 0.625 | 0.347 | 0.061 |
| LPL⟶RPFC | 0.013 | 0.955 | 0.421 | 0.021* |
| LPL⟶RPL | 0.041 | 0.856 | 0.431 | 0.017* |
| RPL⟶LPFC | 0.447 | 0.037* | –0.105 | 0.581 |
| RPL⟶RPFC | 0.396 | 0.068 | –0.035 | 0.853 |
| RPL⟶LPL | 0.514 | 0.014* | –0.053 | 0.781 |
*p < 0.05.
DISCUSSION
To our knowledge, this is the first study to investigate EC patterns in the cerebral cortex during walking tasks performed by individuals with PD and compare them with those of healthy controls. The mCD of EC reflects the driving relationships among different cerebral regions and the directions of these driving relationships [14]. This provides information regarding the functional hemodynamic responses in the brain. We observed that EC did not exhibit any mCD during walking tasks completed by healthy controls. This result supports the previous idea that, because of the long-term development of daily walking capabilities, this motor task has reached a level of automation that does not require complex cortex regulation in healthy individuals [38]. Previous studies of brain FC have shown that a lack of visible prefrontal activation is consistent with the automation of motor tasks [39]. Moreover, our findings support previous findings that, in healthy controls, motor control and parietal areas are less activated when exercise is automated [40].
In contrast, we observed that the mCD of individuals with PD occurred during walking from the LPL to the LPFC. Additionally, greater speed and greater stride length variabilities indicated that individuals with PD had decreased automaticity during walking tasks [4]. These results support previous observations that PD affects the subcortical pathway, resulting in dysfunction in automatic motion control and leading to the transformation of automatic gait control to cortical control [41, 42]. Moreover, compared with healthy controls, individuals with PD required higher activation of the cerebellum, premotor area, and parietal cortex to make automatic movements [41]. Additionally, the mCD from the LPL to the LPFC indirectly showed that the coupling direction from the LPFC to the LPL was weakened, indicating that the left prefrontal lobe is mainly regulated by the left parietal lobe during walking tasks in this population as well as demonstrating a decrease in connection transfer efficiency. The interpretation of mCD results may also be enhanced from LPL to LPFC, which is normal in the direction from LPFC to LPL. Since, there was no difference in the EC coupling strength from LPFC to LPL between the PD and healthy controls group.
In previous studies, the PFC was found to be more active during walking tasks performed by individuals with PD [43–45]. Moreover, according to a recent fNIRS study, PD inhibits LPFC activity during dual-task walking [46]. We also noted that the LPFC appears to be involved in working memory [47]. Although individuals with PD usually have impaired frontal function during frontal lobe-related tasks, research has shown that PD requires higher brain activity to perform automatic movements (including brain activity in the parietal cortex) [41]. Therefore, it seems that low-efficiency brain activity of individuals with PD is compensated for by increased premotor parietal activation during automatic motor execution. The current hypothesis also supports compensatory increases in premotor and parietal cortex activities in PD [48–50]. Our results suggest that individuals with PD are strongly dependent on the left prefrontal lobe to complete daily walking tasks, and that additional resources may be required from other brain regions as well (mainly regulated by the left parietal lobe).
Another possible explanation for this abnormal EC pattern in individuals with PD may be that individuals with PD have impaired sensorimotor integration. During the walking task administered during this study, the prefrontal cortex was involved in both execution and attention. Moreover, it is well-established that the parietal cortex is responsible for somatosensory perception [51], whereas the posterolateral parietal cortex is responsible for visual and spatial information [52, 53]. Traditionally, PD is considered a motor disorder, and sensory motor networks have a central role in the detection and processing of sensory input, as well as in the preparation and implementation of motor function [54]. Several studies have confirmed abnormal FC in the sensorimotor network (suggesting damaged sensorimotor integration) in PD [55, 56].
Another finding of our study was that EC coupling strength between the left parietal lobe and other brain regions was greater in individuals with PD than in healthy controls. The EC coupling strength from LPL to other brain regions was negatively correlated with gait speed, and positively correlated with speed variability in individuals with PD. Combined with the negative correlation between speed and speed variability in PD group, this suggested that the slower speed of participants with PD, the greater the speed variability, the more unstable the participant during walking, and the greater the impact of the LPL on other brain regions, as shown in Table 2. In the healthy controls group, we observed that EC types of RPFC as the major coupling generator were negatively correlated with speed. However, in the PD group, we found no correlation between the EC types of the PFC as the major coupling generator and behavioral performance. This might indicate that PFC activity is not as straight forward as previously suggested (i.e., more compensation, more activity).
A previous study using EEG measured the EC of eyes-open resting-state EEG signals in individuals with PD and healthy controls found obvious parietal-occipital separation; additionally, the information flow from the parietal and occipital regions to the motor cortex was statistically significantly reduced in individuals with PD [14]. This may be related to the results of individuals with PD who demonstrated decreased regional cerebral blood flow in the bilateral occipital lobe and posterior parietal cortex when compared with the control subjects [57]. Another study based on fMRI, the task was a dynamic balance task simulated on an fMRI-bed, found that the measurement of EC in PD during the process of dynamic balance indicated that individuals with PD had increased EC-associated movement in the parietal lobe and reduced connectivity from the brain stem to other subcortical areas [15]. Both the participants in the EEG and fMRI study were in the on state. Additionally, another research using PET investigated the brain correlates of motor timing task in PD, compared the EC between the off and on state, and found the analysis of EC demonstrated that excessive inhibitory pallidus outflow in the off state is associated to a lack of sufficient frontal activation and dependence on the cerebellum during the motor timing task [16]. In this study, participants with PD also need to lie down to complete motor timing tasks. However, because of the different methods (e.g., regarding imaging technology and task paradigms) implemented in previous studies, cannot meet the condition of definitive brain signal measurements in the walking state, since this process is a standing motion state process. To complete different tasks, the activated brain regions should be different, and the interaction patterns between brain regions will also be different. Moreover, in these studies, participants with PD were in the on state, which may not reflect the pathological effects of PD, because drugs can also affect cortical activity and task performance. This may limit our further exploration of the EC patterns during walking task based on previous studies. In our study, we found that EC of the left parietal lobe increased in individuals with PD. We explain this finding as a manifestation of compensatory hyperfunction in the left parietal lobe. Further research should be done on the correlation between cortex interaction and walking performance, including studying walking under different conditions and in different drug states, to provide a more thorough understanding and better explanation.
Additionally, an interesting finding of the current research was that we observed asymmetrical EC patterns on the left and right sides of the brain. This asymmetric distribution may have occurred because all recruits were right-hand-dominant, and the left hemisphere was the dominant hemisphere. In previous studies, the dominant hemisphere function of the sensory motor network in PD showed a tendency toward neurodegeneration. Moreover, the connection strength of the left brain network in PD has been found to decrease with aggravation of the disease [58]. Connection enhancement also has pathological significance. For instance, a previous study found that the auxiliary motor area and the right primary motor area in PD increased FC with regard to the motor cortex [59], which may be reflective of compensatory functional reorganization after long-term dopamine treatment [60]. Moreover, researchers conducted an fMRI study of handedness and found that the tendency toward handedness seemed to be associated with asymmetry in the frontal and parietal liaison pathways [61]; additionally, activation of this network showed a left bias in right-hand-dominant participants. In our study, the individuals with PD were relatively balanced in terms of the most severely affected side; however, all individuals with PD were right-hand-dominant, thus limiting the possibility of additional exploration of this topic. Therefore, we recommend that future studies should focus on this issue.
Since fNIRS can produce noisy results, it is important that the validity of the entropy measure is accounted for. In previous studies, Granger causality and dynamic causality models have been used to study effective connectivity in neuroscience [62, 63]. Compared with these methods, the characteristics of the transfer entropy method are nonlinear, and are independent of the established model and quantitative analysis [64]. The transfer entropy model has only recently been discovered, and there are still many unknowns. We hope that this study can provide some additional knowledge on the topic.
There were some limitations to our study. First, the fNIRS system can only detect signals in the cerebral cortex and cannot detect the deep structure of the brain, thus limiting our understanding of the putative mechanisms underlying our findings. Second, the spatial resolution of fNIRS is narrow, which restricts more accurate positioning of the brain region of interest; this resulted in a slightly broader partition of the cerebral cortex and a less detailed brain partition in the present study. We aim to refine this partition more comprehensively during our next research effort. Third, there were technical limitations of the filtering technology we used for the analysis. The technology we used was able to filter the noise with the bandpass Butterworth of 0.01–0.2 Hz; however, Mayer waves typically have a frequency of 0.1 Hz. Therefore, it is possible that physiological noise, such as signal contribution from increased blood flow in the scalp, may have influenced the results. We recommend that future studies use filtering technologies, such as accelerometers and short channels, that can appropriately filter out Mayer waves. Finally, we did not distinguish the process of gait initiation, termination, and turning during the walking tasks during the analysis. We may study the different walking processes in the future. Despite these limitations, our study is innovative and well-conducted, and it provides novel and critically important information.
Conclusion
In contrast to previous studies, our study focused on the parietal lobes and prefrontal cortex, as well as on the interaction patterns between the parietal lobes and prefrontal cortex during walking tasks. Our findings help enhance the understanding of the neural mechanisms of gait disorders in PD. Additionally, our study used portable fNIRS to analyze differential EC patterns in individuals with PD and healthy controls during a walking task, thereby expanding on previous studies using fMRI, EEG, and PET that did not allow for walking in a real environment. Moreover, we noted that the parietal lobe may become a potential intervention target in the future, and that EC patterns based on fNIRS have the potential to be used to evaluate neural regulation. Therefore, our findings can guide future research with the goal of eventually informing medical guidelines.
ACKNOWLEDGMENTS
This work was funded by the National Natural Science Foundation of China (U1913208, 61873135), Tianjin Key Medical Discipline (Specialty) Construction Project (No. TJYXZDXK-052B), Tianjin Research Innovation Project for Postgraduate Students (2021YJSS161), and Tianjin Health Research Project (TJWJ2022MS033, TJWJ2022MS031).
CONFLICT OF INTEREST
The authors have no conflict of interest to report.
SUPPLEMENTARY MATERIAL
[1] The supplementary material is available in the electronic version of this article: https://dx.doi.org/10.3233/JPD-223564.
REFERENCES
[1] | Galna B , Lord S , Burn DJ , Rochester L ((2015) ) Progression of gait dysfunction in incident Parkinson’s disease: Impact of medication and phenotype. Mov Disord 30: , 359–367. |
[2] | Peterson DS , Horak FB ((2016) ) Neural control of walking in people with parkinsonism. Physiology 2: , 95–107. |
[3] | Hobert MA , Nussbaum S , Heger T , Berg D , Maetzler W , Heinzel S ((2019) ) Progressive gait deficits in Parkinson’s disease: A wearable-based biannual 5-year prospective study. Front Aging Neurosci 11: , 22. |
[4] | Mirelman A , Bonato P , Camicioli R , Ellis TD , Giladi N , Hamilton JL , Hass CJ , Hausdorff JM , Pelosin E , Almeida QJ ((2019) ) Gait impairments in Parkinson’s disease. Lancet Neurol 18: , 697–708. |
[5] | Takakusaki K ((2017) ) Functional neuroanatomy for posture and gait control. J Mov Disord 10: , 1–17. |
[6] | Clark DJ ((2015) ) Automaticity of walking: Functional significance, mechanisms, measurement and rehabilitation strategies. Front Hum Neurosci 9: , 246. |
[7] | Wu T , Hallett M , Chan P ((2015) ) Motor automaticity in Parkinson’s disease. Neurobiol Dis 82: , 226–234. |
[8] | Cao J , Zhao Y , Shan X , Wei HL , Guo Y , Chen L , Erkoyuncu JA , Sarrigiannis PG ((2022) ) Brain functional and effective connectivity based on electroencephalography recordings: A review. Hum Brain Mapp 43: , 860–879. |
[9] | Biswal B , Yetkin FZ , Haughton VM , Hyde JS ((1995) ) Functional connectivity in the motor cortex of resting human brain using echo-planar MRI. Magn Reson Med 34: , 537–541. |
[10] | Friston KJ ((1994) ) Functional and effective connectivity in neuroimaging: A synthesis. Hum Brain Mapp 2: , 56–78. |
[11] | Friston KJ ((2011) ) Functional and effective connectivity: A review. Brain Connect 1: , 13–36. |
[12] | Grefkes C , Fink GR ((2011) ) Reorganization of cerebral networks after stroke: New insights from neuroimaging with connectivity approaches. Brain 134: , 1264–1276. |
[13] | Xue J , Guo H , Gao Y , Wang X , Cui H , Chen Z , Wang B , Xiang J ((2019) ) Altered directed functional connectivity of the hippocampus in mild cognitive impairment and alzheimer’s disease: A resting-state fMRI study. Front Aging Neurosci 11: , 326. |
[14] | Formaggio E , Rupil M , Rupil J , Antonini A , Masiero S , Toffolo GM , Del Felice A ((2021) ) Reduced effective connectivity in the motor cortex in Parkinson’s disease. Brain Sci 11: , 1200. |
[15] | Pasman EP , Mckeown MJ , Garg S , Cleworth TW , Bloem BR , Inglis JT , Carpenter MG ((2021) ) Brain connectivity during simulated balance in older adults with and without Parkinson’s disease. Neuroiomage Clin 30: , 102676. |
[16] | Jahanshahi M , Jones CR , Zijlmans J , Katzenschlager R , Lee L , Quinn N , Frith CD , Lees AJ ((2010) ) Dopaminergic modulation of striato-frontal connectivity during motor timing in Parkinson’s disease. Brain 133: , 727–745. |
[17] | Stuart S , Vitorio R , Morris R , Martini DN , Fino PC , Mancini M ((2018) ) Cortical activity during walking and balance tasks in older adults and in people with Parkinson’s disease: A structured review. Maturitas 113: , 53–72. |
[18] | Scholkmann F , Kleiser S , Metz AJ , Zimmermann R , Mata Pavia J , Wolf U , Wolf M ((2014) ) A review on continuous wave functional near-infrared spectroscopy and imaging instrumentation and methodology. Neuroimage 85: , 6–27. |
[19] | Jin PL , Hong SF , Hua Z , Xia S ((2021) ) Cerebral hemodynamic responses to the difficulty level of ambulatory tasks in patients with Parkinson’s disease: A systematic review and Meta-analysis. Neurorehabil Neural Repair 35: , 755–768. |
[20] | Herd SA , Banich MT , O’Reilly RC ((2006) ) Neural mechanisms of cognitive control: An integrative model of Stroop task performance and fMRI data. J Cogn Neurosci 18: , 22–32. |
[21] | Lennon S ((1996) ) Motor Control: Theory and practical application. Physiother 82: , 591. |
[22] | Alexander N ((1994) ) Postural control in older adults. J Am Geriatr Soc 42: , 93–108. |
[23] | Brownsett SL , Wise RJ ((2010) ) The contribution of the parietal lobes to speaking and writing. Cereb Cortex 20: , 517–523. |
[24] | Huo C , Li X , Jing J , Ma Y , Li W , Wang Y , Liu W , Fan Y , Yue S , Wang Y , Li Z ((2019) ) Median nerve electrical stimulation-induced changes in effective connectivity in patients with stroke as assessed with functional near-infrared spectroscopy. Neurorehabil Neural Repair 33: , 1008–1017. |
[25] | Postuma RB , Berg D , Stern M , Poewe W , Olanow CW , Oertel W , Obeso J , Marek K , Litvan I , Lang AE , Halliday G , Goetz CG , Gasser T , Dubois B , Chan P , Bloem BR , Adler CH , Deuschl G ((2015) ) MDS clinical diagnostic criteria for Parkinson’s disease. Mov Disord 30: , 1591–1601. |
[26] | Hoehn MM , Yahr MD ((1998) ) Parkinsonism: Onset, progression, and mortality. 1967. Neurology 50: , 318–334. |
[27] | Li H , Jia J , Yang Z ((2016) ) Mini-Mental State Examination in elderly Chinese: A population-based normative study. J Alzheimers Dis 53: , 487–496. |
[28] | Goetz CG , Tilley BC , Shaftman SR , Stebbins GT , Fahn S , Martinez-Martin P , Poewe W , Sampaio C , Stern MB , Dodel R , Dubois B , Holloway R , Jankovic J , Kulisevsky J , Lang AE , Lees A , Leurgans S , LeWitt PA , Nyenhuis D , Olanow CW , Rascol O , Schrag A , Teresi JA , van Hilten JJ , LaPelle N ; Movement Disorder Society UPDRS Revision Task Force ((2008) ) Movement Disorder Society-sponsored revision of the Unified Parkinson’s Disease Rating Scale (MDS-UPDRS): Scale presentation and clinimetric testing results. Mov Disord 23: , 2129–2170. |
[29] | Stebbins GT , Goetz CG , Burn DJ , Jankovic J , Khoo TK , Tilley BC ((2013) ) How to identify tremor dominant and postural instability / gait difficulty groups with the movement disorder society unified Parkinson’s disease rating scale: Comparison with the unified Parkinson’s disease rating scale. Mov Disord 28: , 668–670. |
[30] | Cope M , Delpy DT ((1988) ) System for long-term measurement of cerebral blood and tissue oxygenation on newborn infants by near infra-red transillumination. Med Biol Eng Comput 26: , 289–294. |
[31] | Zheng YL , Wang DX , Zhang YR , Tang YY ((2019) ) Enhancing attention by synchronizing respiration and fingertip pressure: A pilot study using functional near-infrared spectroscopy. Front Neurosci 13: , 1209. |
[32] | Wang Y , Liu L , Zhang Y , Wei C , Xin T , He Q , Hou X , Liu Y ((2021) ) The neural processing mode of vocal emotion after hearing reconstruction in prelingual deaf children: A functional near-infrared spectroscopy brain imaging study. Front Neurosci 15: , 705741. |
[33] | Scholkmann F , Spichtig S , Muehlemann T , Wolf M ((2010) ) How to detect and reduce movement artifacts in near-infrared imaging using moving standard deviation and spline interpolation. Physio Meas 31: , 649–662. |
[34] | Di L , Di Lorenzo R , Pirazzoli L , Blasi A , Bulgarelli C , Hakuno Y , Minagawa Y , Brigadoi S , ((2019) ) Recommendations for motion correction of infant fNIRS data applicable to multiple data sets and acquisition systems. Neuroimage 200: , 511–527. |
[35] | Menant JC , Maidan I , Alcock L , Al-Yahya E , Cerasa A , Clark DJ , Bruin ED , Fraser S , Gramigna V , Hamacher D , Herold F , Holtzer R , Izzetoglu M , Lim S , Pantall A , Pelicioni P , Peters S , Rosso AL , George RS , Stuart S , Vasta R , Vitorio R , Mirelman A ((2020) ) A consensus guide to using functional near-infrared spectroscopy in posture and gait research. Gait Posture 82: , 254–265. |
[36] | Vicente R , Wibral M , Lindner M , Pipa G ((2011) ) Transfer entropy–a model-free measure of effective connectivity for the neurosciences. J Comput Neurosci 30: , 45–67. |
[37] | Moon YI , Rajagopalan B , Lall U ((1995) ) Estimation of mutual information using kernel density estimators. Phys Rev E Stat Phys Plasmas Fluids Relat Interdiscip Topics 52: , 2318–2321. |
[38] | Takakusaki K , Tomita N , Yano M ((2008) ) Substrates for normal gait and pathophysiology of gait disturbances with respect to the basal ganglia dysfunction. J Neurol 255 Suppl 4: , 19–29. |
[39] | Rowe J , Stephan KE , Friston K , Frackowiak R , Lees A , Passingham R ((2002) ) Attention to action in Parkinson’s disease: Impaired effective connectivity among frontal cortical regions. Brain 125: , 276–289. |
[40] | Wu T , Hallett M ((2005) ) The influence of normal human ageing on automatic movements. J Physiol 562: , 605–615. |
[41] | Wu T , Hallett M ((2005) ) A functional MRI study of automatic movements in patients with Parkinson’s disease. Brain 128: , 2250–2259. |
[42] | Bohnen NI , Frey KA , Studenski S , Kotagal V , Koeppe RA , Scott PJ , Albin RL , Müller ML ((2013) ) Gait speed in Parkinson disease correlates with cholinergic degeneration. Neurology 81: , 1611–1616. |
[43] | Maidan I , Nieuwhof F , Bernad-Elazari H , Reelick MF , Bloem BR , Giladi N , Deutsch JE , Hausdorff JM , Claassen JA , Mirelman A ((2016) ) The role of the frontal lobe in complex walking among patients with Parkinson’s disease and healthy older adults: An fNIRS study. Neurorehabil Neural Repair 30: , 963–971. |
[44] | Ranchet M , Hoang I , Cheminon M , Derollepot R , Devos H , Perrey S , Luauté J , Danaila T , Paire-Ficout L ((2020) ) Changes in prefrontal cortical activity during walking and cognitive functions among patients with Parkinson’s disease. Front Neurol 11: , 601686. |
[45] | Mahoney JR , Holtzer R , Izzetoglu M , Zemon V , Verghese J , Allali G ((2016) ) The role of prefrontal cortex during postural control in Parkinsonian syndromes a functional near-infrared spectroscopy study. Brain Res 1633: , 126–138. |
[46] | Orcioli-Silva D , Vitório R , Nóbrega-Sousa P , da Conceição NR , Beretta VS , Lirani-Silva E , Gobbi LTB ((2020) ) Levodopa facilitates prefrontal cortex activation during dual task walking in Parkinson disease. Neurorehabil Neural Repair 34: , 589–599. |
[47] | Zwergal A , Linn J , Xiong G , Brandt T , Strupp M , Jahn K ((2012) ) Aging of human supraspinal locomotor and postural control in fMRI. Neurobiol Aging 33: , 1073–1084. |
[48] | Samuel M , Ceballos-Baumann AO , Blin J , Uema T , Boecker H , Passingham RE , Brooks DJ ((1997) ) Evidence for lateral premotor and parietal overactivity in Parkinson’s disease during sequential and bimanual movements. A PET study. Brain 120: , 963–976. |
[49] | Sabatini U , Boulanouar K , Fabre N , Martin F , Carel C , Colonnese C , Bozzao L , Berry I , Montastruc JL , Chollet F , Rascol O ((2000) ) Cortical motor reorganization in akinetic patients with Parkinson’s disease: A functional MRI study. Brain 123: , 394–403. |
[50] | Haslinger B , Erhard P , Kampfe N , Boecker H , Rummeny E , Schwaiger M , Conrad B , Ceballos-Baumann AO ((2001) ) Event-related functional magnetic resonance imaging in Parkinson’s disease before and after levodopa. Brain 124: , 558–570. |
[51] | Hashimoto T , Iriki A ((2013) ) Dissociations between the horizontal and dorsoventral axes in body-size perception. Eur J Neurosci 37: , 1747–1753. |
[52] | Avillac M , Deneve S , Olivier E , Pouget A , Duhamel JR ((2005) ) Reference frames for representing visual and tactile locations in parietal cortex. Nat Neurosci 8: , 941–919. |
[53] | Glickstein M ((2000) ) How are visual areas of the brain connected to motor areas for the sensory guidance of movement? Trends Neurosci 23: , 613–617. |
[54] | Li J , Jin M , Wang L , Qin B , Wang K ((2017) ) MDS clinical diagnostic criteria for Parkinson’s disease in China. J Neurol 264: , 476–481. |
[55] | Tessitore A , Giordano A , De Micco R , Russo A , Tedeschi G ((2014) ) Sensorimotor connectivity in Parkinson’s disease: The role of functional neuroimaging. Front Neurol 5: , 180. |
[56] | Lewis GN , Byblow WD ((2002) ) Altered sensorimotor integration in Parkinson’s disease. Brain 125: , 2089–2099. |
[57] | Abe Y , Kachi T , Kato T , Arahata Y , Yamada T , Washimi Y , Iwai K , Ito K , Yanagisawa N , Sobue G ((2003) ) Occipital hypoperfusion in Parkinson’s disease without dementia: Correlation to impaired cortical visual processing. J Neurol Neurosurg Psychiatry 74: , 419–422. |
[58] | Prasad S , Saini J , Yadav R , Pal PK ((2018) ) Motor asymmetry and neuromelanin imaging: Concordance in Parkinson’s disease. Parkinsonism Relat Disord 53: , 28–32. |
[59] | Wu T , Long X , Wang L , Hallett M , Zang Y , Li K , Chan P ((2011) ) Functional connectivity of cortical motor areas in the resting state in Parkinson’s disease. Hum Brain Mapp 32: , 1443–1457. |
[60] | Tessitore A , Cirillo M , De Micco R ((2019) ) Functional connectivity signatures of Parkinson’s disease. J Parkinsons Dis 9: , 637–652. |
[61] | Häberling IS , Corballis PM , Corballis MC ((2016) ) Language, gesture, and handedness: Evidence for independent lateralized networks. Cortex 82: , 72–85. |
[62] | Granger CWJ ((1969) ) Investigating causal relations by econometric models and cross-spectral methods. Econometrica 37: , 424–438. |
[63] | Friston KJ , Harrison L , Penny W ((2003) ) Dynamic causal modelling. Neuroimage 19: , 1273–1302. |
[64] | Dyhdalo K , Macnamara S , Brainard J , Underwood D , Tubbs R , Yang B ((2014) ) Assessment of cellularity, genomic DNA yields, and technical platforms for BRAF mutational testing in thyroid fine-needle aspirate samples. Cancer Cytopathol 122: , 114–122. |


