
Evaluation of Current Methods to Detect Cellular Leucine-Rich Repeat Kinase 2 (LRRK2) Kinase Activity
Abstract
Background:
Coding variation in the Leucine rich repeat kinase 2 gene linked to Parkinson’s disease (PD) promotes enhanced activity of the encoded LRRK2 kinase, particularly with respect to autophosphorylation at S1292 and/or phosphorylation of the heterologous substrate RAB10.
Objective:
To determine the inter-laboratory reliability of measurements of cellular LRRK2 kinase activity in the context of wildtype or mutant LRRK2 expression using published protocols.
Methods:
Benchmark western blot assessments of phospho-LRRK2 and phospho-RAB10 were performed in parallel with in situ immunological approaches in HEK293T, mouse embryonic fibroblasts, and lymphoblastoid cell lines. Rat brain tissue, with or without adenovirus-mediated LRRK2 expression, and human brain tissues from subjects with or without PD, were also evaluated for LRRK2 kinase activity markers.
Results:
Western blots were able to detect extracted LRRK2 activity in cells and tissue with pS1292-LRRK2 or pT73-RAB10 antibodies. However, while LRRK2 kinase signal could be detected at the cellular level with over-expressed mutant LRRK2 in cell lines, we were unable to demonstrate specific detection of endogenous cellular LRRK2 activity in cell culture models or tissues that we evaluated.
Conclusion:
Further development of reliable methods that can be deployed in multiple laboratories to measure endogenous LRRK2 activities are likely required, especially at cellular resolution.
INTRODUCTION
Current therapeutic options for Parkinson’s disease (PD) and related conditions are largely limited to symptomatic approaches, which leave the underlying disease progression unchecked. Development of new treatments has been hampered by a relative paucity in understanding the underlying pathogenic mechanisms involved in PD progression. However, the identification of genetic factors that influence risk of PD in human populations has provided several novel potential targets for disease modifying therapies based around known etiology.
One example of a genetic cause of PD that may be tractable therapeutically lies in the LRRK2 gene. Originally identified as a locus for inherited PD on chromosome 12 in a large kindred from Japan [1], several missense mutations were subsequently discovered in a number of families around the world [2–4]. Additional coding variants were found in PD cases without obvious family history of disease [5], due to incomplete age-dependent penetrance of LRRK2 alleles [6]. Additionally, a role for LRRK2 in idiopathic PD was identified by genome-wide association studies (GWAS), which nominated non-coding variants at the same locus as risk factors for PD susceptibility [7]. The chromosomal region encompassing LRRK2 is therefore an example of a pleomorphic risk locus, containing variants that affect risk of sporadic or familial PD by different genetic mechanisms [8].
The LRRK2 gene encodes a large protein kinase and coding mutations lead to an increase in kinase activity, albeit with variation in biochemical mechanisms [9]. This hypothesis is consistent with human genetic data showing that loss of function mutations in LRRK2 do not show association with risk of PD [10]. Based on these observations, it has been suggested that inhibition of kinase activity would be therapeutically useful to prevent the onset or possibly progression of PD [11]. Several tool compounds have been synthesized that can be used to ameliorate neurodegeneration in laboratory models of PD [12, 13]. Based on these promising preclinical data, along with relatively modest evidence of reversible toxicity [14], LRRK2 kinase inhibitors and RNAi strategies are being evaluated as new therapeutic agents for PD.
One poorly developed aspect of the pathobiology of LRRK2 relates to understanding where and under what circumstances the kinase is active. Several observations have placed LRRK2 in regulated cell signaling pathways [15, 16], suggesting that it displays low basal activity without further stimulation. However, evaluating LRRK2 kinase activity has been difficult to demonstrate at an endogenous level where LRRK2 is typically only expressed at low levels. LRRK2 can undergo autophosphorylation [17] and phosphorylate downstream substrates, including RAB GTPases [18]. However, many of these phosphorylation events have relatively low stoichiometry, making these events difficult to measure reliably. The identification of endogenous LRRK2 kinase activity is also potentially important for evaluation of LRRK2 kinase inhibitors in a clinical setting, as it would be critical to be able to measure the level of inhibition achieved by tested therapeutic compounds in human subjects.
Here, we tested a number of reported methods to determine the optimal measurements of LRRK2 kinase activity in different conditions. We find that while identification of overexpressed LRRK2 is facile, accurate identification of endogenous kinase activity remains challenging and uncertain.
MATERIALS AND METHODS
HEK293T cell immunocytochemistry and western blotting
HEK293T cells were cultured as described before [19] and transfected at 80% confluence with 2 μg of LRRK2 constructs and 6 μl of LipoD293 (SignaGen Laboratories) per well of a 6-well plate overnight in full medium. Cells were split to 20% confluence (1:8 split ratio) the following day.
For immunocytochemistry, cells were plated onto coverslips the day after transfection, and treated with or without MLi-2 (100 nM, 2 h) the following day before fixation using 2% paraformaldehyde (PFA) in PBS for 20 min at room temperature. Cells were subsequently washed in PBS for 10 min, followed by permeabilization with 0.2% Triton-X100/PBS for 10 min. After fixation and permeabilization, coverslips were blocked for 1 h with 0.5% (w/v) BSA (Biowest, P6156) in 0.2% Triton-X100/PBS (blocking buffer) at room temperature, followed by incubation with primary antibodies in blocking solution overnight at 4°C. Primary antibodies were all employed at a 1:1000 dilution and included mouse monoclonal anti-LRRK2 (N241A/34; UC Davies/NIH NeuroMab, clone N241A/34, 75–253), knockout-validated rabbit monoclonal anti-LRRK2 (UDD3; Abcam, ab133518), knockout-validated mouse monoclonal anti-RAB10 (Sigma, SAB5300028), rabbit monoclonal anti-pT73-RAB10 (Abcam, ab241060) and rabbit monoclonal anti-pS1292 LRRK2 (Abcam, ab203181). After washing 3×5 min with 0.2% Triton-X100/PBS, coverslips were incubated for 1 h with either Alexa 594-conjugated goat anti-mouse (1:1000; Invitrogen, A11005) or Alexa 594-conjugated goat anti-rabbit (1:1000; Invitrogen, A11012) secondary antibodies in 0.2% Triton-X100/PBS, followed by washing and mounting with DAPI (Vector Laboratories). For immunocytochemistry mimicking PLA conditions, cells were fixed with 2% PFA/PBS for 20 min at room temperature, and washed in PBS for 10 min as described above. Coverslips were then blocked for 1 h using 1×blocking solution (DUO82007, Sigma) at room temperature, primary and secondary antibody incubations were performed in 1×antibody diluent solution (DUO82008, Sigma), and all wash steps were performed using PLA wash buffers included in the DUOLink kit for 2×10 min at room temperature.
For high-resolution imaging, cells mounted on glass slides were imaged by Airyscan on a Zeiss 880 inverted confocal microscope. 488 (4%), 561 (6%), and 633 (7.5%) nm excitation lasers were used for GFP, Alexa Fluor-555, and Alexa-Fluor-647 channels, respectively. Plan-Apochromat 63x/1.4 Oil DIC M27 was used with AiryScan processing in ZEISS ZEN 30 (blue edition) and AiryScan 2 Multiplex Standard module.
For western blotting, cells were plated into 6-well plates the day after transfection, and extracts obtained the following day upon treatment with or without MLi-2 (100 nM, 2 h). Cells (1 well of a 6-well plate) were collected in PBS and centrifuged (2000 rpm, 2 min). The cell pellet was resuspended in 75 μl of PBS, followed by addition of 25 μl of 4x Nupage LDS sample buffer (Invitrogen, NP0008) supplemented with β-mercaptoethanol (final 2.5% v/v). Samples were sonicated and heated at 95°C for 5 min. Ten μl of samples were loaded onto 4–20% precast polyacrylamide gels (Bio-Rad, 456–1096) and electrophoresed at 100 V for 2 h with SDS running buffer (Tris-Glycine Running Buffer; 25 mM TRIS pH 8.6, 190 mM glycine, 1% SDS). Proteins were electrophoretically transferred onto nitrocellulose membranes (GE Healthcare) in transfer buffer (20 mM TRIS pH 8.6, 122 mM glycine, 20% MeOH (v/v)) at 40 mA overnight at 4°C. Membranes were blocked in blocking buffer (Li-COR Biosciences, Intercept PBS Blocking buffer, 927–70001) for 1 h at room temperature, and cropped into three pieces for Li-COR multiplexing. Membranes were washed in 0.1% (v/v) Tween-20/PBS, followed by incubation with primary antibodies in 0.2% (v/v) Tween-20 in blocking buffer overnight at 4°C. Primary antibodies included rabbit monoclonal anti-pS935-LRRK2 UDD2 (1:500, Abcam, ab133450), mouse monoclonal anti-GFP (1:1000; Sigma, 11814460001), mouse monoclonal anti-α-tubulin (1:10000, Sigma, clone DM1A, T6199), rabbit monoclonal anti-pT73-RAB10 (1:1000, Abcam, ab230261), or mouse monoclonal anti-RAB10 (1:1000, Sigma, SAB5300028). Membranes were washed 3×10 min in 0.1% Tween-20/PBS and incubated with secondary antibodies (1:14000; goat anti-rabbit IRDye 800RD or goat anti-mouse IRDye 680RD) at room temperature for 1 h in 0.1% Tween-20 in blocking buffer. Membranes were washed with 0.1% Tween-20/PBS 3×10 min, washed with PBS, and then imaged via near-infrared fluorescent detection using Odyssey CLx imaging system. Quantification was performed with the instrument’s Image Studio software.
For pS1292 LRRK2 detection, membranes were blocked in 5% milk in 0.2% Tween-20/PBS (milk blocking buffer) for 1 h at room temperature, and incubated with rabbit monoclonal anti-pS1292 LRRK2 antibody (1:1000; Abcam, ab203181) in milk blocking buffer overnight at 4°C. All other steps were as described above.
HEK293T cell proximity ligation assays, image acquisition and analysis
Upon transient transfection for 48 h as described above, proximity ligation assays (PLAs) were performed as previously described [20] using DuoLink PLA Technology according to manufacturer’s instructions (Sigma-Aldrich; Duolink In Situ PLA probe anti-rabbit PLUS (DUO92002), Duolink In Situ PLA probe anti-mouse MINUS (DUO92004), Duolink In Situ Detection Reagents Red (DUO92008)). Upon fixation of cells in 2% PFA/PBS for 20 min at room temperature, cells were washed 3×0 min in PBS, and coverslips blocked in 1×PLA blocking solution for 1 h at 37°C, followed by incubation with primary antibodies overnight at 4°C. Primary antibodies included rabbit monoclonal anti-pS1292 LRRK2 (1:1000, Abcam, ab203181) and mouse monoclonal anti-LRRK2 (1:1000, UC Davies/NIH NeuroMab, clone N241A/34, 75–253). All incubations were performed in the dark.
Images were acquired on a Leica TCS-SP5 confocal microscope using a 63×1.4 NA oil UV objective (HCX PLAPO CS). Images were collected using single excitation for each wavelength separately, and dependent on secondary antibodies (405 nm UV diode and 418–467 nm emission band pass for DAPI; 488 nm Argon Laser line and 498–551 nm emission band pass for GFP; 561 DPSS Laser Line and 600–650 nm band pass for PLA Red). Ten to fifteen image sections of random areas were acquired with a step size of 0.5 μm, and z-stack images analyzed and processed using Leica Applied Systems (LAS AF6000) image acquisition software. The same laser settings and exposure times were used for image acquisition of individual PLA experiments. For quantification of the PLA signal, the number of PLA-positive dots/cell was determined from around 50 individual cells per condition from maximal intensity projections using Fiji, and all relevant control PLA conditions were included in each experiment.
MEF cell immunocytochemistry and western blotting
WT littermate control and R1441C MEF cells have been previously described [21], and were a generous gift from Dr. D. Alessi (University of Dundee, UK). Cells were cultured in Dulbecco’s modified Eagle’s medium (DMEM) containing 10% FBS, 2 mM L-glutamine, 1 mM sodium pyruvate, non-essential amino acids, 100 units/ml penicillin and 100 μg/ml streptomycin (all from Life Technologies). Media was replaced every two days, and cells split 1:10 once reaching 90–100% confluence.
For immunocytochemistry, cells were plated onto coverslips and processed when at around 60–70% confluence. Cells were treated with or without MLi-2 (200 nM, 2h) before fixation using 4% PFA in PBS at 37°C for 15 min. Thereafter, cells were permeabilized with ice-cold methanol at 4°C for 10 min, followed by an additional permeabilization step employing 0.5% Triton-X100/PBS for 15 min at room temperature with gentle agitation. Coverslips were blocked for 1 h with 0.5% (w/v) BSA (Biowest, P6156) in 0.5% Triton-X100/PBS (blocking buffer) at room temperature, followed by incubation with primary antibodies in blocking solution overnight at 4°C. Primary antibodies included mouse monoclonal anti-LRRK2 (1:50; UC Davies/NIH NeuroMab, clone N241A/34, 75–253), knockout-validated rabbit monoclonal anti-LRRK2 (1:200; UDD3, Abcam, ab133518), knockout-validated mouse monoclonal anti-RAB10 (1:1000; Sigma, SAB5300028), rabbit monoclonal anti-pT73-RAB10 (1:1000; Abcam, ab241060) and rabbit monoclonal anti-pS1292 LRRK2 (1:1000; Abcam, ab203181). After washing 2×10 min with 0.5% Triton-X100/PBS, coverslips were incubated for 1 h with either Alexa 488-conjugated goat anti-mouse (1:1000; Invitrogen, A11001) or Alexa 488-conjugated goat anti-rabbit (1:1000; Invitrogen, A11008) secondary antibodies in 0.5% Triton-X100/PBS, followed by washing and mounting with DAPI (Vector Laboratories). For immunocytochemistry mimicking PLA conditions, cells were fixed with 4% PFA/PBS for 15 min at 37°C followed by permeabilization with ice-cold methanol at 4°C for 10 min, before washing in PBS for 10 min. Coverslips were then blocked for 1 h using 1×blocking solution (DUO82007, Sigma) at room temperature, primary and secondary antibody incubations were performed in 1×antibody diluent solution (DUO82008, Sigma), and all wash steps were performed using PLA wash buffers included in the DUOLink kit for 2×10 min at room temperature.
For western blotting, MEF cells were plated into 6-well plates, and collected when reaching 90–100% confluence after treatment with MLi-2 (200 nM, 2 h) where indicated. Cells (1 well of a 6-well plate) were collected in PBS and centrifuged (2200 rpm, 3 min). The cell pellet was resuspended in 75 μl of PBS, followed by addition of 25 μl of 4x NuPAGE LDS sample buffer (Novex, Life Technologies, NP0008) supplemented with β-mercaptoethanol (final 2.5% v/v). Samples were sonicated and heated at 70°C for 10 min. Ten μl of samples were loaded onto 4–20% precast polyacrylamide gels (Bio-Rad, 456–1096) and electrophoresed at 100 V for 2 h with SDS running buffer (Tris-Glycine Running Buffer; 25 mM TRIS pH 8.6, 190 mM glycine, 1% SDS). Proteins were electrophoretically transferred onto nitrocellulose membranes (GE Healthcare) in transfer buffer (20 mM TRIS pH 8.6, 122 mM glycine, 20% MeOH (v/v)) at 40 mA overnight at 4°C. Membranes were blocked in blocking buffer (Li-COR Biosciences, Intercept PBS Blocking buffer, 927–70001) for 1 h at room temperature, and cropped into three pieces for Li-COR multiplexing. Membranes were washed in 0.1% (v/v) Tween-20/PBS, followed by incubation with primary antibodies in 0.2% (v/v) Tween-20 in blocking buffer overnight at 4°C. Primary antibodies included rabbit monoclonal anti-pS935-LRRK2 UDD2 (1:500; Abcam, ab133450), mouse monoclonal anti-LRRK2 (1:1000; UC Davies/NIH NeuroMab, clone N241A/34, 75–253), mouse monoclonal anti-α-tubulin (1:20000; Sigma, clone DM1A, T6199), rabbit monoclonal anti-pT73-RAB10 (1:1000; Abcam, ab230261) or mouse monoclonal RAB10 (1:1000; Sigma, SAB5300028). Membranes were washed 3×5 min in 0.1% Tween-20/PBS, and incubated with secondary antibodies (1:14'000; goat anti-rabbit IRDye 800RD or goat anti-mouse IRDye 680RD) at room temperature for 1 h in 0.1% Tween-20 in blocking buffer. Membranes were washed with 0.1% Tween-20/PBS 3×5 min, washed with PBS, and then imaged via near-infrared fluorescent detection using Odyssey CLx imaging system. Quantification was performed with the instrument's Image Studio software.
For pS1292 LRRK2 detection, membranes were blocked in 5% milk in 0.2% Tween-20/PBS (milk blocking buffer) for 1 h at room temperature, and incubated with rabbit monoclonal anti-pS1292 LRRK2 antibody (1:1000; Abcam, ab203181) in milk blocking buffer overnight at 4°C. All other steps were identical as described above.
MEF cell proximity ligation assays, image acquisition and analysis
MEF cells were fixed with 4% PFA in PBS at 37°C for 15 min, followed by permeabilization in ice-cold methanol at 4°C for 10 min. Cells were washed 3×10 min in PBS, coverslips were blocked in 1×PLA blocking solution for 1 h, and incubation with primary antibodies was overnight at 4°C. Primary antibodies included rabbit monoclonal anti-pS1292 LRRK2 (1:1000; Abcam, ab203181) and mouse monoclonal anti-LRRK2 (1:1000; UC Davies/NIH NeuroMab, clone N241A/34, 75–253). PLA was performed as described above for HEK293T cells using DuoLink PLA Technology according to manufacturer’s instructions (Sigma-Aldrich; Duolink In Situ PLA probe anti-rabbit PLUS (DUO92002), Duolink In Situ PLA probe anti-mouse MINUS (DUO92004), Duolink In Situ Detection Reagents Red (DUO92008).
Images were acquired on a Leica TCS-SP5 confocal microscope using a 63×1.4 NA oil UV objective (HCX PLAPO CS). Images were collected using single excitation for each wavelength separately, and dependent on secondary antibodies (405 nm UV diode and 418–467 nm emission band pass for DAPI; 488 nm Argon Laser line and 498–551 nm emission band pass for Alexa488-coupled secondary antibody; 561 DPSS Laser Line and 600–650 nm emission band pass for PLA Red). Ten to fifteen image sections of random areas were acquired with a step size of 0.5 μm, and z-stack images analyzed and processed using Leica Applied Systems (LAS AF6000) image acquisition software. The same laser settings and exposure times were used for image acquisition of individual experiments. For quantification of the PLA signal, the number of PLA-positive dots/field and DAPI-positive nuclei/field were determined from around 10–12 random fields per condition from maximal intensity projections using Fiji software, and all relevant control PLA conditions were included in each experiment.
Lymphoblastoid cell line (LCL) immunocytochemistry and western blotting
LCLs were cultured in RPMI 1640 medium with 20% FBS, 2% L-glutamine, 20 units/ml penicillin and 20 μg/ml streptomycin as described previously [20]. Cell density was monitored each day using trypan blue staining, and cells were kept at a density of 106 cells/ml. Cells were treated with MLi-2 where indicated before further processing.
Immunocytochemistry of LCLs was performed as described before [20]. Briefly, cells were plated onto coverslips coated with Cell-Tak Cell and Tissue Adhesive solution (Corning) following manufacturer’s protocols, and attached by slight centrifugation at 690 g for 10 min at room temperature. Cells were fixed with 4% PFA in PBS for 20 min at room temperature, and permeabilized with 0.2% Triton X-100/PBS for 10 min. Coverslips were blocked for 1 h with 0.5% (w/v) BSA (Biowest, P6156) in 0.2% Triton-X100/PBS (blocking buffer) at room temperature, followed by incubation with primary antibodies in blocking solution overnight at 4°C. Primary antibodies included mouse monoclonal anti-LRRK2 (1:50; UC Davies/NIH NeuroMab, clone N241A/34, 75–253), knockout-validated mouse monoclonal anti-RAB10 (1:1000; Sigma, SAB5300028), sheep polyclonal anti-pT73-RAB10 (1:50, MRC PPU, S873D), rabbit monoclonal anti-pS1292 LRRK2 (1:1000; Abcam, ab203181), and rabbit polyclonal anti-pericentrin (1:1000, Abcam, ab4448). After washing 3×5 min with 0.2% Triton-X100/PBS, coverslips were incubated for 1 h with either Alexa 488-conjugated goat anti-mouse (1:1000; Invitrogen, A11001), Alexa 488-conjugated goat anti-rabbit (1:1000; Invitrogen, A11008), Alexa 488-conjugated donkey anti-sheep (1:1000; Invitrogen, A11015) or Alexa 594-conjugated goat anti-rabbit (1:1000; Invitrogen, A11012) secondary antibodies in 0.2% Triton-X100/PBS, followed by washing and mounting with DAPI (Vector Laboratories). The sheep antibody was preabsorbed with a 10-fold molar excess of either dephospho-peptide or phosphopeptide as indicated. For immunocytochemistry mimicking PLA conditions, cells were fixed with 2% PFA/PBS for 20 min at room temperature, and washed in PBS for 10 min. Coverslips were blocked for 1 h using 1×blocking solution (DUO82007, Sigma) at room temperature, primary and secondary antibody incubations were performed in 1×antibody diluent solution (DUO82008, Sigma), and all wash steps were performed using PLA wash buffers included in the DUOLink kit for 2×10 min at room temperature.
Western blotting of LCL cell extracts was performed as previously described [20]. Cells (1 ml of 106 cells/ml) were centrifuged at 1030 g for 5 min at 20°C and washed once. The pellet was resuspended in 100 μl of lysis buffer (1% SDS, 100 mM PMSF, 100 mM orthovanadate, 50 mM NaF, phosphatase inhibitor cocktail (Sigma, P5726) and protease inhibitor cocktail (Roche, 04693116001)) and incubated during 30 min on a rotary wheel at 4°C. Extracts were briefly sonicated, and aliquots (100 μl) quick-frozen in liquid N2 and stored at –80°C.
Cell extracts (20 μg) were supplemented with 4x NuPAGE LDS sample buffer (Novex, Life Technologies, NP0008) containing β-mercaptoethanol (final 2.5% v/v), and heated at 70°C for 10 min. Fifteen μl of samples were loaded onto 4–20% precast polyacrylamide gels (Bio-Rad, 456–1096) and electrophoresed at 100 V for 2 h with SDS running buffer and transferred onto nitrocellulose membranes as described above. Membranes were blocked in blocking buffer (Li-COR Biosciences, Intercept PBS Blocking buffer, 927–70001) for 1 h at room temperature, and cropped into three pieces for Li-COR multiplexing. Membranes were washed in 0.1% (v/v) Tween-20/PBS, followed by incubation with primary antibodies in 0.2% (v/v) Tween-20 in blocking buffer overnight at 4°C. Primary antibodies included rabbit monoclonal anti-pS935-LRRK2 UDD2 (1:500; Abcam, ab133450), mouse monoclonal anti-LRRK2 (1:1000; UC Davies/NIH NeuroMab, clone N241A/34, 75–253), mouse monoclonal anti-α-tubulin (1:10000; Sigma, clone DM1A, T6199), rabbit monoclonal anti-pT73-RAB10 (1:1000; Abcam, ab230261) or mouse monoclonal anti-RAB10 (1:1000; Sigma, SAB5300028). Membranes were washed 3×10 min in 0.1% Tween-20/PBS, and incubated with secondary antibodies (1:14000; goat anti-rabbit IRDye 800RD or goat anti-mouse IRDye 680RD) at room temperature for 1 h in 0.1% Tween-20 in blocking buffer. Membranes were washed with 0.1% Tween-20/PBS 3×10 min, washed with PBS, and then imaged via near-infrared fluorescent detection using Odyssey CLx imaging system. Quantification was performed with the instrument’s Image Studio software. For detection of p1292 LRRK2, membranes were blocked with 5% milk in 0.2% (v/v) Tween-20/PBS (milk blocking buffer), and incubation with rabbit monoclonal anti-pS1292 LRRK2 antibody (1:500; Abcam, ab203181) performed in milk blocking buffer.
LCL cell proximity ligation assays, image acquisition, and analysis
PLA assays, image acquisition and analysis were performed as described before [20]. Briefly, cells were attached onto Cell-Tak-coated coverslips as described above, and fixed with 4% PFA in PBS for 20 min at room temperature, followed by washing in PBS, blocking in 1×PLA blocking solution and incubation with primary antibodies overnight at 4°C using PLA antibody diluent solution provided by the kit. Primary antibodies included rabbit monoclonal anti-pS1292 LRRK2 (1:1000; Abcam, ab203181) and mouse monoclonal anti-LRRK2 (1:1000; UC Davies/NIH NeuroMab, clone N241A/34, 75–253). PLA was performed using DuoLink PLA Technology according to manufacturer’s instructions (Sigma-Aldrich; Duolink In Situ PLA probe anti-rabbit PLUS (DUO92002), Duolink In Situ PLA probe anti-mouse MINUS (DUO92004), Duolink In Situ Detection Reagents Red (DUO92008)).
Images were acquired on a Leica TCS-SP5 confocal microscope using a 63×1.4 NA oil UV objective (HCX PLAPO CS). Images were collected using single excitation for each wavelength separately, and dependent on secondary antibodies (405 nm UV diode and 418–467 nm emission band pass for DAPI; 488 nm Argon Laser line and 498–551 nm emission band pass for Alexa488-coupled secondary antibody; 561 DPSS Laser Line and 600–650 nm emission band pass for PLA Red). Ten to fifteen image sections of random areas were acquired with a step size of 0.5 μm, and z-stack images analyzed and processed using Leica Applied Systems (LAS AF6000) image acquisition software. The same laser settings and exposure times were used for image acquisition of individual experiments. For quantification of the PLA signal, the number of PLA-positive dots/cell was quantified from 130–160 individual cells using Fiji, and all relevant control PLA conditions were included in each experiment.
TRex cell proximity ligation assays, image acquisition, and analysis
TRex cells were seeded in 8-well chamber slides (LabTekII CC2 chamber slide system, #12-565-1) at 2×10⁴ cells/well, and treated with doxycycline at 1 μg/ml for 48 h to induce exogenous LRRK2 expression. Cells were fixed with 4% PFA at room temperature for 15 min, followed by permeabilization with 0.2% Tx100 at room temperature for 15 min. Blocking was achieved by adding the 1x Duolink blocking buffer for 30 min at 37°C. Cells were incubated overnight at 4°C with primary antibodies which included mouse monoclonal anti-LRRK2 N241A/34 (1:200, UC Davies/NIH NeuroMab, clone N241A/34, 75–253), rabbit monoclonal anti-pS1292 LRRK2 antibody (1:100; Abcam, ab203181) and mouse monoclonal anti-LRRK2 MC clone (1:200, BioLegend, 808201). PLA was performed as per manufacturer’s instructions, using Duolink In Situ PLA probe anti-rabbit PLUS (Sigma, DUO92002), Duolink In Situ PLA probe anti-mouse MINUS (Sigma, DUO92004) and Duolink In Situ Detection Reagents Red (Sigma, DUO92008). Amplification time for PLA was increased to 130 min at 37°C. Nuclei were stained with DAPI in Duolink In situ mounting media (Sigma, DUO82040).
Images were obtained using Zeiss LSM 880 confocal microscope. Projection images of z-stacks were generated in ImageJ (NIH software) and the threshold was adjusted to Auto-Threshold, keeping the method as Default. Finally, analyze particle function was used to calculate the PLA dots, with parameters set to Size = 0.0003-Infinity and Circularity = 0.01–1.00. Number of PLA dots was normalized to the number of nuclei in the same image to obtain the average PLA dots/nucleus. These values were plotted and analyzed using GraphPad Prism 5.0 software.
Proximity ligation assays in rat brain injected with HdAd5-G2019S LRRK2
Recombinant helper-dependent Ad5 (HdAd5) vector expressing 3xFLAG-tagged human LRRK2 (WT or G2019S) or thymidine kinase was obtained from the Michael J. Fox Foundation via the University of Iowa Viral Vector Core. Adult female Wistar rats (Harlan Laboratories) weighing approximately 180–200 g were subjected to stereotactic surgery for the unilateral delivery of recombinant HdAd5 vectors at six distinct locations (∼4.2×10⁹ viral particles/site in 2 μl) to the ipsilateral striatum using the following coordinates relative to bregma: anterior-posterior +0.48 mm, mediolateral –2 mm, –3 mm and –4 mm, and dorsoventral –6 mm and –4.8 mm relative to the skull surface. Rats were sacrificed at 42 days post-surgery for immunohistochemical analysis. Animals were perfused transcardially with saline followed by 4% PFA in 0.1 M phosphate buffer (pH 7.3). Brain tissues were harvested and post-fixed for 24 h in 4% PFA and were transferred into tissue preservative solution (0.1 M phosphate buffer containing 30% sucrose) until being dissected. For immunostaining, brains were dissected into 40 μm-thick coronal sections using a sliding microtome (SM2010R, Leica) and sections were stored in cryoprotectant solution (0.1 M phosphate buffer containing 30% sucrose and 30% ethylene glycol) at –20°C until being used.
PLA assays were performed on rat tissue adapted from previously described protocols [22, 23]. 2-3 animals per group were assayed for PLA pS1292-LRRK2 and 2 sections per animal were used for each PLA condition (PLA control (-PLUS): samples incubated without PLUS probe; PLA pS1292-LRRK2 (BOTH): samples incubated with both PLUS and MINUS probes). Sections were incubated in blocking buffer containing 10% normal donkey serum (017-000-12, Jackson ImmunoResearch) and 1% Triton-X100 (Invitrogen) for 1 h at room temperature then sequentially incubated with non-PLA primary antibodies to tyrosine hydroxylase (rabbit polyclonal, NB300-109, Novus Biologicals) for 48 h at 4°C and the corresponding AlexaFluor633-conjugated secondary antibody (Life Technologies) for 1 h at room temperature. After removing the secondary antibody, sections were next incubated with PLA-specific primary antibody pair anti-pS1292-LRRK2 (rabbit monoclonal, clone MJFR-19-7-8, Abcam) and anti-LRRK2 (mouse monoclonal, clone N241A/34, NeuroMabs), both at 1:500 (v/v) for 24 h at 4°C. Sections were mounted on glass slides (FisherbrandTM SuperfrostTM Plus, Fisher Scientific) and let dry for 20 min before performing PLA detection according to manufacturer’s guidelines using the following reagents: anti-mouse MINUS (DUO92004-100RXN), anti-rabbit PLUS (DUO92002-100RXN) and detection Reagents Orange (DUO92007-100RXN) (Duolink, Sigma). After PLA reaction and except when indicated, sections were washed to remove excess of PLA reagents and were directly coverslipped in mounting medium (Prolong containing DAPI, Invitrogen). To obtain FLAG-positive signal in rat SNpc after PLA reactions, sections were on-slide labelled with antibody to FLAG (M2, Sigma) followed by the corresponding Alexa Fluor488-conjugated secondary antibody (Life Technologies) for 1 h at room temperature. Sections were washed to remove excess of secondary antibody and were coverslipped as described above. Fluorescent images were obtained using confocal microscopy at a single z-plan (Nikon A1plus-RSi scanning confocal). Raw images were exported using NIS-Element Viewer software.
Oxidative stress in HEK293T cells
HEK293T cells (ATCC) were maintained in Dulbecco’s modified Eagle’s media (DMEM, Gibco) supplemented with 10% fetal bovine serum (Thermo Fisher Scientific) and 1x penicillin/streptomycin (Thermo Fisher Scientific) at 37°C in a 5% CO2 atmosphere. Cells were routinely passaged every 72 h and maintained in culture up to 30th passage. For transient transfection, 2.5×10⁵ cells/condition were plated in 35 mm dishes 24 h before transfection. On the day of transfection, plasmid DNAs (2 μg of full-length FLAG-tagged LRRK2 constructs and 0.5 μg of GFP-tagged Rab10 construct) were mixed with XtremeGene HP DNA Transfection reagent (Roche) at 1:1 ratio ( μg of plasmids: μl of transfection reagent) in 200 μl of DMEM without fetal bovine serum and penicillin/streptomycin. At 48 h post-transfection, cells were treated with H2O2 (H1009, Sigma) or Nigericin (tlrl-nig, InvivoGen) by media change. After incubation with H2O2 or Nigericin, cells were washed twice in cold TBS (50 mM Tris pH 7.5, 150 mM NaCl) and harvested in 200 μl lysis buffer (50 mM Tris pH 7.5, 150 mM NaCl, 1% Triton-X100, 1X Complete protease inhibitor cocktail (Roche), Phosphatase Inhibitor Cocktail Set 1 (Sigma), 0.2 mM sodium orthovanadate (Sigma), 10 mM sodium fluoride (VWR chemical), 2 mM 2-glycerophosphate (Chem-Impex International), 2 mM sodium pyrophosphate (Sigma)). Cells were rotated at 4°C for 30 min and centrifuged at 21000×g for 15 min at 4°C to prepare supernatants. Protein concentration was determined by BCA assay (Pierce Biotech).
For western blot analysis, samples (15 μg of total protein per condition) were mixed with 2X Laemmli sample buffer containing 5% 2-mercaptoethanol and resolved by SDS-PAGE (7.5% Tris-Glycine) followed by electrophoretic transfer onto nitrocellulose membranes (0.2 μm, Amersham). Separate gels were used for detection of phosphorylated protein and total protein to avoid sequential stripping and reprobing. Membranes were blocked with 5% non-fat milk (Bio-Rad) in TBST (50 mM Tris pH 7.5, 150 mM NaCl, 0.1% Tween) for 1 h at room temperature and incubated with primary antibodies overnight at 4°C. Membranes were probed with primary antibodies to pS1292-LRRK2 (MJFR-19-7-8, Abcam), pS935-LRRK2 (UDD2 10(12), Abcam), FLAG-LRRK2 (M2, Sigma), pT73-Rab10 (MJF-R21, Abcam), GFP (clones 7.1 and 13.1, Roche) and Actin (C4, EMD Millipore). Membranes were probed with secondary antibodies conjugated to HRP for 1 h at room temperature. Protein signals were detected using enhanced chemiluminescence (ECL, Amersham) with images captured on a luminescent image analyzer (LAS-3000, Fujifilm). Protein bands were quantified by densitometry using Image Studio™ Lite v4.0 software. All statistics were performed with GraphPad Prism 9 software.
For experiments depicted in Fig. S6, HEK293T cells were maintained in 10% fetal bovine serum and DMEM. Cells were seeded at ∼40% confluency 48 h prior to transfection of plasmids using FuGENE6 Transfection Reagent (Promega) at a 3:1 ratio using the manufacturer’s protocol. The pcDNA3.1-FLAG-G2019S LRRK2 and pcDNA3.1-FLAG-RAB29 plasmids used were generated as previously described [24, 25]). For co-transfection of FLAG-G2019S-LRRK2 with FLAG-RAB29, plasmid DNA was transfected at a 5:1 ratio, respectively. After transfection, cells were treated with MLi-2 (200 nM, 2 h), rotenone (50 nM, 24 h), or hydrogen peroxide (H2O2, 10 μM, 2 h). Cells were harvested immediately following treatment conditions by scraping into a lysis buffer containing phosphate buffered saline (PBS) and 1% Triton-X100, supplemented with protease and phosphatase inhibitor cocktail tablets (Roche). Lysates were then vortexed and placed on a rotating wheel at 4°C for 1 h. The membrane-enriched fraction and cell debris were spun down by centrifugation at 20000 g for 10 min. Supernatant was diluted 1:1 with 2x Laemmeli sample buffer supplemented with 40 mM NaF and 10% dithiothreitol (DTT) before protein analysis.
Total protein concentration was determined by BCA (Pierce) and 10 μg of protein (2 μg for Oxyblot) was analyzed by SDS-PAGE, followed by transfer to PVDF membrane, and detection with Crescendo ECL reagent (Millipore). Signal was recorded digitally on a ChemiDoc MP (BioRad) and quantified using Image Lab 6.0 software (BioRad). The following antibodies were used: MJFR-19-7-8 anti-pS1292-LRRK2 (Abcam), UDD2 10(12) anti-pS935-LRRK2 (Abcam), HSPA8 (Cell Signaling), MJF-R24-17-1 anti-pT71-RAB29 (Abcam) and anti-FLAG M2 (Sigma). Protein oxidation detection was performed using an OxyBlot Protein Oxidation Kit (Millipore) following the manufacturer’s protocol.
Human brain proximity ligation assays
Brain donations were obtained through the 90+ Study (UF1 AG057707) and the Stanford Udall Center (P50 NS062684) following informed consent and with approval of the appropriate institutional review boards. Formalin-fixed paraffin-embedded (FFPE) substantia nigra blocks were sectioned at 5 μm thickness. After baking the slides at 70°C for 20 min, the sections were deparaffinized and rehydrated as per standard IHC protocols. For experiments depicted in Fig. 9A, antigen retrieval was achieved by cooking the slides in citrate buffer pH 6.0 (Agilent, S169984-2) at high pressure for 10 min. After letting the slides cool to room temperature, they were blocked with 10% normal donkey serum (Sigma, D9663) and 1% Tx100/PBS for 1 h at room temperature. Sheep polyclonal anti-tyrosine hydroxylase antibody (Millipore, AB1542) was used to stain the tyrosine hydroxylase-positive neurons at 1:500, for 48 h at 4°C. Secondary antibody donkey anti-sheep Alexa Fluor 488 (Thermo, A-11015) was added at 1:500 for 2 h at room temperature. After washing, sections were incubated with primary antibodies for PLA at 4°C, for another 48 h. These primary antibodies included mouse monoclonal anti-LRRK2 N241A/34 (1:50, UC Davies/NIH NeuroMab, clone N241A/34, 75–253) and rabbit monoclonal anti-pS1292 LRRK2 (1:50; Abcam, ab203181). Following this, the slides were processed for PLA as per the manufacturer’s instructions, using Duolink In Situ PLA probe anti-rabbit PLUS (Sigma, DUO92002), Duolink In Situ PLA probe anti-mouse MINUS (Sigma, DUO92004) and Duolink In Situ Detection Reagents Red (Sigma, DUO92008). Amplification time for PLA was increased to 130 min at 37°C. Nuclei were stained with DAPI in the Duolink In situ mounting media (Sigma, DUO82040). Confocal z-stack images were acquired on a Zeiss LSM 880 microscope. Projection images were generated using the ImageJ software and processed using Adobe Photoshop CS6 software. Additional conditions employed are itemized in Table 2, and experiments depicted in Fig. 9B were performed exactly according to published procedures [23].
Structural modeling
Modeling was performed using experimental structures deposited in the Protein Data Bank (PDB) and with predicted protein structures obtained using AlphaFold 2.0 (AF-Q5S007-F1-model_v2_1-Alpha fold) [26, 27]. The structure of the ROC-COR-Kinase-WD40 domains of LRRK2 interacting with microtubules (PDB:6VP8) was used to model the location of the N241A/34 epitope [28]. The relevant interfaces in this structure were determined using PDBePisa (https://www.ebi.ac.uk/pdbe/prot_int/pistart.html; [29]). The N241A/34 epitope was also modeled on the cryo-EM structure of the LRRK2 dimer (PDB:7LHT) [30]. The full-length LRRK2 monomer structure was predicted using AlphaFold 2.0 and was aligned to PDB:6VP8 to identify the potential location of the UDD3 epitope (amino acids 1–100) when LRRK2 interacts with microtubules [26, 31]. Models were generated and manipulated in Chimera 1.16 (UCSF Chimera, developed by the Resource for Biocomputing, Visualization, and Informatics at the University of California, San Francisco, with support from NIH P41-GM103311; [32].
RESULTS
Detecting activity of over-expressed LRRK2
To evaluate different methods for detecting LRRK2 kinase activity, we first started with the overexpression of GFP-tagged LRRK2 constructs in HEK293T cells. We confirmed comparable levels of expression of LRRK2 between wild type (WT) and mutant constructs using the GFP tag (Supplementary Figure 1), with the expected dephosphorylation at the S935 site with some LRRK2 mutations. Furthermore, we confirmed in this system that endogenously expressed RAB10 and the pS935-LRRK2 site can be dephosphorylated using the potent LRRK2 inhibitor MLi-2 (Supplementary Figure 1), as expected [33, 34].
Using western blots, WT LRRK2 exhibited autophosphorylation at the site S1292 and this was enhanced by all tested pathogenic mutant forms of LRRK2, but absent when the S1292A mutation was used. There were concomitant increases in pT73-RAB10, confirming phosphorylation of endogenous heterologous substrates (Supplementary Figure 1). Each of these effects could be blocked by incubation of cells with MLi-2. These results are in line with prior observations [35, 36], and help establish the benchmark context for the exploration of other assays besides western blot analysis of lysates to measure LRRK2 kinase activity.
We next used immunofluorescent staining to examine the relationship between LRRK2, LRRK2 substrates, and kinase-mediated phosphorylation events. Because antibodies that recognize epitopes after denaturation may or may not recognize endogenous epitopes (i.e., in fixed cells), we first compared the performance of two different antibodies to total LRRK2 in the overexpression model. We also took advantage of prior observations that expression of some mutations (e.g., R1441C), or addition of kinase inhibitors, relocalizes tagged overexpressed LRRK2 to microtubules [28, 37–39], even though such localization has not been able to be confirmed for endogenous LRRK2 [31, 40, 41]. The mouse monoclonal antibody N241A/34 detected overexpressed LRRK2 as expected, but failed to detect LRRK2 bound to microtubules, whether a consequence of pathogenic mutation or after treatment with MLi-2 (Fig. 1A). In contrast, the rabbit monoclonal antibody UDD3 did react with LRRK2 both when cytosolic and when associated with microtubules (Fig. 1B). High-resolution imaging confirmed that N241A/34 weakly detected LRRK2 when bound to microtubules, and another commonly used rabbit monoclonal anti-LRRK2 antibody (MJFF2) also only poorly detected microtubule-bound overexpressed LRRK2 (Supplementary Figure 2A). Therefore, all three antibodies detect overexpressed LRRK2, with some apparently biased against the conformation of overexpressed LRRK2 bound to microtubules.
Fig. 1
Immunocytochemistry in HEK293T cells overexpressing LRRK2. A) Example of HEK293T cells transiently transfected with either GFP-tagged G2019S (left) or R1441C (right) LRRK2, treated with or without MLi-2 (100 nM, 2 h) before immunocytochemistry as indicated, and stained with anti-LRRK2 antibody (N241A/34) and DAPI. Note that the N241A/34 LRRK2 antibody largely does not recognize LRRK2 when bound to microtubules (either R1441C LRRK2 or induced upon MLi-2 treatment). B) Same as in (A), but cells stained with anti-LRRK2 antibody (UDD3) and DAPI. Note that the UDD3 LRRK2 antibody recognizes LRRK2 also when bound to microtubules. C) Same as in (A), but cells stained with knockout-validated RAB10 (SAB5300028) antibody and DAPI. Note that weak staining is observed in transfected and non-transfected cells. A perinuclear accumulation of RAB10 is observed in cells transfected with pathogenic LRRK2 in the absence but not presence of MLi-2, as previously described [19]. D) Same as in (A), but cells stained with an anti-pT73-RAB10 antibody (ab241060) and DAPI. Note the perinuclear accumulation of phospho-RAB10 in pathogenic LRRK2-expressing cells, which is abolished upon treatment with MLi-2, as previously described. E) Same as in (A), but cells stained with pS1292-LRRK2 antibody and DAPI. No signal is observed in transfected cells when staining is performed using Triton-X100/PBS-containing buffer. F) Same as in (A), but cells stained with pS1292-LRRK2 antibody and DAPI. A hardly detectable signal is observed in transfected cells when staining is performed using proprietary PLA buffer conditions, and the signal is gone upon MLi-2 treatment. Scale bars, 10 μm. Experiments were performed a total of three times, with comparable results obtained in all cases.
![Immunocytochemistry in HEK293T cells overexpressing LRRK2. A) Example of HEK293T cells transiently transfected with either GFP-tagged G2019S (left) or R1441C (right) LRRK2, treated with or without MLi-2 (100 nM, 2 h) before immunocytochemistry as indicated, and stained with anti-LRRK2 antibody (N241A/34) and DAPI. Note that the N241A/34 LRRK2 antibody largely does not recognize LRRK2 when bound to microtubules (either R1441C LRRK2 or induced upon MLi-2 treatment). B) Same as in (A), but cells stained with anti-LRRK2 antibody (UDD3) and DAPI. Note that the UDD3 LRRK2 antibody recognizes LRRK2 also when bound to microtubules. C) Same as in (A), but cells stained with knockout-validated RAB10 (SAB5300028) antibody and DAPI. Note that weak staining is observed in transfected and non-transfected cells. A perinuclear accumulation of RAB10 is observed in cells transfected with pathogenic LRRK2 in the absence but not presence of MLi-2, as previously described [19]. D) Same as in (A), but cells stained with an anti-pT73-RAB10 antibody (ab241060) and DAPI. Note the perinuclear accumulation of phospho-RAB10 in pathogenic LRRK2-expressing cells, which is abolished upon treatment with MLi-2, as previously described. E) Same as in (A), but cells stained with pS1292-LRRK2 antibody and DAPI. No signal is observed in transfected cells when staining is performed using Triton-X100/PBS-containing buffer. F) Same as in (A), but cells stained with pS1292-LRRK2 antibody and DAPI. A hardly detectable signal is observed in transfected cells when staining is performed using proprietary PLA buffer conditions, and the signal is gone upon MLi-2 treatment. Scale bars, 10 μm. Experiments were performed a total of three times, with comparable results obtained in all cases.](https://ip.ios.semcs.net:443/media/jpd/2022/12-5/jpd-12-5-jpd213128/jpd-12-jpd213128-g001.jpg)
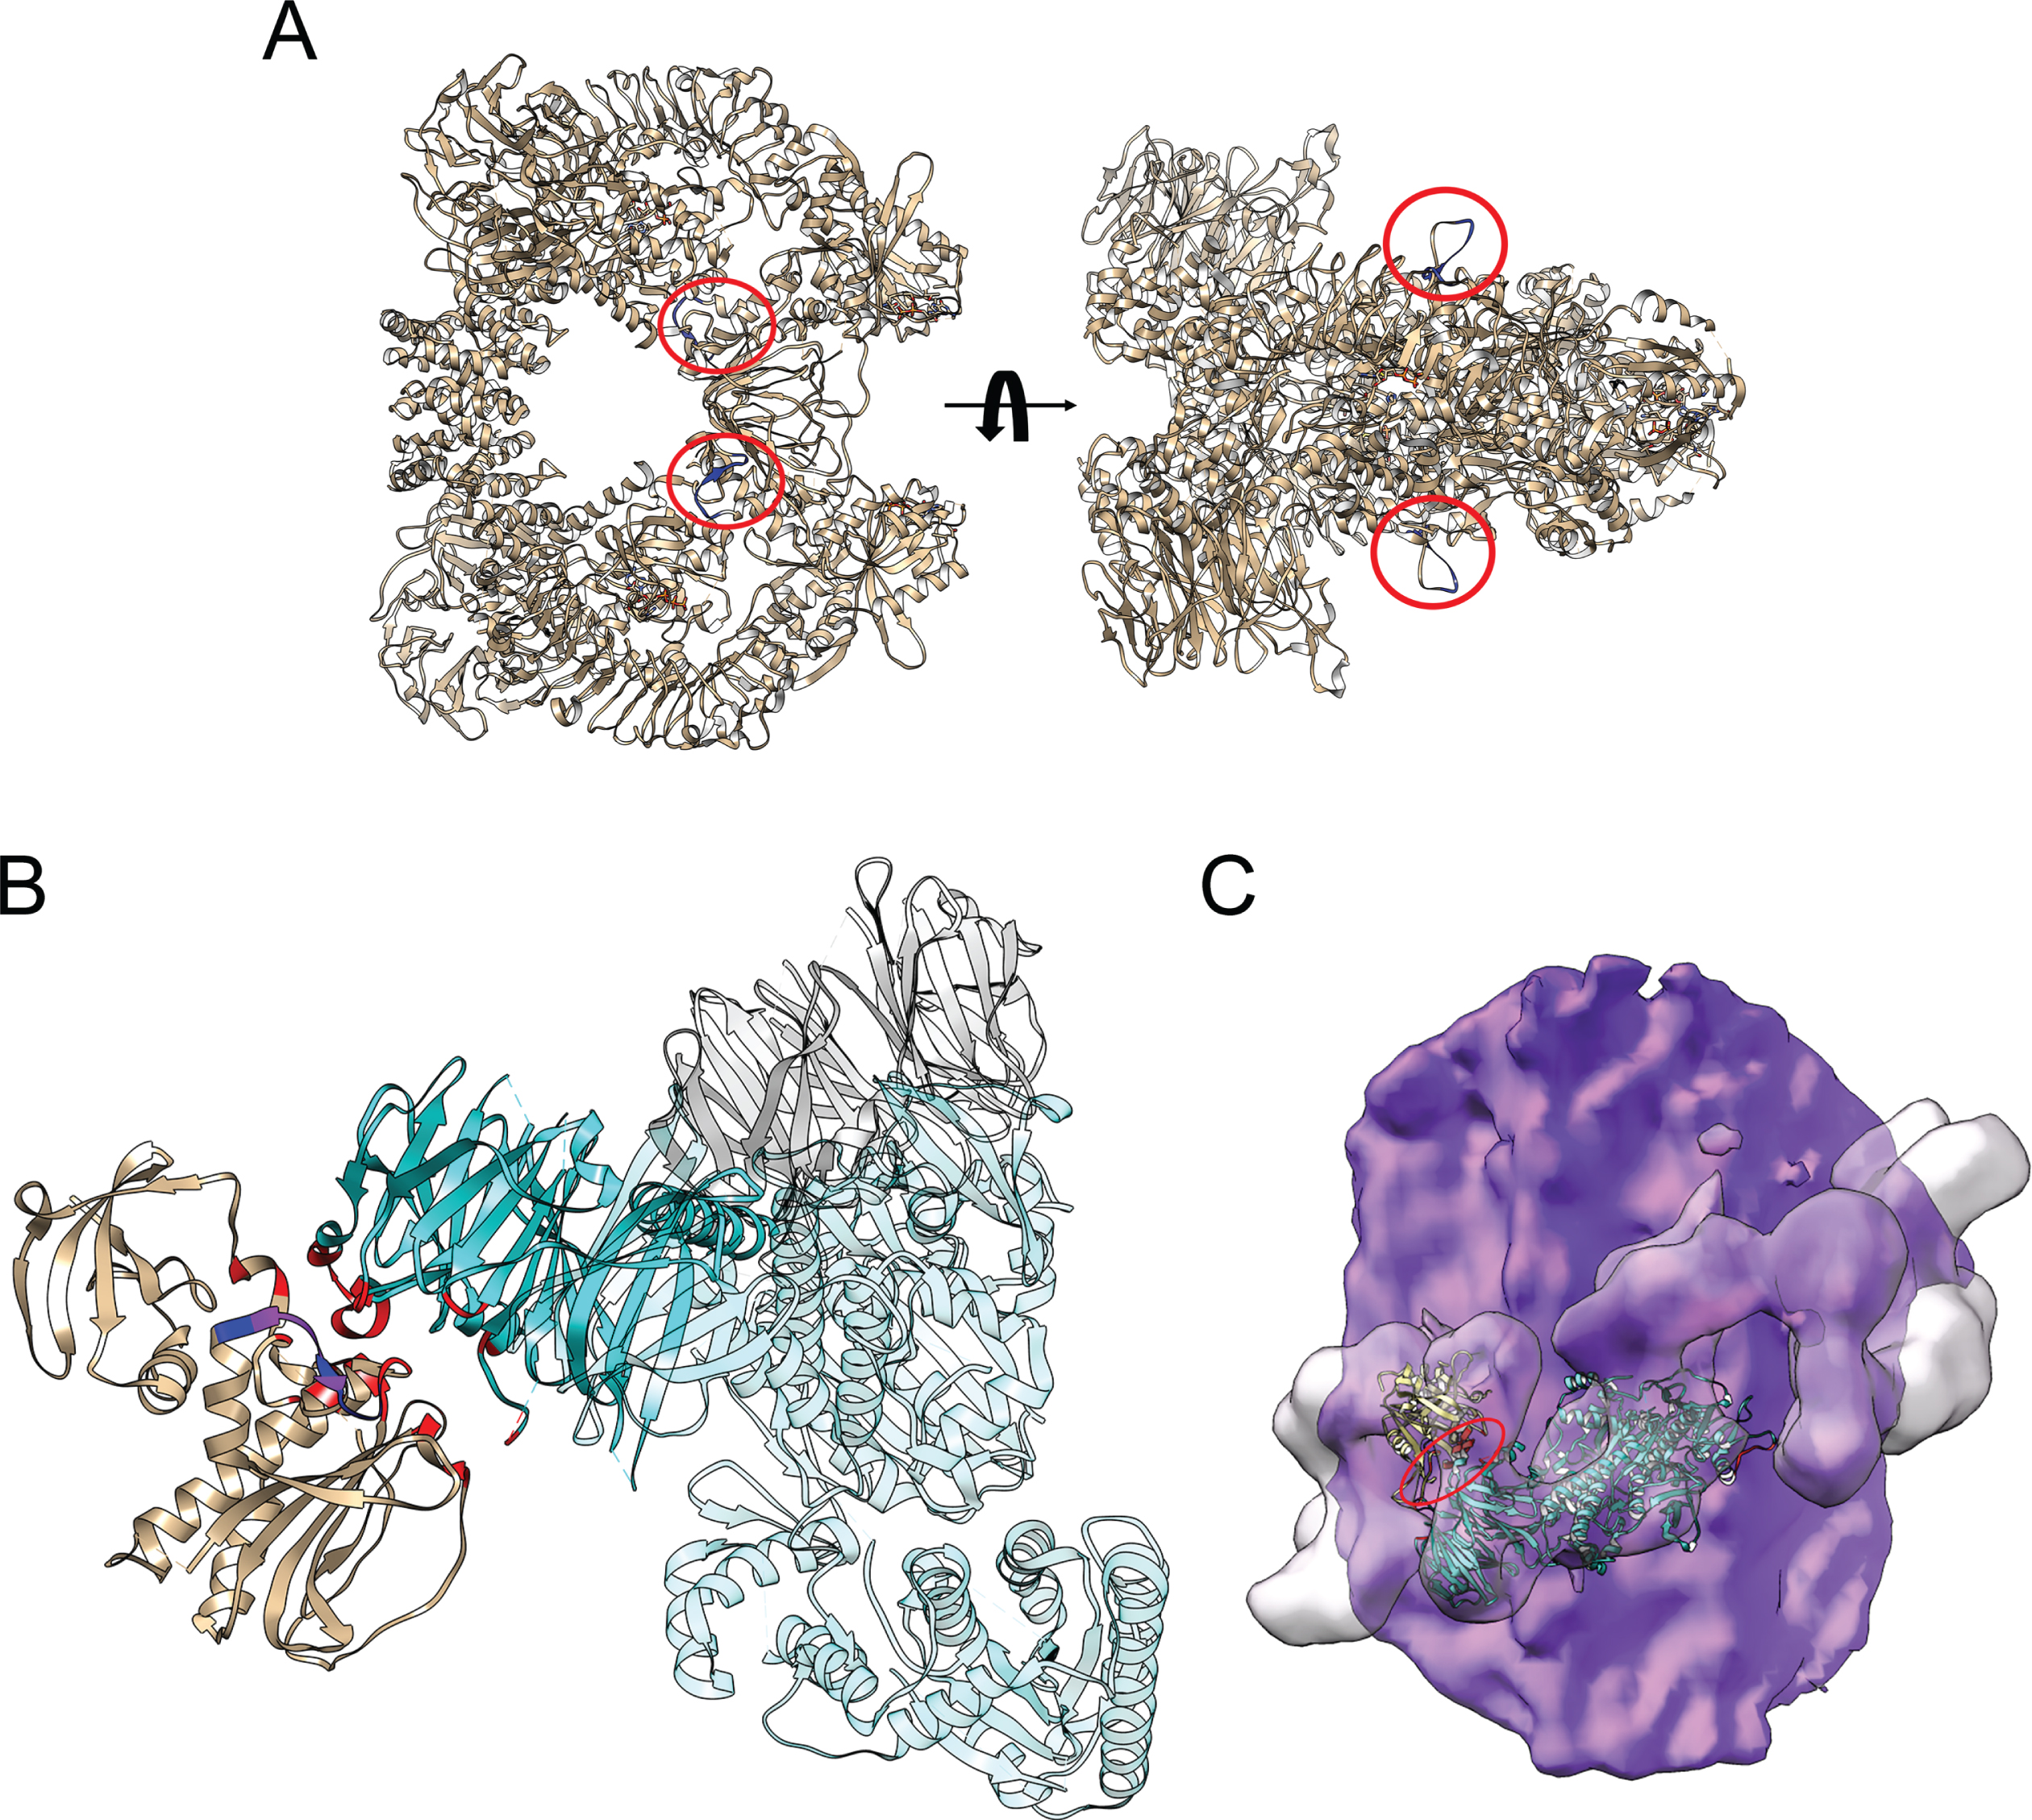
A reference table of epitope binding sites is given for the commonly used LRRK2 monoclonal antibodies (Supplementary Figure 2B), with the N241A/34 antibody epitope mapped to residues 1836–1845 in the COR domain of LRRK2 [31]. This region is solvent accessible in the cryo-EM structure of the LRRK2 dimer (Fig. 2A) [30]. However, interaction of LRRK2 with microtubules places this epitope at the interface with the WD40 domain of an adjacent LRRK2 monomer, thereby burying residues G1837, D1838, L1839, and V1841 (Fig. 2B, C) [28, 39]. These structural data indicate that the inability of the N241/34 antibody to recognize microtubule-bound LRRK2 is owing to occlusion of its epitope in the complex. In contrast, the UDD3 antibody recognizes LRRK2 irrespective of complex state. This antibody has been raised against the first 100 amino acids of LRRK2, which is located on the flexible N-terminus of the protein. Therefore, UDD3 is expected to detect microtubule-associated LRRK2, as its epitope is far from the LRRK2-LRRK2 interfaces or from regions of LRRK2 that interact with microtubules (Supplementary Figure 3).
Fig. 2
Location of the N241A/34 epitope on the LRRK2 dimer and on microtubule-associated LRRK2. A) The epitope of the N241A/34 antibody (amino acids 1836–1845; blue) is circled in red on the LRRK2 dimer (modified from PDB 7LHT). The surface-exposed location of the epitope in the LRRK2 dimer is predicted to allow for ready access of antibody binding. B) The COR domain from one LRRK2 monomer (brown) interacts with the WD40 domain of a neighboring LRRK2 monomer (cyan) in the structure of microtubule-associated LRRK2 (PDB 6VP8). The interfacial region between these domains (red) overlaps with the N241A/34 epitope (blue). Residues in common between the epitope and the COR-WD40 interface are highlighted (purple). C) The structure of the ROC-COR-Kinase-WD40 (PDB 6VP8) domains of LRRK2 was superimposed on the cryo-EM structure of microtubule-associated LRRK2 (PDB 6XR4), with the microtubule surface in purple and the envelope of the microtubule-associated LRRK2 in transparent surface that is helically arrayed around the microtubule. The regions in red (major one circled) indicate the location of the N241A/34 epitope.
We next attempted to measure kinase activity-related signaling events through LRRK2 RAB phosphorylation and autophosphorylation. When examining RAB proteins as substrates, a commercially available RAB10 antibody displayed weak staining of endogenous RAB10 in both LRRK2 transfected and non-transfected cells, with additional pronounced perinuclear accumulation in pathogenic LRRK2-expressing cells that was blocked by MLi-2 treatment (Fig. 1C). The pT73-RAB10 antibody also revealed perinuclear accumulation in pathogenic LRRK2-expressing cells, which was reverted upon MLi-2 treatment (Fig. 1D). However, in parallel experiments, the pS1292 LRRK2 antibody did not produce a reliable signal in either G2019S or R1441C mutant LRRK2-transfected cells (Fig. 1E, F).
Given the apparent lack of suitability of methods to measure LRRK2 activation in cells using S1292 LRRK2 antibody by immunocytochemistry in the overexpression condition, we turned to the more sensitive approach of proximity ligation assay (PLA) [22]. A combination of the pS1292 LRRK2 antibody and N241A/34 displayed robust measurable PLA signal, as quantified using the number of dots per cell, in cells transfected with G2019S LRRK2 that was diminished by treatment with MLi-2 (Fig. 3A). Although G2019S LRRK2 demonstrated significantly higher PLA signal than WT LRRK2, all other mutations were similar to WT LRRK2, and notably, I2020T LRRK2 did not differ from WT and was not different in PLA signal for autophosphorylation after MLi-2 treatment (Fig. 3B). Overall, these results do not parallel those observed from western blots (Supplementary Figure 1), and the observed PLA signal for autophosphorylation may not be sensitive to LRRK2 kinase inhibition with some mutations. Since microtubule-bound LRRK2 was not efficiently detected by the N241A/34 antibody, we wondered whether there would be less PLA signal in cells where LRRK2 was microtubule-bound. However, there was no difference in PLA signals between cells where GFP-tagged LRRK2 displayed mainly cytosolic versus additional microtubule-bound localization (Supplementary Figure 4), possibly reflecting the high variability of the assay from cell to cell and the small minority of LRRK2 bound to microtubule structures.
Fig. 3
Detection of active LRRK2 in HEK293T cells overexpressing GFP-tagged WT and mutant LRRK2 constructs using PLA. A) HEK293T cells were transiently transfected with either GFP-tagged G2019S LRRK2 (top) or GFP-tagged R1441C LRRK2 (bottom) and incubated in the absence or presence of MLi-2 (100 nM, 2 h) prior to pS1292-LRRK2 PLA assay (red), and coverslips stained with DAPI (blue). Scale bar, 10 μm. Note that in the absence of MLi-2, GFP-tagged G2019S LRRK2 is largely cytosolic, whilst GFP-tagged R1441C LRRK2 displays a filamentous localization. In the presence of MLi-2, both GFP-tagged G2019S and R1441C LRRK2 display a filamentous localization, previously described to colocalize with microtubules. B) HEK293T cells were transfected with either empty vector (pCMV) or with the indicated GFP-tagged LRRK2 constructs and incubated in the absence or presence of MLi-2 (100 nM, 2 h). Cells were subjected to pS1292-LRRK2 PLA assay, and PLA signals were quantified as discrete dots due to rolling circle-mediated amplification in each of around 50 randomly transfected cells per condition. Control PLA assays were performed in cells transiently transfected with GFP-tagged G2019S LRRK2 and included omission of the anti-pS1292 LRRK2 antibody (–1292), the anti-LRRK2 antibody (-N241A/34), or omission of either PLUS probe (-PLUS) or MINUS probe (-MINUS), respectively. Data depict mean±S.E.M. (****p < 0.001; *p < 0.05; n.s., not significant). The experiment was performed twice with similar results obtained in both cases, and comparable to those previously described [20].
![Detection of active LRRK2 in HEK293T cells overexpressing GFP-tagged WT and mutant LRRK2 constructs using PLA. A) HEK293T cells were transiently transfected with either GFP-tagged G2019S LRRK2 (top) or GFP-tagged R1441C LRRK2 (bottom) and incubated in the absence or presence of MLi-2 (100 nM, 2 h) prior to pS1292-LRRK2 PLA assay (red), and coverslips stained with DAPI (blue). Scale bar, 10 μm. Note that in the absence of MLi-2, GFP-tagged G2019S LRRK2 is largely cytosolic, whilst GFP-tagged R1441C LRRK2 displays a filamentous localization. In the presence of MLi-2, both GFP-tagged G2019S and R1441C LRRK2 display a filamentous localization, previously described to colocalize with microtubules. B) HEK293T cells were transfected with either empty vector (pCMV) or with the indicated GFP-tagged LRRK2 constructs and incubated in the absence or presence of MLi-2 (100 nM, 2 h). Cells were subjected to pS1292-LRRK2 PLA assay, and PLA signals were quantified as discrete dots due to rolling circle-mediated amplification in each of around 50 randomly transfected cells per condition. Control PLA assays were performed in cells transiently transfected with GFP-tagged G2019S LRRK2 and included omission of the anti-pS1292 LRRK2 antibody (–1292), the anti-LRRK2 antibody (-N241A/34), or omission of either PLUS probe (-PLUS) or MINUS probe (-MINUS), respectively. Data depict mean±S.E.M. (****p < 0.001; *p < 0.05; n.s., not significant). The experiment was performed twice with similar results obtained in both cases, and comparable to those previously described [20].](https://ip.ios.semcs.net:443/media/jpd/2022/12-5/jpd-12-5-jpd213128/jpd-12-jpd213128-g003.jpg)
As the PLA signal in the context of G2019S LRRK2 expression demonstrated an order-of-magnitude increase in signal compared to G2019S LRRK2 treated with MLi-2, we further confirmed the enhanced ability of PLA to measure G2019S LRRK2-related kinase activity in a second overexpression system, namely inducible HEK cells. Using a variety of antibody pairs, we were able to measure PLA signal in G2019S LRRK2-expressing cells that could be returned to levels seen in WT LRRK2 cells by addition of MLi-2 (Supplementary Figure 5). These results indicate that there is measurable kinase-dependent activity for G2019S LRRK2 in this alternate expression model, and that the PLA assay is potentially suitable to measure G2019S LRRK2 kinase activity in the context of overexpression in HEK293T cells.
Lack of effect of oxidative stress on activity of overexpressed LRRK2
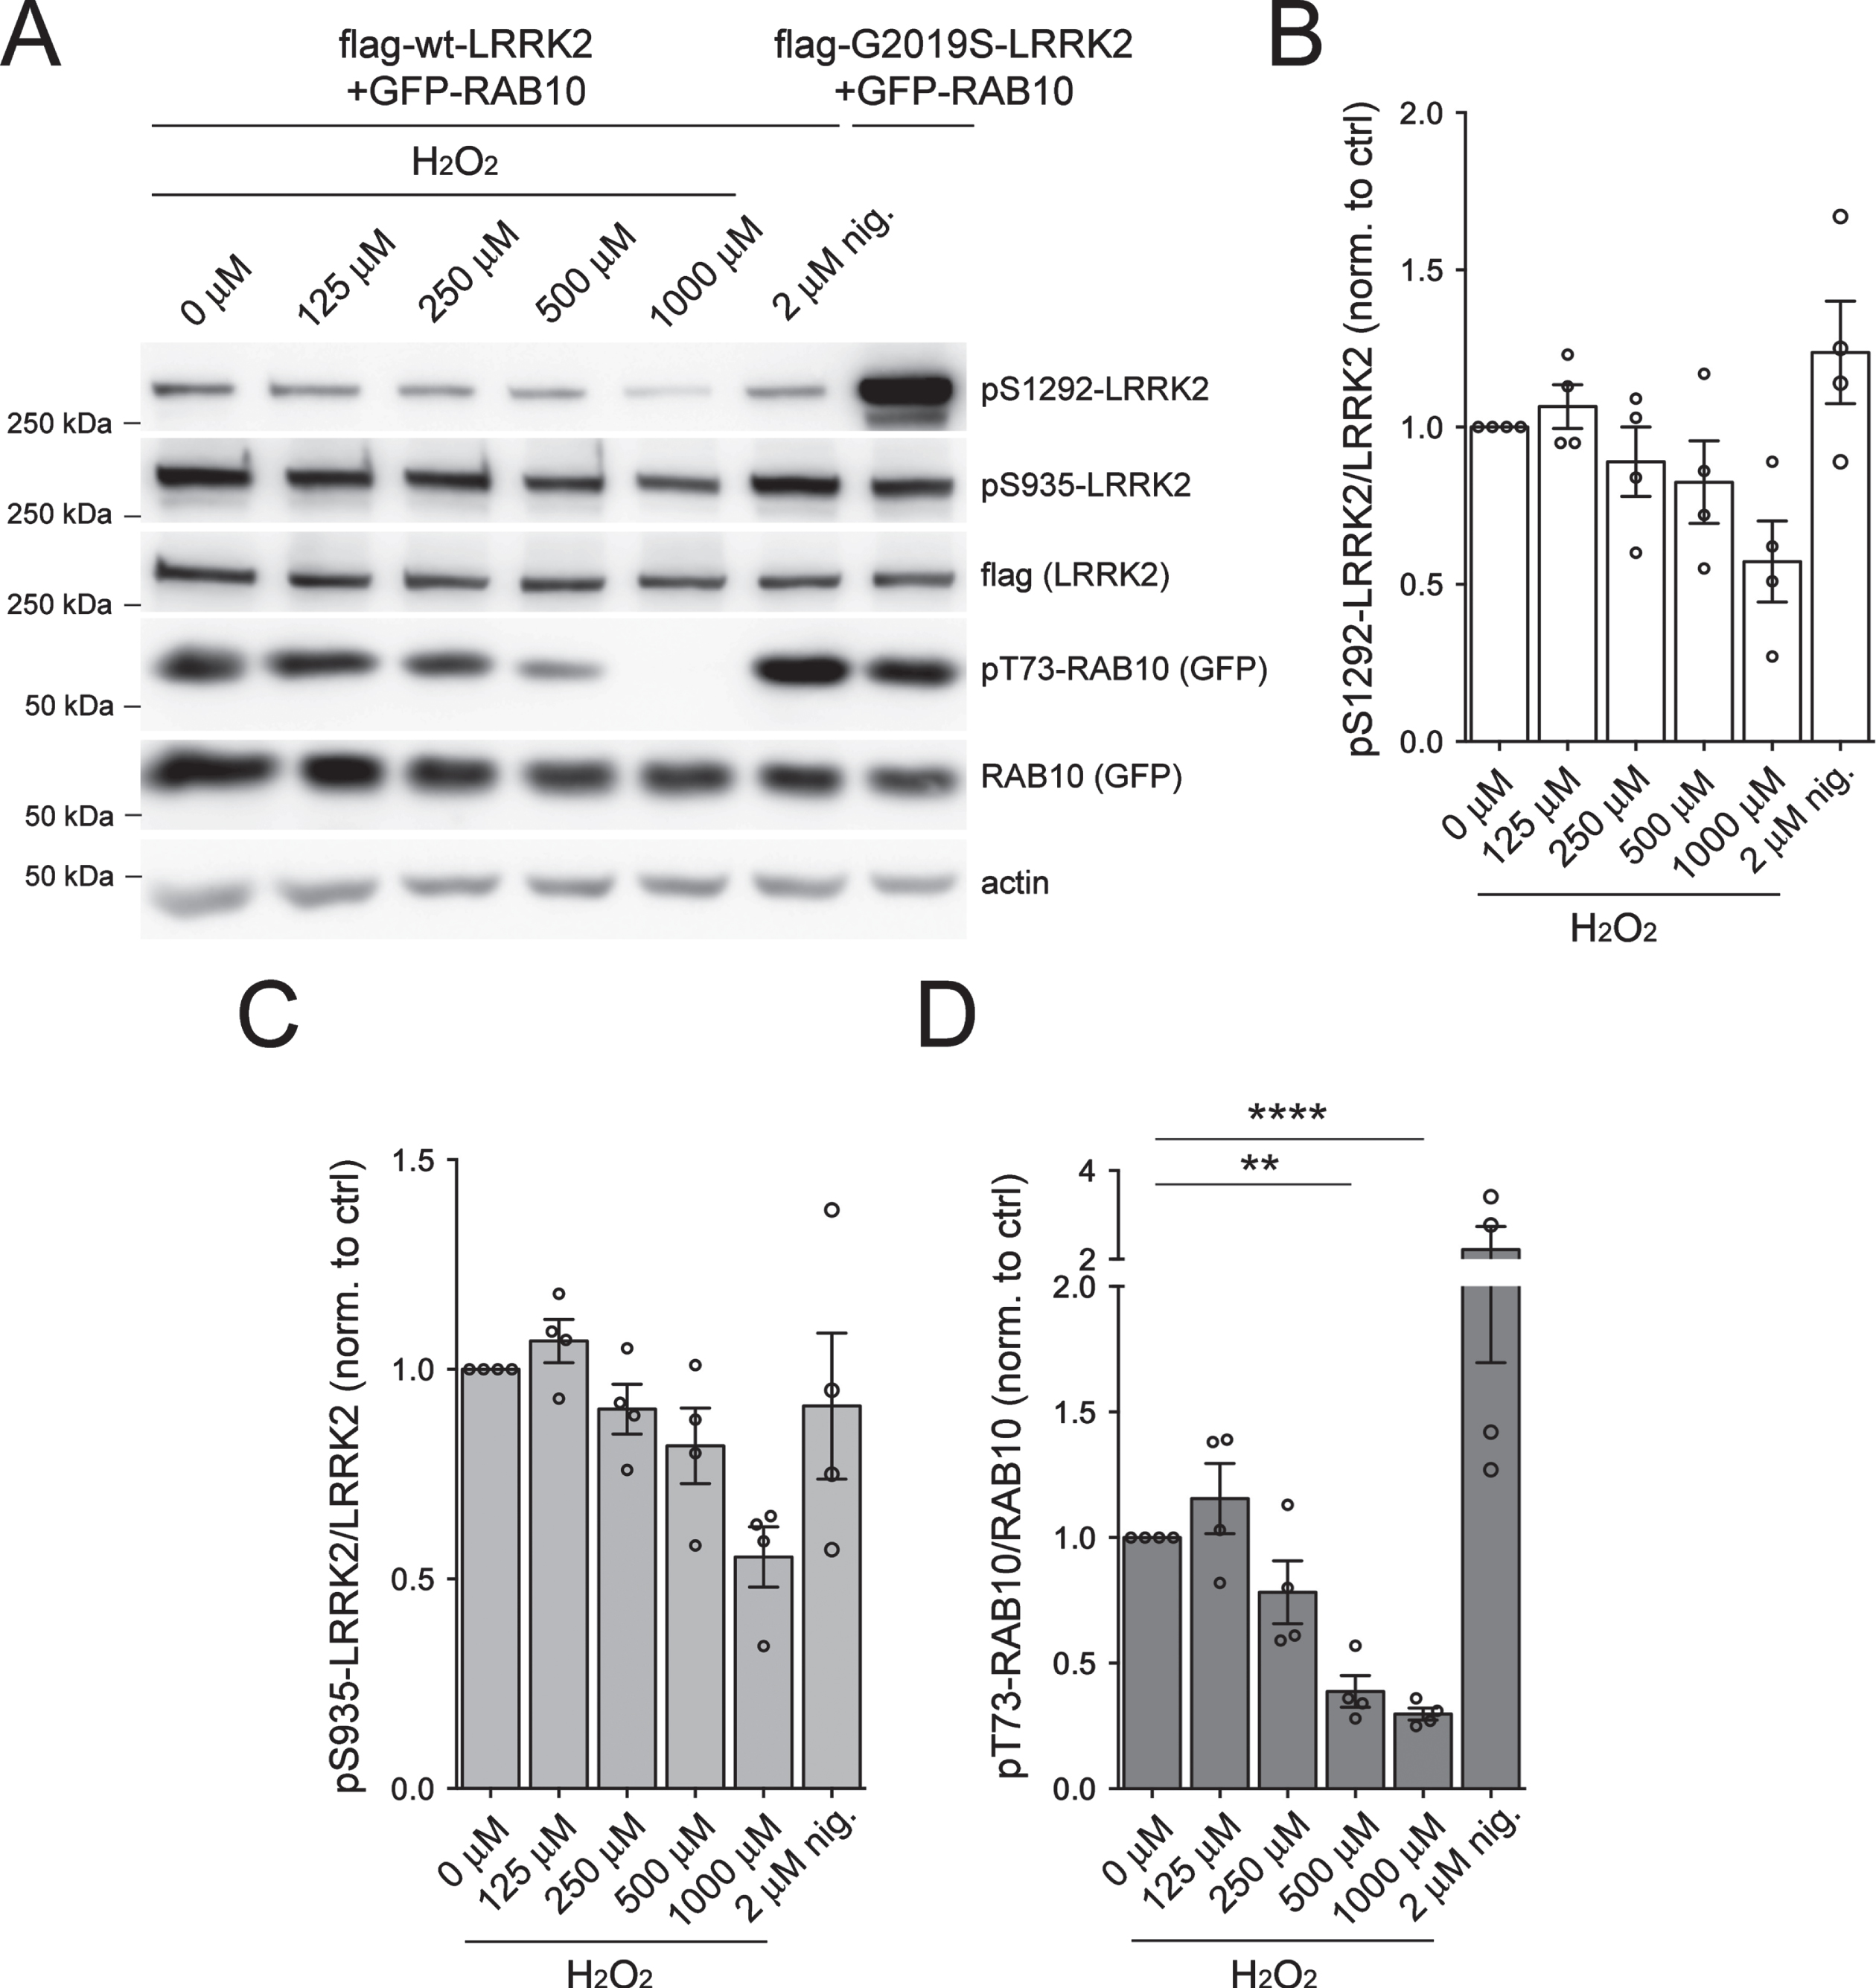
While potent LRRK2 inhibitors have been described, fewer agents are known that robustly activate LRRK2 kinase in cells. Prior studies have suggested that LRRK2 kinase activity, even when overexpressed in cells, may be very low. Exposure of cells to oxidative stress has been reported to enhance LRRK2 activation [22, 42–45]. Since endogenous pT73-RAB10 signal in transfected HEK293T cells overexpressing LRRK2 was low (Supplementary Figure 1), we co-transfected cells with flag-tagged WT LRRK2 and GFP-tagged RAB10 (Fig. 4A-D). Cells were treated with increasing concentrations of hydrogen peroxide (125–1000 μM) to induce oxidative stress, or with the endolysosomal stressor nigericin (2 μM) which has been reported to activate LRRK2 [46]. Nigericin caused an increase while H2O2 treatment caused a dose-dependent decrease in pT73-RAB10 levels (Fig. 4D), even though neither treatment significantly altered pS1292-LRRK2 or pS935-LRRK2 levels (Fig. 4B, C).
Fig. 4
LRRK2 kinase activity following treatment with H2O2 in HEK293T cells. HEK293T cells were transiently transfected with either 3xFLAG WT or G2019S LRRK2 for 48 h before being incubated with increasing doses of H2O2 (125 μM, 250 μM, 500 μM and 1000 μM) or nigericin (2 μM) for 90 min at 37°C. A) Western blot analysis of RAB10 phosphorylation (pT73) and LRRK2 phosphorylation (pS1292 or pS935) in cells treated with H2O2 or nigericin. B) Densitometric quantification of pS1292-LRRK2 normalized to total FLAG-LRRK2. Bars represent mean±S.E.M. (n = 4 independent transfections). C) Densitometric quantification of pS935-LRRK2 normalized to total FLAG-LRRK2. Bars represent mean±S.E.M. (n = 4 independent transfections). D) Densitometric quantification of pT73-RAB10 normalized to total GFP-RAB10. Bars represent mean±S.E.M. (n = 4 independent transfections; ****p < 0.001; **p < 0.01; Dunnett’s multiple comparison test).
Overexpression of RAB29 (also referred to as RAB7L1) along with WT or G2019S LRRK2 overexpression can enhance LRRK2 autophosphorylation [24, 47], although the physiological relevance of this overexpression has been questioned [46]. To determine whether the levels of pS1292-LRRK2 could be dynamically regulated, we transfected HEK293T cells with flag-tagged mutant LRRK2 and RAB29 (Supplementary Figure 6). Consistent with previous reports [24, 47], we noted a slight increase in pS1292-LRRK2 when coexpressing RAB29, and a significant decrease when cells were incubated with MLi-2 (Supplementary Figure 6A, B). In contrast, no effect was noted when rotenone or hydrogen peroxide (10 μM, 2 h) were added to initiate oxidative stress (Supplementary Figure 6). As expected in this model, levels of pS935 LRRK2 were significantly lower upon MLi-2 treatment (Supplementary Figure 6C), while total LRRK2 levels did not vary under any of these conditions (Supplementary Figure 6D). Therefore, we conclude that oxidative stress may not increase kinase activity of LRRK2 as detected by either pS1292-LRRK2 or pT73-RAB10 measurements, at least in the cellular contexts and employing short-term incubations with a range of hydrogen peroxide concentrations as used here.
Measurement of LRRK2 activity in cells under endogenous conditions
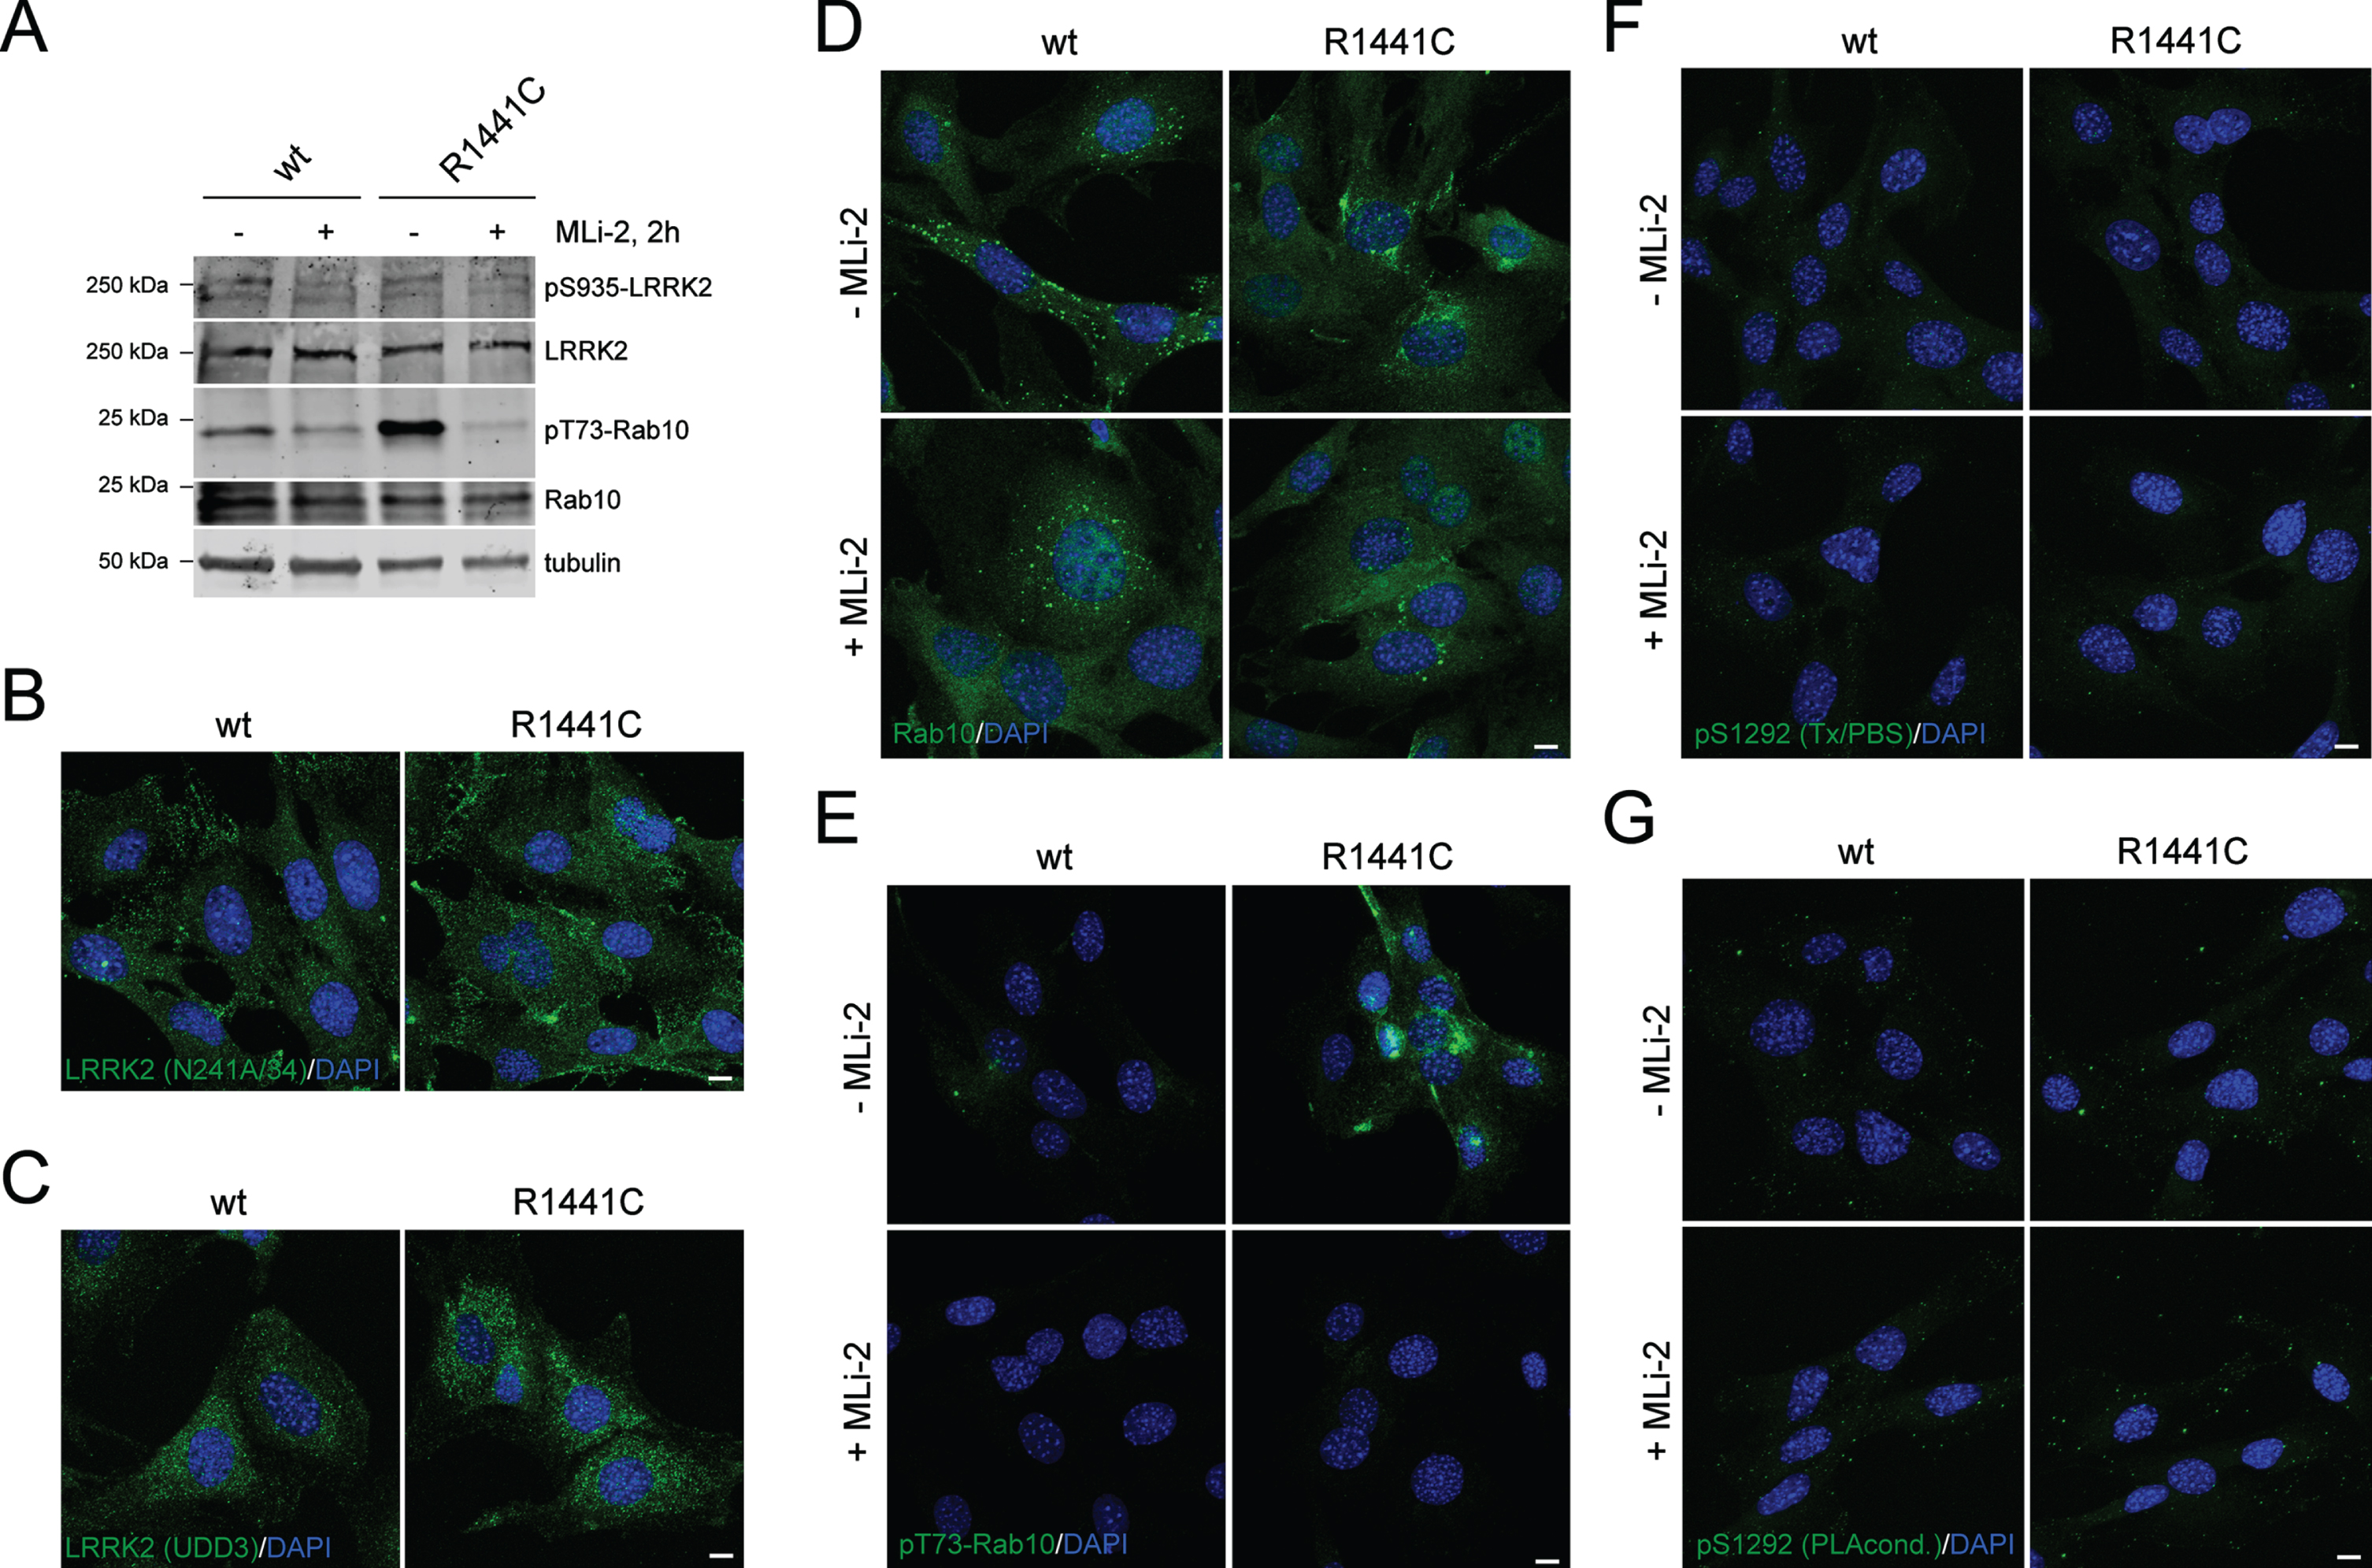
Mouse embryonic fibroblasts (MEFs) have been reported to harbor high levels of endogenous LRRK2 expression and have been used previously to study LRRK2 kinase activity [21, 48]. We cultured MEF cells from animals with the homozygous R1441C mutation in Lrrk2 knocked into the genome compared to MEFs from littermate-matched WT animals [21]. As previously described [48, 49], R1441C MEFs have higher activity than WT cells, as evidenced by increased pT73-Rab10 on western blotting (Fig. 5A). In agreement with published data in other cell systems [31, 40, 41], there was no accumulation of endogenous LRRK2 along microtubules after MLi-2 treatment or with LRRK2 mutation (Fig. 5B, C). The same cells were stained for total Rab10, with a noted punctate distribution in both genotypes (Fig. 5D), even though determination of signal specificity for LRRK2 or Rab10 would require additional controls employing MEFs either deficient in LRRK2 or Rab10. However, the pT73-RAB10 antibody has been validated to specifically recognize pT73-Rab10 by immunocytochemistry techniques in R1441G MEF cells, with the signal abolished upon lentiviral knockdown of Rab10 or upon LRRK2 kinase inhibition by MLi-2 [50]. WT MEFs showed remarkably little staining for pT73-Rab10, but a dramatic enhancement of pT73-Rab10 staining was observed in R1441C MEFs that was abrogated by MLi-2 treatment (Fig. 5E). Finally, neither genotype was positive for pS1292-LRRK2 by immunostaining under two alternate conditions (Fig. 5F, G). These results highlight pT73-Rab10 immunocytochemistry as a dynamic marker for R1441C LRRK2 activity in MEF cells.
Fig. 5
Immunocytochemistry and western blotting of WT and R1441C LRRK2 MEF cells using various antibodies. A) Cells were incubated in the presence or absence of MLi-2 (200 nM, 2 h), and extracts subjected to western blotting using the indicated antibodies. B) Example of MEF cells stained with anti-LRRK2 antibody (N241A/34) and DAPI. C) Example of MEF cells stained with anti-LRRK2 antibody (UDD3) and DAPI. (D) Example of MEF cells in the absence or presence of MLi-2 (200 nM, 2 h) as indicated, and stained with knockout-validated RAB10 (SAB5300028) antibody and DAPI. E) Example of MEF cells in the absence or presence of MLi-2 and stained with an anti-pT73-RAB10 antibody (ab241060) and DAPI. F) Example of MEF cells in absence or presence of MLi-2 and stained with pS1292-LRRK2 antibody (Triton-X100/PBS-containing buffer conditions) and DAPI. G) As in (F), but cells stained with pS1292-LRRK2 antibody (PLA buffer conditions) and DAPI. Scale bars, 10 μm. Representative western and images are from two independent experiments with comparable results obtained in both cases.
We next utilized a second cell line known to express high levels of LRRK2, human lymphoblastoid cell lines (LCL), to explore human G2019S LRRK2 with the pT73-RAB10 immunocytochemistry approach (Fig. 6A-C), but the relative difference between WT and G2019S LRRK2 cells was modest compared to the above differences observed in MEFs. This relative lack of difference between genotypes in pT73-RAB10 was confirmed by western blots of lysates (Fig. 6D). While the pT73-RAB10 immunocytochemistry signal could be blocked by addition of excess phospho-peptide (Fig. 6C), there was no endogenous staining for pS1292-LRRK2 that was sensitive to MLi-2 (Fig. 6E, F). Collectively, these results suggest that immunostaining for LRRK2 and RAB10 can be performed in human LCL samples, but additional controls (e.g., LRRK2 knockout lines) should be developed to establish assay background.
Fig. 6
Immunocytochemistry and western blotting of control and G2019S LRRK2 LCLs using various antibodies. A) Example of control (ctrl) WT and G2019S LRRK2 LCLs stained with anti-LRRK2 antibody (N241A/34) and DAPI. B) Example of LCLs stained with knockout-validated RAB10 (SAB5300028) antibody (green), centrosomal marker (pericentrin, red) and DAPI. C) Example of LCLs stained with sheep anti-pT73-RAB10 antibody (green), centrosomal marker (pericentrin, red) and DAPI. The sheep antibody was either preabsorbed with a 10-fold molar excess of dephospho-peptide or of phospho-peptide as indicated. Identical results were obtained when employing the rabbit monoclonal anti-pT73-RAB10 antibody (Abcam, ab241060) [20]. D) Cells were incubated in the absence or presence of MLi-2 (100 nM, 2 h), and extracts subjected to western blotting using the indicated antibodies. E) Example of cells in absence or presence of MLi-2 (10 nM, 2 h), and stained with pS1292-LRRK2 antibody (Triton-X100/PBS-containing buffer conditions) and DAPI. F) As in (E), but cells stained with pS1292-LRRK2 antibody (PLA buffer conditions) and DAPI. Scale bars, 10 μm. Representative western and images are from two independent experiments, with comparable results obtained in both cases.
![Immunocytochemistry and western blotting of control and G2019S LRRK2 LCLs using various antibodies. A) Example of control (ctrl) WT and G2019S LRRK2 LCLs stained with anti-LRRK2 antibody (N241A/34) and DAPI. B) Example of LCLs stained with knockout-validated RAB10 (SAB5300028) antibody (green), centrosomal marker (pericentrin, red) and DAPI. C) Example of LCLs stained with sheep anti-pT73-RAB10 antibody (green), centrosomal marker (pericentrin, red) and DAPI. The sheep antibody was either preabsorbed with a 10-fold molar excess of dephospho-peptide or of phospho-peptide as indicated. Identical results were obtained when employing the rabbit monoclonal anti-pT73-RAB10 antibody (Abcam, ab241060) [20]. D) Cells were incubated in the absence or presence of MLi-2 (100 nM, 2 h), and extracts subjected to western blotting using the indicated antibodies. E) Example of cells in absence or presence of MLi-2 (10 nM, 2 h), and stained with pS1292-LRRK2 antibody (Triton-X100/PBS-containing buffer conditions) and DAPI. F) As in (E), but cells stained with pS1292-LRRK2 antibody (PLA buffer conditions) and DAPI. Scale bars, 10 μm. Representative western and images are from two independent experiments, with comparable results obtained in both cases.](https://ip.ios.semcs.net:443/media/jpd/2022/12-5/jpd-12-5-jpd213128/jpd-12-jpd213128-g006.jpg)
We turned to PLA as a potentially more sensitive approach to identify endogenous LRRK2 activity, particularly WT LRRK2, in MEFs (Fig. 7A, B) and LCLs (Fig. 7C, D). We identified significant (above MLi-2-treated cells) PLA staining for autophosphorylation in LRRK2 R1441C mutant but not WT LRRK2 MEFs. Quantification of the number of PLA dots per cell showed that the signal in WT cells was not significantly greater than background staining as evaluated by a number of controls using antibody omission (Fig. 7B). Quantification, again compared to controls with omission of each antibody, confirmed that there was substantial signal in G2019S LRRK2 cells for autophosphorylation that could be blocked by MLi-2 (Fig. 7D). Collectively, these results suggest that PLA assays reflect endogenous mutant LRRK2 activity but not endogenous WT activity, at least with the phosphorylation-specific antibodies utilized here.
Fig. 7
Endogenous PLA in mouse and human cells. A) Example of pS1292-LRRK2 PLA signal (red) in WT and R1441C LRRK2 MEF cells, with DAPI in blue. Scale bar, 10 μm. B) Cells were treated in either the absence or presence of MLi-2 (200 nM, 2 h) as indicated, and subjected to pS1292-LRRK2 PLA assay. Control PLA assays included omission of the anti-pS1292 LRRK2 antibody (–1292), the anti-LRRK2 antibody (-N241A/34), or omission of either PLUS probe (-PLUS) or MINUS probe (-MINUS), respectively. PLA dots were quantified from 10–12 random fields and divided by the number of nuclei per field (around 150–250 nuclei per condition per experiment quantified). Data depict mean±S.E.M. (n = 3 experiments; ****p < 0.001). C) Example of pS1292-LRRK2 PLA signal (red) in control (ctrl) WT and G2019S LRRK2 LCL line stained with DAPI (blue). Scale bar, 10 μm. D) Quantification of the average number of pS1292-LRRK2 PLA dots per cell from two control and two G2019S LRRK2 LCL lines, in the presence or absence of MLi-2 (10 nM, 2 h). Controls included omission of either one of the two primary antibodies or of one of the two PLA probes as indicated. For each line and condition, between 130 and 160 random cells from distinct areas of each coverslip were quantified. Data depict mean±S.E.M. (*p < 0.05; **p < 0.01). Please note that PLA signals in the control and G2019S LRRK2 LCLs analyzed here were identical to those from a distinct larger sampling of control and G2019S LRRK2 PD patient LCLs [20].
![Endogenous PLA in mouse and human cells. A) Example of pS1292-LRRK2 PLA signal (red) in WT and R1441C LRRK2 MEF cells, with DAPI in blue. Scale bar, 10 μm. B) Cells were treated in either the absence or presence of MLi-2 (200 nM, 2 h) as indicated, and subjected to pS1292-LRRK2 PLA assay. Control PLA assays included omission of the anti-pS1292 LRRK2 antibody (–1292), the anti-LRRK2 antibody (-N241A/34), or omission of either PLUS probe (-PLUS) or MINUS probe (-MINUS), respectively. PLA dots were quantified from 10–12 random fields and divided by the number of nuclei per field (around 150–250 nuclei per condition per experiment quantified). Data depict mean±S.E.M. (n = 3 experiments; ****p < 0.001). C) Example of pS1292-LRRK2 PLA signal (red) in control (ctrl) WT and G2019S LRRK2 LCL line stained with DAPI (blue). Scale bar, 10 μm. D) Quantification of the average number of pS1292-LRRK2 PLA dots per cell from two control and two G2019S LRRK2 LCL lines, in the presence or absence of MLi-2 (10 nM, 2 h). Controls included omission of either one of the two primary antibodies or of one of the two PLA probes as indicated. For each line and condition, between 130 and 160 random cells from distinct areas of each coverslip were quantified. Data depict mean±S.E.M. (*p < 0.05; **p < 0.01). Please note that PLA signals in the control and G2019S LRRK2 LCLs analyzed here were identical to those from a distinct larger sampling of control and G2019S LRRK2 PD patient LCLs [20].](https://ip.ios.semcs.net:443/media/jpd/2022/12-5/jpd-12-5-jpd213128/jpd-12-jpd213128-g007.jpg)
Measuring endogenous LRRK2 activation in vivo
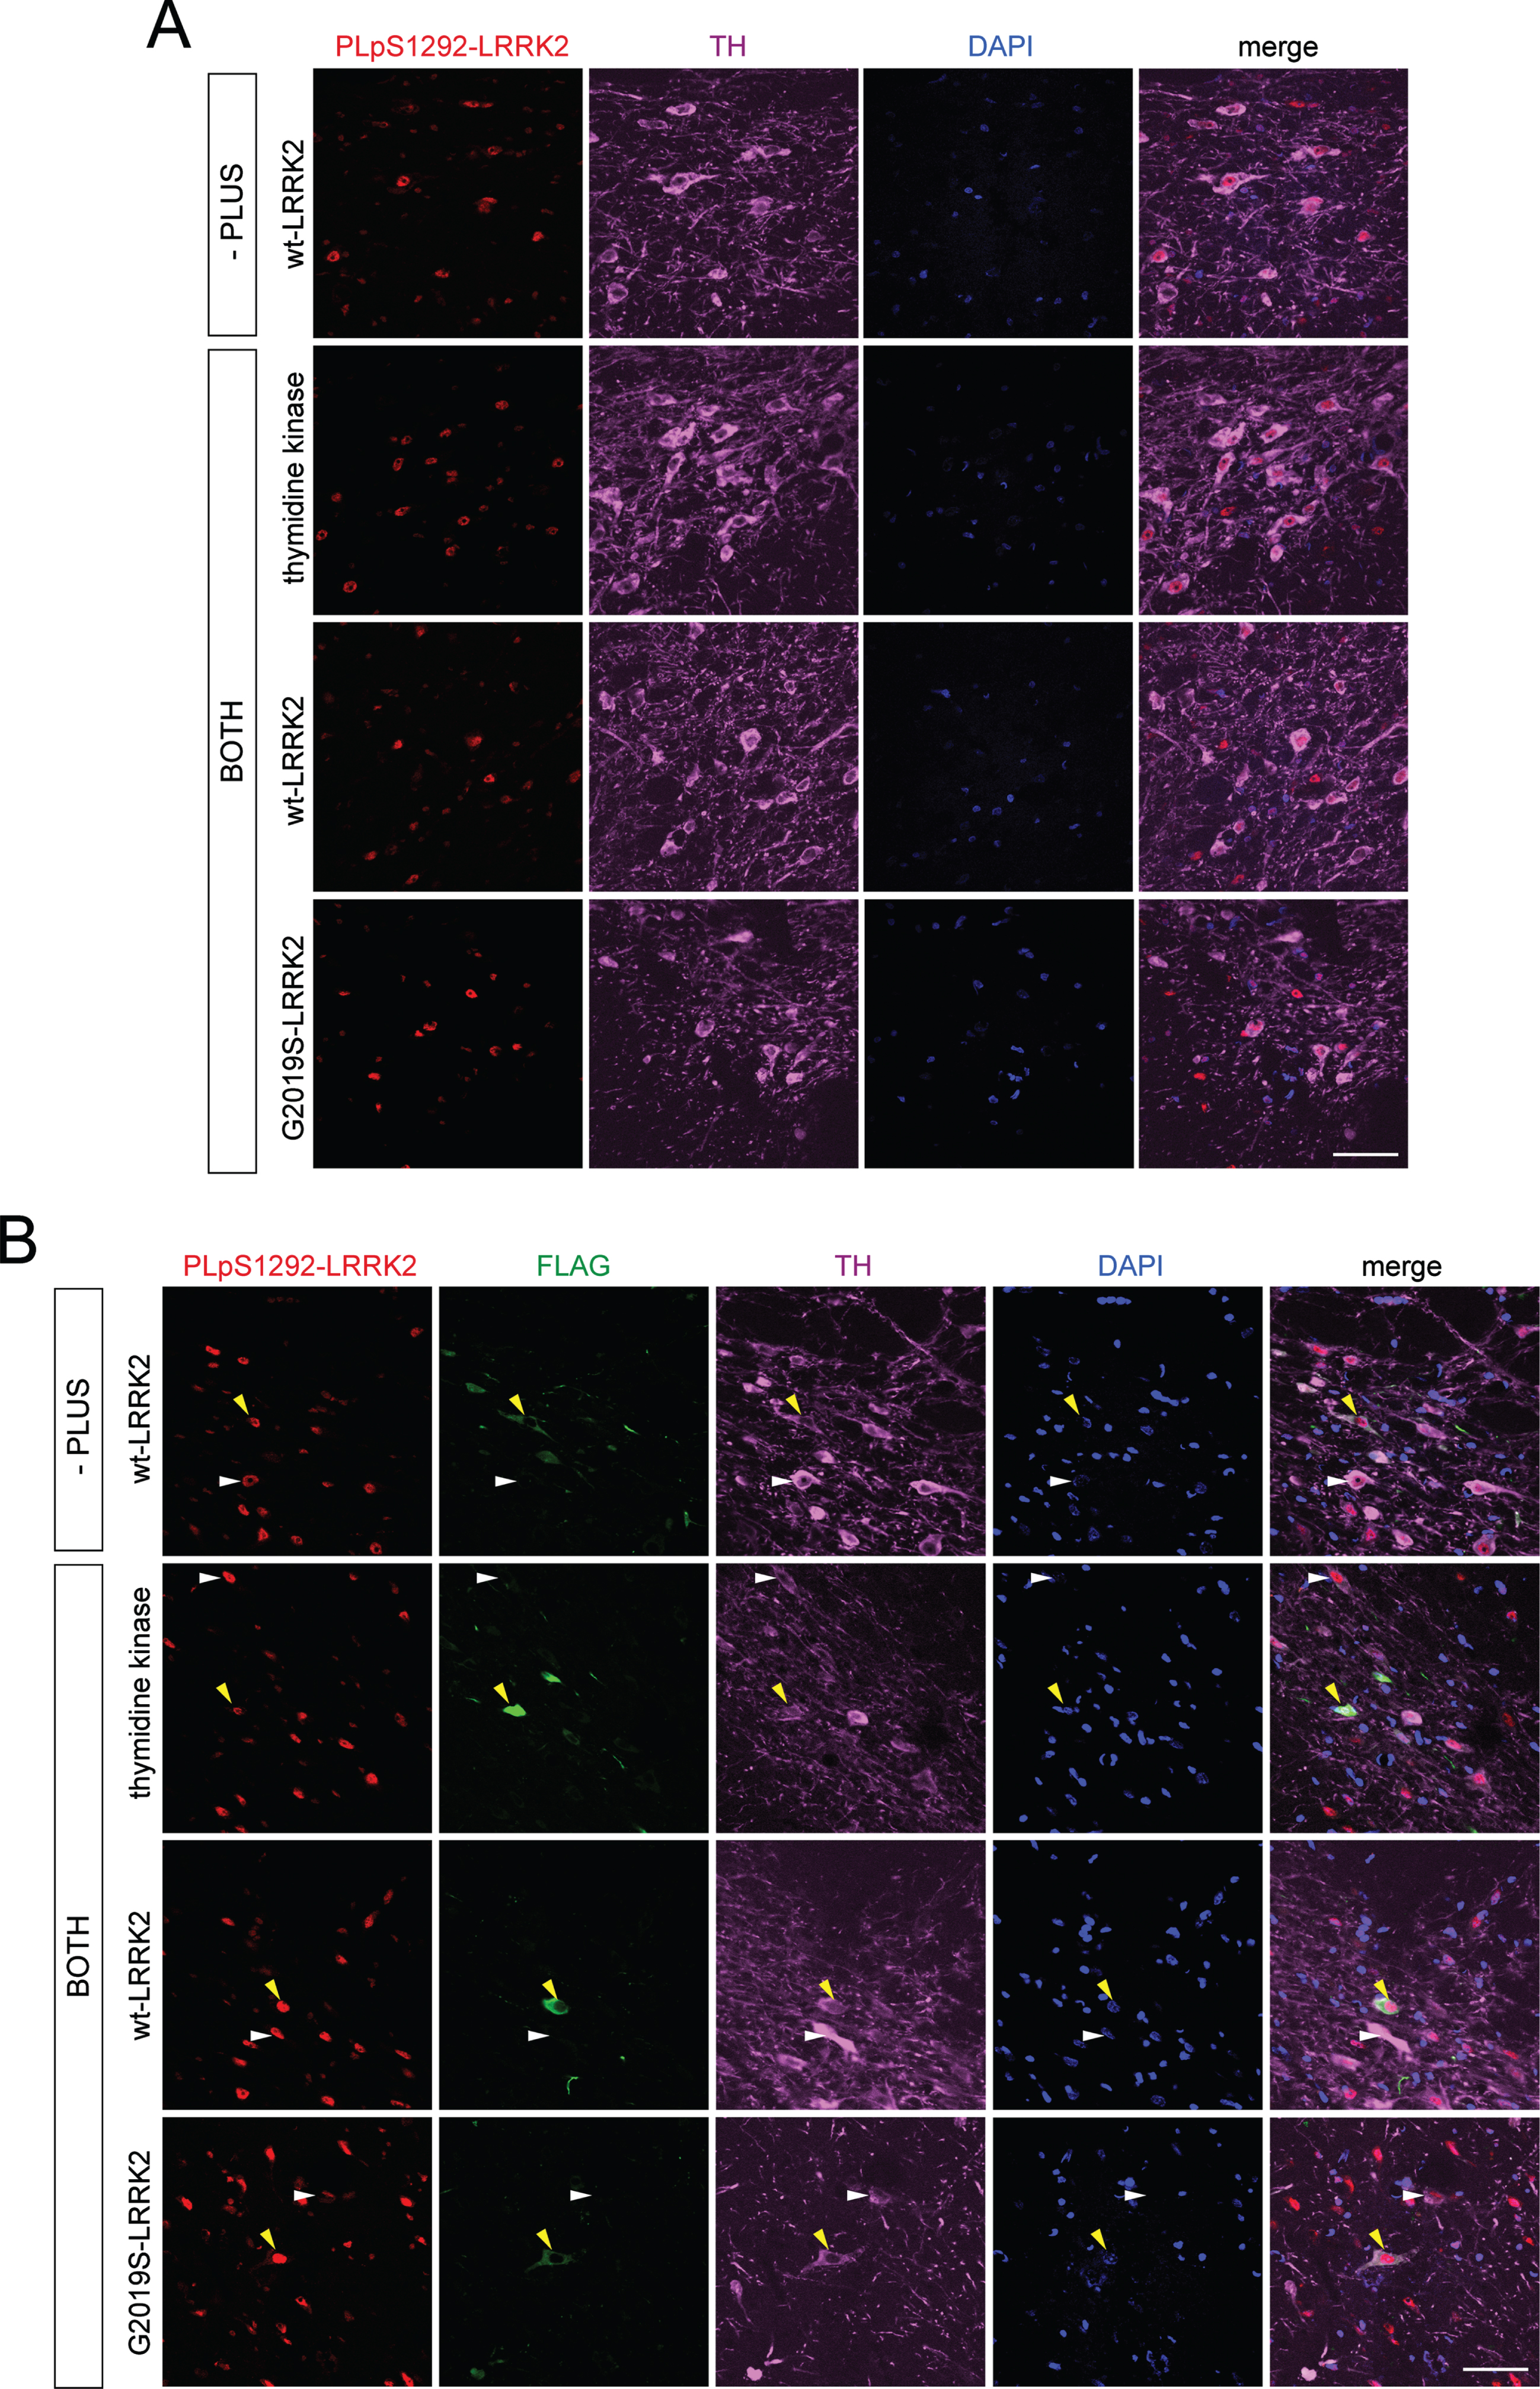
Given the apparent signal for pS1292-LRRK2 in PLA assays for G2019S LRRK2 expression, we next sought to detect the signal in brain sections in a rat model with overexpression of human G2019S LRRK2. In this model, we employed recombinant helper-dependent adenovirus serotype 5 (HdAd5) vectors to induce expression of full-length LRRK2 (WT or G2019S) or thymidine kinase with an N-terminal 3XFLAG tag in rat SNpc. As controls, we compared PLA pS1292-LRRK2 signal in animals expressing G2019S LRRK2 to animals expressing WT LRRK2 or thymidine kinase. As LRRK2 has very low endogenous expression in the rat SNpc and WT LRRK2 displays low levels of autophosphorylation at S1292, we expected to detect higher PLA pS1292-LRRK2 signal in FLAG-positive neurons in SNpc of rats expressing G2019S LRRK2 compared to control animals [22, 51]. Following unilateral delivery of HdAd5 vectors to six distinct sites within the striatum of adult rats (4.2×10⁹ viral particles/site in a 2 μl volume), brain tissue was examined at 42 days post-injection, a time point shown to exhibit robust transgene expression in SNpc dopaminergic neurons via retrograde axonal transport [52, 53]. When performing PLA using the antibody pair pS1292-LRRK2 and N241A/34 LRRK2 (PLA pS1292-LRRK2) on nigral tissues that had been prelabeled for the dopaminergic neuronal marker (anti-TH), we found no difference in PLA pS1292-LRRK2 signal in ipsilateral SNpc between animals expressing either thymidine kinase, WT LRRK2 or G2019S LRRK2. Importantly, the pS1292-LRRK2 signal from these animals was also not different to PLA control signal (-PLUS, lacking the PLUS secondary antibody) from ipsilateral SNpc of rats expressing WT LRRK2 (Fig. 8A). Alternatively, we also performed immunolabeling using FLAG antibody after the PLA reaction to specifically detect PLA pS1292-LRRK2 signal in FLAG-positive dopaminergic neurons in rat ipsilateral SNpc. In identifying the neurons with the highest levels of FLAG-LRRK2 or FLAG-thymidine kinase expression, there was no apparent increase in PLA pS1292-LRRK2 signal in FLAG-positive neurons compared to nearby FLAG-negative neurons in the ipsilateral nigra in animals expressing thymidine kinase, WT LRRK2 or G2019S LRRK2. The PLA pS1292-LRRK2 signal in FLAG-positive neurons in these animals also was not different from the PLA control signal (-PLUS) in FLAG-positive neurons in ipsilateral SNpc of rats expressing WT LRRK2 (Fig. 8B). These data suggest minimal sensitivity of PLA for detecting pS1292-LRRK2 signal for human LRRK2 in dopaminergic neurons of this rodent model.
Fig. 8
PLA of pS1292-LRRK2 detection in rat brain injected with HdAd5 vectors (thymidine kinase, WT LRRK2 and G2019S LRRK2) at 42 days post-injection. A) PLA with pS1292 LRRK2 antibody and total LRRK2 antibody (N241A/34) in rat SNpc. Sections were pre-immunostained with antibody to tyrosine hydroxylase (TH) following with corresponding fluorescent secondary antibody. Images taken with confocal microscope at 63x magnification showing PLA signal (red), TH signal (magenta) and DAPI (blue) for ipsilateral SNpc. PLA controls (-PLUS) include samples incubated without PLUS probe. PLA pS1292-LRRK2 (BOTH) include samples incubated with both PLUS and MINUS probes. Scale bar, 50 μm. B) PLA with pS1292-LRRK2 antibody and total LRRK2 antibody (N241A/34) followed by post-PLA labeling with FLAG antibody in rat SNpc. Sections were pre-immunostained with antibody to TH and following with corresponding fluorescent secondary antibody. After terminating the pS1292-LRRK2 PLA reaction, sections were probed with antibody to FLAG following with corresponding fluorescent secondary antibody. Images taken with confocal microscope at 63x magnification showing PLA S1292-LRRK2 signal (red), TH signal (magenta), FLAG signal (green) and DAPI (blue) for ipsilateral SNpc. Yellow arrowheads indicate FLAG-positive cells in ipsilateral SNpc and their corresponding PLA pS1292-LRRK2 and TH signals. White arrowheads indicate FLAG-negative cells in ipsilateral SNpc and their corresponding PLA pS1292-LRRK2 and TH signals. PLA controls (-PLUS) include samples incubated without PLUS probe. PLA pS1292-LRRK2 (BOTH) include samples incubated with both PLUS and MINUS probes. Scale bar, 50 μm.
Finally, we attempted to replicate recent reports of increased LRRK2 activity in dopamine neurons of the substantia nigra from idiopathic PD cases [22]. Using the PLA assay with the autophosphorylation antibody pS1292-LRRK2, we did not detect an authentic signal that was above the background, indicated by controls with the omission of pS1292-LRRK2 antibody (Fig. 9A). This was similar in samples from individuals without neurological diagnosis at post mortem and in PD cases (Table 1) (Fig. 9A). We tested a series of conditions by varying antigen retrieval procedures, blocking solutions, primary antibody dilutions and PLA reaction amplification times (Table 2). We also performed assays employing a recently published detailed protocol [23] (Fig. 9B), with parallel assays run in HEK293T cells overexpressing mutant LRRK2 to assure that the assay was technically working. Despite such extensive efforts and utilizing published protocols, we were unable to detect specific pS1292-LRRK2 PLA signal in postmortem brain from control or PD cases.
Fig. 9
LRRK2 activity in human autopsy brain from control or PD patients. FFPE axial midbrain blocks containing substantia nigra at the level of the red nucleus from control (ctrl) and iPD patients were sectioned at 5 μm thickness. A) After deparaffinization and rehydration, antigen retrieval was achieved at high pressure in citrate buffer (pH 6.0). After 48 h incubation with primary antibodies, PLA amplification was carried out for 130 min. Representative images for PLA pair pS1292-LRRK2 (N241A/34) are shown for control and iPD samples (n = 4 for each), stained for tyrosine hydroxylase (TH) and DAPI. As a control, an iPD brain section was subjected to PLA reaction without the pS1292 antibody (–1292). Scale bar, 40 μm. B) Sections were deparaffinized, autofluorescence was quenched by Sudan black solution followed by antibody incubations and PLA reactions exactly according to detailed published protocols [23]. Representative images for PLA pair pS1292-LRRK2 (N241A/34) are shown for control and iPD samples (n = 3 for each), stained for tyrosine hydroxylase (TH) and DAPI. As a control, an iPD brain section was subjected to PLA reaction without one of the secondary antibody probes (-MINUS). Scale bar, 40 μm.
![LRRK2 activity in human autopsy brain from control or PD patients. FFPE axial midbrain blocks containing substantia nigra at the level of the red nucleus from control (ctrl) and iPD patients were sectioned at 5 μm thickness. A) After deparaffinization and rehydration, antigen retrieval was achieved at high pressure in citrate buffer (pH 6.0). After 48 h incubation with primary antibodies, PLA amplification was carried out for 130 min. Representative images for PLA pair pS1292-LRRK2 (N241A/34) are shown for control and iPD samples (n = 4 for each), stained for tyrosine hydroxylase (TH) and DAPI. As a control, an iPD brain section was subjected to PLA reaction without the pS1292 antibody (–1292). Scale bar, 40 μm. B) Sections were deparaffinized, autofluorescence was quenched by Sudan black solution followed by antibody incubations and PLA reactions exactly according to detailed published protocols [23]. Representative images for PLA pair pS1292-LRRK2 (N241A/34) are shown for control and iPD samples (n = 3 for each), stained for tyrosine hydroxylase (TH) and DAPI. As a control, an iPD brain section was subjected to PLA reaction without one of the secondary antibody probes (-MINUS). Scale bar, 40 μm.](https://ip.ios.semcs.net:443/media/jpd/2022/12-5/jpd-12-5-jpd213128/jpd-12-jpd213128-g009.jpg)
Table 1
Demographic data for Parkinson’s disease and control patients. Age, gender, disease severity according to the Braak staging system (Lewy body pathology in distinct brain areas) and postmortem interval (PMI) are indicated, with no significant differences between age at death and PMI between control and iPD cases
| Sex | Age at death | Braak stage | PMI (h) | |
| Control | M | 95 | 0 | 5.3 |
| Control | F | 97 | 0 | 6.0 |
| Control | M | 97 | 0 | 5.8 |
| Control | M | 93 | 0 | 4.5 |
| iPD | F | 93 | 6 | 6.0 |
| iPD | M | 95 | 6 | 6.3 |
| iPD | F | 96 | 6 | 6.8 |
| iPD | F | 93 | 6 | 2.4 |
Table 2
Summary of PLA conditions employed on human brain sections. The conditions shown (antigen retrieval procedure, blocking solution, primary antibody dilutions, PLA reaction amplification time) were employed on 2–4 control and 2–4 iPD human brain sections (striatum and substantia nigra) for each condition
| Antigen retrieval | Blocking solution | 1° Ab dilutions | Amplification time |
| Citrate buffer (pH 6.0) | Donkey Serum | 1:500 each | 100 min, 37°C |
| high temperature (95°C) | 1 h, RT | ||
| Citrate buffer (pH 6.0) | Donkey Serum | 1:500 each | 100 min, 37°C |
| high pressure | 1 h, RT | ||
| Citrate buffer (pH 6.0) | Donkey Serum | 1:500 each | 130 min, 37°C |
| high temperature (95°C) | 1 h, RT | ||
| Citrate buffer (pH 6.0) | Donkey Serum | 1:500 each | 130 min, 37°C |
| high pressure | 1 h, RT | ||
| Citrate buffer (pH 6.0) | Donkey Serum | 1:200 each | 130 min, 37°C |
| high pressure | 1 h, RT | ||
| Citrate buffer (pH 6.0) | Duolink Blocking | 1:200 each | 130 min, 37°C |
| high pressure | 30 min, 37°C | ||
| Citrate buffer (pH 7.0) | Donkey Serum | 1:100 each | 130 min, 37°C |
| high pressure | 1 h, RT | ||
| Citrate buffer (pH 6.0) | Donkey Serum | 1:100 each | 130 min, 37°C |
| high pressure | 1 h, RT | ||
| Citrate buffer (pH 6.0) | Donkey Serum | 1:50 each | 130 min, 37°C |
| high pressure | 1 h, RT | ||
| – | Donkey Serum | 1:500 each | 130 min, 37°C |
| 1 h, RT |
Parallel PLA assays were performed on inducible HEK cells overexpressing WT and G2019S LRRK2 to assure that the assay per se was working. The penultimate condition is described in detail in the Materials and Methods section. The last condition was exactly as described by Keeney et al. (2021) [23]. Representative images for the last two conditions are shown in Fig. 9.
DISCUSSION
Understanding the activation state of LRRK2 is important for subsequent measurements of target engagement in clinical efforts to target this kinase, as well as in understanding the fundamental biology of the protein. Here, we attempted to replicate several prior studies that have used different approaches to measure LRRK2 activation including at the endogenous level. We find that several methods can be validated to measure LRRK2 activity but with caveats that may limit interpretation of results. Additional methods, particularly for endogenous kinase detection, are likely to be required to be able to reliably identify cellular sources of LRRK2 activity in complex tissues.
It is known that LRRK2 is involved in at least three independent phosphorylation events; phosphorylation of LRRK2 by other kinases including at a cluster of sites around S910, S935 and other residues [16, 33]; autophosphorylation at S1292 [17]; and LRRK2-dependent phosphorylation of downstream targets, including RAB proteins [18, 21]. The latter two events appear to have low stoichiometry, making detection difficult, especially at endogenous levels. We therefore focused on replicating published methods for LRRK2 autophosphorylation and RAB phosphorylation with a specific and systematic approach aimed at testing available and validated antibodies by western blotting, immunocytochemistry and PLA approaches in distinct cell lines and tissues under overexpression as well as endogenous conditions (Tables 3 and 4).
Table 3
Detection of LRRK2 kinase activity in different cells and tissues. Three techniques (western blotting, immunocytochemistry, PLA) were employed to detect levels/localization of LRRK2 and RAB10, and LRRK2 kinase activity by using either pS1292-LRRK2 and pT73-RAB10 antibodies or by PLA (using pS1292-LRRK2 and LRRK2 (N241A/34) antibodies). Able (+) or not able (–) to detect MLi-2-sensitive LRRK2 kinase activity. N.A., not analyzed
| Cell types/tissues | Western blotting | Immunocytochemistry | PLA |
| HEK293T (wt and mutant GFP-LRRK2 overexpression) | + pS1292-LRRK2 | – pS1292-LRRK2 | + G2019S-LRRK2 |
| + LRRK2 (N241/34) | + LRRK2 (N241/34) | ||
| + LRRK2 (UDD3) | + LRRK2 (UDD3) | ||
| + pS935-LRRK2 | + pT73-RAB10 | ||
| + pT73-RAB10 | + RAB10 | ||
| + RAB10 | |||
| MEF (endogenous wt and R1441C LRRK2) | + LRRK2 (N241/34) | – pS1292-LRRK2 | + R1441C-LRRK2 |
| + pS935-LRRK2 | + pT73-RAB10 | ||
| + pT73-RAB10 | |||
| + RAB10 | |||
| LCL (endogenous wt and G2019S LRRK2) | + LRRK2 (N241/34) | – pS1292-LRRK2 | + G2019S-LRRK2 |
| + pS935-LRRK2 | + pT73-RAB10 | ||
| + pT73-RAB10 | |||
| + RAB10 | |||
| Rat brain (HdAD5-flag-G2019S-LRRK2 overexpression) | N.A. | + flag (LRRK2) | – |
| Human brain (healthy control and iPD) | N.A. | N.A. | – |
Table 4
Antibodies employed for western, immunocytochemistry (ICC) and PLA assays. For experimental details see Materials and Methods
| List of antibodies employed | |
| pS1292-LRRK2 (Abcam, ab203181) | Western, ICC, PLA |
| pS935-LRRK2 (Abcam, ab133450) | Western |
| LRRK2 (N241A/34, UC Davies/NIH NeuroMab, 75–253) | Western, ICC, PLA |
| LRRK2 (UDD3, Abcam, ab133518) | ICC |
| pT73-RAB10 (Abcam, ab241060) | ICC |
| pT73-RAB10 (MRC PPU, S873D) | ICC |
| pT73-RAB10 (Abcam, ab230261) | Western |
| RAB10 (Sigma, SAB5300028) | Western, ICC |
Detection of pS1292-LRRK2 by western blot generally appears to most directly reflect kinase activity and inhibition. In the context of LRRK2 overexpression, all tested mutations increase pS1292-LRRK2 and this is blocked by addition of MLi-2 or other inhibitors [17, 35, 36, 47]. Endogenous pS1292-LRRK2 can be detected at least in the context of tissues that express high levels of LRRK2 such as kidney, lung and brain [35]. Importantly, the endogenous G2019S LRRK2 mutation in the mouse genome enhances this activity and this can be blocked by MLi-2. Despite these indications that pS1292-LRRK2 can track with mutation and inhibitor exposure, there are two limitations. The first is that the identification of reliable signals with the currently available rabbit monoclonal antibody can vary between laboratories. Our collective experience is that lab protocols can determine whether pS1292-LRRK2 is detectable, especially endogenously with WT LRRK2. Additionally, the use of western blot precludes cellular resolution of activity within tissues.
To overcome this second limitation, we attempted to use PLA, as this technique has recently been suggested to be able to measure pS1292-LRRK2 in dopaminergic neurons in vivo. This technology requires antibodies to work under specific conditions compatible with immunocytochemistry, and the suitability of the pS1292-LRRK2 and total LRRK2 antibodies were independently evaluated under both endogenous and overexpression conditions. We were able to detect the activation of G2019S LRRK2 relative to WT in the context of overexpression only when specific PLA reagents were used; PLA signal was only observed with Duolink In Situ Reagents Red (DUO92008, Sigma), but not with Duolink In Situ Reagents Green (DUO02014, Sigma). However, other mutations did not increase pS1292-LRRK2 PLA in the same situation, which was not simply the result of a limited ability of the N241A/34 antibody to bind to microtubule-bound LRRK2. Furthermore, we did not reliably identify PLA signal with endogenous WT LRRK2 that could be inhibited by MLi-2. We could not identify a reliable PLA signal in human brain, including PD cases, and did not identify any oxidative-stress induced change in pS1292-LRRK2 using western blotting, in contrast to prior experiments [22, 23].
In similar manner, pT73-RAB10 can be used as a readout of kinase activity in specific settings but does not appear to universally reflect expected outcomes. In MEFs, where pRABs were first identified as substrates for LRRK2 [18], the R1441C LRRK2 mutation induces robust increases in pT73-RAB10 that can be blocked by MLi-2. However, in human LCLs, the endogenous G2019S LRRK2 mutation does not increase pT73-RAB10. Interestingly, this is consistent with prior results showing a relatively modest effect of this mutation in neutrophils compared to other mutations [54], suggesting that the lack of effect is related to mutation rather than technical limitations. A recent investigation suggests that pT73-RAB10 does not increase with G2019S LRRK2 knockin in mouse brain tissue while effects of pS1292-LRRK2 were more pronounced in G2019S than R1441C LRRK2 knockin [55]. We have also recently shown that pS106-RAB12 may better reflect LRRK2 activity and inhibition in the brain [56]. Thus, and depending on tissue type and mutation, different pRABs may have utility in estimating LRRK2 activity.
Conclusion
Collectively, our results show that detection of endogenous LRRK2 activity can be difficult and that critical controls, especially treatment with kinase inhibitors, are required to confirm authentic activity as measured using distinct methods. We were not able to provide a comprehensive way to measure LRRK2 that will work in all contexts, and human brain measurements at a cellular resolution remain extremely challenging. Further development of additional reagents to measure LRRK2 in situ should be supported to address this problem.
ACKNOWLEDGMENTS
This research was supported in part by the Intramural Research Program of the NIH, National Institute on Aging and by NIH NINDS grants R01 NS064934 and P50NS108675 (to A.B.W.), the Alexander and Eva Nemeth Foundation and MJFF grant (17358) (to R.J.N. and T.J.M.), MJFF grants (12753 and 18287) (to D.J.M.), MJFF grant (10255.02) (to S.H. and M.C.C.H.) and Intramural Funds from Rutgers University (to S.H.).
CONFLICT OF INTEREST
The authors have no conflict of interest to report.
SUPPLEMENTARY MATERIAL
[1] The supplementary material is available in the electronic version of this article: https://dx.doi.org/10.3233/JPD-213128.
REFERENCES
[1] | Funayama M , Hasegawa K , Kowa H , Saito M , Tsuji S , Obata F ((2002) ) A new locus for Parkinson’s disease (PARK8) maps to chromosome 12p11.2-q13.1. Ann Neurol 51: , 296–301. |
[2] | Paisan-Ruiz C , Jain S , Evans EW , Gilks WP , Simon J , van der Brug M , Lopez de Munain A , Aparicio S , Gil AM , Khan N , Johnson J , Martinez JR , Nicholl D , Marti Carrera I , Pena AS , de Silva R , Lees A , Marti-Masso JF , Perez-Tur J , Wood NW , Singleton AB ((2004) ) Cloning of the gene containing mutations that cause PARK8-linked Parkinson’s disease. Neuron 44: , 595–600. |
[3] | Zimprich A , Biskup S , Leitner P , Lichtner P , Farrer M , Lincoln S , Kachergus J , Hulihan M , Uitti RJ , Calne DB , Stoessl AJ , Pfeiffer RF , Patenge N , Carbajal IC , Vieregge P , Asmus F , Müller-Myhsok B , Dickson DW , Meitinger T , Strom TM , Wszolek ZK , Gasser T ((2004) ) Mutations in LRRK2 cause autosomal-dominant parkinsonism with pleomorphic pathology. Neuron 44: , 601–607. |
[4] | Funayama M , Hasegawa K , Ohta E , Kawashima N , Komiyama M , Kowa H , Tsuji S , Obata F ((2005) ) An LRRK2 mutation as a cause for the parkinsonism in the original PARK8 family. Ann Neurol 57: , 918–921. |
[5] | Gilks WP , Abou-Sleiman PM , Gandhi S , Jain S , Singleton A , Lees AJ , Shaw K , Bhatia KP , Bonifati V , Quinn NP , Lynch J , Healy DG , Holton JL , Revesz T , Wood NW ((2005) ) A common LRRK2 mutation in idiopathic Parkinson’s disease. Lancet 365: , 415–416. |
[6] | Lee AJ , Wang Y , Alcalay RN , Mejia-Santana H , Saunders-Pullman R , Bressman S , Corvol JC , Brice A , Lesage S , Mangone G , Tolosa E , Pont-Sunyer C , Vilas D , Schule B , Kausar F , Foroud T , Berg D , Brockmann K , Goldwurm S , Siri C , Asselta R , Ruiz-Martinez J , Mondragon E , Marras C , Ghate T , Giladi N , Mirelman A , Marder K , Michael JFLCC ((2017) ) Penetrance estimate of LRRK2 p.G2019S mutation in individuals of non-Ashkenazi Jewish ancestry. Mov Disord 32: , 1432–1438. |
[7] | Nalls MA , Blauwendraat C , Vallerga CL , Heilbron K , Bandres-Ciga S , Chang D , Tan M , Kia DA , Noyce AJ , Xue A , Bras J , Young E , von Coelln R , Simón-Sánchez J , Schulte C , Sharma M , Krohn L , Pihlstrøm L , Siitonen A , Iwaki H , Leonard H , Faghri F , Gibbs JR , Hernandez DG , Scholz SW , Botia JA , Martinez M , Corvol JC , Lesage S , Jankovic J , Shulman LM , Sutherland M , Tienari P , Majamaa K , Toft M , Andreassen OA , Bangale T , Brice A , Yang J , Gan-Or Z , Gasser T , Heutink P , Shulman JM , Wood NW , Hinds DA , Hardy JA , Morris HR , Gratten J , Visscher PM , Graham RR , Singleton AB ; 23andMe Research Team; System Genomics of Parkinson’s Disease Consortium; International Parkinson’s Disease Genomics Consortium ((2019) ) Identification of novel risk loci, causal insights, and heritable risk for Parkinson’s disease: A meta-analysis of genome-wide association studies. Lancet Neurol 18: , 1091–1102. |
[8] | Singleton A , Hardy J ((2011) ) A generalizable hypothesis for the genetic architecture of disease: Pleomorphic risk loci. Hum Mol Genet 20: , R158–R162. |
[9] | Cookson MR ((2010) ) The role of leucine-rich repeat kinase 2 (LRRK2) in Parkinson’s disease. Nat Rev Neurosci 11: , 791–797. |
[10] | Blauwendraat C , Reed X , Kia DA , Gan-Or Z , Lesage S , Pihlstrom L , Guerreiro R , Gibbs JR , Sabir M , Ahmed S , Ding J , Alcalay RN , Hassin-Baer S , Pittman AM , Brooks J , Edsall C , Hernandez DG , Chung SJ , Goldwurm S , Toft M , Schulte C , Bras J , Wood NW , Brice A , Morris HR , Scholz SW , Nalls MA , Singleton AB , Cookson MR , COURAGE-PD (Comprehensive Unbiased Risk Factor Assessment for Genetics and Environment in Parkinson’s Disease) Consortium, the French Parkinson’s Disease Consortium, and the International Parkinson’s Disease Genomics Consortium (IPDGC) ((2018) ) Frequency of loss of function variants in LRRK2 in Parkinson disease. JAMA Neurol 75: , 1416–1422. |
[11] | West AB ((2015) ) Ten years and counting: Moving leucine-rich repeat kinase 2 inhibitors to the clinic. Mov Disord 30: , 180–189. |
[12] | Daher JP , Abdelmotilib HA , Hu X , Volpicelli-Daley LA , Moehle MS , Fraser KB , Needle E , Chen Y , Steyn SJ , Galatsis P , Hirst WD , West AB ((2015) ) Leucine-rich repeat kinase 2 (LRRK2) pharmacological inhibition abates alpha-synuclein gene-induced neurodegeneration. J Biol Chem 290: , 19433–19444. |
[13] | Volpicelli-Daley LA , Abdelmotilib H , Liu Z , Stoyka L , Daher JP , Milnerwood AJ , Unni VK , Hirst WD , Yue Z , Zhao HT , Fraser K , Kennedy RE , West AB ((2016) ) G2019S-LRRK2 expression augments alpha-synuclein sequestration into inclusions in neurons. J Neurosci 36: , 7415–7427. |
[14] | Baptista MAS , Merchant K , Barrett T , Bhargava S , Bryce DK , Ellis JM , Estrada AA , Fell MJ , Fiske BK , Fuji RN , Galatsis P , Henry AG , Hill S , Hirst W , Houle C , Kennedy ME , Liu X , Maddess ML , Markgraf C , Mei H , Meier WA , Needle E , Ploch S , Royer C , Rudolph K , Sharma AK , Stepan A , Steyn S , Trost C , Yin Z , Yu H , Wang X , Sherer TB ((2020) ) LRRK2 inhibitors induce reversible changes in nonhuman primate lungs without measurable pulmonary deficits. Sci Transl Med 12: , eaav0820. |
[15] | Dzamko N , Inesta-Vaquera F , Zhang J , Xie C , Cai H , Arthur S , Tan L , Choi H , Gray N , Cohen P , Pedrioli P , Clark K , Alessi DR ((2012) ) The IkappaB kinase family phosphorylates the Parkinson’s disease kinase LRRK2 at Ser935 and Ser910 during Toll-like receptor signaling. PLoS One 7: , e39132. |
[16] | Chia R , Haddock S , Beilina A , Rudenko IN , Mamais A , Kaganovich A , Li Y , Kumaran R , Nalls MA , Cookson MR ((2014) ) Phosphorylation of LRRK2 by casein kinase 1alpha regulates trans-Golgi clustering via differential interaction with ARHGEF7. Nat Commun 5: , 5827. |
[17] | Sheng Z , Zhang S , Bustos D , Kleinheinz T , Le Pichon CE , Dominguez SL , Solanoy HO , Drummond J , Zhang X , Ding X , Cai F , Song Q , Li X , Yue Z , van der Brug MP , Burdick DJ , Gunzner-Toste J , Chen H , Liu X , Estrada AA , Sweeney ZK , Scearce-Levie K , Moffat JG , Kirkpatrick DS , Zhu H ((2012) ) Ser1292 autophosphorylation is an indicator of LRRK2 kinase activity and contributes to the cellular effects of PD mutations. Sci Transl Med 4: , 164ra161. |
[18] | Steger M , Tonelli F , Ito G , Davies P , Trost M , Vetter M , Wachter S , Lorentzen E , Duddy G , Wilson S , Baptista MA , Fiske BK , Fell MJ , Morrow JA , Reith AD , Alessi DR , Mann M ((2016) ) Phosphoproteomics reveals that Parkinson’s disease kinase LRRK2 regulates a subset of Rab GTPases. Elife 5: , e12813. |
[19] | Lara Ordonez AJ , Fernandez B , Fdez E , Romo-Lozano M , Madero-Perez J , Lobbestael E , Baekelandt V , Aiastui A , Lopez de Munain A , Melrose HL , Civiero L , Hilfiker S ((2019) ) RAB8, RAB10 and RILPL1 contribute to both LRRK2 kinase-mediated centrosomal cohesion and ciliogenesis deficits. Hum Mol Genet 28: , 3552–3568. |
[20] | Fernandez B , Lara Ordonez AJ , Fdez E , Mutez E , Comptdaer T , Leghay C , Kreisler A , Simonin C , Vandewynckel L , Defebvre L , Destee A , Bleuse S , Taymans JM , Chartier-Harlin MC , Hilfiker S ((2019) ) Centrosomal cohesion deficits as cellular biomarker in lymphoblastoid cell lines from LRRK2 Parkinson’s disease patients. Biochem J 476: , 2797–2813. |
[21] | Steger M , Diez F , Dhekne HS , Lis P , Nirujogi RS , Karayel O , Tonelli F , Martinez TN , Lorentzen E , Pfeffer SR , Alessi DR , Mann M ((2017) ) Systematic proteomic analysis of LRRK2-mediated Rab GTPase phosphorylation establishes a connection to ciliogenesis. Elife 6: , e31012. |
[22] | Di Maio R , Hoffman EK , Rocha EM , Keeney MT , Sanders LH , De Miranda BR , Zharikov A , Van Laar A , Stepan AF , Lanz TA , Kofler JK , Burton EA , Alessi DR , Hastings TG , Greenamyre JT ((2018) ) LRRK2 activation in idiopathic Parkinson’s disease. Sci Transl Med 10: , eaar5429. |
[23] | Keeney MT , Hoffman EK , Greenamyre TJ , Di Maio R ((2021) ) Measurement of LRRK2 kinase activity by proximity ligation assay. Bio Protoc 11: , e4140. |
[24] | Liu Z , Bryant N , Kumaran R , Beilina A , Abeliovich A , Cookson MR , West AB ((2018) ) LRRK2 phosphorylates membrane-bound Rabs and is activated by GTP-bound Rab7L1 to promote recruitment to the trans-Golgi network. Hum Mol Genet 27: , 385–395. |
[25] | Smith WW , Pei Z , Jiang H , Dawson VL , Dawson TM , Ross CA ((2006) ) Kinase activity of mutant LRRK2 mediates neuronal toxicity. Nat Neurosci 9: , 1231–1233. |
[26] | Jumper J , Evans R , Pritzel A , Green T , Figurnov M , Ronneberger O , Tunyasuvunakool K , Bates R , Zidek A , Potapenko A , Bridgland A , Meyer C , Kohl SAA , Ballard AJ , Cowie A , Romera-Paredes B , Nikolov S , Jain R , Adler J , Back T , Petersen S , Reiman D , Clancy E , Zielinski M , Steinegger M , Pacholska M , Berghammer T , Bodenstein S , Silver D , Vinyals O , Senior AW , Kavukcuoglu K , Kohli P , Hassabis D ((2021) ) Highly accurate protein structure prediction with AlphaFold. Nature 596: , 583–589. |
[27] | Zardecki C , Dutta S , Goodsell DS , Lowe R , Voigt M , Burley SK ((2022) ) PDB-101: Educational resources supporting molecular explorations through biology and medicine. Protein Sci 31: , 129–140. |
[28] | Deniston CK , Salogiannis J , Mathea S , Snead DM , Lahiri I , Matyszewski M , Donosa O , Watanabe R , Bohning J , Shiau AK , Knapp S , Villa E , Reck-Peterson SL , Leschziner AE ((2020) ) Structure of LRRK2 in Parkinson’s disease and model for microtubule interaction. Nature 588: , 344–349. |
[29] | Krissinel E , Henrick K ((2007) ) Inference of macromolecular assemblies from crystalline state. J Mol Biol 372: , 774–797. |
[30] | Myasnikov A , Zhu H , Hixson P , Xie B , Yu K , Pitre A , Peng J , Sun J ((2021) ) Structural analysis of the full-length human LRRK2. Cell 184: , 3519–3527 e3510. |
[31] | Davies P , Hinkle KM , Sukar NN , Sepulveda B , Mesias R , Serrano G , Alessi DR , Beach TG , Benson DL , White CL , Cowell RM , Das SS , West AB , Melrose HL ((2013) ) Comprehensive characterization and optimization of anti-LRRK2 (leucine-rich repeat kinase 2) monoclonal antibodies. Biochem J 453: , 101–113. |
[32] | Pettersen EF , Goddard TD , Huang CC , Couch GS , Greenblatt DM , Meng EC , Ferrin TE ((2004) ) UCSF Chimera–a visualization system for exploratory research and analysis. J Comput Chem 25: , 1605–1612. |
[33] | Nichols RJ , Dzamko N , Morrice NA , Campbell DG , Deak M , Ordureau A , Macartney T , Tong Y , Shen J , Prescott AR , Alessi DR ((2010) ) 14-3-3 binding to LRRK2 is disrupted by multiple Parkinson’s disease-associated mutations and regulates cytoplasmic localization. Biochem J 430: , 393–404. |
[34] | Civiero L , Cogo S , Kiekens A , Morganti C , Tessari I , Lobbestael E , Baekelandt V , Taymans JM , Chartier-Harlin MC , Franchin C , Arrigoni G , Lewis PA , Piccoli G , Bubacco L , Cookson MR , Pinton P , Greggio E ((2017) ) PAK6 phosphorylates 14-3-3γ to regulate steady state phosphorylation of LRRK2. Front Mol Neurosci 10: , 417. |
[35] | Kluss JH , Conti MM , Kaganovich A , Beilina A , Melrose HL , Cookson MR , Mamais A ((2018) ) Detection of endogenous S1292 LRRK2 autophosphorylation in mouse tissue as a readout for kinase activity. NPJ Parkinsons Dis 4: , 13. |
[36] | Wang S , Liu Z , Ye T , Mabrouk OS , Maltbie T , Aasly J , West AB ((2017) ) Elevated LRRK2 autophosphorylation in brain-derived and peripheral exosomes in LRRK2 mutation carriers. Acta Neuropathol Commun 5: , 86. |
[37] | Kett LR , Boassa D , Ho CC , Rideout HJ , Hu J , Terada M , Ellisman M , Dauer WT ((2012) ) LRRK2 Parkinson disease mutations enhance its microtubule association. Hum Mol Genet 21: , 890–899. |
[38] | Blanca Ramírez M , Lara Ordóñez AJ , Fdez E , Madero-Pérez J , Gonnelli A , Drouyer M , Chartier-Harlin MC , Taymans JM , Bubacco L , Greggio E , Hilfiker S ((2017) ) GTP binding regulates cellular localization of Parkinson’s disease-associated LRRK2. Hum Mol Genet 26: , 2747–2767. |
[39] | Watanabe R , Buschauer R , Böhning J , Audagnotto M , Lasker K , Lu TW , Boassa D , Taylor S , Villa E ((2020) ) The in situ structure of Parkinson’s disease-linked LRRK2. Cell 182: , 1508–1518.e1516. |
[40] | Stormo AED , Shavarebi F , FitzGibbon M , Earley EM , Ahrendt H , Lum LS , Verschueren E , Swaney DL , Skibinski G , Ravisankar A , van Haren J , Davis EJ , Johnson JR , Von Dollen J , Balen C , Porath J , Crosio C , Mirescu C , Iaccarino C , Dauer WT , Nichols RJ , Wittmann T , Cox TC , Finkbeiner S , Krogan NJ , Oakes SA , Hiniker A ((2022) ) The E3 ligase TRIM1 ubiquitinates LRRK2 and controls its localization, degradation, and toxicity. J Cell Biol 221: , e202010065. |
[41] | Schreij AM , Chaineau M , Ruan W , Lin S , Barker PA , Fon EA , McPherson PS ((2015) ) LRRK2 localizes to endosomes and interacts with clathrin-light chains to limit Rac1 activation. EMBO Rep 16: , 79–86. |
[42] | Li X , Moore DJ , Xiong Y , Dawson TM , Dawson VL ((2010) ) Reevaluation of phosphorylation sites in the Parkinson disease-associated leucine-rich repeat kinase 2. J Biol Chem 285: , 29569–29576. |
[43] | Yang D , Li T , Liu Z , Arbez N , Yan J , Moran TH , Ross CA , Smith WW ((2012) ) LRRK2 kinase activity mediates toxic interactions between genetic mutation and oxidative stress in a Drosophila model: Suppression by curcumin. Neurobiol Dis 47: , 385–392. |
[44] | Deshpande P , Flinkman D , Hong Y , Goltseva E , Siino V , Sun L , Peltonen S , Elo LL , Kaasinen V , James P , Coffey ET ((2020) ) Protein synthesis is suppressed in sporadic and familial Parkinson’s disease by LRRK2. FASEB J 34: , 14217–14233. |
[45] | Ho DH , Nam D , Seo MK , Park SW , Seol W , Son I ((2021) ) LRRK2 kinase inhibitor rejuvenates oxidative stress-induced cellular senescence in neuronal cells. Oxid Med Cell Longev 2021: , 9969842. |
[46] | Kalogeropulou AF , Freemantle JB , Lis P , Vides EG , Polinski NK , Alessi DR ((2020) ) Endogenous Rab29 does not impact basal or stimulated LRRK2 pathway activity. Biochem J 477: , 4397–4423. |
[47] | Purlyte E , Dhekne HS , Sarhan AR , Gomez R , Lis P , Wightman M , Martinez TN , Tonelli F , Pfeffer SR , Alessi DR ((2018) ) Rab29 activation of the Parkinson’s disease-associated LRRK2 kinase. EMBO J 37: , 1–18. |
[48] | Nirujogi RS , Tonelli F , Taylor M , Lis P , Zimprich A , Sammler E , Alessi DR ((2021) ) Development of a multiplexed targeted mass spectrometry assay for LRRK2-phosphorylated Rabs and Ser910/Ser935 biomarker sites. Biochem J 478: , 299–326. |
[49] | Mir R , Tonelli F , Lis P , Macartney T , Polinski NK , Martinez TN , Chou MY , Howden AJM , Konig T , Hotzy C , Milenkovic I , Brucke T , Zimprich A , Sammler E , Alessi DR ((2018) ) The Parkinson’s disease VPS35[D620N] mutation enhances LRRK2-mediated Rab protein phosphorylation in mouse and human. Biochem J 475: , 1861–1883. |
[50] | Dhekne HS , Yanatori I , Gomez RC , Tonelli F , Diez F , Schule B , Steger M , Alessi DR , Pfeffer SR ((2018) ) A pathway for Parkinson’s Disease LRRK2 kinase to block primary cilia and Sonic hedgehog signaling in the brain. Elife 7: , e40202. |
[51] | West AB , Cowell RM , Daher JP , Moehle MS , Hinkle KM , Melrose HL , Standaert DG , Volpicelli-Daley LA ((2014) ) Differential LRRK2 expression in the cortex, striatum, and substantia nigra in transgenic and nontransgenic rodents. J Comp Neurol 522: , 2465–2480. |
[52] | Dusonchet J , Kochubey O , Stafa K , Young SM Jr. , Zufferey R , Moore DJ , Schneider BL , Aebischer P ((2011) ) A rat model of progressive nigral neurodegeneration induced by the Parkinson’s disease-associated G2019S mutation in LRRK2. J Neurosci 31: , 907–912. |
[53] | Nguyen APT , Tsika E , Kelly K , Levine N , Chen X , West AB , Boularand S , Barneoud P , Moore DJ ((2020) ) Dopaminergic neurodegeneration induced by Parkinson’s disease-linked G2019S LRRK2 is dependent on kinase and GTPase activity. Proc Natl Acad Sci U S A 117: , 17296–17307. |
[54] | Fan Y , Howden AJM , Sarhan AR , Lis P , Ito G , Martinez TN , Brockmann K , Gasser T , Alessi DR , Sammler EM ((2018) ) Interrogating Parkinson’s disease LRRK2 kinase pathway activity by assessing Rab10 phosphorylation in human neutrophils. Biochem J 475: , 23–44. |
[55] | Iannotta L , Biosa A , Kluss JH , Tombesi G , Kaganovich A , Cogo S , Plotegher N , Civiero L , Lobbestael E , Baekelandt V , Cookson MR , Greggio E ((2020) ) Divergent effects of G2019S and R1441C LRRK2 mutations on LRRK2 and Rab10 phosphorylations in mouse tissues. Cells 9: , 2344. |
[56] | Kluss JH , Mazza MC , Li Y , Manzoni C , Lewis PA , Cookson MR , Mamais A ((2021) ) Preclinical modeling of chronic inhibition of the Parkinson’s disease associated kinase LRRK2 reveals altered function of the endolysosomal system in vivo. Mol Neurodegener 16: , 17. |


