
Opportunities in the use of Very Cold Neutrons in reflectometry techniques
Abstract
Reflectometry techniques are especially suited for time-of-flight measurements. The use of longer wavelengths does not modify the physics probed during a reflectivity measurement. Besides, reflectometry measurements are not affected by effects such as multiple scattering or absorption. The use of longer wavelengths would permit to achieve instrumental gains. Indeed, in the scattering plane, the phase space can be used more efficiently by a geometrical factor proportional to
1.Introduction
Neutron reflectometry is a well-established neutron scattering technique used to probe the structure of interfaces at the nanoscale, ranging from 1 to 10–20 nm, in the direction perpendicular to the probed surface. At smaller length scales, the technique is not suitable and often limited by the quality/roughness of the interfaces; for longer length scales, there is usually little physical interest. This range of length scales defines the required instrumental resolution.
Most widely used in neutron reflectometry is the specular reflectivity geometry in which neutrons are measured in the mirror direction with respect to the incident neutron beam. In this geometry, the transfer wave-vector Q is perpendicular to the sample surface (see Fig. 1), and the relation between its modulus, the neutron wavelength and the incidence angle θ is given by:
Neutrons scattered in the incidence plane (blue on Fig. 1) provide in-plane structural information in x direction at very large length scales, typically in the μm range. This scattering geometry is usually referred to as “off-specular” scattering. A scattering signal in the plane perpendicular to the incidence plane (green on Fig. 1) provides in-plane structural information in y direction at short length scales, typically in the nm range, similar to information provided by SANS techniques. This scattering geometry is usually referred to as Grazing Incidence SANS (GISANS).
Fig. 1.
The different scattering geometries in neutron reflectometry techniques.
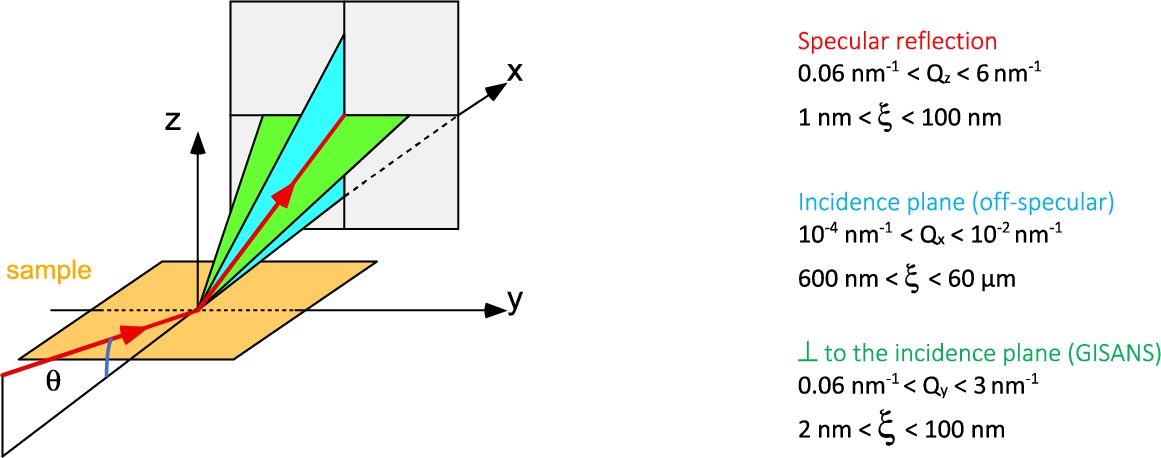
Fig. 2.
(a) Reflectivity of a bare silicon substrate (blue) and of an oxidized silicon substrate (yellow). Reflectivities follow a
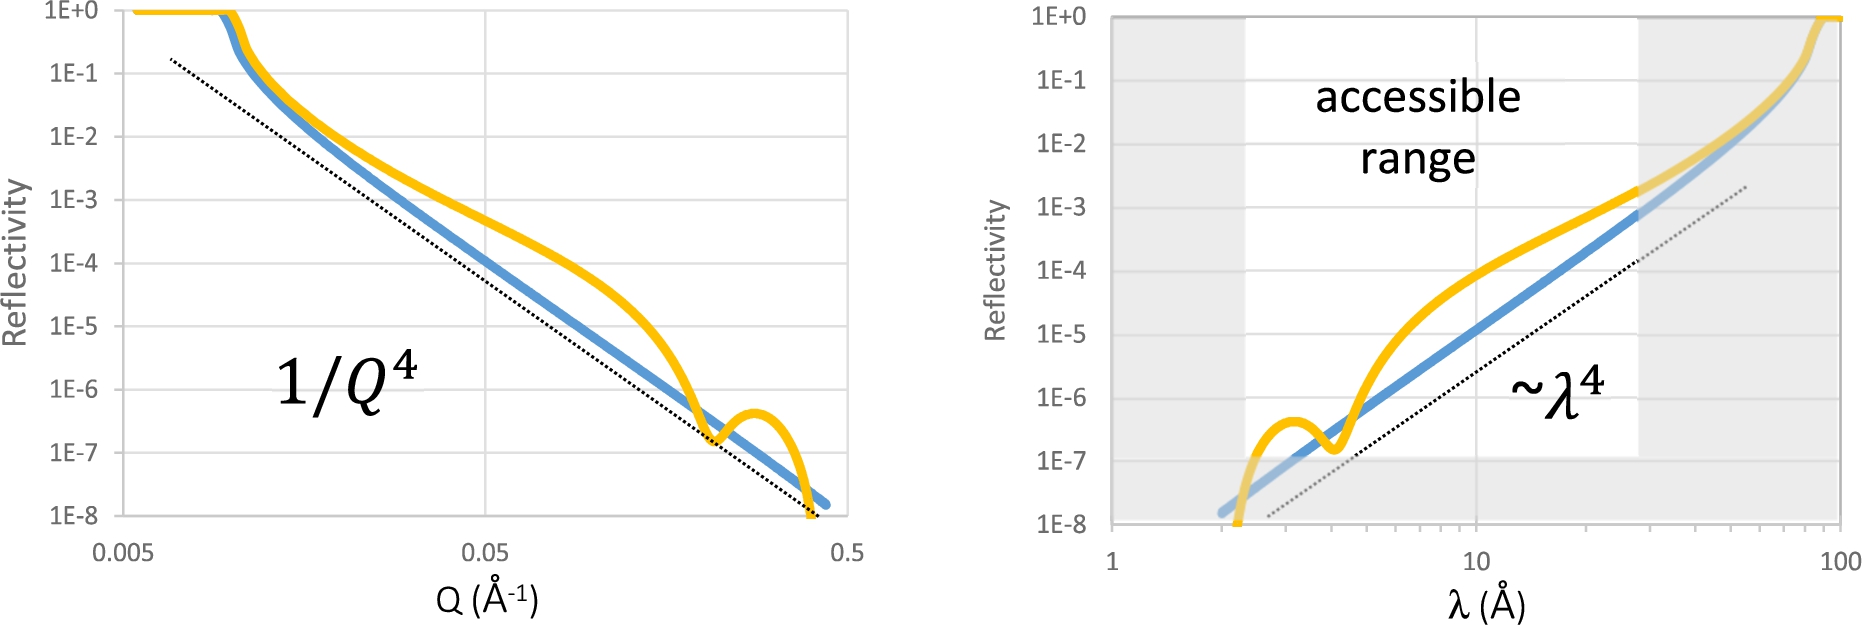
The specular reflectivity off a sample surface follows a general
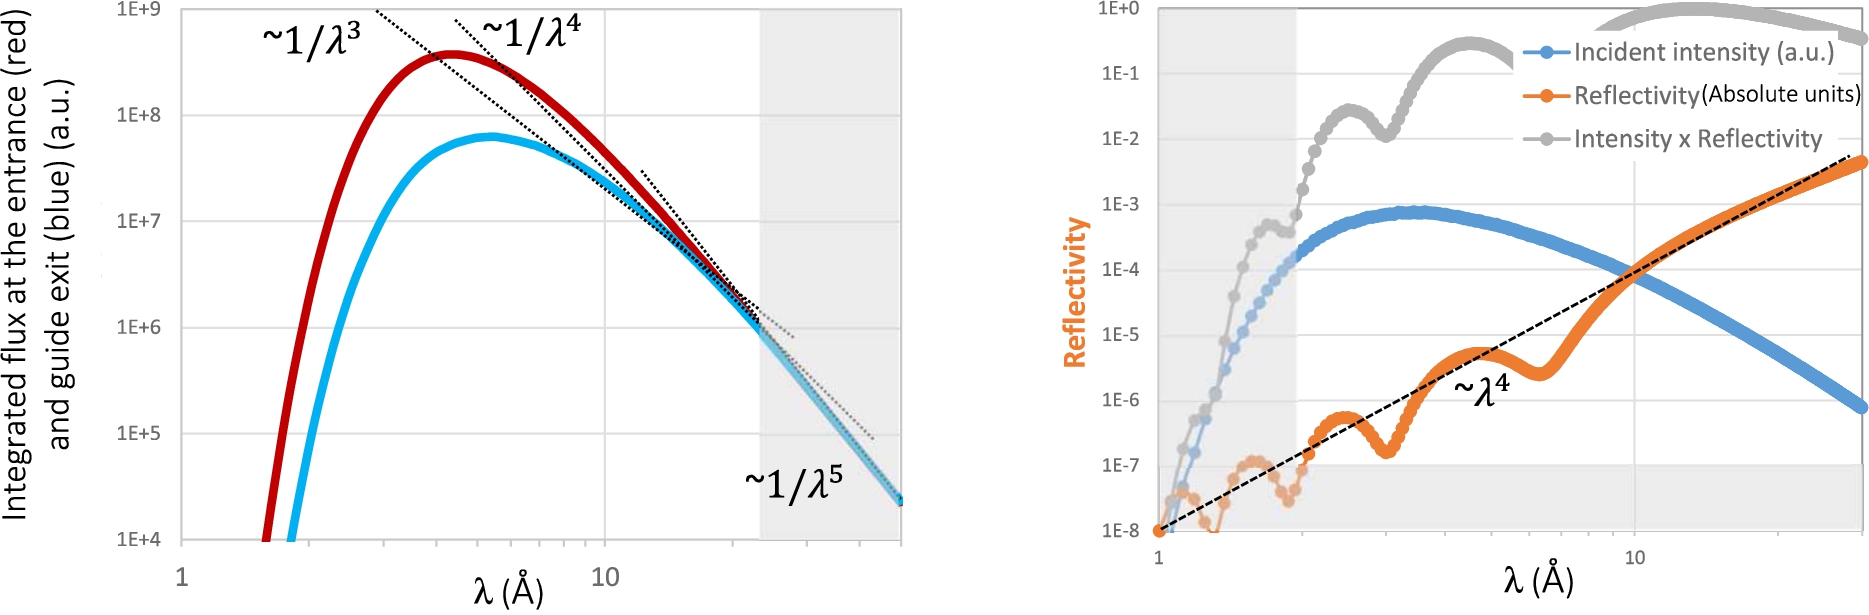
The typical emission spectrum of a cold source is represented on Fig. 3a. After travelling through a few meters of supermirror guides, the intensity distribution is modified as the transport of long wavelengths is more efficient than for shorter wavelengths. As mentioned before, the general trend of sample reflectivities varies as
Fig. 3.
(a) Calculated neutron emission spectrum from a 20 K cold moderator (red curve), and the flux transported by a few meters of typical neutron guide (blue curve). The comparison shows the influence of the increase of solid angle transported by the guide with increasing wavelength. The wavelength dependence follows slopes ranging from
2.Reflectometry using VCN
2.1.Hypothesis
In the following, we make the hypothesis that the cold neutron spectrum is stretched by a factor α corresponding to a change in the effective temperature of the cold source. Hence a typical spectrum extending within
We assume that the samples of interest are similar to the ones currently being probed, that is, with typical sizes in the range of 50–100 mm for soft matter or Langmuir trough samples, and 5–10 mm for magnetic samples. Note that the change of the wavelengths being used does not change the physics being probed in the experiments. We do not aim at changing the typical length scales that are probed nor the experimental resolutions. It does not make sense to try probing shorter length scales (<1 nm) neither longer length scales (>20 nm). The experimental resolution is usually tuned to the best acceptable value maximizing the flux while not masking the physical phenomenon to identify.
2.2.Performance improvements related to geometry on a reflectometer using Very Cold Neutrons
For a given Q-range of interest, if the wavelength spectrum is stretched by a factor α, it involves using incidence angles θ which are α times larger according to Equation (1). Assuming a constant angular resolution,
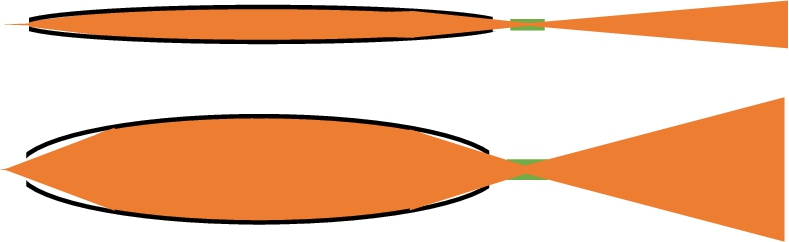
Fig. 4.
(a) and (b): Illumination scheme of large samples with cold (a) and very cold (b) neutrons, leading to equivalent resolution. (c) and (d): Illumination scheme of small samples with cold (c) and very cold (d) neutrons, leading to equivalent resolution. Sample is shown from the side.
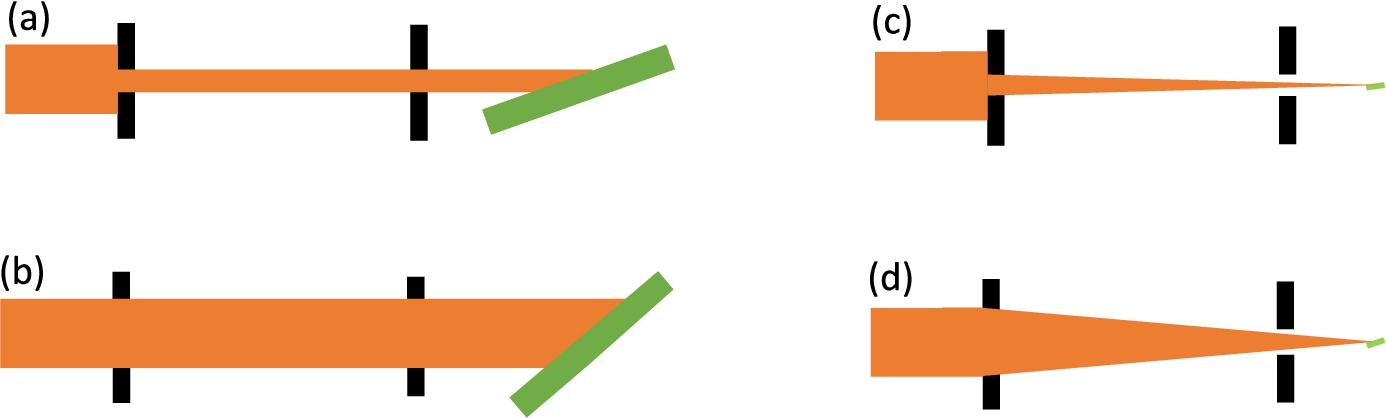
Fig. 5.
If the wavelength spectrum is shifted to longer wavelengths, the focusing optics can be designed to accommodate a large transverse divergence
From this point, one has to consider different experimental situations: (i) the samples are large and under-illuminated or (ii) the samples are small and over-illuminated and define the actual collimation.
Let us first consider the case of a long Langmuir trough (100 mm long) on which incidence angles up to 4° may be used. The sample size height seen by the neutron beam is
Considering next the case of small samples (typ. 1 cm2), the lack of neutrons usually prevents using incidence angles larger than 2°. In such a case, the beam cross section intersected by the sample is
Another geometrical improvement connected to the use of VCN is the improved performances of neutron reflective optics at longer wavelengths. In specular reflectivity experiments, there are no requirements on the incoming beam divergence along the y-direction perpendicular the scattering plane (see Fig. 1). Hence, on most reflectometers, an incoming beam of large width in y-direction is usually used and focussed on the sample using reflective optics. The performances of reflective optics scale as
Note however that when using a much larger transverse divergence, one has to ensure that all neutrons reflected from the sample are collected. Assuming for example an operation with wavelengths up to 60 Å, and
We can underline that absorption effects are usually negligible in reflectivity experiments except in solid – liquid interface studies. There are also no « multiple scattering » issues. The measurement remains as « clean and simple » as before whatever the incident wavelength spectrum.
2.3.The specific case of off-specular scattering and GISANS
In the case of off-specular scattering, in the incidence plane (blue on Fig. 1), the above considerations apply (Section 2.2). In the case of GISANS, which measures scattering in the plane perpendicular to the scattering plane (green on Fig. 1), horizontal focusing may also be used but would require to be tunable to match the desired Q resolution perpendicular to the scattering plane. More generally, any focussing scheme suitable for SANS could be transposed to GISANS. However, GISANS is more efficiently implemented on a dedicated SANS machine where the setup can be optimized to cover a wide Q-range of scattering perpendicular to the scattering plane.
2.4.The issue of the time resolution and pulse structure
The ESS long pulse / low repetition rate is especially suited to low-resolution techniques such as reflectometry. In an optimally designed instrument, most neutrons produced by the source contribute to the measurement without the need to drop or crop pulses, at least for medium or low-resolution measurements.
Let us consider a Time-of-Flight (ToF) reflectometer designed to operate with a bandwidth ranging from
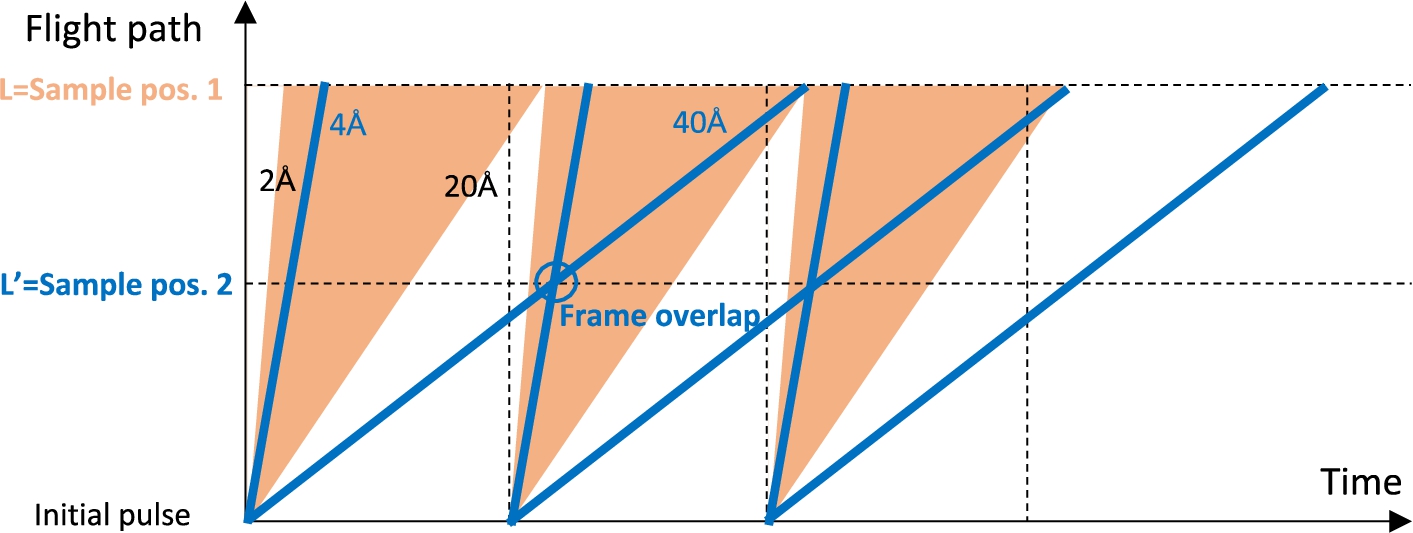
Fig. 6.
Frame overlap issues with very cold neutrons. In orange, the different frames for a bandwidth ranging from
In the specific case of ESS, external constrains hamper this possibility. If one takes the example of the FREIA instrument [1], the flight path from the source to the sample is 25 m. If the wavelength spectrum was stretched by a factor 2, this flight path should be reduced to 12.5 m and if the wavelength spectrum was stretched by a factor 3 it should be reduced to 8 m. This is however constrained by the fact that the target monolith extends up to 6 m from the source and that the common shielding bunker extends up to 15 meters. Note that in the case of a Compact Neutron Source, the target monolith is expected to extend only over 2 m and nothing prevents using flight paths as short as 8 m.
Another possibility to circumvent the limited accessibility in the shielding structures at ESS could be to drop frames and use only
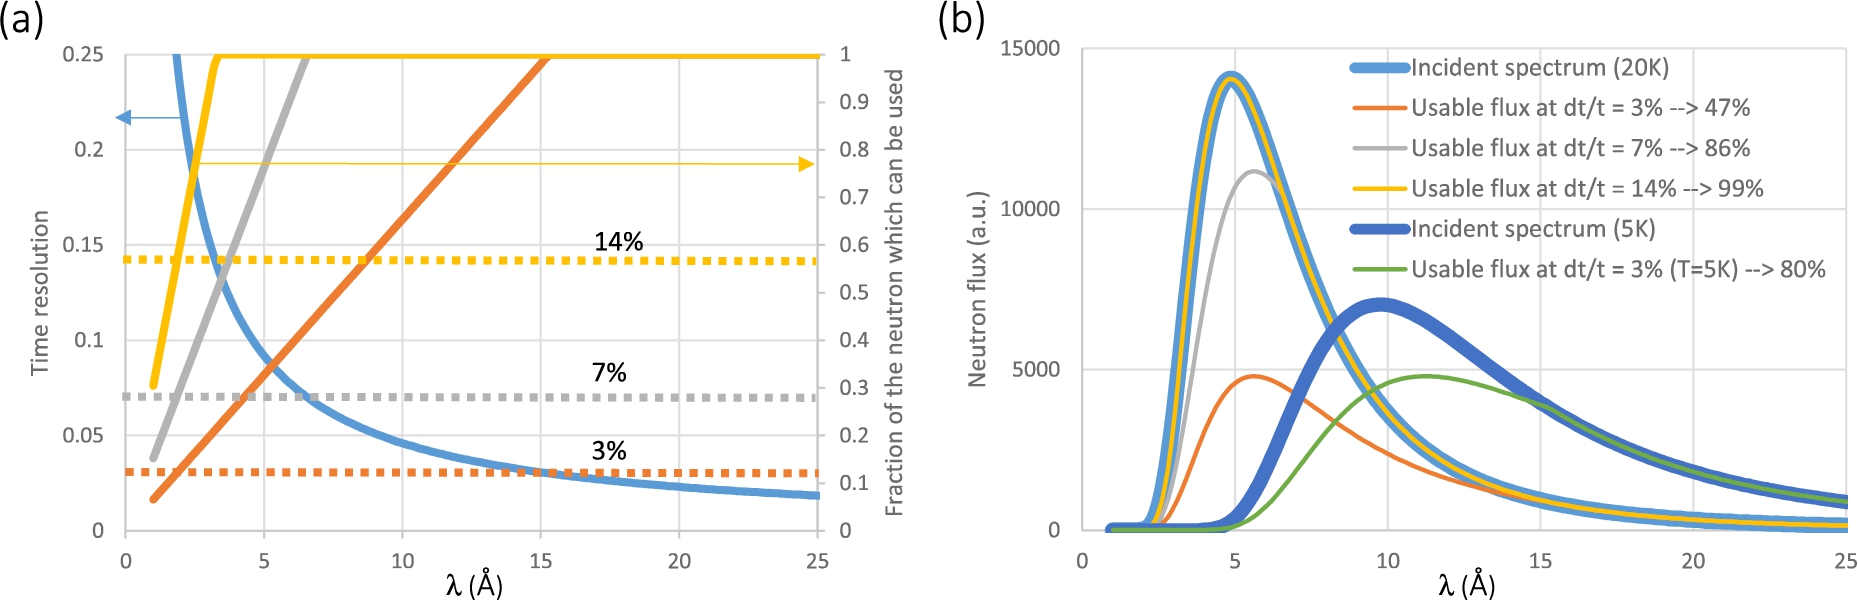
Defining the instrumental resolution by the source intrinsic pulse shape is however not satisfactory as it leads to very low resolutions for short wavelengths. In the case of FREIA, with a source pulse of 2.9 ms and a flight path of 25 m, the “natural” time resolution at a wavelength of 1.8 Å is given by
Figure 7a (solid blue line) shows the “natural” time resolution on the FREIA reflectometer at ESS assuming a flight path of 25 m and a pulse width of 2.9 ms. Note that the total
Note however that the above considerations are only approximate and do not apply to all experimental situations. Nevertheless, they point to the fact that depending on the science case and requirements (small solid sample, large soft matter samples, free liquid surfaces), there are usually ways to optimize a reflectometer settings and design.
Fig. 7.
(a) “Natural” time resolution on the FREIA@ESS reflectometer as defined by the ESS pulse structure (blue). Depending on the aimed time resolution (e.g., 3%, 7% or 14%) a fraction of the neutrons has to be discarded using pulse shaping choppers. The (orange), (grey) and (yellow) solid line curves show the fraction of the neutrons which can be used for wavelengths resolutions of 3%, 7%, and 14%, respectively, the rest being cut out by the chopper. (b) Fraction of the source neutrons which can be used as a function of the aimed time resolution for different neutron energy distributions (20 K and 5 K). For lower-energy neutrons, a larger fraction of the spectrum can be used for medium-resolution measurements.
We should underline that the above discussion was dealing with pulsed neutron sources. In the case of continuous sources, ToF reflectometry can be implemented in a very efficient way (e.g., D17 or FIGARO at the ILL or HERMES at the LLB). The key advantage of a ToF instrument on a continuous source is that the time structure and the flight path length can be optimized to perfectly match the neutron energy spectrum. They are usually short instruments (with flight paths in the 5–8 m range).
2.5.Brilliance issues
As stated earlier (§ 2.1), the beam width perpendicular to the sample surface used in reflectivity measurements ranges from tiny (0.3 mm) to small (7 mm). The brilliance is of outmost importance, as the performances of the instrument will scale linearly with the brilliance. However, would the source be extended in the direction parallel to the scattering plane, it could nevertheless be exploited by, for example, running several samples in parallel (over the beam height) or by other innovative setup.
On the other hand, in the perpendicular direction, the brilliance is of no importance as long as the optical system is able to bring all neutrons onto the sample surface. Let D be the moderator size. If the moderator brilliance scales as
Thus while high brilliance is desirable, there do exist schemes to take benefit of spatially extended neutron sources.
3.Other more exotic techniques
3.1.Energy analysis of a white beam
As reflectometry is intrinsically a 1D technique, the possibility of performing energy analysis after reflection of the neutron beam on the sample has been proposed either via diffraction (CANDOR [10]), via optics (EASYREF [7]), refraction (RAINBOWS [2]) or by using magnetic fields [6]. A gain in flux is obtained by the fact that it is not necessary to monochromatize the beam or to operate in ToF mode. Note that these techniques are very efficient on continuous sources where they provide a better use of the incoming neutrons. On pulsed sources they may be of interest to disentangle background due to inelastic contributions.
Currently, only the CANDOR setup at NCNR is in routine operation for users.22 The other techniques suffer from the low efficiency of the energy analysis devices which rely on an angular energy dispersion of the neutron beam. In the case of the RAINBOWS implementation using refraction in a MgF2 crystal, the dispersion follows a linear dependence upon the wavelength. In the EASYREF device, the efficiency of the device is proportional to the efficiency of the optics which also scales linearly with the neutron wavelength. In the case of magnetic field gradient setups, the angular deflection scales as
Such techniques would strongly benefit from a shift to longer wavelengths. However, the gains in dispersion efficiency should be weighted by the loss due to the increased absorption in the device (which is proportional to λ). The magnetic field route looks as the most promising even though rough estimates show that it is practically only useful above
3.2.SERGIS spin-echo techniques
Several spin-echo techniques applied to reflectometry have been proposed in the past such as SERGIS (Spin Echo Resolved Grazing Incidence Scattering [3–5]). Implementations have until now be hampered by the complexity compared to standard reflectometry techniques. Should these implementations become more mainstream, SERGIS could probably benefit from the use of longer-wavelength neutrons. We refer to ongoing discussions on the use of VCN in spin-echo techniques.
3.3.SELENE design type
It was recently proposed that reflectometry techniques could benefit from advanced optical systems (REFOCUS [8], SELENE [11]). As the optics efficiency is proportional to the wavelength, any implementation similar to ESTIA@ESS [4] would directly benefit from using longer-wavelength neutrons. Assuming equivalent mirror quality (identical m), a setup could either have a larger angular acceptance (proportional to λ) or be shorter (inversely proportional to λ). The latter option would make the implementation of such optical systems significantly easier and less expensive. This could in particular be useful on HiCANS sources were flux efficiency should be maximized and were the instruments are expected to be short (typically 12 m).
4.Monte-Carlo simulations of possible reflectometer designs
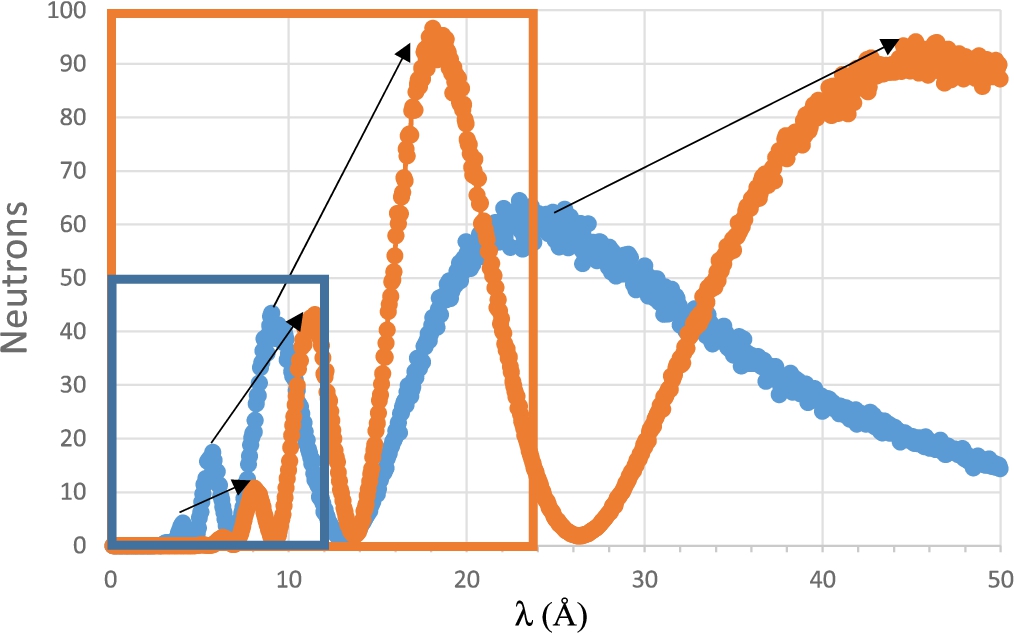
To check some of the above conclusions, Monte-Carlo simulations of basic instrument designs have been performed. Figure 8 shows the simulated fluxes in two different configurations: (i) Cold source with a temperature of 20 K, a straight guide system, a 2 m collimator with 7 mm slits, a 100 mm large sample consisting of a 10 nm thick Ni film on silicon, a position-sensitive detector (PSD) set at 2 m from the sample, (ii) Cold source with a temperature of 5 K, a straight guide system, a 2 m collimator with 14 mm slits. The wavelength spectrum is stretched by a factor
Fig. 8.
Raw reflectivity signals obtained in McStas simulations performed under the assumption of a cold source at 20 K (blue) and 5 K (orange), see text for more details. The signals are homothetic with respect to λ; the corresponding physical features are linked by arrows. In the case of the FREIA@ESS instrument, the usable wavelength range extends up to 12 Å (blue frame). On the colder source, on an instrument twice as short, the usable wavelength range extends up to 24 Å. The efficiency of the setup (number of usable reflected neutrons) is multiplied by 4 between the two configurations.
5.Gravity effects
Reflectometry in horizontal geometry is sensitive to gravity effects. These occur (i) in the collimation system, giving rise to a wavelength dependent incidence angle on the sample; (ii) after reflection on the sample, where the reflected beam is spread over a significant height on the detector (over centimeters), requiring the use of a PSD and a careful integration scheme. More generally, it can be stated that gravity introduces correlations between space and time/energy parameters so that complex corrections of the measured data are required. Correction devices such as prisms may be implemented but would lead to significant absorption. The former issue is more difficult to account for as it depends on the size of the sample and of the collimation system. It does not seem to the author that such effects are currently being considered in reflectivity data processing. There does not seem to be any obvious calibration procedure which could be implemented and the problem would require careful modelling. The use of a vertical sample configuration would avoid gravity issues which would only prevent performing studies on free liquid surfaces.
6.Discussion in the specific case of a VCN source at ESS
Preliminary calculations have been performed to estimate the potential performances of a large liquid-deuterium moderator at ESS. Figure 9 shows these preliminary calculations. It can be noted that in the current design, the total intensity has been privileged over the brilliance of the source. The brilliance in the VCN range is thus lower by a factor 2, which would directly reflect in a lower performance of the instrument by a factor 2 as well. On the other hand, as the source would be extended (over tens of cm) [9], one may assume that a 20–30 cm wide beam can be focused on the sample (perpendicular to the scattering plane) and would provide a gain in flux of a factor 5–6 compared to a typical guide cross section of 4–5 cm. Hence, the total flux transported to the sample would still be increased by a factor 2 to 3 even though the source brightness of this lower moderator is lower than that of the upper, para-hydrogen moderator.
Fig. 9.
Preliminary calculations of the possible brilliance and intensity of a large liquid-deuterium moderator at the lower moderator position at ESS [12].
![Preliminary calculations of the possible brilliance and intensity of a large liquid-deuterium moderator at the lower moderator position at ESS [12].](https://ip.ios.semcs.net:443/media/jnr/2022/24-2/jnr-24-2-jnr220004/jnr-24-jnr220004-g009.jpg)
7.Conclusion
We summarize in Table 1 the gains which could be expected in reflectometry measurements under the hypothesis that the neutron energy spectrum could be stretched by a factor α to longer wavelengths (α being typically on the order of 2 to 3) and that the source brilliance is preserved. Overall, gains in flux related to geometry scale as
Table 1
Gains in flux which could be obtained by stretching the wavelength spectrum to longer wavelengths by a factor α
| Continuous source | Pulsed source | |
| Increased divergence/illumination in the scattering plane | ||
| Improved focussing in the direction perpendicular to the scattering plane | α | α |
| Time resolution | Monochromatic mode: no impact when shifting the wavelength. | A VCN instrument has to be shortened to optimally use the pulse time structure of an existing source. |
| Time-of-flight implementation: the time structure and flight path can be tuned to optimally match the energy spectrum. | External constrains may be limiting the minimal flight path. | |
| Gravity | Limited gravity effects if the spectrometer is operated in monochromatic mode. | Very large gravity effects in horizontal sample geometry in ToF mode. |
| Advanced neutron optical delivery systems (SELENE type) | The length of the setup can be reduced or its brilliance increased by a factor α. | The length of the setup can be reduced or its brilliance increased by a factor α. |
| Energy analysis methods | Energy analysis methods become more efficient (proportional to α or | Could be used for spin analysis, discrimination of inelastic neutron scattering. |
The implementation of a source providing VCN at ESS involves limitations connected to the existing infrastructure (nominal pulse length of the proton pulses, repetition rate, shielding constrains, radiation heating issues) so that the use of such a source can hardly be optimal. On the other hand, if one would consider a Compact Accelerator-based source allowing the construction of a dedicated Target – Moderator – Reflector assembly, for which the incoming proton beam time structure (pulse length and repetition rate) could be optimized, there would definitely be opportunities for the use of VCN for reflectometry applications.
A more general question is related to the question of what do we do with more flux? The use of VCN would improve the performances of reflectometry instrumentation only in a quantitative way, not in a qualitative way as no new physics will be probed. As the performances of reflectometry instrumentation at ESS is already expected to be extremely high, it is questionable if it is worth investing in VCN for this specific technique. On the other hand, implementing advanced techniques such as VCN on sources such as CANS where the flux is intrinsically limited may be worth the investment since (i) such sources could probably be designed to use VCN in an optimal way, (ii) the implementation of VCN sources would be much easier as radiative heating would be reduced by several orders of magnitude, in the range of hundreds of watts, making the construction and handling of VCN sources a lot easier than at ESS.
Notes
1 The term “brilliance” refers to the flux in n/cm2/s/sr/unit bandwidth. The term “brightness”, refers to the energy integrated brilliance in n/cm2/s/sr.
Acknowledgement
I thank Alain Menelle from the Laboratoire Léon Brillouin CEA-CNRS for discussions on the topic of VNC and reflectometry.
References
[1] | K. Andersen, D.N. Argyriou and A.J. Jackson, The instrument suite of the European Spallation Source, NIM A 957: ((2020) ), 163402. doi:10.1016/j.nima.2020.163402. |
[2] | R. Cubitt, J.S. Ruiz and W. Jark, RAINBOWS: Refractive analysis of the incoming neutron beam over the white spectrum. A new fast neutron reflectometry technique exploiting a focusing prism, J. Applied Crystallography 51: ((2018) ), 257–263. doi:10.1107/S1600576718001528. |
[3] | G.P. Felcher, S.G.E. te Velthuis, J. Major et al., Spin-echo resolved grazing incidence scattering (SERGIS) of cold neutrons, in: Proceedings of SPIE, Advances in Neutron Scattering Instrumentation, Vol. 4785: , (2002) , pp. 164–173. doi:10.1117/12.451683. |
[4] | A. Glavic, J. Stahn and S. Schütz, Estia: Design of the polarized, small sample reflectometer at ESS, Swiss Neutron News 48: ((2016) ), 6–16. |
[5] | J. Major, A. Vorobiev, R. Pynn et al., A spin-echo resolved grazing incidence scattering setup for the neutron interrogation of buried nanostructures, Rev. Sci. Instr. 80: ((2009) ), 123903. doi:10.1063/1.3240598. |
[6] | F. Ott, Etude de couches minces magnétiques par réflectivité de neutrons polarisés. Diffusion hors spéculaire sur des structures périodiques, PhD thesis, Univ. Paris Sud, 1998. HAL Id: tel-00429503. |
[7] | F. Ott, EASYREF: Energy analysis system for reflectometers, NIM A 584: ((2008) ), 401–405. doi:10.1016/j.nima.2007.10.042. |
[8] | F. Ott and A. Menelle, REFocus: A new concept for a very high flux neutron reflectometer, NIM A 586: ((2008) ), 23–30. doi:10.1016/j.nima.2007.11.037. |
[9] | V. Santoro et al., Development of a high intensity neutron source at the European Spallation Source, the HighNESS project, arXiv:2204.04051. |
[10] | J.M. Simmons et al., Polychromatic energy-dispersive neutron diffraction at a continuous source, J. Appl. Cryst. 46: ((2013) ), 1347–1352. doi:10.1107/S0021889813017834. |
[11] | J. Stahn and A. Glavic, Focusing neutron reflectometry: Implementation and experience on the TOF-reflectometer Amor, NIM A 821: ((2018) ), 44–54. doi:10.1016/j.nima.2016.03.007. |
[12] | L. Zanini et al., Very cold and ultra-cold neutron sources for ESS, in: Highness VCN Workshop Proceedings, (2022) . |


