You are viewing a javascript disabled version of the site. Please enable Javascript for this site to function properly.
Go to headerGo to navigationGo to searchGo to contentsGo to footer
In content section. Select this link to jump to navigation

Energy resolution and neutron flux of the 4SEASONS spectrometer revisited

Abstract

The elastic energy resolution, integrated intensity, and peak intensity of the direct-geometry neutron chopper spectrometer 4SEASONS at Japan Proton Accelerator Research Complex (J-PARC) were re-investigated. This was done with respect to the incident energy and the rotation speed of the Fermi chopper using incoherent scattering of vanadium and simple analytical formulas. The model calculations reproduced the observed values satisfactorily. The present work should be useful for estimating in instrument performance in experiments.

1.Introduction

The time-of-flight direct-geometry chopper spectrometer is one of the typical and powerful neutron scattering spectrometers to measure atomic and magnetic dynamics in materials. This type of instrument uses a rotating chopper to monochromatize the neutron beam incident on a sample, and the energy and momentum transfers to the sample are determined by analyzing the time-of-flight of neutrons and scattering angle of the detector. One of the advantages of this type of instrument is that the energy and momentum ranges and resolution can be flexibly chosen by tuning the rotation phase and speed of the chopper. This high flexibility, however, sometimes makes it difficult to find the best experimental condition in terms of resolution and flux, because high resolution generally results in low flux. Therefore, it is important to understand the relationship between the resolution and flux for the instrument quantitatively and prepare a convenient tool to estimate their values as a function of the incident energy (Ei) and the rotation speed (f) of the monochromatizing chopper. Monte Carlo simulation can easily model the whole instrument including advanced optics, and would be the best method to precisely reproduce the resolution and flux [5,12,14,16,2124]. However, Monte Carlo simulation takes too long time to use to decide the experimental condition before or during the experiment, though it is useful for data analysis after the experiment. To estimate the experimental condition, a fast analytical calculation based on a more simple model should be useful, even though it may be less accurate compared with Monte Carlo simulations [15].

In this study, we investigated the energy resolution and flux of the direct-geometry chopper spectrometer 4SEASONS at the Japan Proton Accelerator Research Complex (J-PARC) [11]. 4SEASONS, also called SIKI, is one of the four direct-geometry chopper spectrometers installed at the pulsed neutron source of the Materials and Life Science Experimental Facility (MLF) in J-PARC [13,18]. It was designed for the studies of dynamics using thermal neutrons, and has been used in a variety of research fields such as superconductors, quantum magnets, topological materials, catalysts, and thermoelectric materials. The instrument views the supercritical hydrogen coupled moderator, which is 18 m upstream of the sample. A Fermi chopper, 1.7 m upstream of the sample, is used to monochromatize the incident beam, and Ei of 10 to 250 meV was typically used. Although the resolution and flux have been analytically and numerically investigated [6,11,12], the systematic investigation has not sufficiently been done, especially for the flux. In addition, the Fermi chopper was replaced with a new model in 2015, which has a short slit package consisting of 0.4-mm wide and 20-mm long slits [10]. The new chopper was designed to provide the same energy resolution as that of the old chopper [19], but no systematic studies of the resolution and flux with the new chopper have been reported.

Accordingly, we re-investigated the energy resolution and intensity of the elastic scattering using incoherent scattering of vanadium. The integrated intensity of the elastic scattering peak is the value directly related to the neutron flux on the sample. On the other hand, if the excitation to be observed is intrinsically sharp, the peak intensity, rather than the integrated intensity, is essential to determine the data quality. Therefore, in this study, we investigated the integrated intensity and the peak intensity. By comparing the observed data with simple analytical model, we developed empirical formulas which are useful to calculate the energy resolution and intensities.

2.Experiment

To study the scattering intensity as a function of Ei and f, we measured scattering intensity of a vanadium sample while rotating the Fermi chopper to monochromatize the incident beam. The facility beam power was 0.51 MW. The vanadium sample has a hollow cylinder shape whose dimension is 18 mm in diameter, 25 mm in height, and 1 mm in thickness. The Fermi chopper was rotated at speeds in the range of 100 to 600 Hz with 100 Hz steps. Additionally, to evaluate the Ei dependence of the neutron flux without the chopper, we measured scattering intensity of vanadium with a white beam. For the latter measurement, we used a thin vanadium hollow cylinder whose dimension is 20 mm in diameter, 20 mm in height, and 0.125 mm in thickness. For both measurements, the T0 chopper was rotated at 25 Hz to suppress background noise caused by the prompt pulse. The two disk choppers were rotated at 25 Hz to suppress the frame overlap for the monochromatic beam measurement [11]. The scattering intensity with the white beam and monochromatic beam were converted to histogram data of neutron energy and energy transfer, respectively. To obtain the peak width, also called full-width at half-maximum (FWHM), and the peak height of the elastic peak in the monochromatic beam measurements, we fitted the observed energy spectra to Gaussians. Although the Gaussian fit sufficiently reproduced the observed spectra peak widths and peak heights, the integrated intensities of the obtained Gaussians underestimated the true integrated intensities due to a pulse tail in the energy gain side, which is particularly significant for instruments at the coupled moderator. Then, we numerically integrated the observed energy spectra to obtain the integrated intensities. The integrated intensity was converted to the neutron flux per MW at the sample according to Eq. (5). The same conversion factor was applied to the peak intensity per unit energy transfer (meV), although the spectra as a function of energy transfer and their peak heights are originally defined at the detector.

3.Calculations

3.1.Energy resolution

The energy resolution (FWHM) of the energy spectrum relative to the incident energy (Ei) for a Fermi chopper spectrometer is described by the following formula [2,4,6,25]:

(1)ΔEEi={2Δtctc[1+L1L2(1EEi)32]}2+{2Δtmtc[1+L3L2(1EEi)32]}2+[2ΔL2L2(1EEi)]2,
where E is the energy transfer, and in this study E=0. The moderator-to-sample, sample-to-detector, and chopper-to-sample distances are given as L1, L2, and L3, respectively. For 4SEASONS, L1=18m, L2=2.5m, and L3=1.7m. The time at which neutrons with energy Ei reach the Fermi chopper is given as tc. Similarly, the opening time of the Fermi chopper and the pulse width at the moderator are denoted by Δtc and Δtm, respectively. Due to the angular divergence of the incident beam, Δtc is effectively larger than its intrinsic value defined by chopper geometry, i.e., Δtc=p[w/(2πDf)], where D and w are the diameter of the chopper rotor and width of each slit, respectively. The term p is expressed as a function of the maximum angular divergence of the incident beam, ΔΦimax, as:
(2)p(u)=1+u/40<u<0.82+u(4uu2)1/20.8<u<2u2<u,
where u=ΔΦimax/(w/D) [25]. ΔΦimax has neutron energy dependence originating from neutron reflections by the supermirrors of the guide tube. The ΔΦimax was estimated using the relationship between neutron wavelength and supermirror critical angle [8,11]. To obtain Δtm, the linear interpolation of the numerical values available at the J-PARC web-site [1] was used. Furthermore, ΔL2 is the uncertainty of L2 resulting from the sample and the detector sizes. We assumed ΔL2=[(πws/4)2+(πwd/4)2]1/2, where ws and wd are diameters of the sample and the detector, respectively. wd is 19 mm for 4SEASONS, and 20 mm for ws of the vanadium samples was used.

3.2.Intensity

The neutron flux at the sample is described as follows [9,25]:

(3)n(Ei,f)=ϕ(Ei)SmL12G(Ei)2(2/m)12Ei32L1L3Δtcww+zAc(Ei)T(Ei,f),
where ϕ(Ei) is the neutron flux at the moderator, Sm is the area of the moderator, G(Ei) is the gain by the guide tube, and m is the neutron mass. The term z is the thickness of each neutron absorber in the slit package, and Ac(Ei) is the absorption by the aluminum spacers in the slit package. The transmission function T(Ei,f) is described as follows:
(4)T(β)=183β20<β<1/4163β1/28β+83β21/4<β<10β>1,
where β=(D/2w)(πDf/vi) for a straight slit Fermi chopper, and vi is the neutron velocity.

Now we are interested in the Ei and f dependence of the scattering intensity detected by the detector,

(5)I(Ei,f)=n(Ei,f)Nvσv4πAs(Ei)ΔΩηd(Ei),
where ΔΩ is the solid angle, and ηd is the efficiency of the detector. Nv, σv, and As are the number of atoms in the vanadium sample, the incoherent scattering cross-section of vanadium, and the absorption by the vanadium sample, respectively. We simplified the equation by replacing terms independent of the Fermi chopper in Eq. (3) with the observed intensity of white beam, Iwhiteobs(Ei), and constant terms with a scale factor, C0. Then, we have the following formula for scattering intensity as a function of Ei and f:
(6)I(Ei,f)=C0Iwhiteobs(Ei)Ei32ΔtcAc(Ei)T(Ei,f).
It should be noted that the intensity derived using this formula corresponds to the integrated intensity. We calculated the peak intensity using the energy resolution as shown in the results and discussions section.

4.Results and discussions

The Ei dependence of the observed values of the energy resolutions and integrated intensities for several rotation speeds of the Fermi chopper are shown in Figs. 1(a) and 1(b), respectively. We found that the intensities at Ei=6meV were affected by the finite transmission of the disk choppers around this energy region, and the values were corrected for the transmission in Fig. 1(b). The broken lines in the figures indicate the calculated values using Eqs. (1) and (6), and the designed values of the geometrical parameters of the Fermi chopper, i.e., D=20mm and w=0.4mm. The calculated integrated intensities were normalized to coincide with the observed value at Ei=19meV and f=300Hz. There is good agreement between the observed and calculated values for the energy resolutions and integrated intensities. However, the calculated values are systematically lower than the observed values. Then, we calculated the energy resolutions and the integrated intensities using a 10% larger w value, i.e., w=0.44mm, which are indicated by solid lines. Using this modification, the agreement with the observed values improved for the energy resolutions and integrated intensities. The larger slit width of the Fermi chopper may be due to the fact that the absorber in the slit package is not 100% neutron absorber. The absorber of the 4SEASONS Fermi chopper comprised a blend of 50% 10B and 50% epoxy glue. The latter may scatter neutrons on the surface of the absorber, which can effectively widen the slit width. We considered w=0.44mm as the practical slit width, and used it for the other calculations hereafter.

Fig. 1.

(a) The energy resolution, (b) integrated intensity, and (c, d) peak intensity at 4SEASONS as a function of the incident neutron energy for different Fermi chopper rotation speeds. Symbols denote the observed values. The values of the integrated intensities in (b) were converted to the neutron flux per MW at the sample. In (a) and (b), the broken lines and solid lines are calculated values with (D,w)=(20mm,0.4mm) and (D,w)=(20mm,0.44mm), respectively. The solid lines in (c) and those in (d) are calculated values by using the formulas Ipeak=0.73(I/ΔE) and Eq. (7), respectively.

(a) The energy resolution, (b) integrated intensity, and (c, d) peak intensity at 4SEASONS as a function of the incident neutron energy for different Fermi chopper rotation speeds. Symbols denote the observed values. The values of the integrated intensities in (b) were converted to the neutron flux per MW at the sample. In (a) and (b), the broken lines and solid lines are calculated values with (D,w)=(20mm,0.4mm) and (D,w)=(20mm,0.44mm), respectively. The solid lines in (c) and those in (d) are calculated values by using the formulas Ipeak=0.73(I/ΔE) and Eq. (7), respectively.

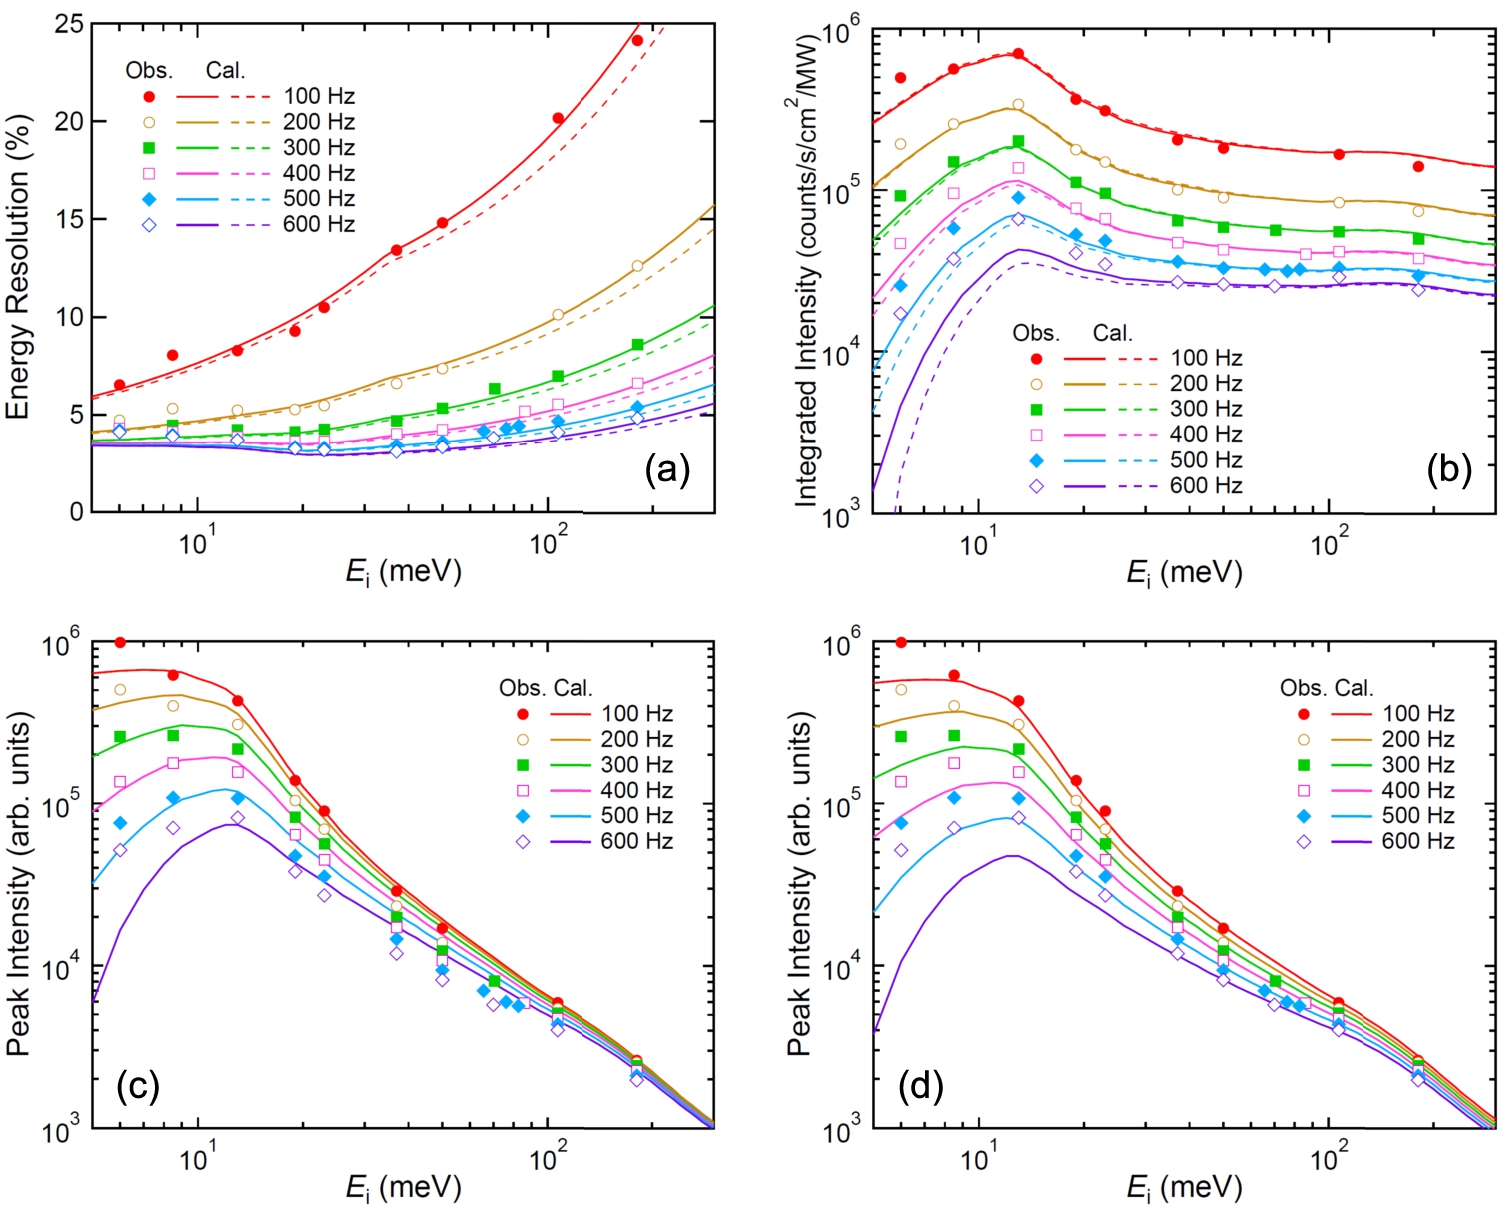
As the rotation speed of the Fermi chopper increased, the energy resolution improved [Fig. 1(a)]. However, it became saturated as f increased, as shown later in detail. The value of energy resolution decreased as Ei is reduced, but slightly increased below ∼20 meV for high fs, because of the increase in Δtm of the coupled moderator. The energy dependence of the integrated intensity showed a peak around 12 meV, which corresponds to the peak in the ϕ(Ei)Ei3/2 term [Fig. 1(b)]. At high energies, the integrated intensity decreased and became saturated as f was increased. In addition, a slight decrease in the calculated curves above ∼150 meV corresponds to the intensity loss due to the slowly-rotating T0 chopper. On the other hand, at low energies, the integrated intensity decreased quickly as Ei was reduced. The intensity dropped more quickly at high fs because of the rapid decrease in the transmission of the Fermi chopper, T(Ei,f). Nevertheless, the observed intensities at high fs, especially at 500 Hz and 600 Hz, were clearly larger than the calculated values. This tendency is consistent with the fact that the observed amplitude of the energy resolution is larger than the calculated one at these rotation speeds and low Eis.

The symbols shown in Figs. 1(c) and 1(d) show the observed peak intensities as a function of Ei. If the line shape of the observed energy spectrum is a Gaussian, the peak intensity is proportional to the integrated intensity divided by the peak width. Thus, we calculated the peak intensities by Ipeak=C1(I/ΔE), which are represented by the solid lines as shown in Fig. 1(c). The scale factor C1 was chosen to make the calculated intensity at 100 Hz roughly reproduce the observed values. However, this derivation was too naive, because the calculated values deviated as Ei decreased and f increased. One of the plausible reasons for the deviation was the fact that the observed spectra were not Gaussians and had tails, which became more significant at low Eis and high fs. Then, we introduced the following empirical scale function which reduced the peak intensity at low Eis and high fs:

(7)Ipeak=IΔE×C2[1+af12(b+1exp[c(Eid)]+1)]1
A combination of parameters of C2=0.85, a=0.023, b=0.5, c=0.05, and d=70meV resulted in the solid lines shown in Fig. 1(d). The agreement between the calculated and observed values was improved compared with Fig. 1(c), and is similar to that for the integrated intensity shown in Fig. 1(b). A better formula of the peak intensity would be obtained if we could model the line shape precisely by using an asymmetric function like the Ikeda–Carpenter function [7], because Eq. (7) and the parameters listed above were empirically obtained. However, the empirical formula of the peak intensity can be of practical use to estimate the peak intensity as shown in Figs. 1(d) and 2(c).

Fig. 2.

(a) The integrated intensity, (b) energy resolution, and (c) peak intensity at 4SEASONS as a function of the rotation speed of the Fermi chopper. Symbols denote the observed values, while solid lines denote the values calculated by using Eqs. (1), (6), and (7). The observed and calculated values are normalized so that the values at 100 Hz are unities. In (a) and (b), the function of 100/f is drawn by the broken lines.

(a) The integrated intensity, (b) energy resolution, and (c) peak intensity at 4SEASONS as a function of the rotation speed of the Fermi chopper. Symbols denote the observed values, while solid lines denote the values calculated by using Eqs. (1), (6), and (7). The observed and calculated values are normalized so that the values at 100 Hz are unities. In (a) and (b), the function of 100/f is drawn by the broken lines.

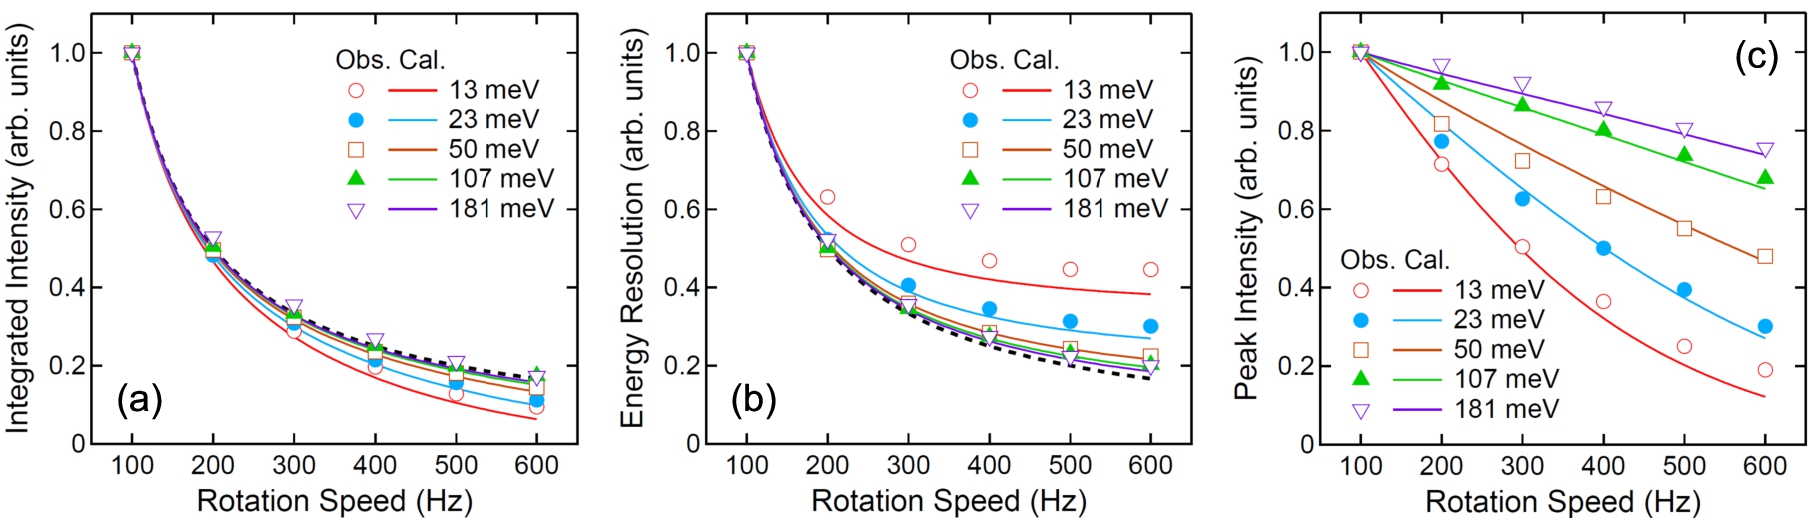
The observed and calculated energy resolutions, integrated intensities, and peak intensities for selected Eis as a function of f are shown in Fig. 2. The symbols denote the observed values, while the solid lines represent values calculated by Eqs. (1), (6), and (7). The values were normalized so that those at 100 Hz were unity. The calculated values described the observed f dependence accurately in all the three kinds of data. In Figs. 2(a) and 2(b), the integrated intensity and the energy resolution above ∼50 meV followed a function of 1/f (broken lines). This means that the f dependences of the integrated intensity and the energy resolution were dominated by that of Δtc. However, they gradually deviated from the 1/f dependence below ∼50 meV. The deviation in the integrated intensity resulted from the decrease in the transmission of the Fermi chopper. However, the deviation was moderate, and the simple 1/f law was an adequate measure to estimate the f dependence of the integrated intensity. On the other hand, the energy resolution significantly deviated the 1/f dependence at low Eis, and it became almost independent of f at 13 meV. This feature of the energy resolution is correlated with the f dependence of the peak intensity as shown in Fig. 2(c). The peak intensity decreased as a function of f. Although it showed moderate decrease as a function of f at high Eis, it decreased faster below ∼50 meV, where the energy resolution became saturated at high fs. The relation between the integrated intensities, energy resolutions, and peak intensities shown in Fig. 2 indicated that at high Eis above ∼50 meV, the decrease in the integrated intensity as a function of f mostly resulted from the decrease in ΔE while it was dominated by the decrease in the peak intensity at low Eis below ∼50 meV. This result suggests an important criterion for choosing experimental conditions at 4SEASONS. In general, high intensity and high resolution are mutually exclusive. However, at high Eis above ∼50 meV, the decrease in the peak intensity as a function of f was not as significant as in the integrated intensity. Therefore, we can apply a condition of high resolution with high peak intensity by rotating the Fermi chopper at high speed. Such a condition is useful to measure excitations which are sharp in energy such as crystal electric field excitations and dispersionless optical modes. However, at low Eis below ∼50 meV, high speed rotation of the Fermi chopper may waste both integrated and peak intensities without significant improvement in the energy resolution.

Fig. 3.

The calculated energy resolutions of 4SEASONS as a function of the rotation speed of the Fermi chopper for (a) Ei=107meV, (b) 50 meV, and (c) 13 meV. The solid lines denote the energy resolutions. The broken lines, green dotted lines, and red dotted lines denote the resolution components related to the chopper opening time (Δtc), moderator pulse width (Δtm), and the uncertainty in the sample-detector distance (ΔL2), respectively. The dashed-dotted lines denote the f-independent resolution components, which are square roots of sum of squares of the moderator and L2 components.

The calculated energy resolutions of 4SEASONS as a function of the rotation speed of the Fermi chopper for (a) Ei=107meV, (b) 50 meV, and (c) 13 meV. The solid lines denote the energy resolutions. The broken lines, green dotted lines, and red dotted lines denote the resolution components related to the chopper opening time (Δtc), moderator pulse width (Δtm), and the uncertainty in the sample-detector distance (ΔL2), respectively. The dashed-dotted lines denote the f-independent resolution components, which are square roots of sum of squares of the moderator and L2 components.

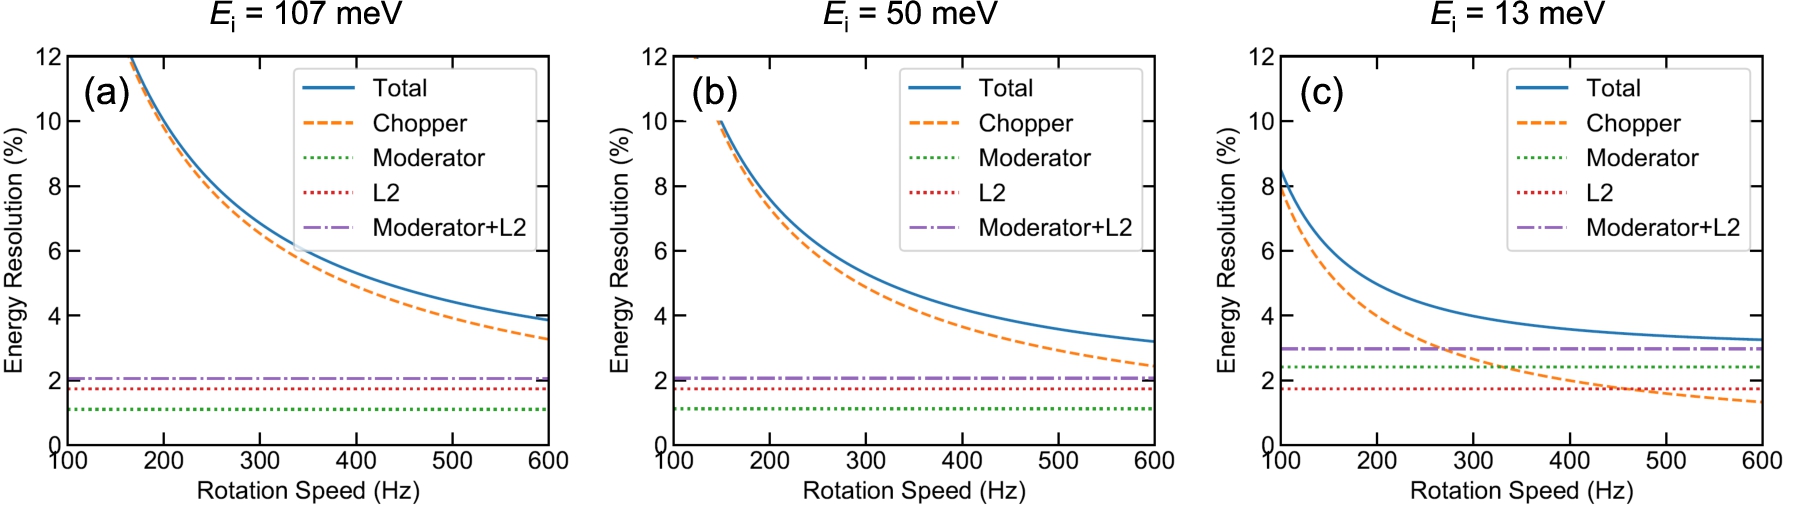
As seen above, the saturation of the energy resolution at low Eis and high fs is an important feature in considering the experimental condition of 4SEASONS. To understand this feature, we plotted the calculated energy resolutions for Ei=107, 50, and 13 meV as a function of f by dividing them into respective resolution components in Eq. (1) as shown in Fig. 3. The resolution component which originated from Δtm [the second term in Eq. (1)] and the resolution component which originated from ΔL2 [the third term in Eq. (1)] were constant regardless of the rotation speed of the chopper. Typically, the ΔL2 component remains constant for all Eis. It should be noted that the Δtm component was independent of Ei between 50 meV and 107 meV. This resulted from the fact that Δtm is proportional to Ei1/2 in the epithermal region [17]. However, the moderator component significantly increased at Ei=13meV because of the increase in Δtm of the coupled moderator [1,20]. On the other hand, the resolution component which originated from Δtc [the first term in Eq. (1)] gradually decreased as Ei decreased. As a result, at high energies such as 107 meV, the energy resolution is mostly determined by the rotation speed of the Fermi chopper [Fig. 3(a)] [3]. Therefore, the energy resolution improved at faster chopper rotation. At the middle energies such as 50 meV, the chopper component in the resolution was comparable to the f-independent component (square root of sum of squares of the moderator and L2 components) at high fs [Fig. 3(b)]. Finally, at low energies such as 13 meV, the energy resolution was dominated by the f-independent component for a wide range of f [Fig. 3(c)], and the energy resolution was not affected by f.

Having established practical formulas to calculate the energy resolution, integrated intensity, and peak intensity easily, we can take advantage of this knowledge to find the best combination of
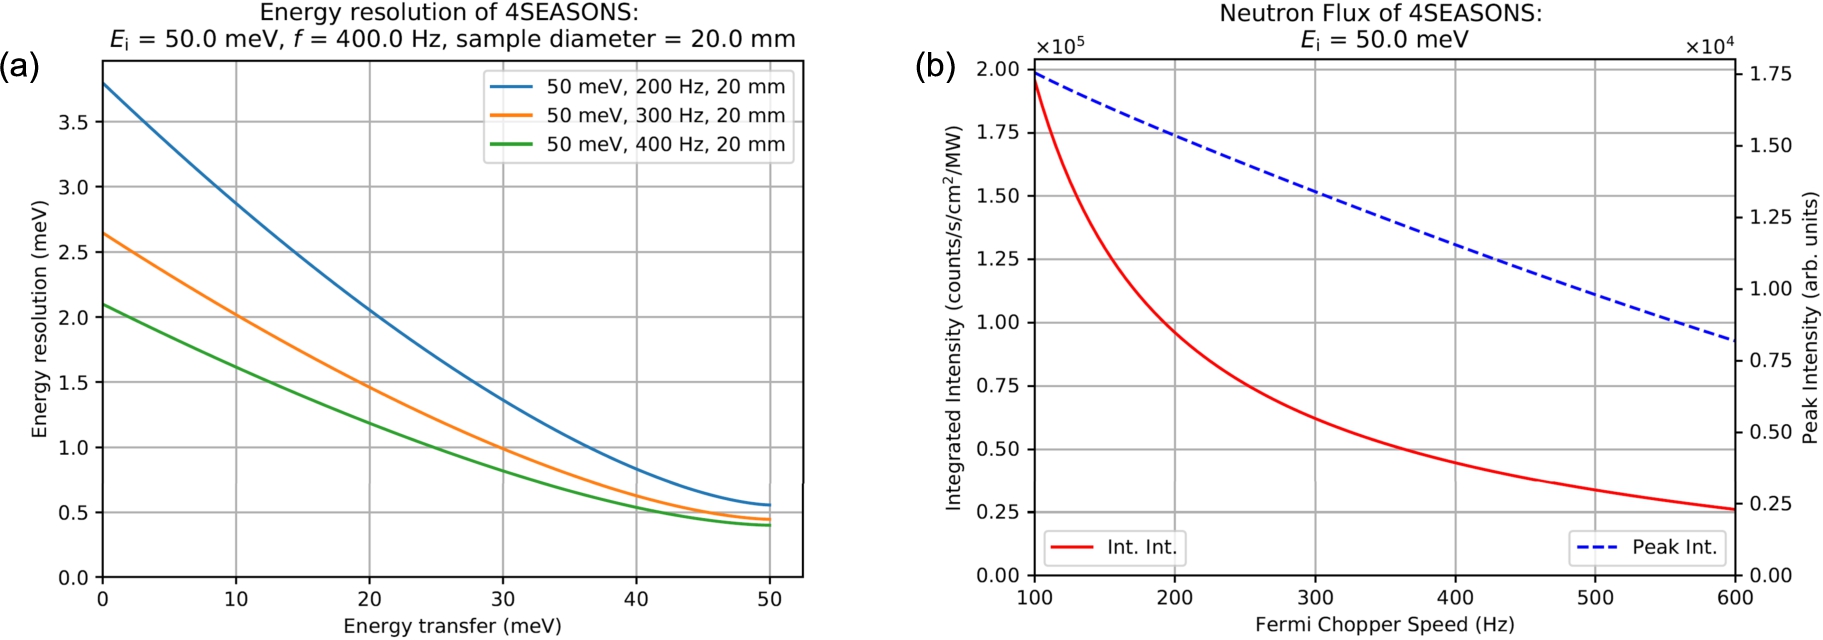
 Ei and f for experiments. For this purpose, we developed simple scripts using Python programming language. An example of a script output for the energy resolution is shown in Fig. 4(a). This script calculated the energy resolution as a function of the energy transfer using Eq. (1), and has already been used at 4SEASONS. A prototype script output to calculate the f dependence of the integrated and peak intensities recently developed based on the present study is shown in Fig. 4(b). These tools should be useful for users of the instrument to choose the experimental conditions before or during experiments.

Fig. 4.

Outputs of computing tools to calculate (a) the energy resolution and (b) the integrated and peak intensities for 4SEASONS.

Outputs of computing tools to calculate (a) the energy resolution and (b) the integrated and peak intensities for 4SEASONS.

5.Summary

The elastic energy resolution as well as the integrated and peak intensities of the direct-geometry neutron chopper spectrometer 4SEASONS at J-PARC were re-investigated with respect to the incident energy and the rotation speed of the Fermi chopper using incoherent scattering of vanadium. The model calculation based on formulas sufficiently reproduced the observed energy resolution and integrated intensity, but the agreement was improved by assuming a 10% larger slit width in the Fermi chopper. The naive division of the integrated intensity by the peak width failed to reproduce the observed peak intensity probably due to the asymmetric line shapes of the energy spectra, which became significant at low incident energies and high rotation speeds. We introduced an empirical scaling function, which practically described the observed peak intensity. The inverse of the rotation speed of the Fermi chopper is an adequate measure of the rotation speed dependence of the energy resolution and integrated intensity at high incident energies. However, they deviated from the 1/f law at low incident energies as the transmission of the Fermi chopper decreased and the resolution components which are independent of the chopper dominated the energy resolution. Based on this study, simple computing tools to calculate the energy resolution and intensities were developed, which should be useful for users of the instrument to estimate the instrument performance and decide the experimental condition before or during the experiments.

Acknowledgement

The neutron scattering experiment at MLF of J-PARC was performed under the user program no. 2019I0001.

References

[1] 

http://j-parc.jp/researcher/MatLife/en/instrumentation/ns3.html.

[2] 

D.L. Abernathy, M.B. Stone, M.J. Loguillo, M.S. Lucas, O. Delaire, X. Tang, J.Y.Y. Lin and B. Fultz, Design and operation of the wide angular-range chopper spectrometer ARCS at the Spallation Neutron Source, Rev. Sci. Instrum. 83: ((2012) ), 015114. doi:10.1063/1.3680104.

[3] 

M. Arai, R. Kajimoto, M. Nakamura, Y. Inamura, K. Nakajima, K. Shibata, N. Takahashi, J. Suzuki, S. Takata, T. Yamada and S. Itoh, Recent developments of instruments in a spallation neutron source at J-PARC and those prospects in the future, J. Phys. Soc. Jpn. 82: ((2013) ), SA024. doi:10.7566/JPSJS.82SA.SA024.

[4] 

G. Ehlers, A.A. Podlesnyak, J.L. Niedziela, E.B. Iverson and P.E. Sokol, The new cold neutron chopper spectrometer at the Spallation Neutron Source: Design and performance, Rev. Sci. Instrum. 82: ((2011) ), 085108. doi:10.1063/1.3626935.

[5] 

G.E. Granroth and S.E. Hahn, Monte Carlo simulation of the resolution volume for the SEQUOIA spectrometer, EPJ Web Conf. 83: ((2015) ), 03006. doi:10.1051/epjconf/20158303006.

[6] 

K. Iida, K. Ikeuchi, M. Ishikado, J. Suzuki, R. Kajimoto, M. Nakamura, Y. Inamura and M. Arai, Energy- and Q-resolution investigations of a chopper spectrometer 4SEASONS at J-PARC, JPS Conf. Proc. 1: ((2014) ), 014016. doi:10.7566/JPSCP.1.014016.

[7] 

S. Ikeda and J.M. Carpenter, Wide-energy-range, high-resolution measurements of neutron pulse shapes of polyethylene moderators, Nucl. Instrum. Methods Phys. Res., Sect. A 239: ((1985) ), 536–544. doi:10.1016/0168-9002(85)90033-6.

[8] 

K. Ikeuchi, M. Nakamura, R. Kajimoto and M. Arai, Optimization of a Fermi chopper for an inelastic neutron spectrometer with focusing guide, J. Phys. Soc. Jpn. 82: ((2013) ), SA038. doi:10.7566/JPSJS.82SA.SA038.

[9] 

S. Itoh, T. Yokoo, S. Satoh, S. Yano, D. Kawana, J. Suzuki and T.J. Sato, High Resolution Chopper spectrometer (HRC) at J-PARC, Nucl. Instrum. Methods Phys. Res., Sect. A 631: ((2011) ), 90–97. doi:10.1016/j.nima.2010.11.107.

[10] 

R. Kajimoto, M. Nakamura, Y. Inamura, K. Kamazawa, K. Ikeuchi, K. Iida, M. Ishikado, N. Murai, H. Kira, T. Nakatani, S. Ohira-Kawamura, R. Takahashi, N. Kubo, W. Kambara, K. Nakajima and K. Aizawa, Status report of the chopper spectrometer 4SEASONS, J. Phys.: Conf. Ser. 1021: ((2018) ), 012030. doi:10.1088/1742-6596/1021/1/012030.

[11] 

R. Kajimoto, M. Nakamura, Y. Inamura, F. Mizuno, K. Nakajima, S. Ohira-Kawamura, T. Yokoo, T. Nakatani, R. Maruyama, K. Soyama, K. Shibata, K. Suzuya, S. Sato, K. Aizawa, M. Arai, S. Wakimoto, M. Ishikado, S. Shamoto, M. Fujita, H. Hiraka, K. Ohoyama, K. Yamada and C.-H. Lee, The Fermi chopper spectrometer 4SEASONS at J-PARC, J. Phys. Soc. Jpn. 80: ((2011) ), SB025. doi:10.1143/JPSJS.80SB.SB025.

[12] 

R. Kajimoto, K. Sato, Y. Inamura and M. Fujita, Instrumental resolution of the chopper spectrometer 4SEASONS evaluated by Monte Carlo simulation, AIP Conf. Proc. 1969: ((2018) ), 050004. doi:10.1063/1.5039301.

[13] 

R. Kajimoto, T. Yokoo, M. Nakamura, Y. Kawakita, M. Matsuura, H. Endo, H. Seto, S. Itoh, K. Nakajima and S. Ohira-Kawamura, Status of neutron spectrometers at J-PARC, Physica B 562: ((2019) ), 148–154. doi:10.1016/j.physb.2018.11.061.

[14] 

K. Lefmann and K. Nielsen, McStas, a general software package for neutron ray-tracing simulations, Neutron News 10: (3) ((1999) ), 20–23. doi:10.1080/10448639908233684.

[15] 

J.Y.Y. Lin, A. Banerjee, F. Islam, M.D. Le and D.L. Abernathy, Energy dependence of the flux and elastic resolution for the ARCS neutron spectrometer, Physica B 562: ((2019) ), 26–30. doi:10.1016/j.physb.2018.11.027.

[16] 

J.Y.Y. Lin, H.L. Smith, G.E. Granroth, D.L. Abernathy, M.D. Lumsden, B. Winn, A.A. Aczel, M. Aivazis and B. Fultz, MCViNE – an object oriented Monte Carlo neutron ray tracing simulation package, Nucl. Instrum. Methods Phys. Res., Sect. A 810: ((2016) ), 86–99. doi:10.1016/j.nima.2015.11.118.

[17] 

D.F.R. Mildner and R.N. Sinclair, Considerations for a cold moderator on a pulsed neutron source, Ann. Nucl. Energy 6: ((1979) ), 225–237. doi:10.1016/0306-4549(79)90076-8.

[18] 

K. Nakajima, Y. Kawakita, S. Itoh, J. Abe, K. Aizawa, H. Aoki, H. Endo, M. Fujita, K. Funakoshi, W. Gong, M. Harada, S. Harjo, T. Hattori, M. Hino, T. Honda, A. Hoshikawa, K. Ikeda, T. Ino, T. Ishigaki, Y. Ishikawa, H. Iwase, T. Kai, R. Kajimoto, T. Kamiyama, N. Kaneko, D. Kawana, S. Ohira-Kawamura, T. Kawasaki, A. Kimura, R. Kiyanagi, K. Kojima, K. Kusaka, S. Lee, S. Machida, T. Masuda, K. Mishima, K. Mitamura, M. Nakamura, S. Nakamura, A. Nakao, T. Oda, T. Ohhara, K. Ohishi, H. Ohshita, K. Oikawa, T. Otomo, A. Sano-Furukawa, K. Shibata, T. Shinohara, K. Soyama, J. Suzuki, K. Suzuya, A. Takahara, S. Takata, M. Takeda, Y. Toh, S. Torii, N. Torikai, N.L. Yamada, T. Yamada, D. Yamazaki, T. Yokoo, M. Yonemura and H. Yoshizawa, Materials and life science experimental facility (MLF) at the Japan proton accelerator research complex II: Neutron scattering instruments, Quantum Beam Sci. 1: ((2017) ), 9. doi:10.3390/qubs1030009.

[19] 

M. Nakamura and R. Kajimoto, General formulae for the optimized design of Fermi chopper spectrometer, JPS Conf. Proc. 1: ((2014) ), 014018. doi:10.7566/JPSCP.1.014018.

[20] 

H. Takada, K. Haga, M. Teshigawara, T. Aso, S. Meigo, H. Kogawa, T. Naoe, T. Wakui, M. Ooi, M. Harada and M. Futakawa, Materials and life science experimental facility at the Japan proton accelerator research complex I: Pulsed spallation neutron source, Quantum Beam Sci. 1: ((2017) ), 8. doi:10.3390/qubs1020008.

[21] 

A. Vickery, L. Udby, N. Violini, J. Voigt, P.P. Deen and K. Lefmann, A Monte Carlo simulation of neutron instrument resolution functions, J. Phys. Soc. Jpn. 82: ((2013) ), SA037. doi:10.7566/JPSJS.82SA.SA037.

[22] 

P. Willendrup, E. Farhi, E. Knudsen, U. Filges and K. Lefmann, McStas: Past, present and future, J. Neutron Res. 17: ((2014) ), 35–43. doi:10.3233/JNR-130004.

[23] 

P. Willendrup, E. Farhi and K. Lefmann, McStas 1.7 – a new version of the flexible Monte Carlo neutron scattering package, Physica B 350: ((2004) ), E735–E737. doi:10.1016/j.physb.2004.03.193.

[24] 

P.K. Willendrup and K. Lefmann, McStas (i): Introduction, use, and basic principles for ray-tracing simulations, J. Neutron Res. (in press). doi:10.3233/JNR-190108.

[25] 

C.G. Windsor, Pulsed Neutron Scattering, Taylor & Francis Ltd., London, (1981) .