
BerILL: The ultimate humidity chamber for neutron scattering
Abstract
We present the design and the performances of a precision humidity chamber for neutron diffraction which is the result of a very fruitful collaboration between the Helmholtz-Zentrum Berlin and the Institut Laue-Langevin. The sample temperature can be set between 10 and 85°C. The relative humidity is controlled from 10 to
1.Introduction
Neutrons are well-suited for studying biological and soft-matter samples. They are very sensitive to light elements, such as hydrogen, carbon, oxygen and nitrogen, which cover the majority of atoms found in most organic systems. Interacting with nuclei, they also have the advantage of differentiating isotopes of these atoms. The isotope effect between H and D is often exploited in diffraction as well as in incoherent scattering experiments, as the coherent scattering length changes from −3.739 fm for H to +6.671 fm for D, and the incoherent cross section from
The characteristics and behaviours of samples investigated in biological or soft-matter neutron scattering experiments are strongly coupled to the temperature and relative humidity of the surroundings. Accurate observation and control of these parameters are crucial to the success of the experiments. The currently available humidity and temperature control chambers for neutron scattering allow experimentalists to set the relative humidity at the sample by using techniques such as saturated salt solutions [4,9,19], saturated/dry gas flow and partial vapour pressure through temperature of a water reservoir [8,14].
In recent years the performance of these experimental sample environments has improved. But due to the unreliability of humidity sensors and the presence of thermal gradients resulting in unwanted condensation, these systems have been restrictive or finicky. In particular, it has been difficult to achieve relative humidity above 95% while this near-saturation regime is of special interest to the field of biological science. Biological systems are generally warm and moist, and we can get insight of their in-situ behaviour only by creating experimental conditions which closely match their natural conditions.
Many lipids spontaneously form bilayers, whose structure can be determined using neutron diffraction. The structure of a bilayer is related to the bilayer’s phase. Of particular interest is
This method allows to explore a continuous range of relative humidities with the possibility of fast changes in humidity using temperature controllers. Although the change of humidity cannot be as quick as in a gas-flow system, this technique is significantly more accurate. The temperature control technique also solves the problem of inaccurate humidity sensors above 95% RH by relying on thermometers with high accuracy.
The drawback of this method is the requirement for an environment with extreme temperature homogeneity in the water bath as well as in the sample surrounding area (±0.03°C to get ±0.1% RH at 95% RH and 30°C). Also, any cold spot (with respect to the water bath) in the sample chamber creates a condensation point and in principle a new water reservoir at an uncontrolled temperature. By effectively insulating the humidity chamber, the influence of unwanted temperature gradients and cold spots can be suppressed.
Table 1
| (a) Constants for H2O between 1 and 100°C | (b) Constants for D2O between 106 and 300°C | |||||||
| Temperature [°C] | A | B | C | Temperature [°C] | A | B | C | |
| 0–30 | 5.40221 | 1838.675 | 241.413 | 106–300 | 5.15107 | 1700.073 | 229.137 | |
| 31–60 | 5.20389 | 1733.926 | 233.665 | |||||
| 61–90 | 5.0768 | 1659.793 | 227.296 | |||||
| 71–100 | 5.08354 | 1663.125 | 227.528 | |||||
In the following sections, we present the design and performance of the new BerILL humidity chamber whose name comes from the collaboration established between the Helmholtz-Zentrum Berlin (HZB) and the Institut Laue-Langevin (ILL). BerILL is designed for neutron scattering (preferably diffraction) and exploits the temperature control technique to induce humidity on a sample with excellent accuracy and ease of control (the user only needs to request a relative humidity and sample temperature). Performances are then demonstrated with the well defined DMPC lipid bilayer [15].
2.Design
The chamber has been designed to be compatible with commonly used neutron diffraction instruments which have a large user base in biology (e.g. V1 at the HZB [11] and D16 at the ILL [6]), but with the possibility to adapt it to reflectometry, SANS, backscattering or time of flight instruments in future versions. The design has been realised with a particular focus on thermal insulation from external heat sources and ease of use. So we started from a simple double-wall geometry allowing to vacuum insulate the sample space. The dimensions were optimised in an iterative process to determine the geometry which resulted in the most stable, thermal gradient free design. Each step in this iterative design process was scrutinised using finite element simulations of thermal equilibrium and convection with the COMSOL software package [5]. Figure 1 shows how the heater placed below the goniometer allows to reduce sensibly the temperature gradient in the sample region. The distance between the water bath and the goniometer, i.e. the height of the post, was also optimised.
Fig. 1.
Finite element simulations of the design at room temperature and 40% RH. The gradient of temperature on the sample volume is cancelled when the base of the goniometer is heated.
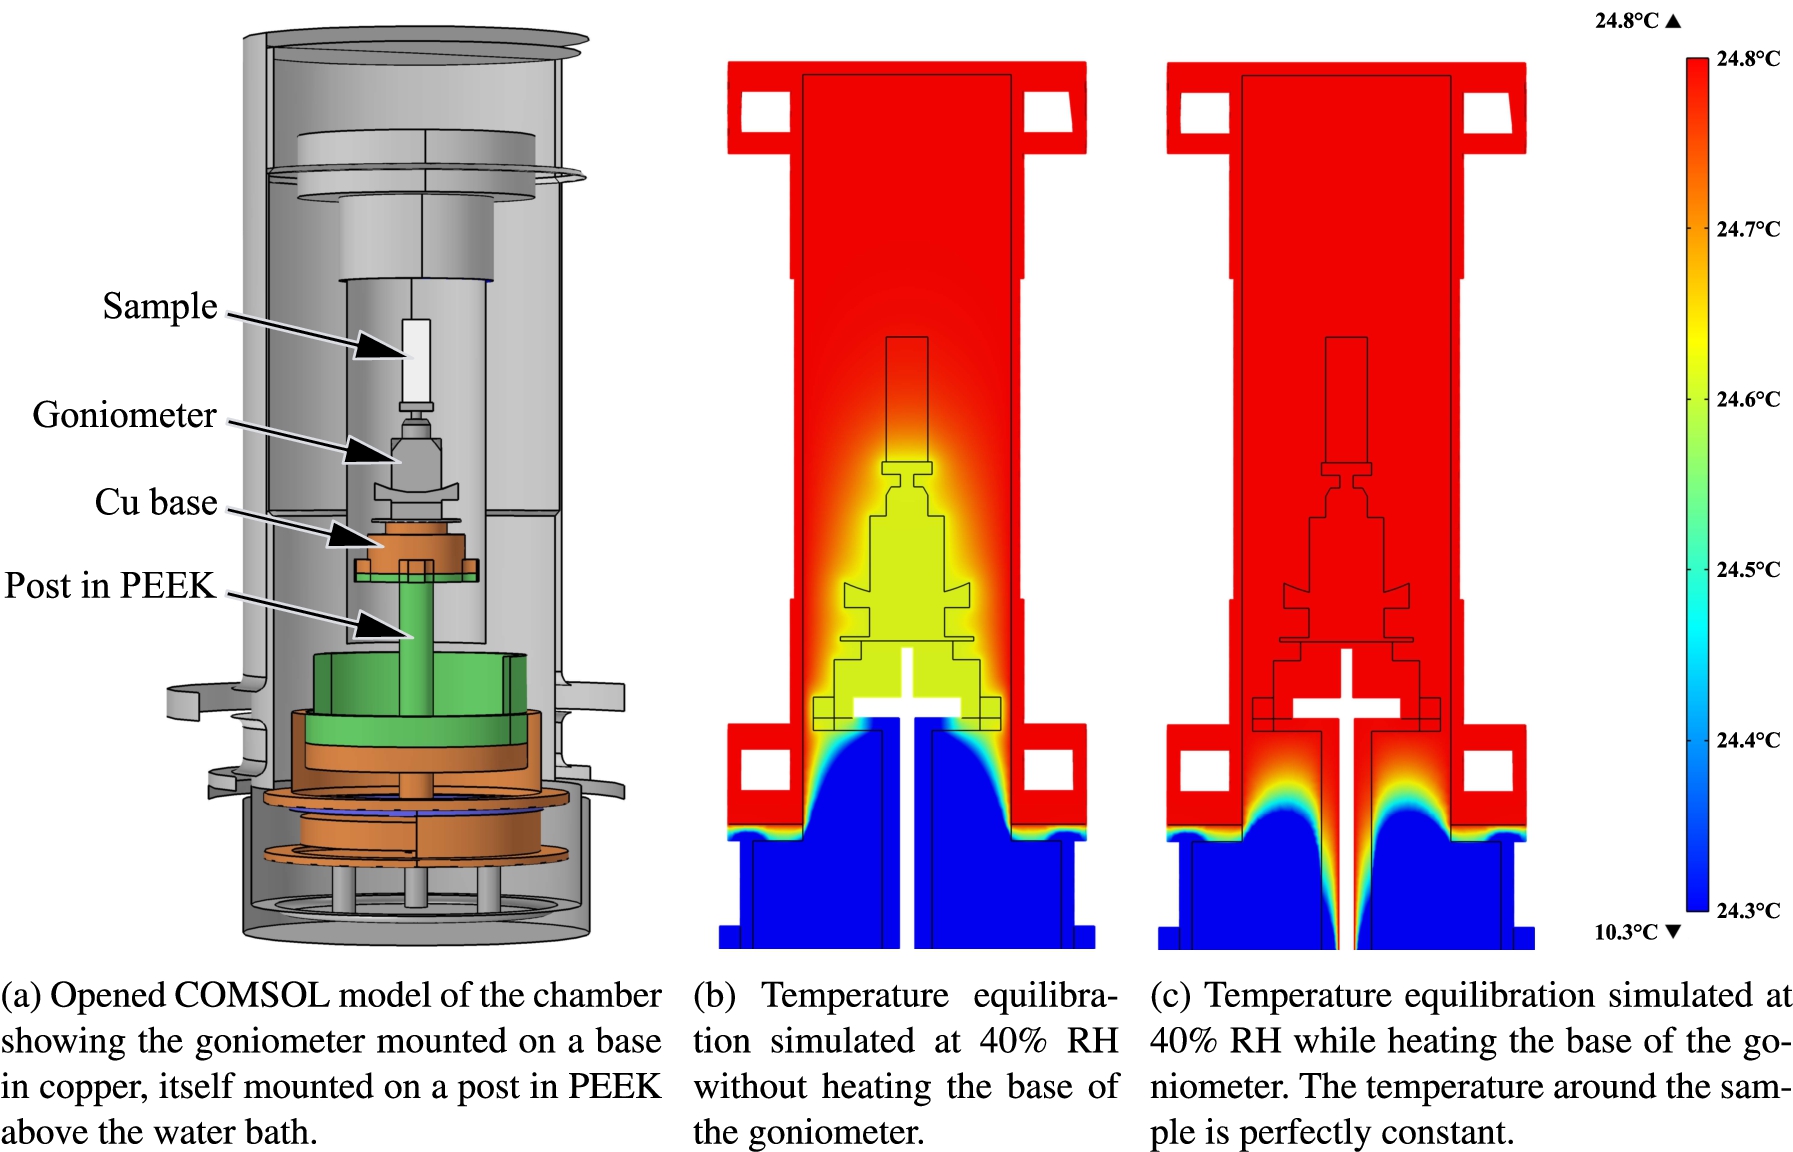
The humidity chamber shown in Fig. 2 is a double walled cylinder construction with a vacuum insulating the inner chamber. The outer and inner chambers are both split in two parts, upper and lower, to ease the access to the sample space and facilitate the operations.
The lower part, which is fixed to the sample table of a neutron diffractometer, contains the water bath and several access ports to evacuate the chamber, read the temperature of the water, read the temperature and relative humidity around the sample, read the pressure in the vacuum space and control the temperature at the base of the goniometer. The water is poured in a copper bath decoupled thermally from the sample space by using polyether ether ketone (PEEK) which has excellent mechanical and chemical resistance properties. The temperature of the bath is controlled with a first thermostatic bath. The outer vessel through which the thermostatic bath is connected is made from stainless steel to reduce the heat conduction with the upper part. The in and out connections to the bath are made through 0.08 mm thick bellows accepting thermal expansions and the mechanical mount is ensured with 3 pillars made from PEEK.
Fig. 2.
CAD design of the humidity chamber showing internal parts. The temperature of the water bath is controlled with a thermostated bath connected to the chamber base. The sample, mounted on a goniometer insulated from the water bath, is thermalised with a second thermostated bath connected at the top of the chamber.
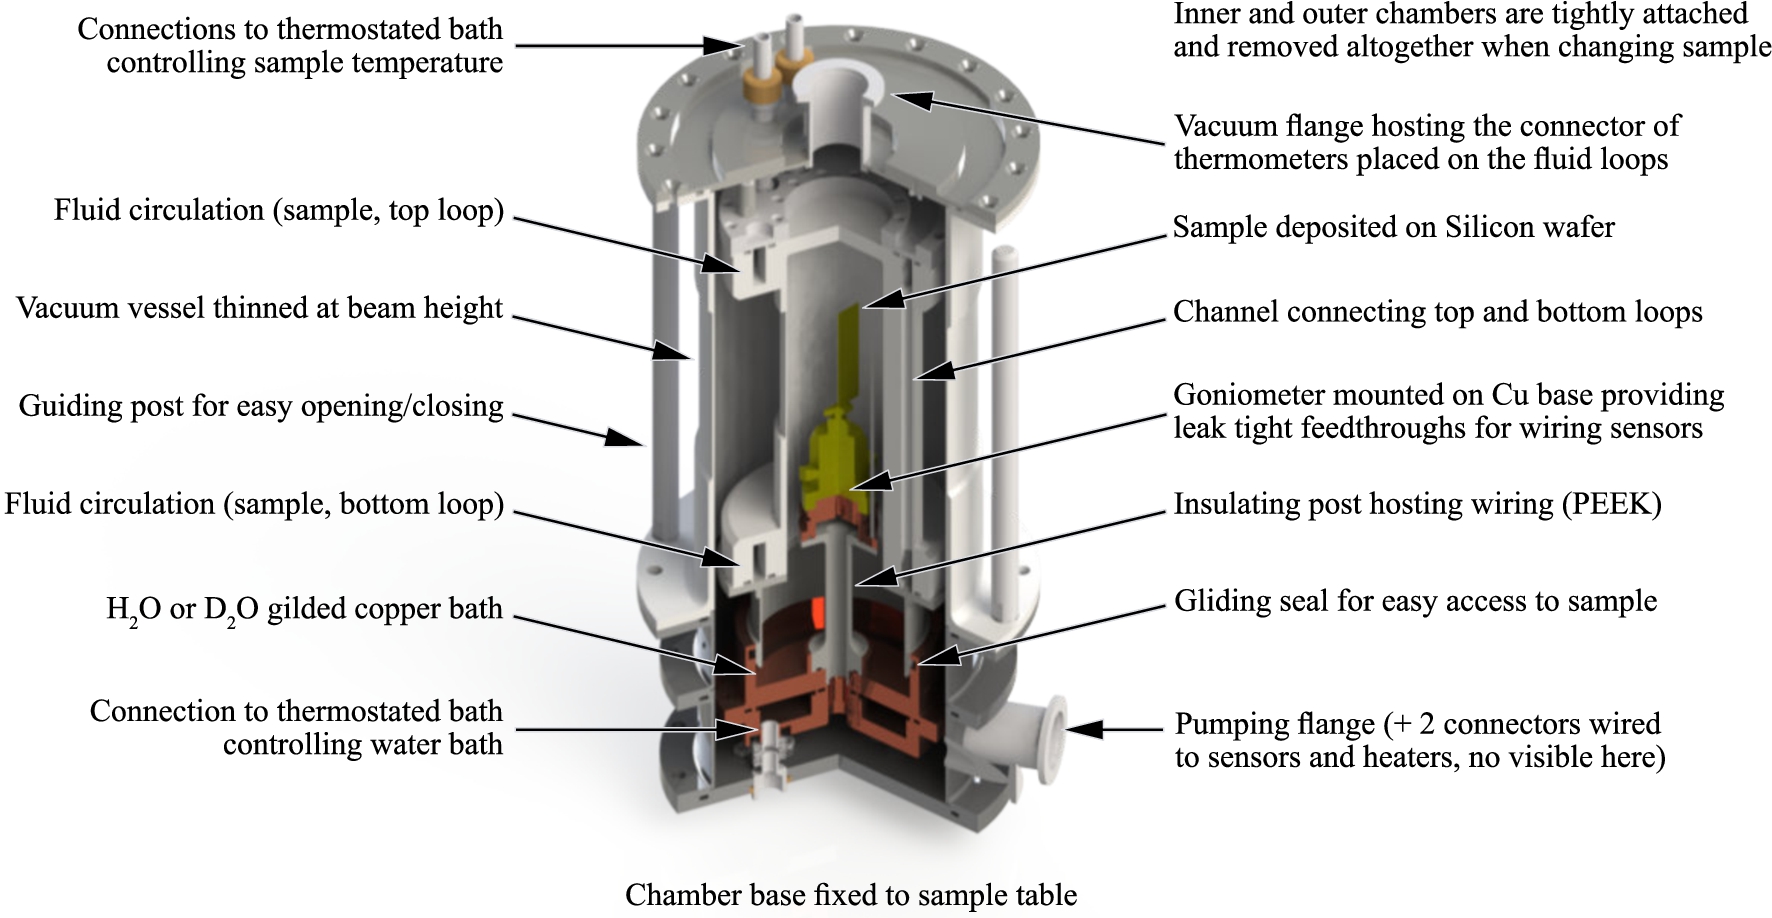
The upper part of the humidity chamber is removable to provide a quick access to the sample: the inner and outer chambers are permanently attached to the top flange and the whole upper part can therefore be removed in one go. The upper part controls the sample temperature with a thermostatic bath between 10 to 90°C with highest homogeneity across the sample area. Because simulations revealed a potentially very slightly lower temperature at the bottom of the sample (a few 1/100°C), a resistive heater and a thermometer are introduced in the copper base plate onto which a standard Huber manual goniometer is fixed [13]. According to the simulations (Fig. 1), this should allow to control the temperature in the sample volume with an accuracy better than ±0.002°C, corresponding to a theoretical stability in the relative humidity of
The lower and upper parts need to be thermally insulated as well as possible while simultaneously allowing a fast gas exchange for short humidity equilibration times. Therefore, from COMSOL simulations, the ⌀80 mm bath surface and the cross-section for gas exchange have been increased as much as possible with respect to the thermal isolation performance needed to avoid unwanted gradients and resulting inhomogeneities in the humidity across the sample area. The sample was also placed at an optimum distance from the bath with a post also made from PEEK.
The effective sample volume is a ⌀20 mm × 40 mm cylinder. The total horizontal and vertical angular accesses are respectively 300° and 35°. The sample alignment can be done in place optically with the goniometer and a laser. Closing the chamber is performed by lowering the upper part of the cell on the bottom part containing the sample and the water bath. A gliding seal seals the inner chamber against the insulating vacuum and the closing procedure is simplified by two guiding posts which prevent contact between the upper part of the chamber and the sample and sensors. If necessary, the entire cell can be stored away from the instrument during stabilisation and reassembled in the same mechanical position.
All parts inside the sample space including sensors and wiring are protected from corrosion by coatings from PTFE (wires, sensors), gold plating (Cu parts) and anodisation (Al parts) where necessary. Temperature, pressure and humidity sensors are mounted near the sample in the 60° dark angle of the humidity chamber. The wires penetrate the vacuum space of the chamber in the lower part and reach the sample space through the insulating post onto which the goniometer is placed. Leak tight feedthroughs made in the copper base allow wires to enter the sample space in the dark angle of the cell.
3.Construction
3.1.Mechanical components
Figures 3 and 4 present respectively drawings and photos of the cell. The sectional view A-A shows the internal parts and sectional views B-B and C-C present in detail the circuitry of the fluids delivered by the two thermostated baths. The overall dimensions without support are ⌀180 × 480 mm.
Fig. 3.
Drawings of the humidity chamber produced with SolidWorks [7]. Sectional view A-A shows the interior of the cell and sectional views B-B and C-C show respectively details of the circuitry of the upper (sample) and lower (water bath) parts of the chamber.
![Drawings of the humidity chamber produced with SolidWorks [7]. Sectional view A-A shows the interior of the cell and sectional views B-B and C-C show respectively details of the circuitry of the upper (sample) and lower (water bath) parts of the chamber.](https://ip.ios.semcs.net:443/media/jnr/2019/21-1-2/jnr-21-1-2-jnr190109/jnr-21-jnr190109-g003.jpg)
The inner chamber hosting the sample and driving the fluid from top to bottom and then to the top is machined from a single rod of hard aluminium EN AW 5754 (Fig. 4(a)). As for the lower part of the cell, the in and out fluid connections are performed through 0.08 mm thick bellows accepting thermal expansions and the mechanical mount of the inner chamber is ensured with 3 pillars made from PEEK. To reduce the neutron background and keep a good neutron transmission, the thickness of the wall is reduced to 0.5 mm at the beam height. The top and bottom ends of this central part are tightly closed with respectively stainless steel and PEEK flanges on O-rings. The use of stainless steel decouples thermally the inner chamber from the outer vessel. The PEEK flange which will be introduced into the top of the water bath when closing the chamber is mechanically strong enough to ensure a good tightness and prevent thermal conduction with the water bath.
On Fig. 4(a), the small central top flange is closed with a tap but was later used for installing a Jaeger connector allowing to read temperature sensors glued with GE varnish to the top and bottom ends of the inner chamber where the fluid circulates. The insert shows details of the fluid circuitry before assembly. A 30 μm foil of aluminium was then wrapped around the central part to screen the radiation of the outer vessel and further reduce the gradient of temperature.
Fig. 4.
Photos of humidity cells built during this project. Inner chambers as the one shown in photo (a) are mounted inside the upper part of the cells shown at the right of photo (b). The inset in (b) shows the detailed assembly of the sensors placed in the dark angle.
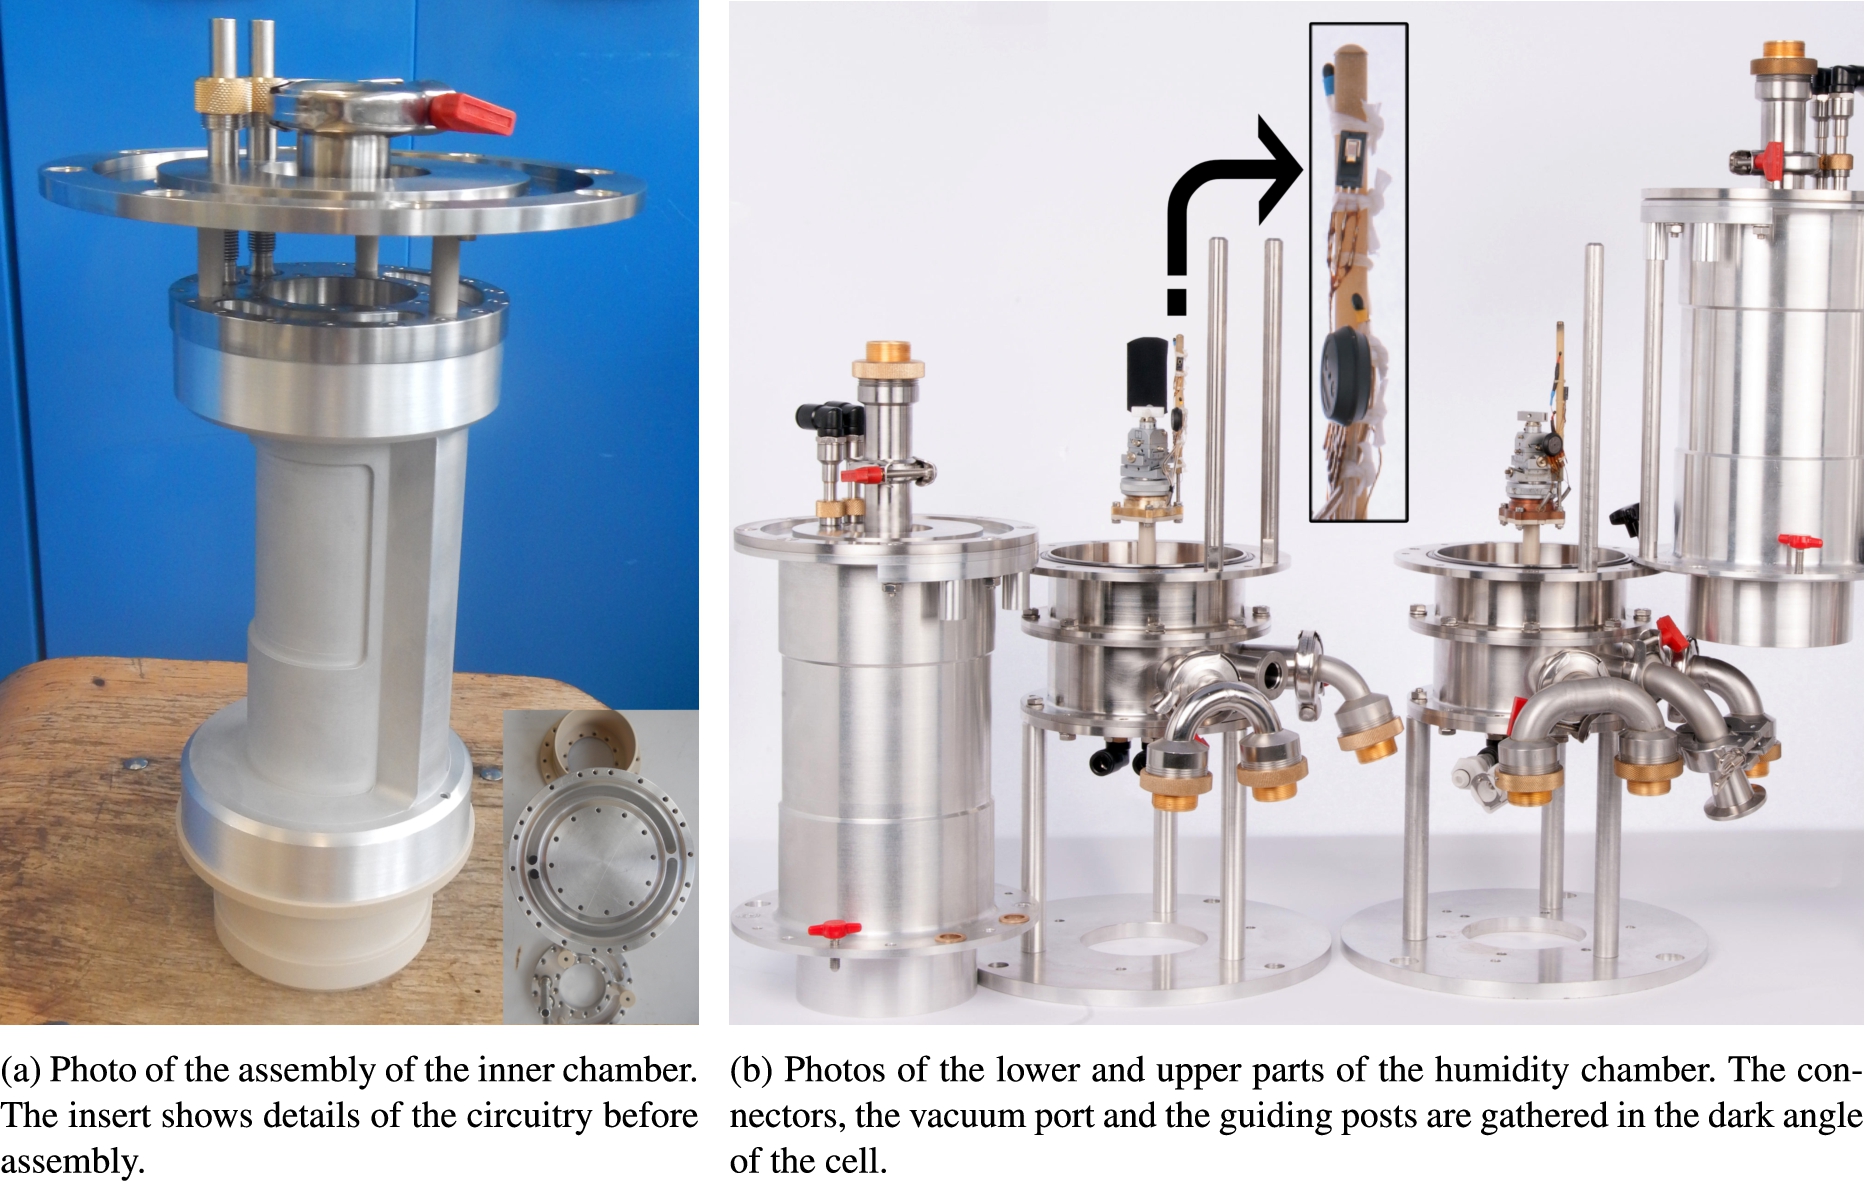
The lower part of the humidity chamber (Fig. 4(b)-left) is a little tricker to assemble because of the installation of the wiring in a tiny space. All wires, except those of the thermometer of the bath, are inserted in the central post. Six wires are used to power the heater and read the temperature inside the copper base. The others are used to measure the sample environmental conditions (p, T and
3.2.Humidity control
To reach the required temperature precision, we employ precision thermistor resistances Omega TH-44007-40-T (5 kΩ @ 25°C) [18] recalibrated to reach an absolute precision of ±0.025°C on the range 0 to 90°C (i.e.
To observe the equilibration times of the relative humidity in the cell, we use an Honeywell HIH-4000 humidity sensor of
Fig. 5.
The relative humidity in the chamber is precisely controlled with temperature sensors and its equilibration is determined with a humidity sensor.
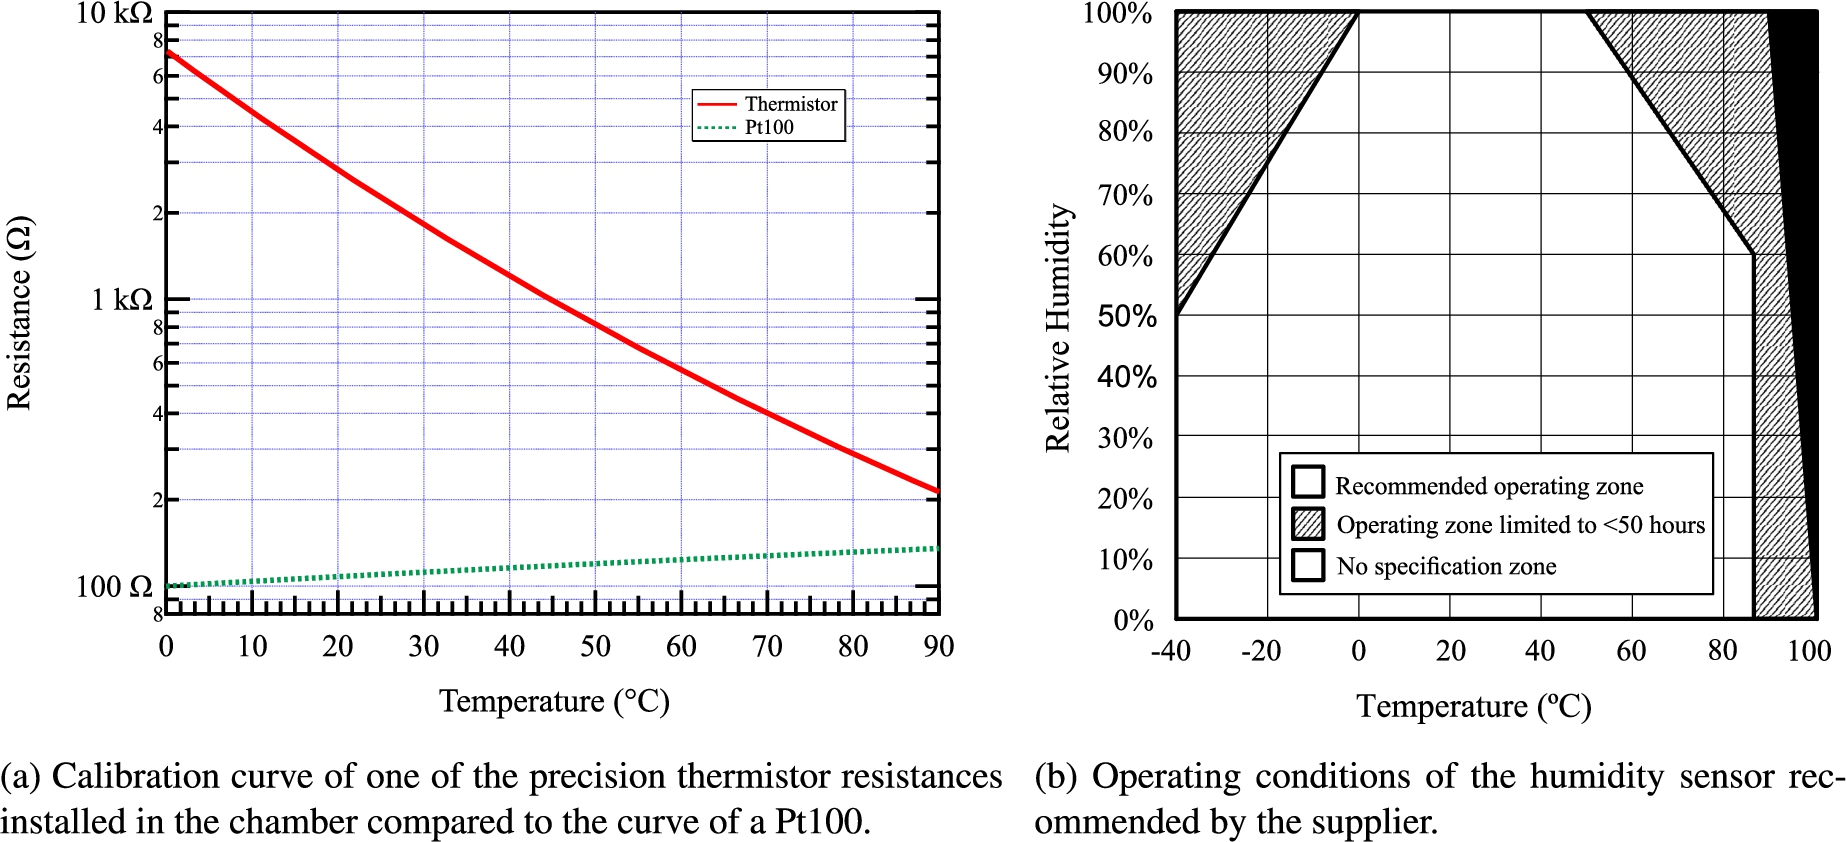
Fig. 6.
The heat brought by the humidity sensor generates a gradient of temperature across the sample of ≈0.27°C at 30°C. This leads to a shift of the relative humidity by ≈0.9% at that temperature. We therefore decided to power the sensor continuously only above 50°C to prevent the saturation of the sensor and when the heating effect becomes less important. We can see at the right of the graph that the temperature gradient is less than 0.005°C when the humidity sensor is not powered.
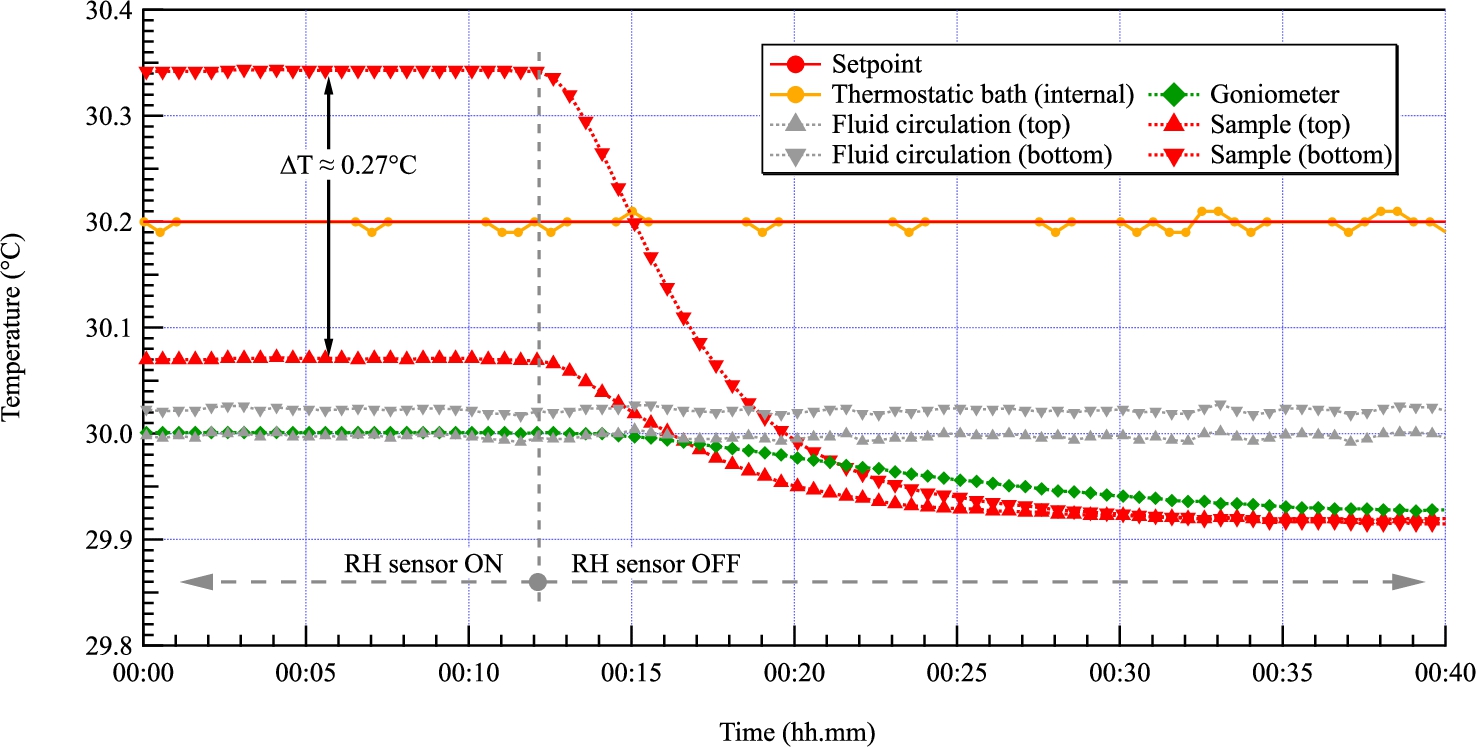
As shown in Fig. 6, this sensor brings heat locally, to a point where it creates a temperature gradient
Fig. 7.
Evolution of the relative humidity at 30°C with (left) and without (right) employing the overshoot technique. The humidity sensor is shifted by several % as expected from the sensor performance specifications.
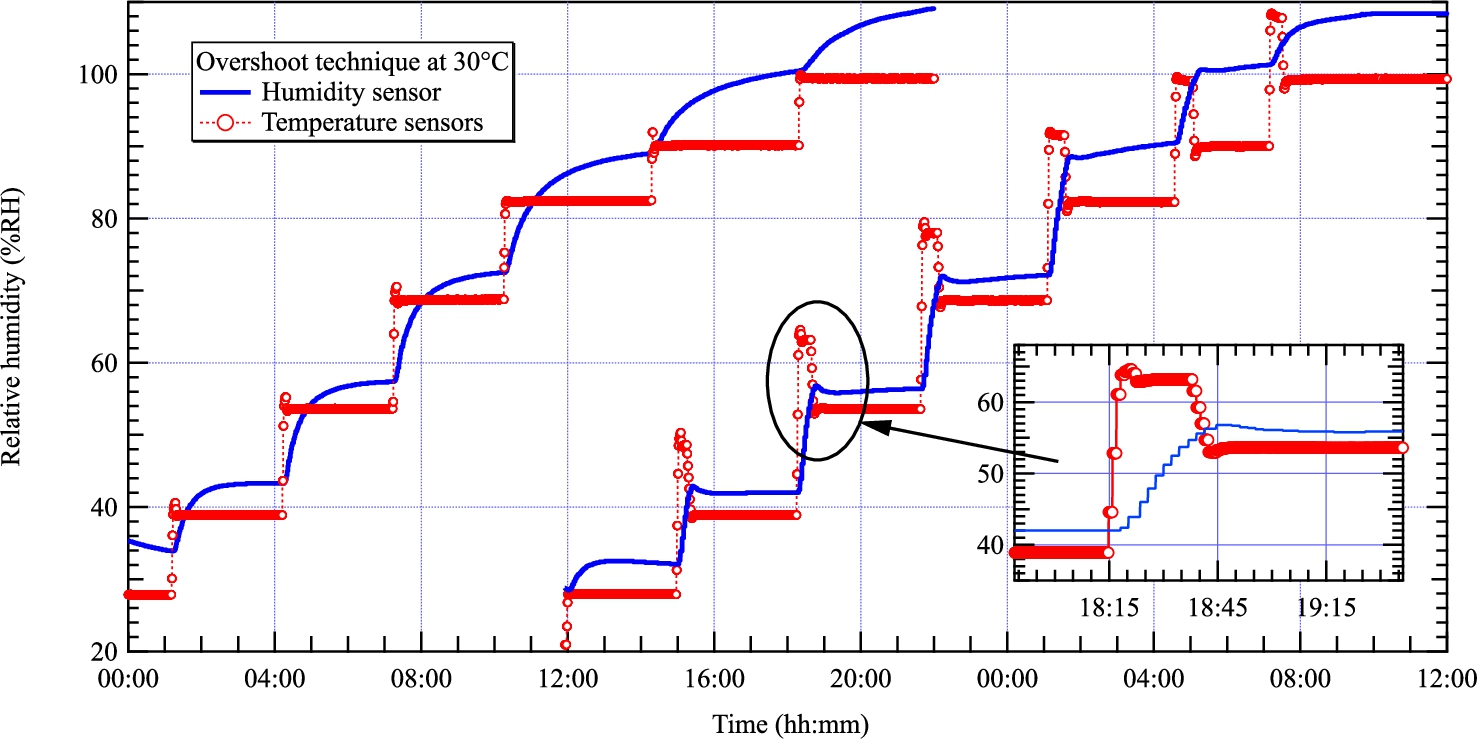
During the commissioning, we have observed relatively long equilibration times but tested successfully the overshoot technique. Figure 7 shows the evolution of the relative humidity in the same cell recorded with (left) and without (right) using the overshoot technique (curves are close together for helping the reader). The continuous blue lines correspond to values measured by the humidity sensor and the dotted red lines are deduced from equation (3) and temperature sensor readings. The curves on the left show that the equilibration time increases with the humidity from about 2 to 6 hours. On the right, the temperature setpoints are overshot by 10% RH at the beginning of each step and set to wanted values when the sensor reaches that value. As can be seen in the inset of Fig. 7, the equilibration times are strongly reduced and range between 20 minutes and 1 hour, i.e. about 6 times faster.
As expected, we also observed a slight difference between the sample temperature and temperature set into the thermostated bath controller (we use 5 m long pipes on the experimental area). To reduce it, we tried to exploit the internal PID of the thermostatic bath by connecting a sample thermometer to the controller of the thermostatic bath. This did not improve the situation because of the concurrent inertia of the two systems. We therefore decided to let the user correct the sample temperature setpoint of the thermostatic bath if needed.
Finally, to check the pressure in the cell, we measure the absolute pressure within ±30 mbar with a Freescale Semiconductor MPX4200A series sensor which integrates on-chip, bipolar op amp circuitry and thin film resistor networks and provides a high level analog output signal and temperature compensation.
4.Performance
In order to quantify the absolute precision of the humidity chamber, we have measured the d-spacing of DMPC (1,2-dimyristoyl-sn-glycero-3-phosphocholine) and DOPC (1,2-dioleoyl-sn-glycero-3-phosphocholine) lipid molecules with the neutron diffractometers D16 (ILL) and V1 (HZB) at different temperatures and relative humidities [6,11]. During the first tests, with the beam time available, a maximum d-spacing of only 52.3 Å could be achieved at 30°C with DMPC, which corresponds to a maximum relative humidity of ≈99% according to [15].
Fig. 8.
Bragg reflections from a DOPC lipid bilayer at 20°C (right). Calculated d-spacings of each measurement are shown on the left up to 99.9% RH. Above a d-spacing of 59 Å splitting occurs, which may indicate two domains in the sample.
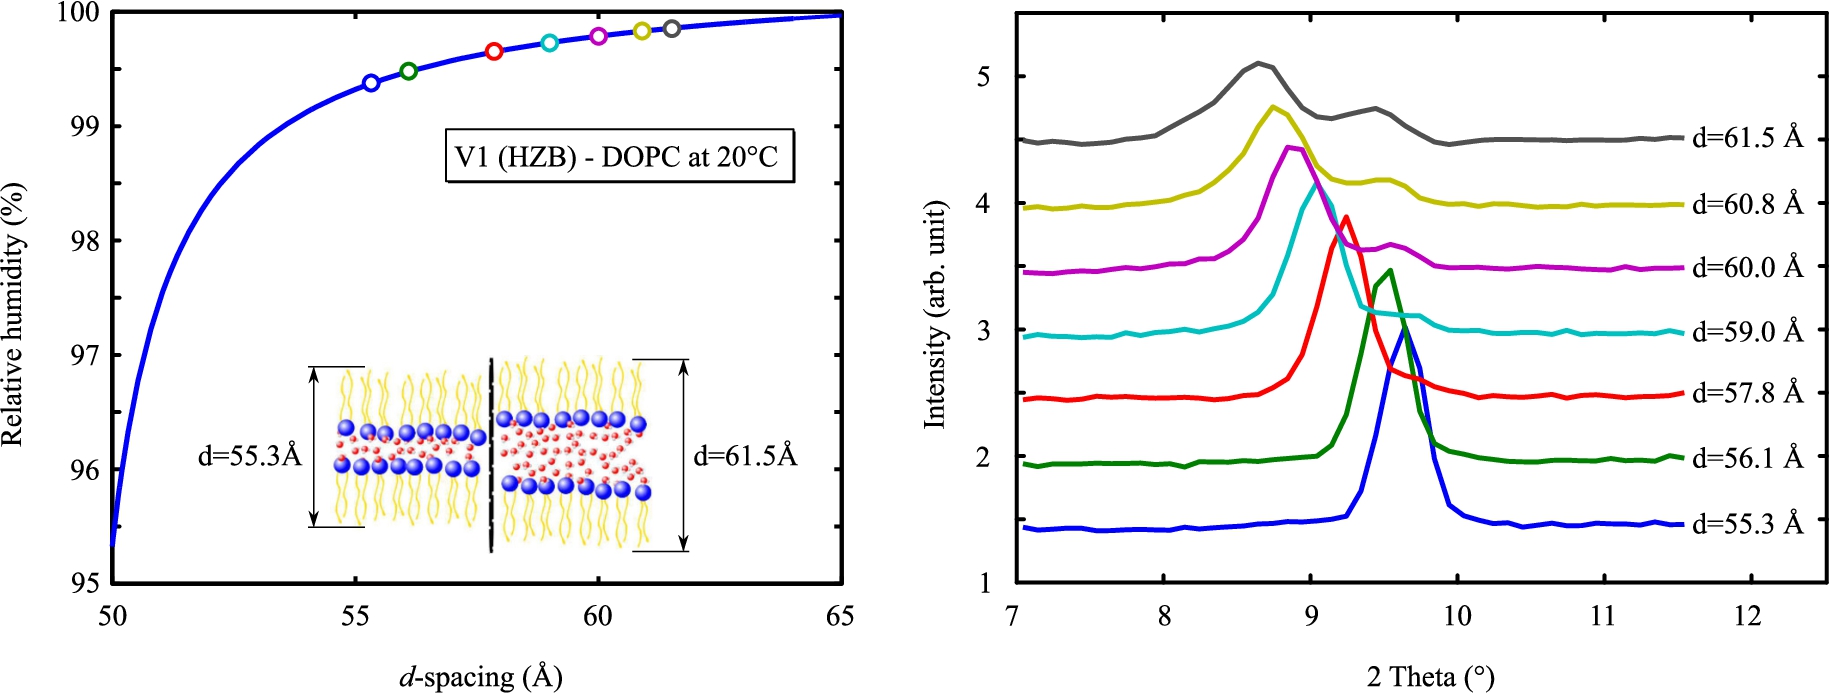
To overcome the slowness with which these lipids absorb water, we mounted the sample on an aluminium block in thermal contact with the cold side of Peltier elements to speed up changes of the environmental conditions (in place of the goniometer). The sample holder and details of the experiments are described in the PhD manuscript of one of the authors [2]. The measurements were conducted on V1 (HZB) with a DOPC bilayer sample which begins drastic swelling at a lower humidity than DMPC. As can be seen in Fig. 8, we controlled the relative humidity up to 99.9% but a curve splitting occurred above 59 Å indicating the presence of two domains in the sample. This may come from the operation of the two Peltier elements: the sample is cooler by a few 0.001°C on one side, causing a phase separation.
Fig. 9.
Evolution of the d-spacing of DMPC measured by neutron diffraction at 30°C in the gel phase. Steps of 15% RH are completed in about 30 minutes using the overshoot technique. The inset shows the measured Bragg peaks when the relative humidity was 53.6% RH.
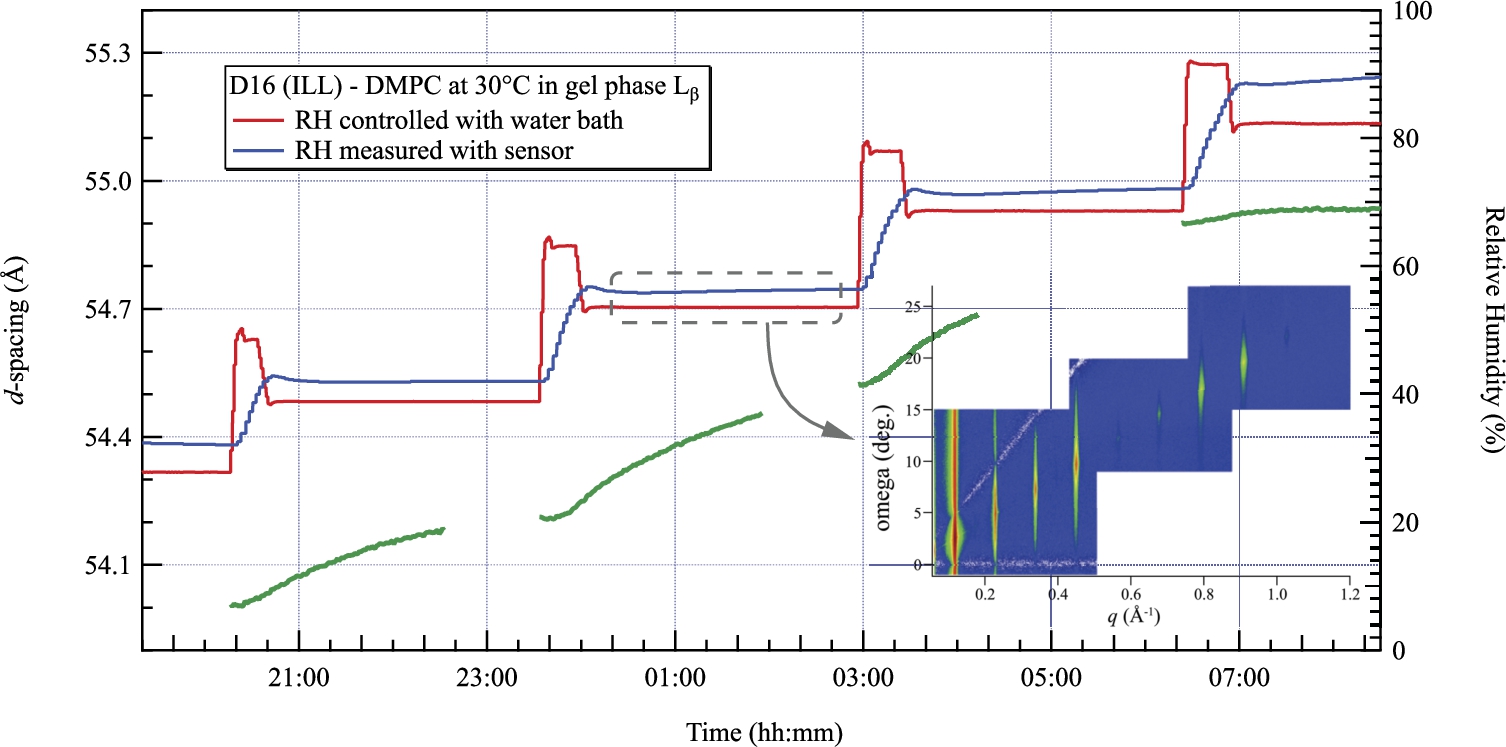
We then performed a new series of measurements on D16 (ILL). Figure 9 presents the evolution of the d-spacing of DMPC with the relative humidity at a constant temperature of 30°C. The red curve corresponds to the humidity deduced from the control of the temperature of the water bath and the blue curve to the value measured with the humidity sensor. The sensor always measures larger values but remains within the tolerance provided by the supplier. During these tests, the DMPC was in the gel (
Fig. 10.
d-spacing of DMPC measured by neutron diffraction at 30°C and 97% RH. The left and right curves are obtained by controlling the relative humidity with the water bath and a saturated salt of K2SO4 respectively. The inset shows the evolution of the diffraction pattern with time. The transition from the gel phase
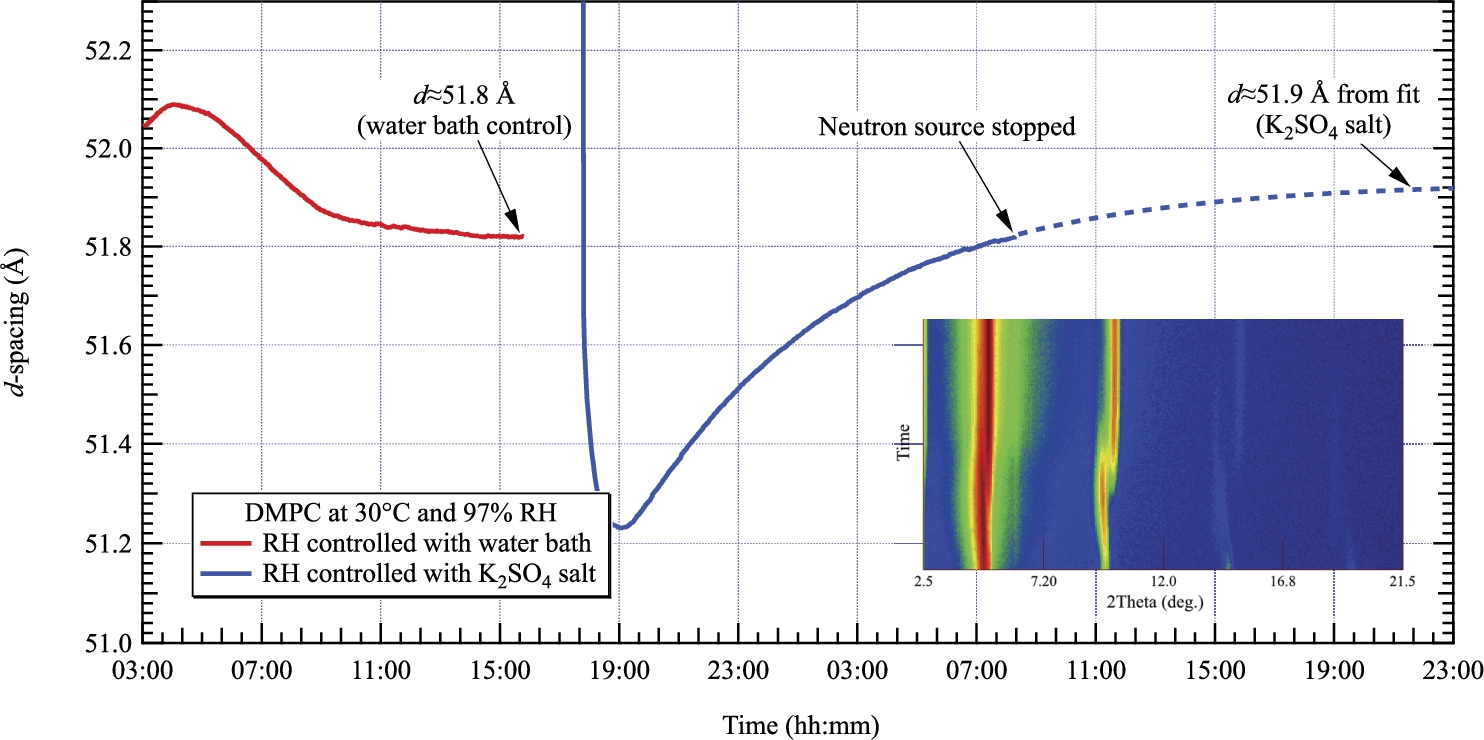
As shown in Fig. 10, we then requested a relative humidity of 97% by controlling the temperature of the water bath and measured
Fig. 11.
Collection of d-spacings of DMPC measured by neutron diffraction at 30°C from 27.5 to 99.9% relative humidity. The opened markers correspond to the gel phase
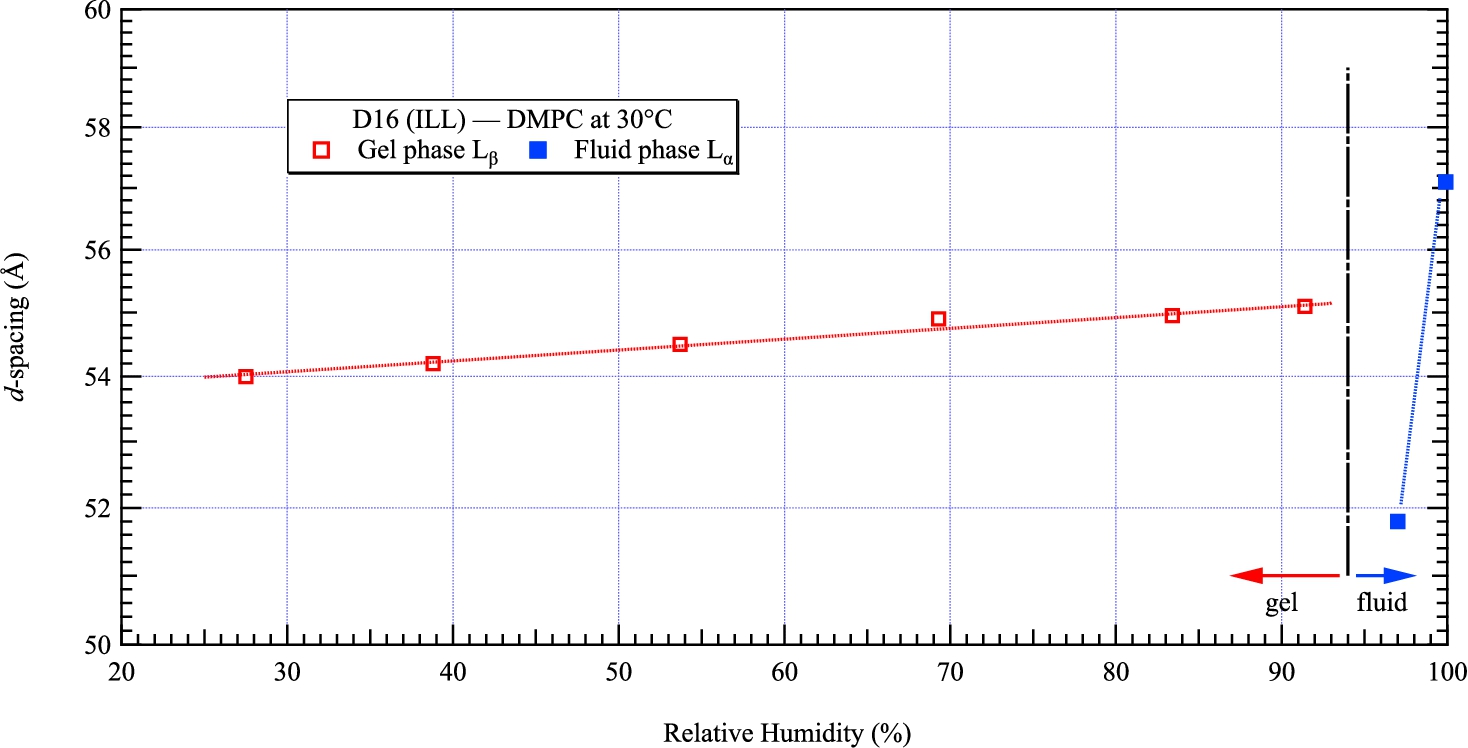
The ultimate test consisted in measuring the d-spacing at the highest possible relative humidity. We tuned the chamber to 100% RH and stored the cell aside for one day until we remeasure the d-spacing on D16. We fitted a distance of 57.1 Å which corresponds to a relative humidity of 99.9% according to [15]. The d-spacings of DMPC presented above, measured from 27.5 to 99.9% RH, are gathered in Fig. 11 and follow the phase diagram published in [21].
5.Conclusion
We have designed a precision humidity chamber for neutron diffraction allowing to maintain a ⌀20 mm × 40 mm3 sample at any temperature between 10 and 85°C in a relative humidity between 10 to 100% (this range is obviously reduced at the lowest temperatures). This relative humidity is created with a water reservoir (H2O or D2O) regulated at a temperature deduced from Antoine’s equation. The sample space is thermally decoupled from the water bath and the experimental environment. This allows the control of relative humidity up to 99.9% with an accuracy of ±0.01% RH.
Today, one humidity chamber is available at the HZB and three identical chambers are available at the ILL on D16 where d-spacings can be measured after short or long equilibration times. Sample alignement can be performed off-line with a laser mounted on an optical bench, and equilibration can be started with no need to access the neutron beam. Future modified designs of this chamber are foreseen for other neutron techniques, in particular small angle scattering and reflectometry.
Acknowledgements
The authors thank the technical staff at Helmholtz-Zentrum Berlin, Forschungsneutronenquelle Heinz Maier-Leibnitz (FRM II) and Institut Laue-Langevin for the beam-time and support during the experiments, and ILL for the travel grant, and the DFG for financial support.
This project has received funding from the European Union’s 7th Framework Programme for research, technological development and demonstration under the NMI3-II Grant number 283883.
References
[1] | C. Antoine, Tensions des vapeurs; nouvelle relation entre les tensions et les températures, Comptes Rendus des Séances de l’Académie des Sciences 107: ((1888) ), 681–684. |
[2] | M. Barrett, Structure and dynamics of model lipid membranes, Humboldt-Universität zu Berlin, Mathematisch-Naturwissenschaftliche Fakultät, 2016. |
[3] | A. Bridgeman and E.W. Aldrich, Vapor pressure tables for water, Journal of Heat Transfer 86: (2) ((1964) ), 279–286. doi:10.1115/1.3687121. |
[4] | A. Carotenuto and M. Dell’Isola, An experimental verification of saturated salt solution-based humidity fixed points, International Journal of Thermophysics 17: (6) ((1996) ), 1423–1439. doi:10.1007/BF01438677. |
[5] | COMSOL Multiphysics 4.2, Computer-aided engineering, Finite element analysis, 2011, https://www.comsol.com. |
[6] | V. Cristiglio, B. Giroud, L. Didier and B. Demé, D16 is back to business: More neutrons, more space, more fun, Neutron News 26: (3) ((2015) ), 22–24. doi:10.1080/10448632.2015.1057051. |
[7] | Dassault Systèmes, SolidWorks 3D CAD, 2016, https://www.solidworks.com. |
[8] | B. Demé, C. Cataye, M.A. Block, E. Maréchal and J. Jouhet, Contribution of galactoglycerolipids to the 3-dimensional architecture of thylakoids, The FASEB Journal 28: (8) ((2014) ), 3373–3383. doi:10.1096/fj.13-247395. |
[9] | L. Greenspan, Humidity fixed points of binary saturated aqueous solutions, Journal of Research of the National Bureau of Standards Section A: Physics and Chemistry 81A: (1) ((1977) ), 89–96. doi:10.6028/jres.081A.011. |
[10] | T.A. Harroun, H. Fritzsche, M.J. Watson, K.G. Yager, O.M. Tanchak, C.J. Barrett and J. Katsaras, Variable temperature, relative humidity (0%–100%), and liquid neutron reflectometry sample cell suitable for polymeric and biomimetic materials, Review of Scientific Instruments 76: (6) ((2005) ), 065101, ISSN 00346748. doi:10.1063/1.1921550. |
[11] | T. Hauß, V1: Membrane diffractometer at BER II, Journal of large-scale research facilities JLSRF 2: (0) ((2016) ), 94. doi:10.17815/jlsrf-2-97. |
[12] | Honeywell Humidity Sensors, HIH-4000 Series, 2019. https://sensing.honeywell.com/sensors/humidity-sensors/HIH-4000-series. |
[13] | HUBER Diffraction and Positioning Equipment, Manual goniometer heads, 2016, http://www.xhuber.de/. |
[14] | M. Kanduč, A. Schlaich, A.H. de Vries, J. Jouhet, E. Maréchal, B. Demé, R.R. Netz and E. Schneck, Tight cohesion between glycolipid membranes results from balanced water–headgroup interactions, Nature Communications 8: ((2017) ), 1–9. doi:10.1038/ncomms14899. |
[15] | N. Kucerka, Y. Liu, N. Chu, H.I. Petrache, S. Tristram-Nagle and J.F. Nagle, Structure of fully hydrated fluid phase DMPC and DLPC lipid bilayers using X-ray scattering from oriented multilamellar arrays and from unilamellar vesicles, Biophysical Journal 88: (4) ((2005) ), 2626–2637. doi:10.1529/biophysj.104.056606. |
[16] | C.-T. Liu and W.T. Lindsay, Vapor pressure of deuterated water from 106 to 300.deg, Journal of Chemical and Engineering Data 15: (4) ((1970) ), 510–513. doi:10.1021/je60047a015. |
[17] | Omega, Saturated salt solutions, 2016, https://www.omega.com/temperature/Z/pdf/z103.pdf. |
[18] | Omega Precision Thermistor Elements, 44000 Series, 2019, https://www.omega.com/prodinfo/thermistor.html. |
[19] | Organisation Internationale de Métrologie Légale, International recommandation, In: The Scale of Relative Humidity of Aircertified Against Saturated Salt Solutions, Bureau International de Métrologie Légale, OIML R 121, pp. 1–12. |
[20] | V.F. Sears, Neutron scattering lengths and cross sections, Neutron news 3: (3) ((1992) ), 26–37. doi:10.1080/10448639208218770. |
[21] | G.S. Smith, E.B. Sirota, C.R. Safinya and N.A. Clark, Structure of the |


