
Nociceptive Pain in Patients with Neuromuscular Disorders: A Cross-Sectional Clinical Study
Abstract
Background:
Muscle pain is a common symptom in patients with neuromuscular disorders (NMD) and accounts for severely reduced quality of life. OBJECTIVE: This clinical study aimed to observe possible differences in pain prevalence among distinct NMDs and to determine whether the patients’ nociceptive pain is influenced by gender, muscle strength and psychological factors and to examine potential pain-associated alterations in muscle properties.
Methods:
The cross-sectional study on nociceptive pain in various NMDs involved patient-reported outcomes, muscle strength evaluations (dynamometry and quick motor function test (QMFT)), nociceptive pain evaluations (muscular pressure pain threshold (PPT)), and non-invasive measurement of muscle stiffness, frequency, decrement, relaxation, and creep (myotonometry).
Results:
Involving 81 NMD patients and a control group, the study found high variability in pain prevalence among the subgroups. Patients with DM2 and FSHD had significantly higher levels of pain prevalence compared to other examined NMD subgroups and the control group. Female gender, high fatigue levels (representing factors such as depression, anxiety, stress, and impairment of quality of life), and low QMFT scores (representing reduced muscle strength) showed an association with increased sensitivity to pressure pain in the arm and leg region. As assessed by myotonometry, less pain is experienced in neck muscles with a high muscle tone, high stiffness, and a short relaxation time highlighting the importance of intrinsic muscular tone for their pressure pain sensitivity.
Conclusion:
Individualized therapeutic concepts including psychological and physical approaches in the pain management of patients with NMDs, especially in women, should be considered. Further research in this field is necessary to gain a more detailed insight into the perception of muscle pain.
INTRODUCTION
The estimated prevalence of pain and fatigue in patients with neuromuscular disorders (NMD) ranges from 30–90% but without differentiation, whether pain is directly associated with muscle disease or secondary due to muscular-skeletal problems [1]. Results of surveys indicate that pain, as a common secondary problem in patients with NMD, has a major impact on their quality of life [2–5]. In some neuromuscular diseases, musculoskeletal pain manifests as one of the initial symptoms, while in others, pain gradually develops as the disease progresses. Findings in pain research are often difficult to compare. The heterogeneity across clinical studies, methods, patient cohorts, and research objectives may explain the substantial variability in pain prevalence, intensity, characteristics, and factors influencing the pain.
Pain perception is individual, very heterogeneous, and based on a complex interaction of exogenous and endogenous influences. Some factors may exert a direct influence on pain. Our previous paper described a correlation between muscle pain and muscle weakness in patients with spinal muscular atrophy (SMA) type 3 [6]. We also found gender differences modifying the perception of pain, which is already described in literature [7, 8]. Surveys conducted by Solbakken et al. in late-onset Pompe disease (LOPD) patients [4] and Moris et al. in facio-scapulo-humeral muscle dystrophy (FSHD) patients [9] also corroborate gender disparities in pain perception within the context of neuromuscular diseases. Individual pain perception is additionally influenced by psychological processes, including cognitive setting, emotions (anxiety, depression, stress, positive feelings), and coping strategies (e.g. avoidant behavior) [10]. Enax-Krumova et al. [11] described a correlation between relevant depression and anxiety symptoms and the intensity of pain in LOPD patients. All these factors contribute to a complex pain perception system that is currently not fully understood.
The aim of this explorative, cross-sectional clinical pilot study was to observe possible differences in prevalence, localization, intensity and characteristics of muscle pain among the various examined neuromuscular diseases. The second objective was to determine whether the patients’ nociceptive pain (assessed by pressure pain threshold PPT) is influenced by gender, muscle strength and psychological factors. Further secondary objective was to examine whether muscle pain of the neck muscles is associated with alterations in muscle frequency, stiffness, relaxation, and creep (assessed by myotonometry).
MATERIAL AND METHODS
Adult patients (aged≥18 years) with genetically confirmed neuromuscular diseases and the ability to perform study-related functional tests were enrolled in this study. Patients with the following neuromuscular diseases were included in the study: spinal muscular atrophy type 3 (walkers), late-onset Pompe disease (LOPD), myotonic dystrophy type 1 (DM1), myotonic dystrophy type 2 (DM2), and facio-scapulo-humeral muscle dystrophy (FSHD). Healthy participants were examined as a control group. Because of possible interferences between major depression symptoms and pain, patients with a Beck depression inventory- fast screen score > 3 at screening were excluded from study participation. Other exclusion criteria were participation in another clinical study or the use of an investigational treatment. Also, patients unable to adhere to the requirements of the study, e.g., inability to complete questionnaires due to limited decision-making capacity, language barriers, or organizational difficulties were excluded from this study. All patients were enrolled during their ambulatory or stationary stay at the neuromuscular expert center Friedrich-Baur-Institute at the LMU Munich, Germany, or were invited online through the German patient organizations (Deutsche Gesellschaft für Muskelkranke e.V.). The study was approved by the ethics committee of the LMU Klinikum, Project No. 20-0980, and the protocol was registered on a public clinical trials registry (ClinicalTrials.gov Identifier NCT04907162). Written informed consent to participate in the study was obtained before any study-related procedure.
Detailed methods are described in our previous paper [6]. Summarized, patients' disease-related history and perceived pain, including quality-of-life-related information, was collected. Therefore, we used a battery of questionnaires consisting of the Brief Pain Inventory (BPI), the Fatigue severity scale (FSS) and the German Pain Questionnaire (GPQ), which included the Marburg Questionnaire (MFHW) and the Depression, Anxiety and Stress Scale (DASS). The short form of the BPI thematizes the distribution and intensity of pain as well as the functional limitation due to the pain in the past 24 hours [12]. To assess a possible contributing fatigue, we included the FSS, which measures the severity of fatigue and its effect on persons’ activities. A detailed description of pain was evaluated with the German Pain Questionnaire (GPQ), including pain sites, duration, intensity, pain-relieving and aggravating conditions, and subjective pain perception [13]. The GPQ includes the MFHW and the DASS. The MFHW was used to assess habitual well-being about perceived pain [14]. The DASS is a brief and reliable questionnaire to describe the likelihood of the presence of a depressive disorder, an anxiety disorder, or an increased stress load [15].
Musculoskeletal strength was assessed by the MRC scale (Medical Research Council scale) and dynamometry. A 6-minute walk test (6MWT) and a Quick Motor Function Test (QMFT) were performed to examine the patient’s physical function and muscular endurance. To quantify local nociceptive pain, we used a pressure algometer to measure the pressure pain threshold (PPT) in different muscles. For the non-invasive measurement of muscle fibers’ characteristics, myotonometry was performed using the commercially available MyotonPro® [16]. The tip of the MyotonPro® is placed perpendicular to the underlying muscle. Applying a slight preloaded pressure of 0.18 N initiates compression of the superficial subcutaneous tissue, causing oscillation. This oscillation leads to a brief deformation of the muscle underneath. An acceleration sensor now analyzes the vibration behavior of the muscle (see below). The device calculates the tone of the muscle (in Hz), the stiffness of the muscle (in N/m), the relaxation time after deformation (in ms), and the creep, which puts in relation the relaxation time to the total time of deformation [17].
We selected three body regions for which we created sum scores for nociceptive pain and muscle strength to better compare them between subgroups: the neck and shoulder region, the arm region and the leg region. For the assessment of nociceptive pain in each body region, a pressure pain threshold score was calculated by summarizing the PPT values [kg] of the included muscles (deltoid and biceps for the arm region, neck extensor, supraspinatus and trapezius for the neck and shoulder region and knee extensor, foot flexor and extensor for the leg region). To compare muscle strength in each region, MRC or dynamometer values were used. For the arm and leg region, we summarized dynamometer values [kg] for the legs (including hip flexor, knee flexor and extensor and foot flexor and extensor) and arm muscles (including biceps, triceps and deltoid muscle). For the neck region, MRC (Medical Research Council) scale was specified for the neck extensor muscles by assigning a value from 0 (complete paralysis) to 5 (normal strength).
We performed multiple linear regression analyses to show whether gender, muscle strength and psychological components have a significant influence on muscle pain. We chose PPT sum scores as the dependent variables to quantify muscle pain via the pressure pain threshold of the muscles in the three body regions. We chose QMFT, FSS points, and gender as the independent variables. One model was performed for the leg, one for the arm, and one for the shoulder/neck region. For the multiple regression analysis, we chose the inclusion method, in which all variables are inserted in the model simultaneously. This method examines which of the potential variables should ultimately be included in an explanatory model. Correlations were graphically checked for linearity. Because all variables were recorded only one time, the independence of the residuals is present. Because all observations belong to different patients, all observations are independent. To exclude any multicollinearity, absolute Pearson correlations between independent variables exceeding 0.7 were excluded (Table 2). For each independent variable we used at least 15 independent observations. So, at least 45 (3 * 15) observations were needed. Our sample size of 81 independent observations is sufficient for this analysis. Because of list-wise case exclusion because of some missing values, we sometimes worked with fewer cases (but at least 75 cases, which is still sufficient). The significance level (alpha) was set at ≤0.05. A Bonferroni correction was carried out to protect against type I errors. Cohen’s D was calculated for significant test results to estimate the effect size.
SPSS Statistics® Version 27 and Microsoft Excel® 2016 were used for statistical analysis. For the illustrations of the human body, BioRender® was used.
RESULTS
Of 111 patients screened for eligibility, 81 patients were enrolled in the study. 5 patients declined to participate after the study information. 25 patients were not eligible due to BDI score of > 3 at screening.
Patients with the following neuromuscular disorders were included: 20 patients with genetically confirmed spinal muscular atrophy type 3 (walkers), 13 patients with genetically confirmed late-onset Pompe disease (LOPD), 12 patients with genetically confirmed myotonic dystrophy type 1 (DM1), 12 patients with genetically confirmed myotonic dystrophy type 2 (DM2), 12 patients with genetically confirmed facio-scapulo-humeral muscle dystrophy (FSHD), and 12 healthy participants.
Baseline demographics and characteristics
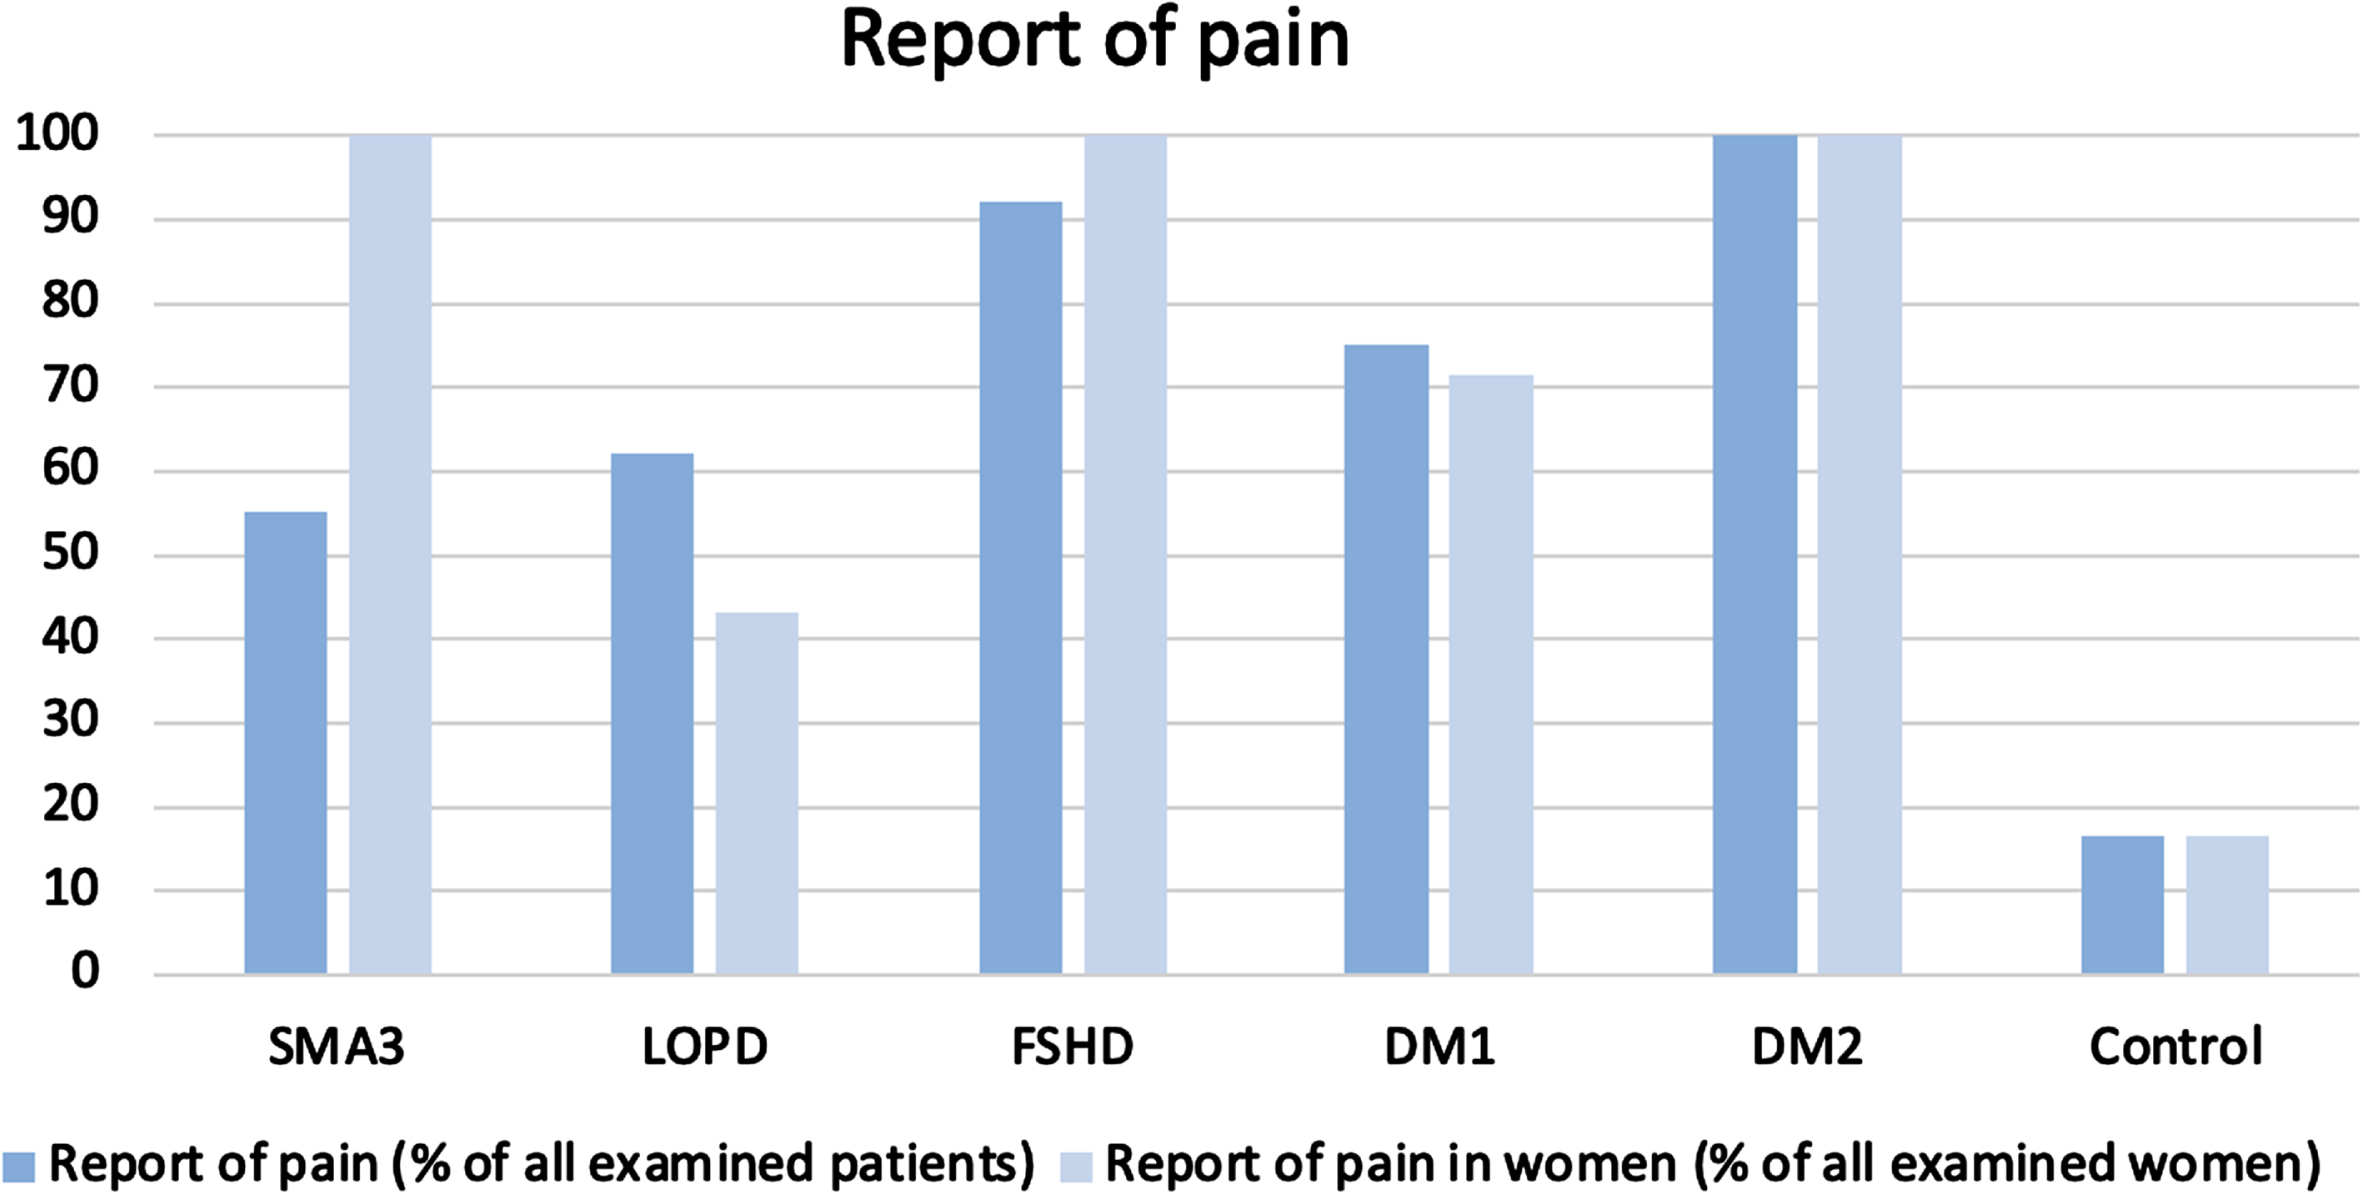
Baseline characteristics of the enrolled patients are presented in Table 1. We created neuromuscular subgroups that are similar concerning baseline demographics. The subgroups did not differ significantly in the categories of gender, age at baseline, and BMI. Disease duration was significantly shorter in FSHD patients than in LOPD and SMA patients (p = <0.01**). The report of pain was significantly (p = <0.01**) higher in DM1, DM2, and FSHD patients compared to the control group (Fig. 3).
Table 1
Demographic characteristics of the enrolled patients
| SMA3 | LOPD | FSHD | DM1 | DM2 | Control | p | |
| Number (n) | 20 | 13 | 12 | 12 | 12 | 12 | |
| Gender (male: female) | 65 : 35 | 46 : 54 | 67 : 33 | 42 : 58 | 42 : 58 | 50 : 50 | 0.611 |
| Age at baseline (years) Mean (±SD; min; max) | 38.25 (±13.19; 20; 57) | 49.0 (±18.4; 22; 81) | 38.6 (±13.8; 20; 58) | 40.5 (±15.6; 18; 63) | 46.7 (±13.5; 20; 62) | 41.6 (±16.3; 20; 63) | 0.369 |
| Age at first symptom (years) Mean (pmSD; min; max) | 10.70 (±8.65; 2; 40) | 28.1 (±15.1; 4; 47) | 27.7 (±16.7; 4 53) | 21.9 (±14.6; 7; 50) | 28.7 (±14.3; 6; 46) | – | <0.01** |
| Age at diagnosis (years) Mean (±SD; min; max) | 18.30 (±13.64; 4; 51) | 33.5 (±21.0; 4; 61) | 26.7 ( ±17.6; 3; 52) | 28.5 (±14.3; 13; 56) | 38.45 (±12.9; 13; 54) | – | |
| Disease duration (years) Mean (±SD; min; max) | 27.6 (±12.80; 9; 53) | 23.2 (±10.3; 12; 51) | 10.9 (±7.7; 3; 28) | 16.1 (±6.5; 5; 24) | 17.4 (±13.0; 3; 49) | – | <0.01** |
| BMI Mean (±SD; min; max) | 24.60 (±4.68; 17.5; 35.5) | 23.94 (±6.07; 15.6; 35.7) | 23.63 (±7.5; 12.2; 37.4) | 26.94 (±8.8; 18.8; 51.9) | 24.63 (±5.4; 17.4; 34.2) | 22.74 (±3.7; 14.2; 27.8) | 0.879 |
| Report of pain (historical) | N = 11 (55%) | N = 8 (62%) | N = 11 (92%) | N = 9 (75%) | N = 12 (100%) | N = 2 (16.7%) | <0.01** |
| -nociceptive | N = 6 (54.5%) | N = 2 (25%) | N = 7 (63.6%) | N = 3 (33.3%) | N = 3 (25%) | N = 0 | |
| -mixed | N = 5 (45.5%) | N = 6 (75%) | N = 4 (36.4%) | N = 6 (66.7%) | N = 9 (75%) | N = 2 (100%) | |
| Report of pain in women (% of examined women) | N = 7 (100%) | N = 3 (42.9%) | N = 4 (100%) | N = 5 (71.4%) | N = 7 (100%) | N = 1(16.7%) |
BMI = weight[kg]/(height [m]); *significance at a level≤0.05 **significance at a level≤0.01.
Prevalence of pain and fatigue
Pain was distributed with a high variability of frequency and location among the subgroups. Results of perceived pain in the patients are shown in Figs. 1 and 2.
Fig. 1
Pain frequency for all six subgroups in four different locations of the body Four body regions: the head, neck and shoulder region; the arm region (including upper arm, forearm and hands); the spine region (including thoracal and lumbar spine); the leg region (including gluteal region, thigh, knee, calf, shin and feet region); the unit of the scale is percentage of patients experiencing pain.
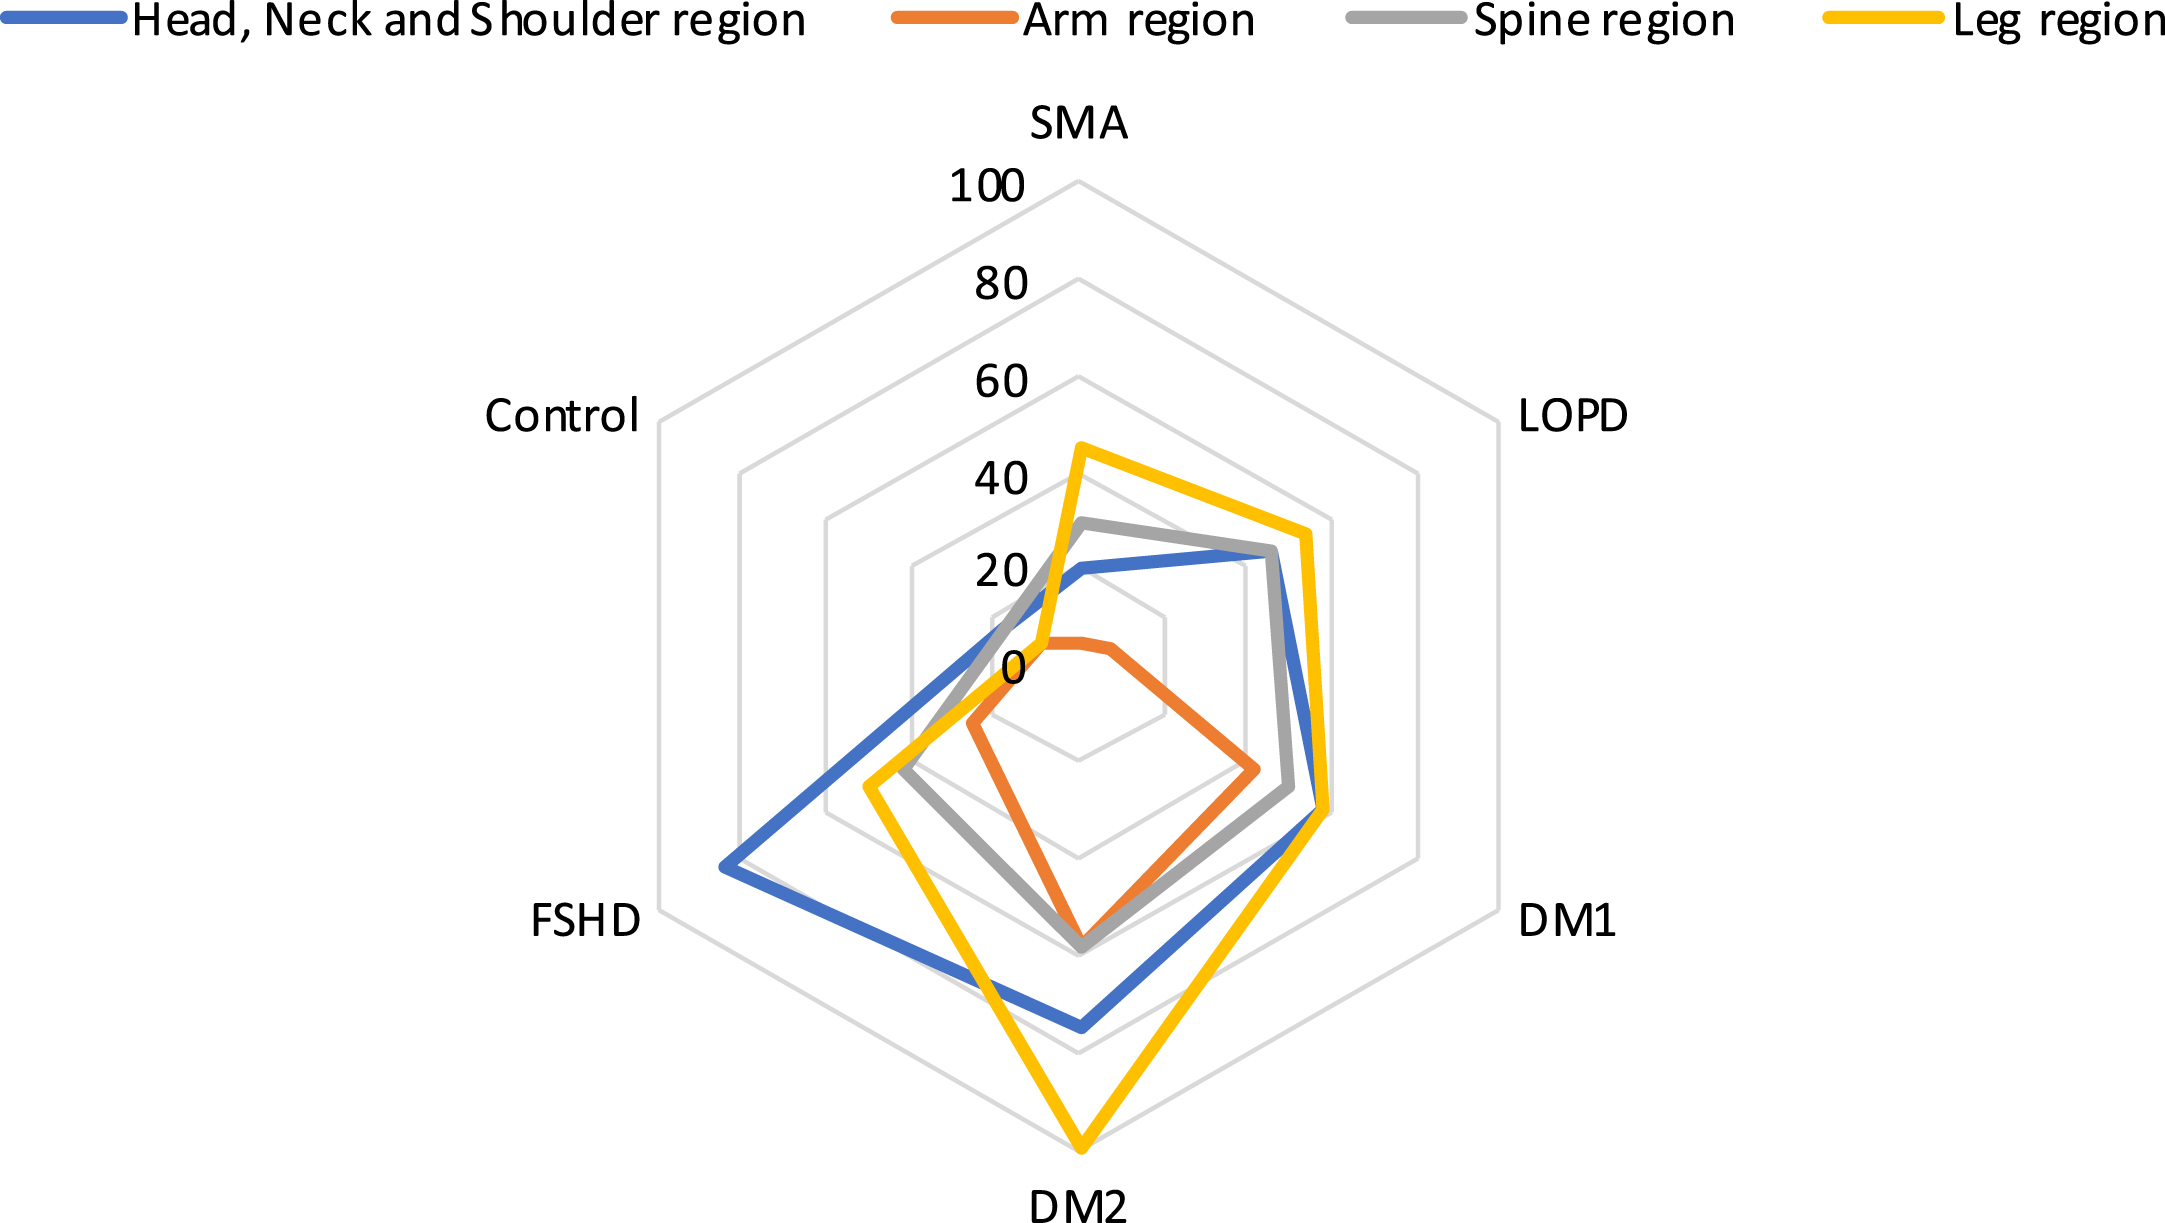
Fig. 2
Pain body maps for the different subgroups DM1 (picture 1), DM2 (picture 2), LOPD (picture 3), SMA (picture 4), FSHD (picture 5) and the control group (picture 6) indicating the frequency of pain in different colors from a low frequency (blue) to a high frequency (red) in different locations.
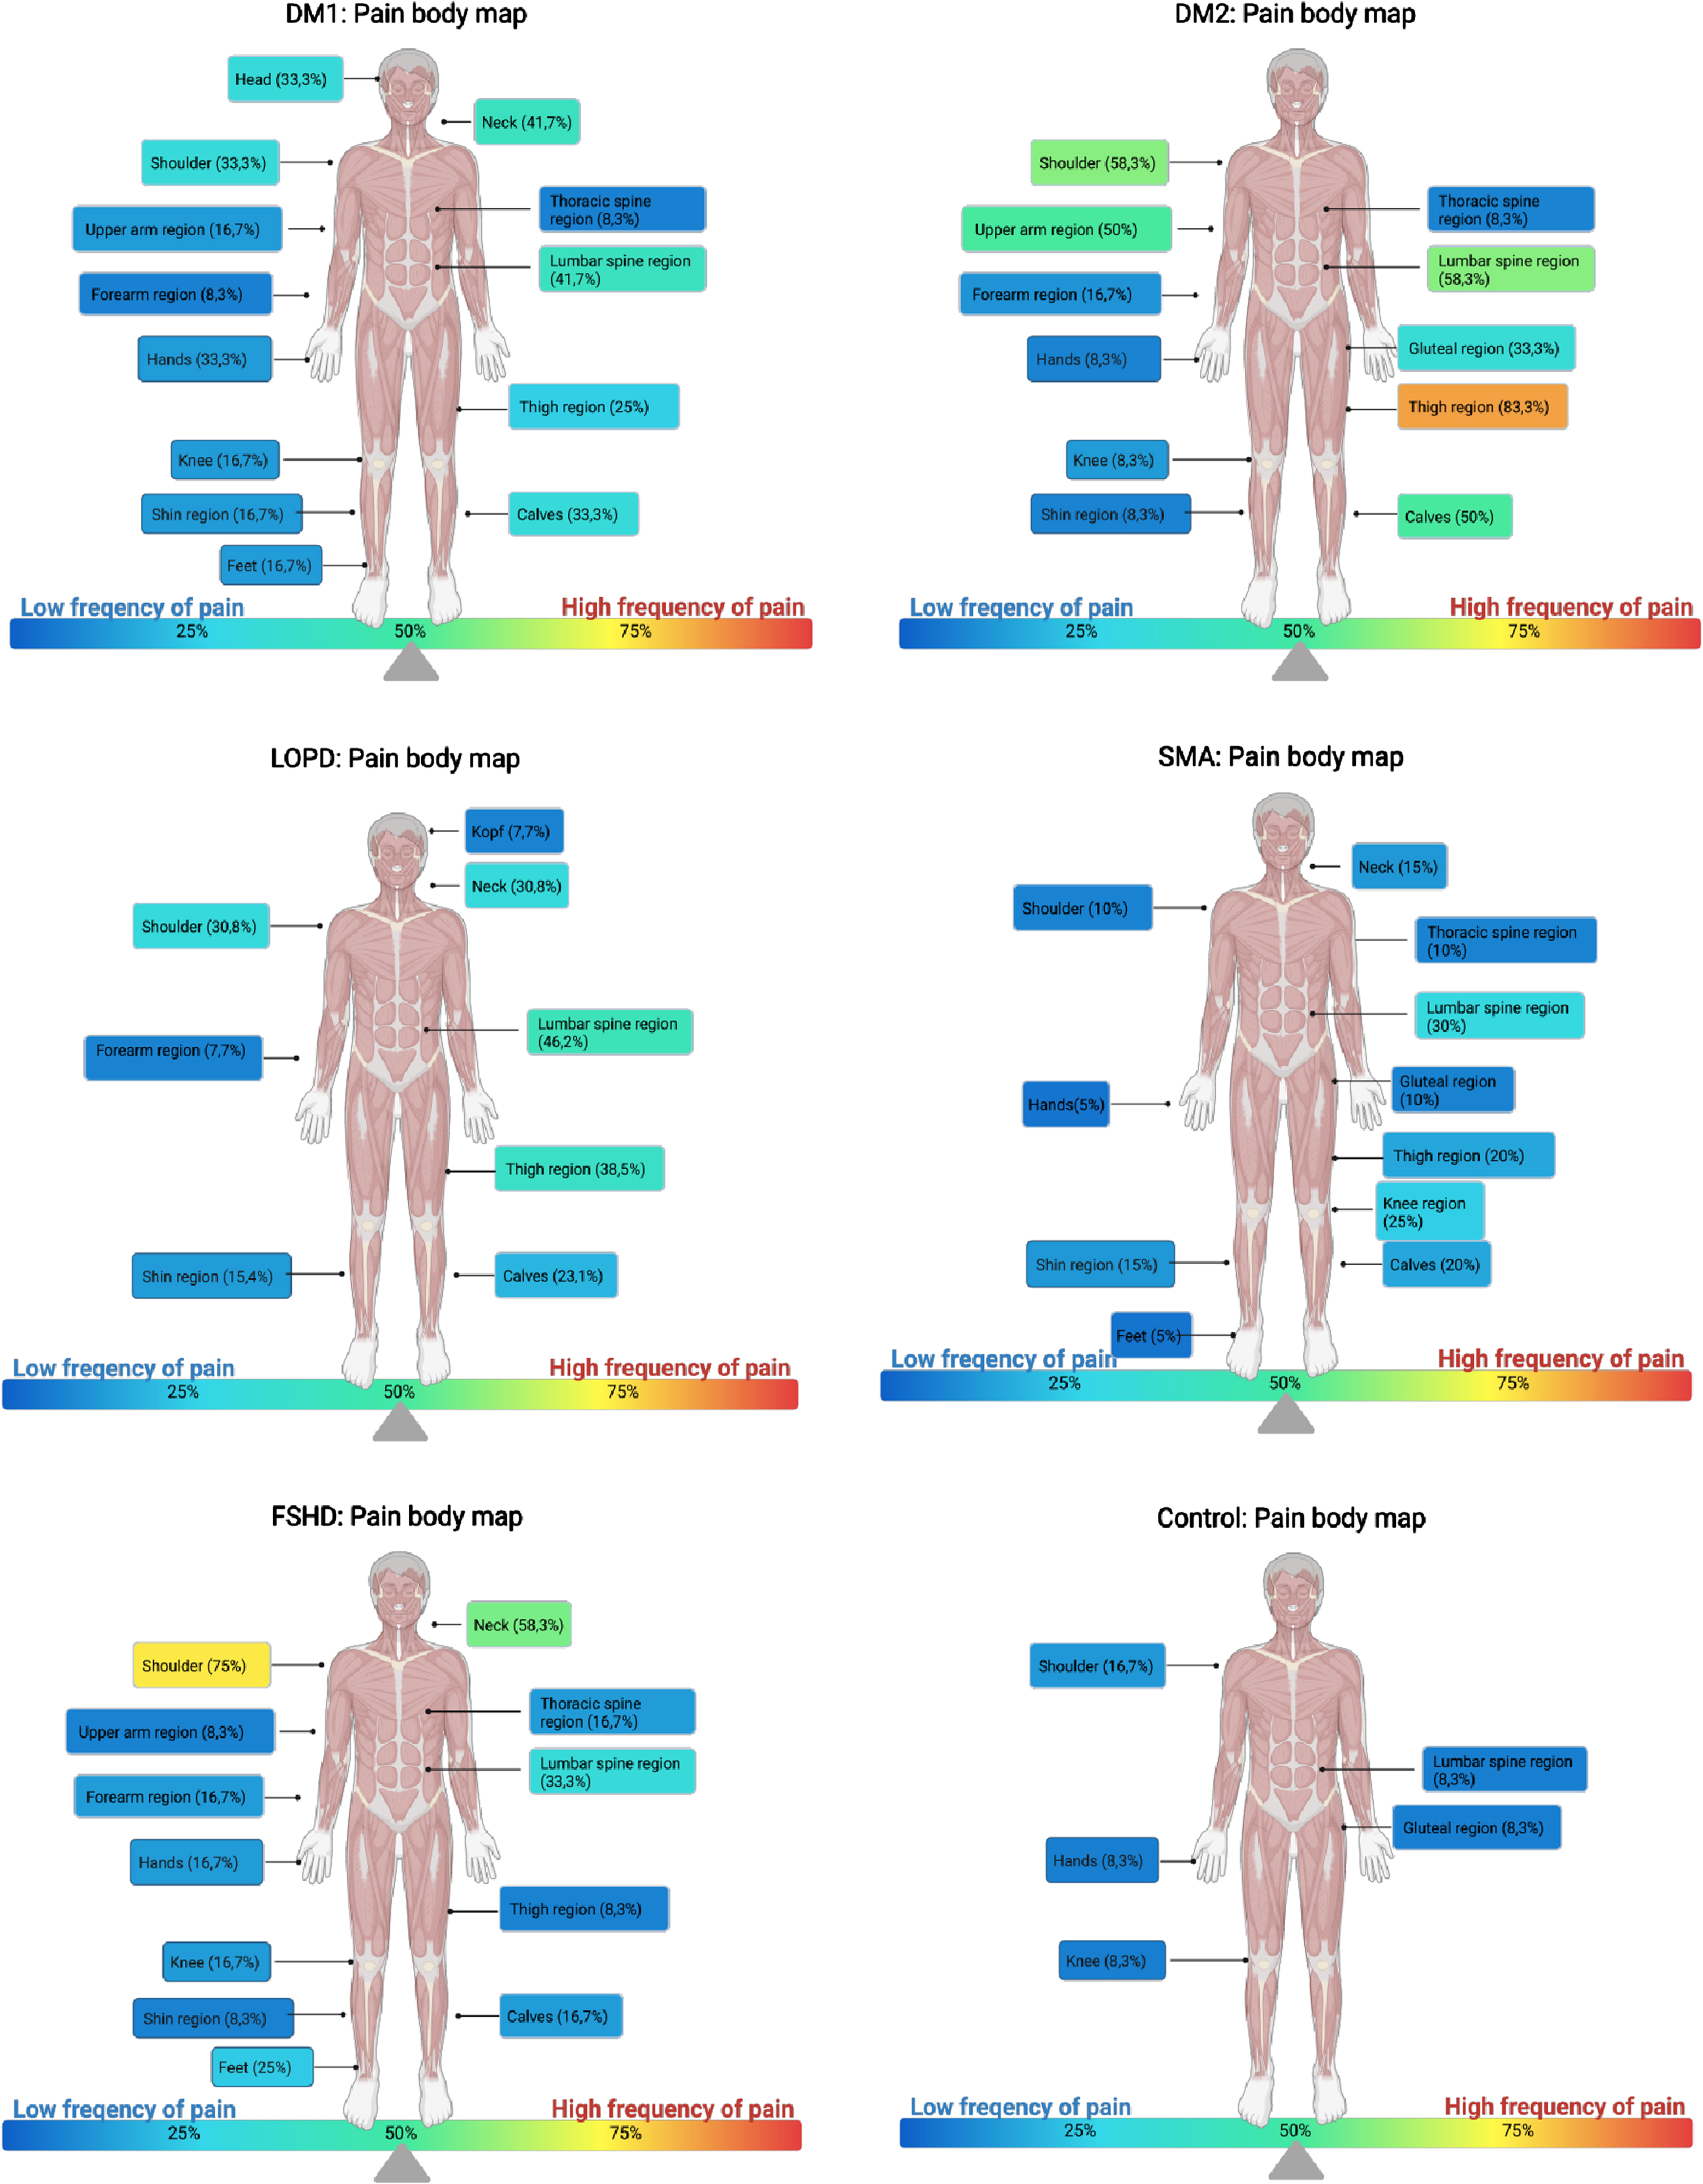
Pain was especially reported by patients with FSHD and DM2 (Figs. 1 and 3). In FSHD patients, it was mainly the head, neck, and shoulder region (83,3%; N = 10) that was indicated as painful. We found an especially high prevalence of reported pain in the shoulders (75%) and in the neck (58,3%) (Fig. 2, picture 5). In DM2 patients, the leg region (100%; n = 12) was most affected by the pain: 83,3% of the patients reported pain in the thigh region, 50% in the calf region, and 33,3% in the gluteal region. Furthermore, DM2 patients also indicated pain in the shoulder region (58,3%), the lumbar spine (58,3%) and upper arm region (50%) (Fig. 2, picture 2). Back pain was present in 30 to 60 % of all participants.
Fig. 3
Report of pain. Percentage of subjective pain prevalence in all examined patients and in all examined women. The report of pain was significantly (p = <0.01**) higher in DM1, DM2, and FSHD patients compared to the control group.
Objective pain measurement
The distribution of PPT scores in different body regions (arm region, leg region (proximal and distal), shoulder and neck region) is identical across the category “type of neuromuscular disease” and showed no significant group differences (supplementary table 1).
Fatigue and psychological factors
Data about presence of fatigue, depression, anxiety, stress and general well-being are presented in supplementary table 2. The distribution of scores for anxiety (p = 0.125), depression (p = 0.280), and stress (p = 0.173) is identical across the category “type of neuromuscular disease” and showed no significant group differences. The distribution of scores for the “Marburg questionnaire on habitual well-being” (MFHW) and the FSS score across the category “type of neuromuscular disease” showed significant group differences. Patients with DM2 had significantly lower scores in the MFHW (p = 0.031*) and significantly higher scores in the FSS (p = 0.021*) compared to the control group and the other subgroups. Further analysis using Cohen’s d suggests a high effect size (d = 2.057), reflecting clinical meaningfulness.
MULTIPLE REGRESSION ANALYSIS
Variables
We have selected our independent variables (QMFT/MRC, FSS points and gender) on the basis of theoretical considerations and the results of previous research. As dependent variables we chose the PTT sum scores of the three body regions to reflect nociceptive pain. We performed an univariate analysis and computed Pearson correlations (Table 2) between dependent and independent variables. Absolute or too high Pearson correlations between variables exceeding 0.7 can cause complications (known as multicollinearity) for the actual regression analysis. None of the Pearson correlations for this data exceeds 0.366 (marked bold in Table 3). So, the assumption of multicollinearity could be excluded.
Table 2
Univariate analysis, Pearson (P) and Kendalls Tau (KT) correlation coefficients of the dependent and independent variables
| Mean | SD | 1. | 2. | 3. | 4. | 5. | 6. | |
| 1. PPT leg [kg] | 30.0 | 12.0 | – | – | – | 0.210**(KT)–0.303** (P) | 0.229**(KT) 0.366 **(P) | 0.106 (KT) 0.058 (P) |
| 2. PPT arm [kg] | 14.3 | 6.6 | – | – | – | 0.255**(KT)–0.331**(P) | 0.179**(KT) 0.310**(P) | 0.311**(KT) 0.324**(P) |
| 3. PPT neck [kg] | 20.8 | 9.5 | – | – | – | 0.210**(KT)–0.299**(P) | 0.134(KT) 0.226*(P) | 0.003 (KT)–0.153 (P) |
| 4. FSS [points] | 3.82 | 1.5 | – | – | – | – | – 0.160(KT)–0.214(P) | – 0.151(KT) –0.154 (P) |
| 5. QMFT [points] | 46.8 | 16.7 | – | – | – | – | – | – |
| 6. MRC neck | – | – | – | – | – | – |
*significance at a level≤0.05 **significance at a level≤0.01.
Table 3
Regression coefficients for predicting PPT values [kg] in of the leg region
| Variable | B | 95% CI | ß | t | p |
| QMFT(x1) | 0.23 | [0.08, 0.39] | 0.32 | 2.98 | 0.004 ** |
| Sex/Gender (x2) | 5.45 | [0.52, 10.39] | 0.23 | 2.20 | 0.031* |
| FSS points (x3) | –1.64 | [–3.42, 0.14] | –0.20 | –1.84 | 0.070 |
CI = confidence interval for B; B = regression coefficient; R = 0.481; R2 = 0.232; R2adj. = 0.200; Regression model: 22.4 + 0.23*x1 + 5.45*x2 –1.64*x3; significance of the regression model:<0.001**; f2 Cohen: 0.232/0.768 = 0.302 à medium effect; *significance at a level≤0.05 **significance at a level≤0.01.
We chose QMFT/MRC, FSS points and gender as three independent variables:
The QMFT represents muscle strength and muscular endurance. Based on findings in our previous paper about nociceptive pain in SMA patients [6], muscle strength is likely to have an impact on muscle pain and was therefore included in our regression model. The QMFT showed strong and almost absolute correlations with the values for the 6MWT (Pearson: 0.854**), the dynamometer of the leg region (Pearson: 0.761**), the dynamometer of the arm region (Pearson: 0.639**) and the MRC sum score (Pearson: 0.862**). To avoid multicollinearity, we chose only the QMFT to represent patients’ muscle strength and muscular endurance (the 6MWT, Dynamometer, and MRC scores). Because the QMFT did not show a high Pearson correlation with the MRC scores of the neck and shoulder region (Pearson: 0.226*), we could not include the QMFT as an influencing factor for the ‘Neck and Shoulder’ model. Instead, we chose the MRC of the neck region as the influencing variable for the ‘Neck and Shoulder’ regression model.
The values of the Fatigue severity score (FSS) represent the emotional component, which is likely to have an impact on the perception of pressure pain [10, 11]. The FSS showed strong correlations with the scores for anxiety (Pearson: 0.529**), depression (Pearson: 0.561**), and stress (Pearson: 0.538**), and the MFHR (Pearson: –0.568**, Kendall-Tau: –0.442**, supplements, figure 1). To avoid multicollinearity, we chose the FSS to represent the emotional component.
Because gender is likely to greatly influence PPT values as described in literature [7, 18–20], it was included in the regression model.
Model fit
R2 and R2adj . were calculated for the three regression models (Tables 3–5). For R2adj . , also the number of influencing factors and the number of cases is considered, so we used R2adj . to assess goodness of fit. For the leg region (R2adj . =0.200), 20% of the dispersion of the dependent variable can be explained by the regression model. For the arm region (R2adj . = 0.277), it is 28%, and for the neck and shoulder region (R2adj . = 0.191) it is 19,1%. Effect strength according to Cohen showed a medium effect for the leg region (0.302) and the neck and shoulder region (0.289) and a high effect for the arm region (0.439).
Table 4
Regression coefficients for predicting PPT values [kg] in of the arm region
| Variable | B | 95% CI | ß | t | p |
| QMFT(x1) | 0.11 | [0.03, 0.18] | 0.29 | 2.91 | 0.005 ** |
| Sex/Gender (x2) | 4.82 | [2.30, 7.33] | 0.37 | 3.82 | <0.001 ** |
| FSS points (x3) | –1.02 | [–1.92, – 0.12] | –0.23 | –2.27 | 0.03* |
CI = confidence interval for B; B = regression coefficient; R = 0.552; R2 = 0.305; R2adj . = 0.277; Regression model: 10.68 + 0.11 * x1 + 4.82 * x2 –1.02 * x3; significance of the regression model: <0.001 **, f2 Cohen: 0.305/0.695 = 0.4388⟶high effect, *significance at a level≤0.05 **significance at a level≤0.01.
Table 5
Regression coefficients for predicting PPT values [kg] in of the neck and shoulder region
| Variable | B | 95% CI | ß | t | p |
| MRC neck (x1) | –1.44 | [–2.72, –0.16] | –0.24 | –2.25 | 0.028* |
| Sex/Gender (x2) | 5.75 | [1.81, 9.69] | 0.30 | 2.92 | 0.005 ** |
| FSS points (x3) | –1.96 | [–3.34, –0.58] | –0.30 | –2.85 | 0.006 ** |
CI = confidence interval for B; B = regression coefficient; R = 0.473; R2 = 0.224; R2adj . = 0.191; Regression model: 37.91 – 1.44 * x1 + 5.75 * x2 – 1.96 * x3; significance of the regression model: <0.001 **, f2 Cohen: 0.224/0.776 = 0.289⟶medium effect, *significance at a level≤0.05 **significance at a level≤0.01.
Significance and coefficients
Leg region
There is a significant influence on PPT values of the leg region by the values of the QMFT and gender of the participants (Table 3). QMFT points range from 0 to 64 points. With the increase of one point in the QMFT, PPT values increase by about 0.23 kg. For male participants, PPT values increased by about 5.45 kg. The influence of the FSS was not significant for the leg region.
Arm region
There is a significant influence on PPT values of the arm region by the values of the QMFT, the FSS, and the gender of the participants (Table 4). With the increase of point increase in the QMFT, PPT values increase by about 0.11 kg. For male participants, PPT values increased by about 4.82 kg. The FSS total score is the average of the 9 item scores and ranges from 1 (“no signs of fatigue”) to 7 (“most disabling fatigue”). With one point increase in the FSS, PPT values decreased by 1.02 kg.
Neck and shoulder region
There is a significant influence on PPT values of the neck and shoulder region by the values of the FSS and gender of the participants (Table 5). For male participants, PPT values increased by about 5.75 kg. With the increase of one point in the FSS, PPT values decreased by 1.96 kg. For this region, we took the MRC of the neck instead of the QMFT as an independent variable (4.10.1). With the increase of one point in the MRC of the neck, the PPT value decreases by about 1.44 kg.
Parameters of the MyotonPro
The findings revealed that neck pain exhibited distinct characteristics compared to pain in the extremities. In contrast to limb pain, we observed stronger neck muscles correlated with heightened pressure sensitivity. To gain deeper insights into the differences in the findings of the origin of neck pain, we integrated MyotonPro values of the neck extensor muscles in our study (Table 6). We conducted eight correlations between PPT values of the neck muscles and their corresponding MyotonPro values (frequency, stiffness, relaxation, creep). A Bonferroni correction was carried out to protect against type I errors. We found positive correlations of the PPT values with frequency and stiffness and negative correlations with relaxation and creep. Even after Bonferroni correction, results were highly significant (Table 6).
Table 6
Significance of correlations (Kendall Tau) between PPT values with their corresponding Myoton parameters (frequency, stiffness, relaxation, creep) in the same muscle
| Corresponding PPT and Myoton Pro parameters | frequency | stiffness | relaxation | creep |
| Neck extensor right Neck extensor left | 0.017*(0.197) 0.003 **(0.238) | 0.013*(0.204) 0.004 **(0.230) | 0.009**(–0.215) 0.005 **(–0.225) | 0.002 **(–0.253) 0.006**(–0.223) |
In case of significant results, the correlation coefficient is indicated in parentheses. All correlations, that show significance at level 0.05 (αoriginal = 0.05) are marked with *. All correlations, that show significance at level 0.01 are marked with **. All statistically significant values after Bonferroni correction (αaltered = 0.006) are printed bold. We performed eight correlations between PPT values of the neck muscles and 8 corresponding MyotonPro values. A Bonferroni correction was carried out to protect against type I errors. The new p-value results from the alpha value (αoriginal = 0.05) divided by the number of comparisons (8): (αaltered = 0.05/8 = 0.006). To determine whether one of the 8 correlations for each PPT value is statistically significant, the p-value must be p < 0.01.
DISCUSSION
We examined differences in pain perception among different neuromuscular subgroups and investigated the impact on possible influencing factors on muscle pain by evaluating clinical assessments and patient-reported outcomes (PROMs). We also examined the association of muscle pain and parameters of a relatively new method by myotonometry.
For the leg and arm region (but not for the neck region), higher values in the QMFT (reflecting higher muscle strength) are associated with decreased muscular sensitivity to pressure. Other significant factors that lead to decreased muscular sensitivity to pressure are male gender and a low score in the FSS (low levels of fatigue). Findings of the myotonometry analysis collectively suggest that the intrinsic muscular tone and stiffness of the neck muscles may play an important role in their pain pressure sensitivity.
It is important to mention, that 22,5% of all screened patients were excluded from the study in advance due to high scores in the Beck Depression Inventory Fast Screen (BDI-FS), suggesting potential interference between manifest depression and pain perception. The prevalence of possible depression in this sample is higher than the prevalence of depression in the general German population (10,1%) [21). However rthe BDI-FS is not equivalent to a psychiatric diagnosis of depression rwhich is likely a contributing factor to this observed bias.
Regarding the first objective of the study rour results (Figs. 1 and 2) indicate differences in the subjective pain experience among patients with different neuromuscular diseases. Pain was especially reported by patients with FSHD and DM2 (Fig. 3). The impairment of pain in daily life (assessed by the MFHW) and fatigue levels were also significantly higher in DM2 patients than in the other subgroups and in the control group (supplements table 2).
To examine the impact of influencing factors on muscle pain rwe extended the analysis by performing a multiple regression analysis (Table 4 r1 r2 r3 r4 r5 r6 rgender and psychological component (represented by FSS). Results show rthat patients who are overall stronger (higher QMFT score) are less likely to experience pain in the muscles of the extremities (Tables 3 and 4). In contrast rthe multiple regression analysis suggests that rin the neck region rhigher muscle strength is associated with higher sensitivity to pressure (Table 5).
A further finding of this analysis is that gender influences PPT scores. Female gender is associated with lower PPT values and increased muscular pressure sensitivity. This result is consistent with the literature 7 r18 r19">21). However, the BDI-FS is not equivalent to a psychiatric diagnosis of depression, which is likely a contributing factor to this observed bias.
Regarding the first objective of the study, our results (Figs. 1 and 2) indicate differences in the subjective pain experience among patients with different neuromuscular diseases. Pain was especially reported by patients with FSHD and DM2 (Fig. 3). The impairment of pain in daily life (assessed by the MFHW) and fatigue levels were also significantly higher in DM2 patients than in the other subgroups and in the control group (supplements table 2).
To examine the impact of influencing factors on muscle pain, we extended the analysis by performing a multiple regression analysis (Table 4–6). We chose the three variables muscle strength (represented by QMFT), gender and psychological component (represented by FSS). Results show, that patients who are overall stronger (higher QMFT score) are less likely to experience pain in the muscles of the extremities (Tables 3 and 4). In contrast, the multiple regression analysis suggests that, in the neck region, higher muscle strength is associated with higher sensitivity to pressure (Table 5).
A further finding of this analysis is that gender influences PPT scores. Female gender is associated with lower PPT values and increased muscular pressure sensitivity. This result is consistent with the literature [7, 18, 19]: male participants were less sensitive to pain pressure threshold measures than women. In a 2009 study [22], Fillingim et al. showed that overall, women are more sensitive to mechanically induced pressure than to other noxious agents and are more likely to develop and maintain musculoskeletal pain conditions. In another study, women showed higher sensitivities to musculoskeletal pain [19]. Differences in the gender-specific perception of pain are frequently reported, but their cause is not yet fully understood. The influence of sex hormones and endogenous opioid structures, as well as psychosocial differences in coping strategies, early childhood stress or the influence of stereotypical gender roles and the associated social gender bias in dealing with pain are widely discussed [5, 19]. The influence of these factors needs to be further investigated in future studies to better understand and treat pain perception, especially in female patients.
Psychological components greatly influence the perception of pain [10]. The influence of the FSS was significant for the arms, neck, and shoulder regions, but not for the leg region. An increase of FSS points, reflecting higher levels of fatigue, resulted in lower PPT scores (and so in higher muscular sensitivity to pressure).
The analysis of the MyotonPro is shown in Table 6. Frequency is measured in Hz and characterizes the intrinsic tension of the neck muscles in a resting and not contracted state [17]. The positive correlation with frequency suggests that higher PPT values (decreased sensitivity to pressure) are associated with increased muscle tone of the neck muscles. Consequently, neck muscles with low intrinsic tension seem to be more likely to cause neck pain. Dynamic stiffness is measured in N/m and characterizes the resistance of the muscle to an external deformation [17]. The positive correlation we found in the analysis suggests that high resistance to the external force of deformation leads to less sensitivity to pressure-induced pain. Mechanical stress relaxation time is measured in ms and shows how fast a muscle can recover after deformation. The parameter of creep is the relaxation time to the total deformation time. The higher the frequency (tension) and the stiffness of a muscle, the shorter the recovery time (the relaxation), and the lower the creep [17]. The correlation was negative for relaxation time and the creep of the neck muscles indicating that PPT values are higher (pain sensitivity is decreased) when muscle recovery time is shorter. In conclusion, less pain seems to be experienced in neck muscles with a high muscle tone, high stiffness (resistance), high structural integrity and a short relaxation time. These factors significantly interacted with our cohort group’s perception of neck pain.
With regard to DM1 and DM2, the symptom of myotonia must also be addressed. This is characterized as involuntary muscle contraction with delayed relaxation and can therefore also influence the MyotonPro measurements. Due to the parallel presence of myotonia and pain, alternative treatment options are also available for myotonic dystrophies. Mexiletine, for example, is used both to treat myotonia and for pain therapy [23].
However, as shown in the multiple regression analysis, the interaction of factors is more complex, and the origin of neck pain must be investigated in further studies.
Study limitations
Because the examined neuromuscular diseases are quite rare, selecting completely homogenous groups was impossible. Despite this, we examined neuromuscular subgroups and a control group for comparison, which did not differ significantly in the categories of gender, age at baseline, and BMI. We used validated questionnaires to minimize bias. Nociceptive pain was distinguished from neuropathic pain by precisely describing the reported pain. We are aware that the recruitment of patients through a patient organization or recruitment in neuromuscular expert centers may have a potential source of selection bias, as the participating group may be particularly motivated and perhaps more severely affected. Since patients with severe depression were excluded from study participation and severe mental illnesses are likely to interact with the perception of pain, this adapted patient group can cause bias. In addition to physiological differences in pain perception, the gender of the investigator may have also biased the results. In a 2007 study by Aslaksen et al. [24] male participants showed lower sensitivity to pain when the examiner was female. In contrast, in a study from Gijsbers et al. [25], men showed a higher average pain sensitivity when tested by a female examiner.
Pain perception in general is very heterogenous and influenced by many known and unknown factors, such as further psychological aspects, medication, social aspects and individual factors. This pilot study is only an attempt to gain a deeper sight in the origin of muscle pain in patients with NMDs and their influences.
CONCLUSION
Patients with Myotonic Dystrophy type 2 had significantly higher levels of pain prevalence, fatigue, and impairment of quality of life compared to other examined NMD subgroups and the control group. In contrast, the PPT values of the different body regions were not significantly lower for DM2 patients than those of the other NMD.
We performed a multiple regression analysis to subsume most possible influences on the PPT values. Female gender, high fatigue levels (representing factors such as depression, anxiety, stress, and impairment of quality of life), and low QMFT scores (representing reduced muscle strength) showed an association with increased sensitivity to pressure pain in both the arm and leg regions. These factors should not be underestimated, especially when managing pain in female patients with neuromuscular conditions. Individualized therapeutic concepts including psychological and physical approaches in the pain management of patients with NMDs should be considered. Further research in this field is necessary to gain a more detailed insight into the perception of muscle pain.
The findings revealed that neck pain exhibited distinct characteristics compared to pain in the extremities. In contrast to limb pain, we observed stronger neck muscles correlated with heightened pressure sensitivity. The correlation between PPT values of the neck extensor muscles and corresponding MyotonPro values suggest that the intrinsic muscular tone and stiffness of the neck muscles play an important role in the pain pressure sensitivity of the neck.
ACKNOWLEDGMENTS
We thank all study participants for participation and their consent to analyze their data in this study.
FUNDING
The study received financial support for patient reimbursements (travel costs) by the DGM – Deutsche Gesellschaft für Muskelkranke e.V.
CONFLICT OF INTEREST
All authors report no disclosures regarding this study. Outside of this context, SW has received research grant by the DGM – Deutsche Gesellschaft für Muskelkranke e.V. He has served on advisory boards for Alexion Pharma, CSL Behring and Sanofi Genzyme GmbH. He received funding for travel or speaker Honoraria from Sanofi-Aventis Germany GmbH; SH Glykogenose Gesellschaft; AbbVie Germany GmbH; Recordati Pharma GmbH; CSLBehring GmbH; Alexion Pharma GmbH; Desitin Germany; Akcea GmbH. Outside of this context, BS has served on advisory boards for Alexion, Argenex, Amicus, Astellas, Spark, and Sanofi; he has undertaken contracted unrestricted research for Sanofi and Amicus; and has received honoraria from Kedrion. The other authors have no conflicts of interest to declare.
AVAILABILITY OF DATA AND MATERIAL
The anonymized participant data presented here are available upon request from the correspondent author ().
AUTHOR CONTRIBUTIONS
Elena Sagerer: Statistical analysis and interpretation of data, discussion of results, critical revision of the manuscript for intellectual content, first and final manuscript draft. A guarantor who accepts full responsibility for the work and/or the conduct of the study, had access to the data, and controlled the decision to publish.
Stephan Wenninger: Interpretation of data, discussion of results, critical revision of the manuscript for intellectual content.
Corinna Wirner: Data acquisition, critical revision of the manuscript for intellectual content.
Marko Mijic: critical revision of the manuscript for intellectual content.
Marcela Arndt: critical revision of the manuscript for intellectual content.
Natalia Garcia-Angarita: critical revision of the manuscript for intellectual content.
Benedikt Schoser: Discussion of results, critical revision of the manuscript for intellectual content.
SUPPLEMENTARY MATERIAL
[1] The supplementary material is available in the electronic version of this article: https://dx.doi.org/10.3233/JND-240068.
REFERENCES
[1] | de Groot IJ , Voet NB , van Middendorp H , Knoop H , Rahbek J , van Engelen BG . 184th ENMC international workshop: Pain and fatigue in neuromuscular disorders: 20–22 May Naarden, The Netherlands. Neuromuscular Disorders. (2013) ;23: (12):1028–32. 10.16/j.nmd.2013.06.370. |
[2] | Jensen MP , Abresch RT , Carter GT , McDonald CM . Chronic Pain in Persons With Neuromuscular Disease. Archives of Physical Medicine and Rehabilitation. (2005) ;86: (6):1155–63. 10.016/j.pmr.2005.08.015. |
[3] | Bushby KMD , Pollitt C , Johnson MA , Rogers MT , Chinnery PF . Muscle pain as a prominent feature of facioscapulohumeral muscular dystrophy (FSHD): Four illustrative case reports. Neuromuscular Disorders. (1998) ;8: (8):574–9. 10.1016/s0960-8966(98)00088-1. |
[4] | Solbakken G , Løseth S , Froholdt A , Eikeland TD , Nærland T , Frich JC , et al. Pain in adult myotonic dystrophy type Relation to function and gender. BMC Neurology. (2021) ;21: (1):101. 10.1186/s12883-021-02124-9. |
[5] | Abresch RT , Carter GT , Jensen MP , Kilmer DD . Assessment of pain and health-related quality of life in slowly progressive neuromuscular disease. Am J Hosp Palliat Care. (2002) ;19: (1):39–48. 10.1177/104990910201900109. |
[6] | Sagerer E , Wirner C , Schoser B , Wenninger S . Nociceptive pain in adult patients with 5q-spinal muscular atrophy type A cross-sectional clinical study. J Neurol. (2023) ;270: (1):250–61. 10.1007/s00415-022-11351-0. |
[7] | De Rui M , Marini I , Bartolucci ML , Inelmen EM , Bortolotti F , Manzato E , et al. Pressure pain threshold of the cervico-facial muscles in healthy elderly people: The role of gender, age and dominance. Gerodontology. (2015) ;32: (4):274–80. 10.1111/ger.12117. |
[8] | Fillingim RB . Individual differences in pain: Understanding the mosaic that makes pain personal. Pain.. (2017) ;158: (Suppl 1):S11–18. 10.1097/j.pain.0000000000000775. |
[9] | Morís G , Wood L , Fernández-Torrón R , González Coraspe JA , Turner C , Hilton-Jones D , et al. Chronic pain has a strong impact on quality of life in facioscapulohumeral muscular dystrophy. Muscle Nerve. (2018) ;57: (3):380–7. 10.1002/mus.25991. |
[10] | Linton SJ , Shaw WS . Impact of psychological factors in the experience of pain. Phys Ther. (2011) ;91: (5):700–11. 10.2522/ptj.20100330. |
[11] | Enax-Krumova EK , Dahlhaus I , Görlach J , Claeys KG , Montagnese F , Schneider L , et al. Small fiber involvement is independent from clinical pain in late-onset Pompe disease. Orphanet J Rare Dis. (2022) ;17: (1):177. 10.1186/s13023-022-02327-4. |
[12] | Poquet N , Lin C . The Brief Pain Inventory (BPI). Journal of Physiotherapy. (2016) ;62: (1):52. 10.1016/j.jphys.2015.07.001. |
[13] | Nagel B , Gerbershagen HU , Lindena G , Pfingsten M . [Development and evaluation of the multidimensional German pain questionnaire]. Schmerz. (2002) ;16: (4):263–70. 10.1007/s00482-002-0162-1. |
[14] | Basler HD . Marburger Fragebogen zum habituellen Wohlbefinden. Der Schmerz. (1999) ;13: (6):385–91. 10.1007/s004820050216. |
[15] | Nilges P , Essau C . [Depression, anxiety and stress scales: DASS–A screening procedure not only for pain patients]. Schmerz. (2015) ;29: (6):649–57. 10.1007/s00482-015-0019-z. |
[16] | Yu JF , Chang TT , Zhang ZJ . The Reliability of MyotonPRO in Assessing Masseter Muscle Stiffness and the Effect of Muscle Contraction. Med Sci Monit. (2020) ;26: :10. 10.12659/msm.926578. |
[17] | Myoton Technology Myoton AS: https://www.myoton.com/technology/ (2023) . |
[18] | Vela L , Lyons KE , Singer C , Lieberman AN . Pain-pressure threshold in patients with Parkinson’s disease with and without dyskinesia. Parkinsonism Relat Disord. (2007) ;13: (3):189–92. 10.1016/j.parkreldis.2006.04.003. |
[19] | Bartley EJ , Fillingim RB . Sex differences in pain: A brief review of clinical and experimental findings. Br J Anaesth. (2013) ;111: (1):52–8 10.1093/bja/aet127. |
[20] | Chesterton LS , Barlas P , Foster NE , Baxter DG , Wright CC . Gender differences in pressure pain threshold in healthy humans. Pain. (2003) ;101: (3):259–66. 10.1016/s0304-3959(02)00330-5. |
[21] | Bretschneider J , Kuhnert R , Hapke U . Depressive Symptomatik bei Erwachsenen in Deutschland. Robert Koch-Institut, Epidemiologie und Gesundheitsberichterstattung; (2017) . |
[22] | Fillingim RB , King CD , Ribeiro-Dasilva MC , Rahim-Williams B , Riley JL , 3rd. Sex, gender, and pain: A review of recent clinical and experimental findings. J Pain. (2009) ;10: (5):447–85. 10.1016/j.jpain.2008.12.001. |
[23] | Schoser B . Myotonic Dystrophy Type 2. In: Adam MP, Feldman J, Mirzaa GM, Pagon RA, Wallace SE, Bean LJH, et al., editors. GeneReviews(®). Seattle (WA): University of Washington, Seattle Copyright © 1993–2024, University of Washington, Seattle. GeneReviews is a registered trademark of the University of Washington, Seattle. All rights reserved; (1993) . |
[24] | Aslaksen PM , Myrbakk IN , Høifødt RS , Flaten MA . The effect of experimenter gender on autonomic and subjective responses to pain stimuli. Pain. (2007) ;129: (3):260–8. 10.1016/j.pain.2006.10.011. |
[25] | Gijsbers K , Nicholson F . Experimental pain thresholds influenced by sex of experimenter. Percept Mot Skills. (2005) ;101: (3):803–7. 10.2466/pms.101.3.803-807. |


