
The West of Scotland Cohort of Mitochondrial Individuals with the m.3243A>G Variant: Variations in Phenotypes and Predictors of Disease Severity
Abstract
Background:
The m.3243A>G variant is the commonest mitochondrial (mt) DNA pathogenic variant and a frequent cause of mitochondrial disease. Individuals present with a variety of clinical manifestations from diabetes to neurological events resembling strokes. Due to this, patients are commonly cared for by a multidisciplinary team.
Objectives:
This project aimed to identify patients with confirmed mt.3243A>G-related mitochondrial disease attending the Muscle Clinic at Queen Elizabeth University Hospital in Glasgow. We explored potential correlates between clinical phenotypes and mtDNA heteroplasmy levels, HbA1c levels, body mass index, and specific clinical manifestations. We investigated if there were discrepancies between non-neurological speciality labelling in clinical records and individuals’ phenotypes.
Methods:
Data were gathered from the West of Scotland electronic records. Phenotypes were ascertained by a clinician with expertise in mitochondrial disorders. Statistical analyses were applied to study relationships between tissue heteroplasmy, HbA1c and clinical phenotypes including body mass index (BMI).
Results:
Forty-six individuals were identified from 31 unrelated pedigrees. Maternally inherited diabetes and deafness was the prominent syndromic phenotype (48%). A significant association was found between overall number of symptoms and bowel dysmotility (p < 0.01). HbA1c was investigated as a predictor of severity with potential association seen. Although used widely as a prognosticator, neither corrected blood nor urine mtDNA heteroplasmy levels were associated with increased number of symptoms. In 74.1% of records, syndromic phenotypes were incorrectly used by non-neurological specialities.
Conclusions:
This m.3243 A > G patient cohort present with marked clinical heterogeneity. Urine and blood heteroplasmy levels are not reliable predictors of disease severity. HbA1c may be a novel predictor of disease severity with further research required to investigate this association. We infer that prognosis may be worse in patients with low BMIs and in those with bowel dysmotility. These results underscore a multidisciplinary approach and highlight a problem with inaccurate use of the existing nomenclature.
INTRODUCTION
Mitochondrial diseases are the commonest cause of inherited neurological disorders affecting up to 1 in 4,300 individuals in the UK [1]. Pathogenic variants in mitochondrial DNA (mtDNA) result in impaired ATP synthesis. Previous population-based studies have suggested that the m.3243A>G variant is the most common mtDNA point mutation that results in impaired translation of mt-tRNA leucine gene (MTTL1) [2, 3] and has a carrier rate of 1 in 400 individuals [4, 5]. Previous studies have shown disease incidences range from 3.5 to 16.3 per 100,000 in the adult population [1, 5, 6].
The variant is pathognomonic with multiple syndromes including Mitochondrial Encephalopathy with Lactic Acidosis and Stroke-Like Episodes (MELAS), Maternally Inherited Diabetes and Deafness (MIDD), Myoclonic Epilepsy with Ragged Red Fibres (MERRF), Progressive External Ophthalmoplegia (PEO) and Neuropathy, Ataxia and Retinitis Pigmentosa (NARP) as specific phenotypes. However, studies have shown significant heterogeneity in the presentation of cohorts with the m.3243A>G variant [7–15]. MELAS patients were the least represented and presentations that did not neatly fit these syndromes were common [7, 11, 14].
The presence of the variant can affect multiple systems. Stroke Like Episodes (SLEs), characterised by headache, nausea, vomiting and encephalopathy, are not confined to specific vascular territories on brain imaging [16]. Sensorineural hearing loss (SNHL) rates range from 1 in 1000 at birth to 71–77% in adulthood [3, 17]. The cardiac muscle and its electrical conduction pathways are affected in 25% of individuals with m.3423A>G variant [18]. Gastric dysmotility has been reported, with symptoms ranging from abdominal pain, constipation and abdominal distension to intestinal pseudo-obstruction (IPO) [3, 19, 20] with the latter associated with a high mortality [19]. Other clinical problems may arise including headaches, ataxia, myopathy, progressive external ophthalmoplegia (PEO), cognitive impairment and short stature [3, 4, 7, 21, 22]. Due to the multisystem nature of these disorders, individuals are likely to be cared for by different medical specialities that may negatively impact timely recognition and instigation of supportive therapies.
The m.3243A>G variant can be tested for in various tissues. Heteroplasmy levels can be checked in DNA extracted from various tissues including blood, early morning urine samples, buccal swabs or sputum samples and muscle [3, 4, 7]. There is conflicting evidence on the use of urine heteroplasmy levels to predict severity and whether it correlates with clinical symptoms. Studies both support its use [23–26] and refute it due to its unpredictability [27–30]. Grady and co-authors [26] used corrected blood heteroplasmy, which significantly correlated with muscle heteroplasmy levels in their cohort. Uncorrected blood heteroplasmy levels are of limited value to predict disease severity [2, 28] while muscle heteroplasmy load correlates better with disease severity [2].
Other predictors of disease severity and specific disease outcomes have been investigated. Specifically, the onset of SLEs has been seen to be significantly associated with BMI, blood heteroplasmy levels, SNHL and serum lactate levels [13]. The onset of diabetes has been linked to both heteroplasmy levels and disease severity. Studies have shown urinary heteroplasmy levels to correlate with HbA1c [10] and age of onset of diabetes [29], with diabetes considered an independent predictor of death [30].
AIMS
In this paper, we sought to identify individuals with the m.3243A>G variant, who attended the adult muscle specialist clinic in the Queen Elizabeth University Hospital (QEUH) in Glasgow over a five-year interval. We explored phenotypes within pedigrees and across the cohort. We studied the associations between symptom severity and morbidity and several measurable factors including tissue heteroplasmy levels, BMI, HbA1c and specific manifestations including bowel dysmotility. Finally, we hypothesised that the label ‘MELAS’ may be loosely and incorrectly applied in non-neurological specialties, and we explored the frequency of its over-reporting.
MATERIALS AND METHODS
Data collection
The cohort was identified from the muscle clinic in QEUH, which is a regional service catering for individuals in the West of Scotland, who are under the care of a single neurologist (MEF). Individuals were selected if they had confirmed m.3423A>G variant present in urine, blood or muscle-derived mtDNA and were attending the muscle clinic during the period of July 2017 to July 2022.
The data were gathered from the West of Scotland electronic records, and included correspondence detailing clinic attendance, hospital admissions and investigation reports. The tissue heteroplasmy levels used for the purpose of this analysis were initial levels taken at point of diagnoses. Blood heteroplasmy levels were corrected using the formula detailed by Grady and co-authors [26]. The phenotype was ascertained by a clinician with an expertise in mitochondrial disorders and was compared to the phenotype specified in the most recent clinical letter by a non-neurological clinician. The BMI was based on the most recent weight taken in whatever context they had seen any clinician. The most recent HbA1c level was used for each individual and diabetic treatment was identified through clinical letters and current regular medical prescriptions. Cardiac manifestations (CM) were identified by analysing the most recent echocardiography and ECG reports. Fatigue was recorded from the individual’s reported perceived fatigue. Bowel dysmotility (BD) was recorded when the individual reported relevant symptoms (severe constipation, abdominal pain, nausea, altered bowel habit, bloating and recurrent vomiting) and their clinician thought they were suggestive of a motility disorder.
A phenotype of MELAS and MIDD was specified by the neurologist caring for each individual prior to the study. MELAS was specified due to their clinical presentation alone, which included super-refractory seizures, encephalopathy, and typical changes on their brain MR imaging as discussed by Ng et al. [13]. Individuals with laboratory-reported lactic acidosis alone were not consequently defined as having MELAS. MIDD was specified if they had diabetes and SNHL only. If individuals presented with symptoms of MELAS and MIDD they were given the description of “MELAS/MIDD”. The description of “Atypical” was used when the individual presented with features not fitting either of these syndromes.
Statistical analysis
Statistical analysis was carried out in RStudio using R version 4.0.2 [31]. Means and standard deviations were calculated for continuous variables. SNHL, diabetes, seizures, ataxia, fatigue, myopathy, bowel dysmotility symptoms, a phenotype compatible with MELAS and left ventricular hypertrophy and/or left ventricular systolic dysfunction were included in the category “number of symptoms”, whilst seizures, headaches, encephalopathy, and ataxia were included in the category “number of neurological symptoms”. General linear models (GLMs) were used to investigate if the number of symptoms and neurological symptoms was associated with blood and urinary heteroplasmy load, BMI and bowel dysmotility. GLMs were also used to investigate if HbA1c level or BMI was a predictor of the number of symptoms, number of neurological symptoms, MELAS phenotype, urinary mtDNA heteroplasmy load and corrected blood mtDNA heteroplasmy levels. Where appropriate, age and sex were included in the models to control for the effects of these demographic variables on BMI. Binomial models (using the lme4 package) were used to investigate associations between the likelihood of having MELAS symptoms (binary - Yes or No) and blood and urinary heteroplasmy load, BMI and bowel dysmotility. P-values were used to determine if there were any significant associations, with a p-value threshold of 0.05 used to signify significance.
RESULTS
Phenotypes
Forty-six individuals were identified (19 male, 27 female) from 31 unrelated pedigrees (Table 1). The majority (21; 46%) belonged to Greater Glasgow & Clyde Health Board; 14 (30%) patients resided in Lanarkshire Health Board, 7 (15%) in Ayrshire and Arran Health Board, 3 (7%) in Forth Valley Health Board and 1 (2%) in Lothian Health Board. Individual ages ranged from 24 to 78 (median age 48) years. The majority (48%) had a phenotype consistent with MIDD.
Table 1
Phenotype for all individuals. Ranges of HbA1c, urine and corrected blood heteroplasmy are given with means in brackets. Blank spaces denote unreported symptoms
| Phenotype | n | HbA1c | SNHL | Seizures | BD | Headache | Fatigue | Ataxia | Myopathy | CM | Heteroplasmy (%) | |
| Urine | Corrected Blood | |||||||||||
| MIDD | 22 | 65–92 (59) | 22 | 1 | 6 | 6 | 13 | 7 | 6 | 5 | 20–91 (64) | 20–100 (77) |
| MELAS | 3 | 39–41 (40) | 2 | 3 | 1 | 3 | 2 | 0 | 2 | 0 | 44–68 (56) | 70–57 (64) |
| MELAS/MIDD | 3 | 38–50 (43) | 3 | 3 | 2 | 0 | 2 | 3 | 2 | 2 | 65–87 (76) | 87–97 (92) |
| DM only | 1 | 77 | 13 | 100 | ||||||||
| SNHL only | 1 | 40 | 1 | 13 | 45 | |||||||
| Atypical | 15 | 31–73 (40) | 9 | 1 | 1 | 6 | 6 | 4 | 5 | 3 | 31–91 (57) | 18–100 (60) |
| Asymptomatic | 1 | 38 | 91 | 78 | ||||||||
28 individuals (61%) were under the management or surveillance of endocrinology with 19 (67.9%) being insulin dependent, 6 (21%) managed with oral medications and 3 (11%) diet controlled. 4 of those that were managed with oral medications (67%) were managed with Metformin with or without a second agent. BMI was available for 43 individuals (94%), the median BMI was 24.63 kg/m2 (range 15.2 –39.9; standard deviation [SD] = 4.62).
All individuals were investigated with 2D-echocardiography. 30 (65%) individuals had a normal study. 7 (15%) had a component of left ventricular systolic dysfunction (LVSD) (3 had 41-49% ejection fraction (EF); 2 had 30-39% EF and 2 had EF<30%), 5 (10.9%) had left ventricular hypertrophy (LVH) in isolation and 4 (8.6%) had only valve disease. 6 (85.7%) of the individuals with LVSD were medically managed. None had cardiac arrhythmia or required pacemaker or implantable cardioverter defibrillator devices.
Urinary heteroplasmy levels were checked in 40 (87%). Heteroplasmy levels in blood-derived DNA were available in 33 (72%). Heteroplasmy load in muscle tissue was investigated in 5 individuals from different, unrelated pedigrees. No analysis was carried out for this subcohort due to its small size.
Predictors of disease severity
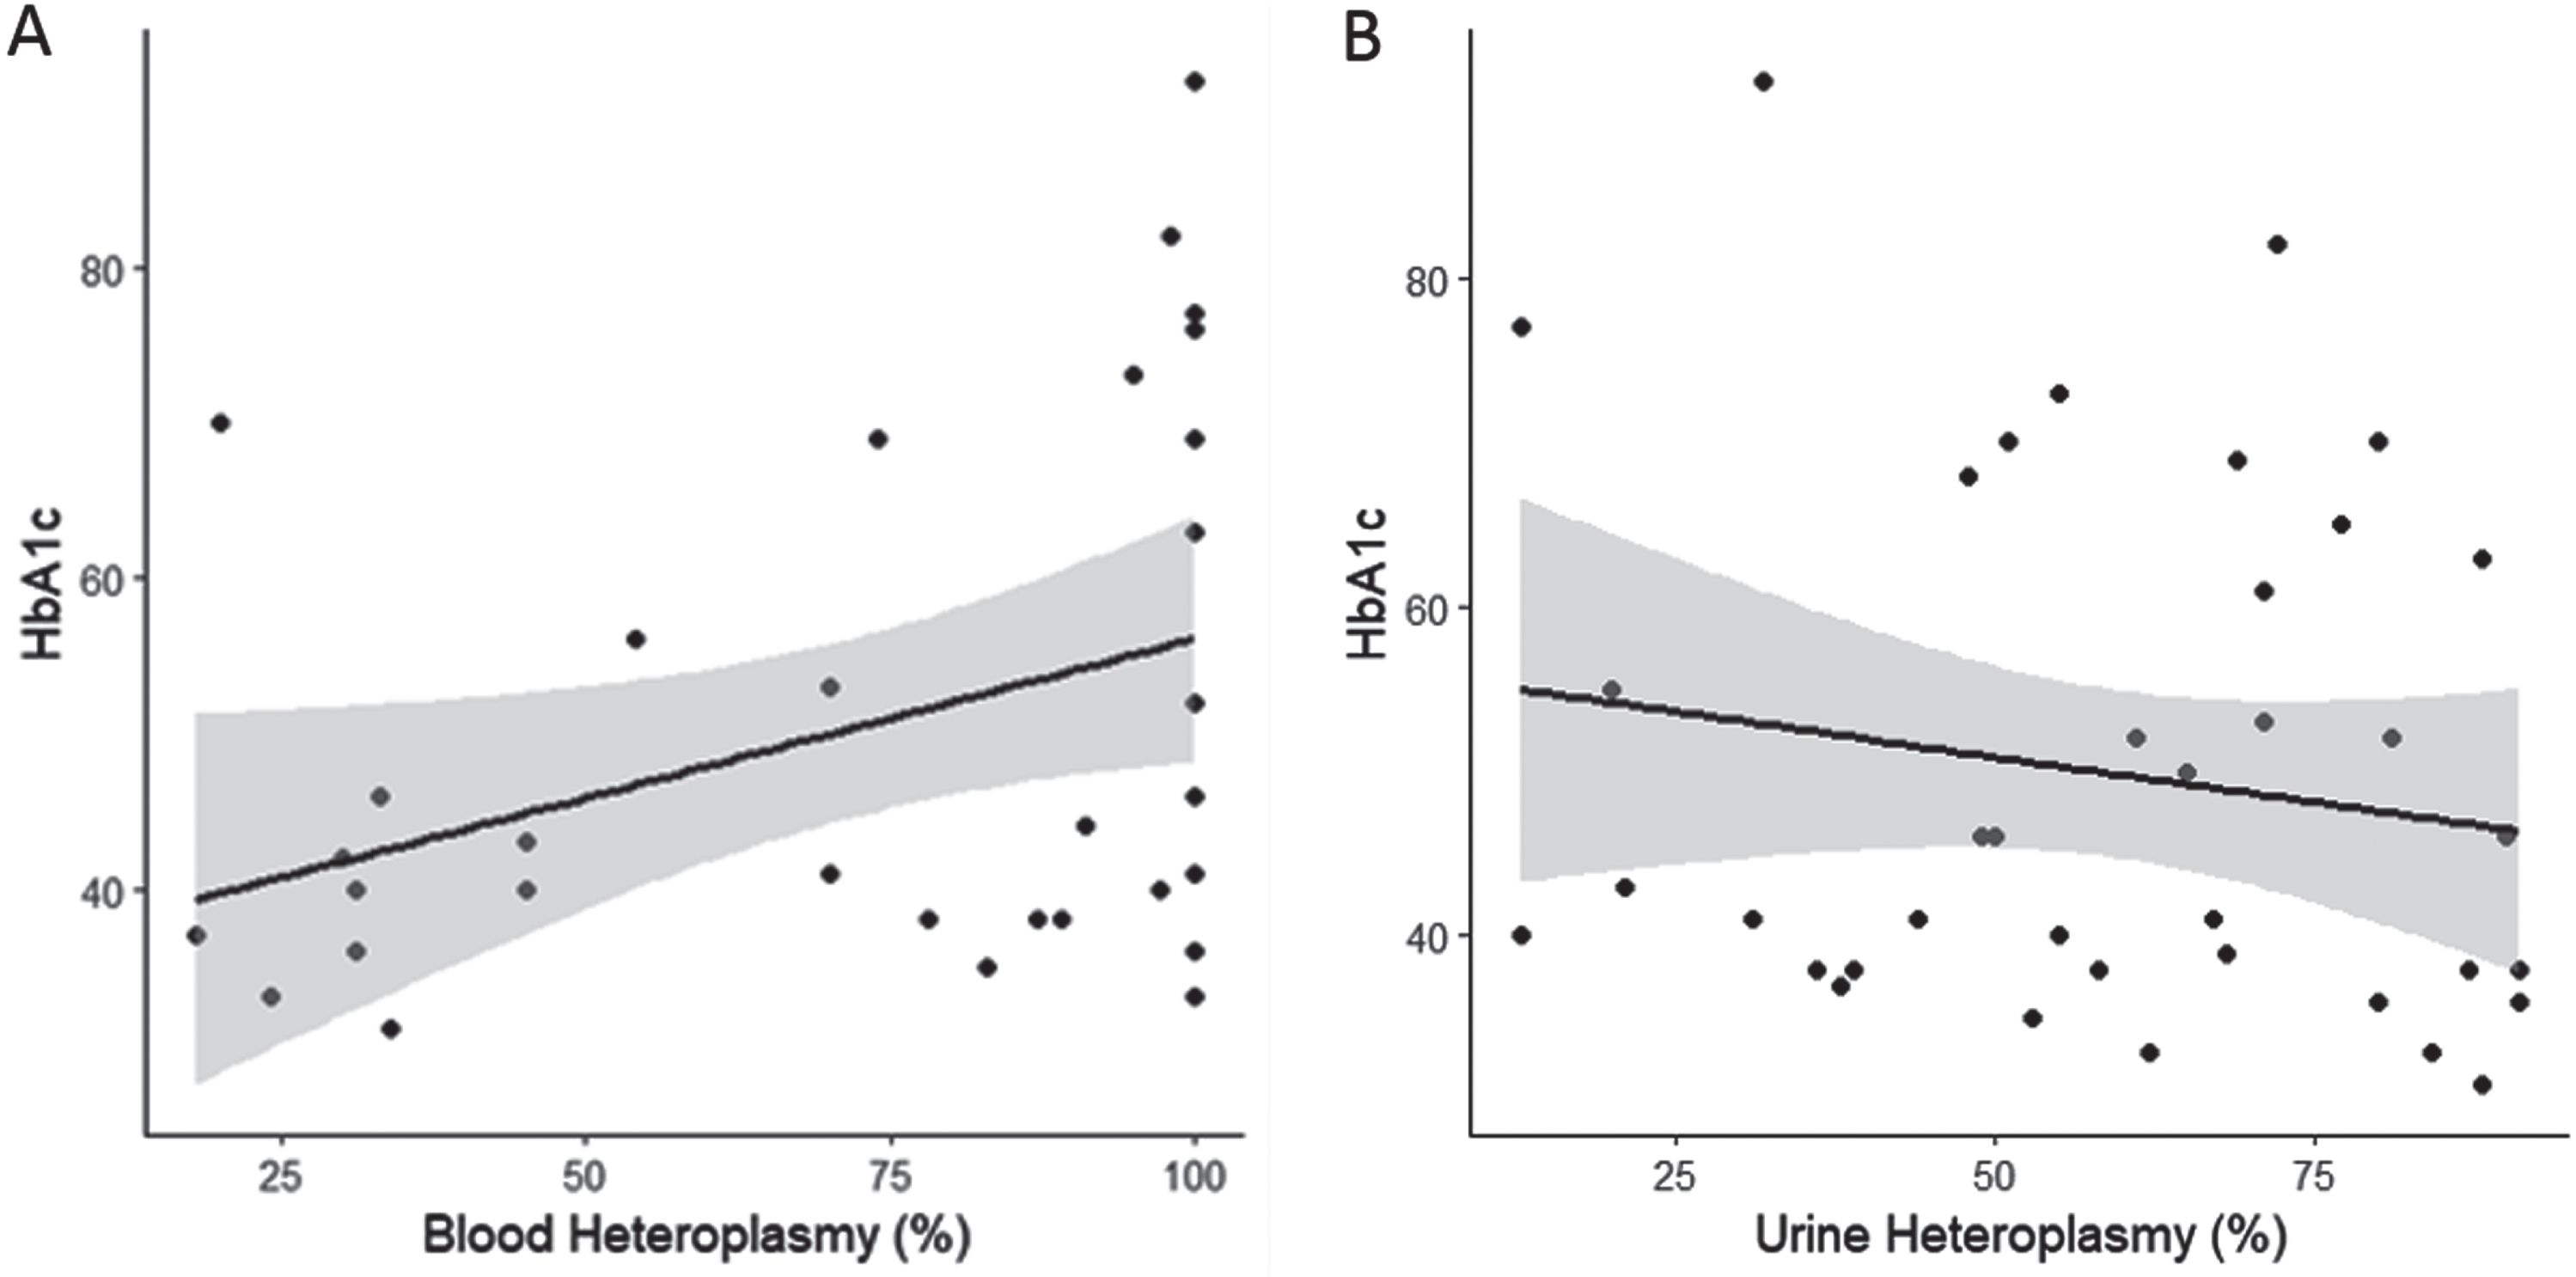
Number of symptoms was not associated with urinary heteroplasmy load (Fig. 1a), corrected blood heteroplasmy load (Fig. 1b), BMI (Fig. 1c), or HbA1c (Fig. 1d), (p > 0.05 in all cases). Number of symptoms, however, was associated with bowel dysmotility, and individuals with bowel dysmotility having an average of 1.62±0.59 [SE] more symptoms than those without (Fig. 1e; F (1,44) = 7.572, p < 0.01, R2 = 0.13). The number of neurological symptoms, the probability of developing a MELAS phenotype, and an individual’s BMI, were not related to any of the variables investigated in this study (p > 0.05 in all cases). HbA1c was significantly associated with corrected blood heteroplasmy load (Fig. 2a; HbA1c = 0.21 * BMI+35.62; F (1,30) = 4.675, p < 0.05, R2 = 0.11), but not urinary heteroplasmy load (Fig. 2b; p > 0.05).
Fig. 1
The association between disease severity (measured by the number of symptoms) with A) urinary heteroplasmy load (n = 40), B) corrected blood heteroplasmy load (n = 33), C) BMI (n = 43), D) HbA1c (n = 45), and E) bowel dysmotility (n = 46). Shaded areas represent 95% confidence intervals.
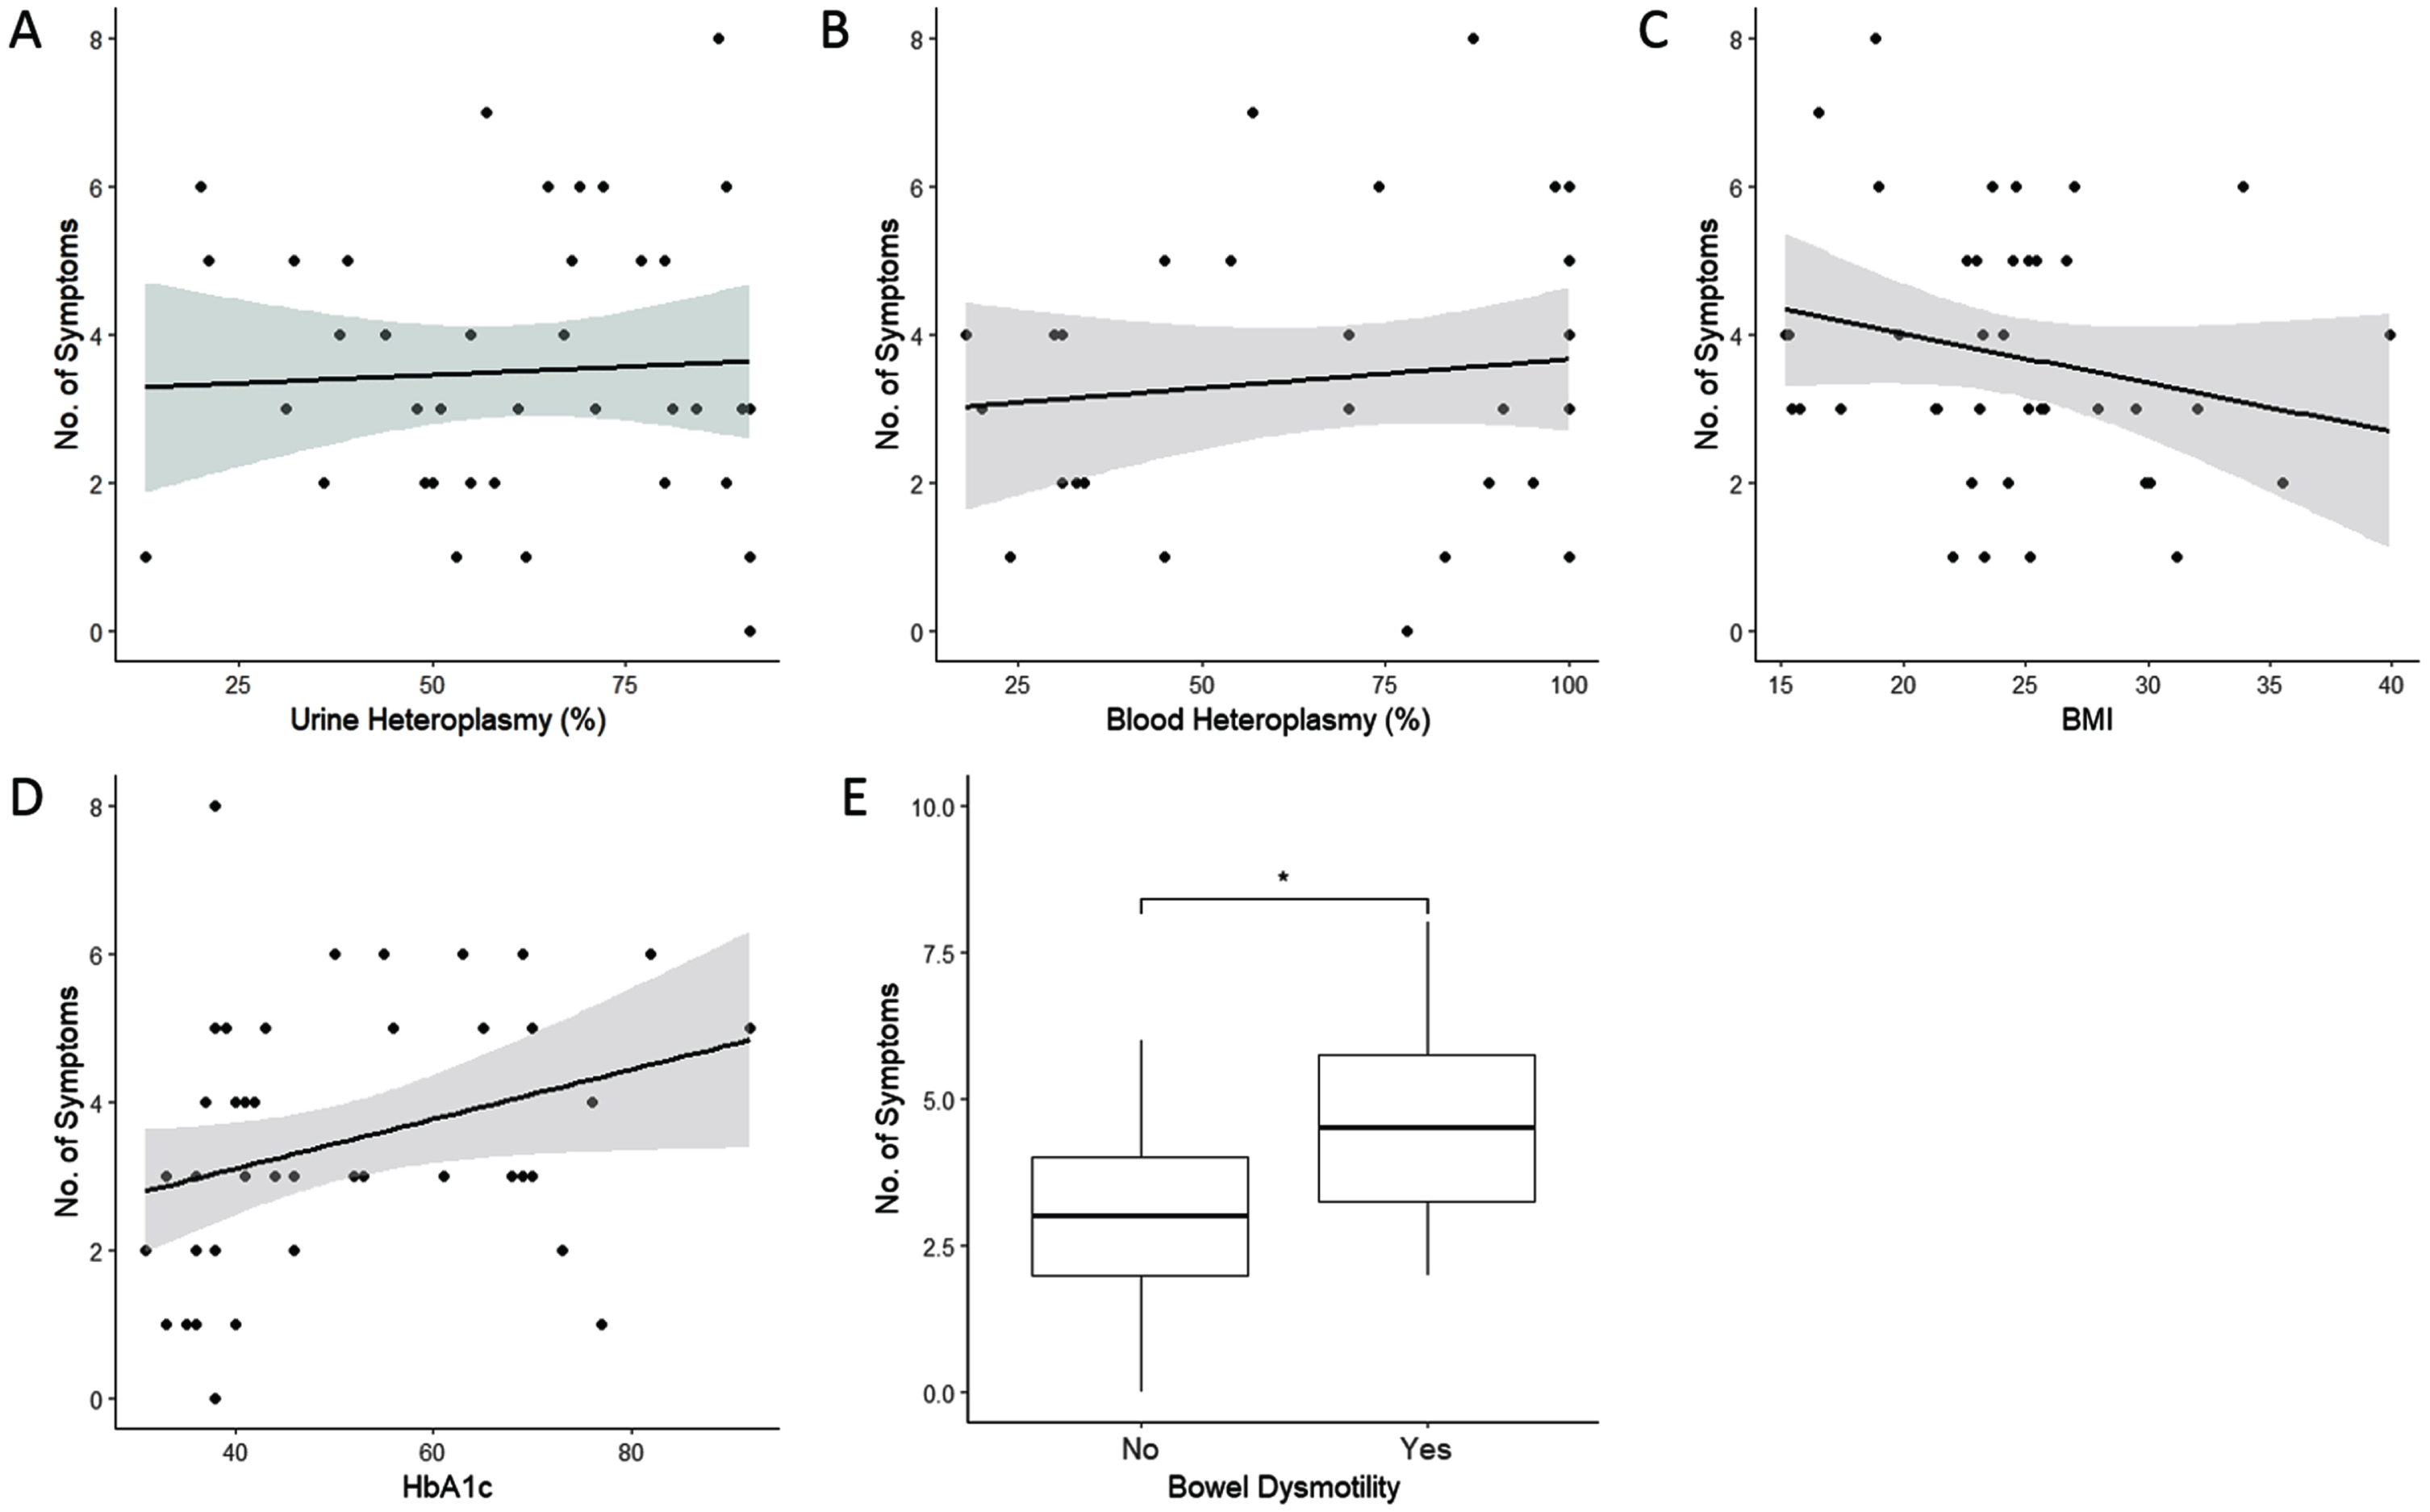
Fig. 2
The association between HbA1c with A) corrected blood heteroplasmy load (n = 32), and B) urinary heteroplasmy load (n = 39). Shaded areas represesnt 95% confidence intervals.
Applying the correct phenotype label
We studied the syndromic label that was given to each individual in correspondence from non-neurological specialties caring for the patients. A phenotype was specified for 27 (58%) individuals by specialities other than their consultant neurologist. The phenotype of MELAS was applied in 24 (89%), MIDD in 4 (15%); 20 out of 27 (74%) individuals were mislabelled. Only 6 out of the 24 (25%) individuals that were given a MELAS label truly had manifestations that fitted the criteria of MELAS. 3 out of 4 (75%) of the individuals were accurately given a MIDD diagnosis.
Deceased individuals
During the period of analysis, 7 of the individuals had died (Table 2). The median age at time of death was 53 years (range 31 –66 years). All individuals were women; 3 of the individuals manifested with a classical MIDD phenotype, 3 with MELAS phenotype including 2 with MELAS/MIDD overlap syndrome and 1 individual without a classical phenotype. A death certificate was available in 3 individuals however the individual’s last illness prior to death was identified in 6 of the 7 individuals.
Table 2
The individuals who died during the data collection period, their age at death, phenotype, tissue heteroplasmy levels and cause of death. (*) corrected heteroplasmy levels. (–) indicates data was unavailable
| Individual | Age at Death | Pedigree | Phenotype | Heteroplasmy (%) | Cause on Death Certificate | |
| Urine | Blood* | |||||
| 1 | 42 | 7 | MELAS/MIDD | 65 | – | No death certificate available |
| 2 | 53 | 1 | MIDD | – | 100 | No death certificate available |
| 3 | 62 | 1 | Atypical | – | 30 | 1a mixed overdose, 2 NSCLC, COPD |
| 4 | 31 | 2 | MELAS | 57 | 57 | 1a MELAS syndrome |
| 5 | 66 | 8 | MIDD | – | 54 | 1a Myocardial Infarction, 1b Biventricular Disease, 2 T2DM and mitochondrial myopathy |
| 6 | 55 | 12 | MELAS/MIDD | – | 97 | 1a Left Ventricular Thrombus, 1b right renal cell carcinoma, 2 MELAS Syndrome, coronary heart disease, T2DM |
| 7 | 49 | 14 | MIDD | 80 | 31 | 1a Multiple organ failure, 1b community acquired pneumonia, 2 MELAS |
The details of the cause of death for individuals 1, 2, 4 and 6 were obtained from their clinical records since they were not detailed in their death certificate. Individual 1 died in the community; the cause of her death was not established and a post-mortem did not take place. Individual 2, was found to have developed progressive multifocal leukoencephalopathy. She was confirmed after investigations in the Neurology Unit to harbour the John Cunningham virus and subsequently discharged home with palliative care input. She died in the community but unfortunately no death certificate was available. Individual 4, presented with acute stroke-like episodes then developed pseudo-obstruction and renal failure. Her death certificate details that she died from MELAS syndrome but does not detail what complications occurred. Individual 6 was deteriorating slowly due to her mitochondrial condition, with heart failure and significant cognitive decline and had renal cancer. The haematologists had been monitoring her closely because of a leucocytosis and thrombocytosis which was not felt to be due to a myeloproliferative disorder.
Pedigrees
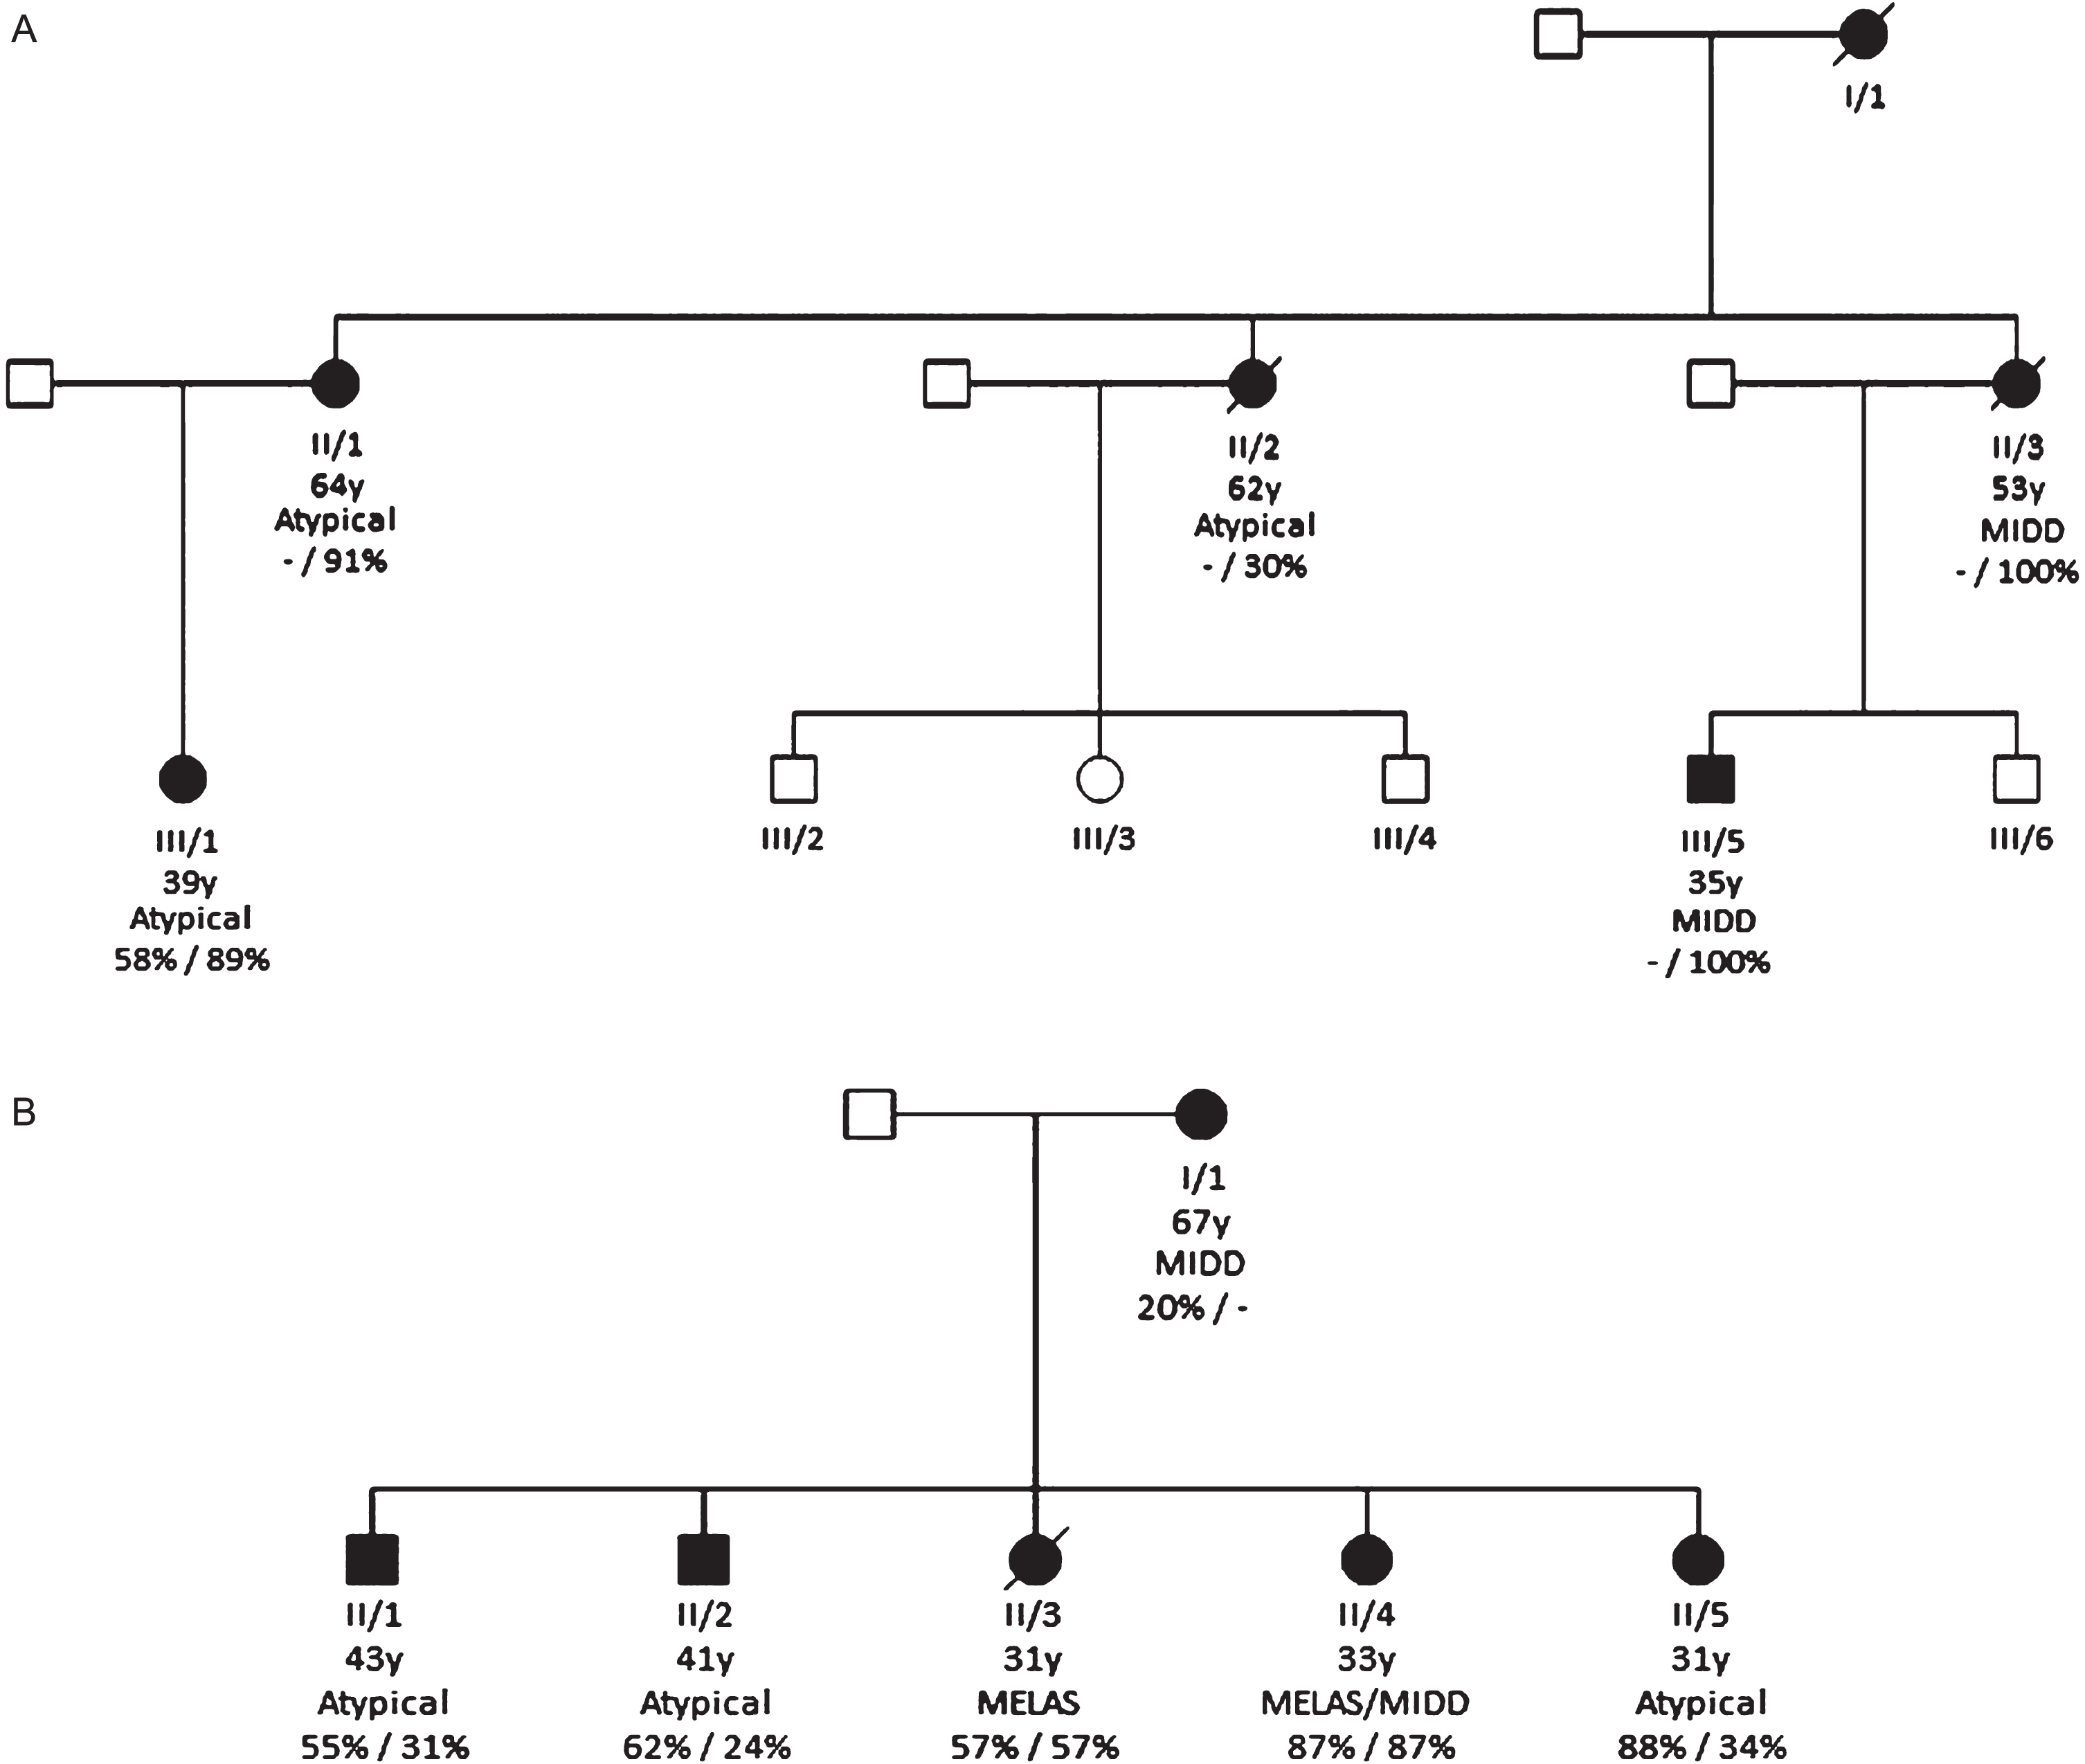
The two largest pedigrees, pedigree A and B, consisted of five and six members, respectively (Fig. 3a and 3b respectively). Two members were deceased in pedigree A and one member deceased in pedigree B at the time of analysis.
Pedigree A
The phenotype of each member in pedigree A (Fig. 3a, Supplement Table 1) varied considerably, with members having low symptom burden and one individual with MIDD who then progressed to a MELAS phenotype. Urinary heteroplasmy levels were only available for individual III/1 (58%). Corrected blood heteroplasmy levels were available for all individuals (mean 82%; range 30 –100%; SD 29.5). Two individuals (II/2 and II/3) were deceased at the time of the study. The mother to individuals II/1, II/2 and II/3 (individual I/1) was deceased prior to the study period and was not included in the results.
Pedigree B
The phenotype of each member of the second pedigree also demonstrated considerable heterogeneity (See Fig. 3b and Supplementary material Table 2). The only clinical manifestation for Individual II/5 was SNHL while their two siblings (II/3 and II/4) presented with typical phenotype of MELAS. Urinary and blood heteroplasmy levels were available for all but one individual (I/1). Mean urinary heteroplasmy load was 62% (range 20 –88; SD = 25.1) and blood heteroplasmy load was 47% (range 24–87; SD = 25.8). Individual II/1 and II/2 in this pedigree also had a muscle biopsy and had a muscle heteroplasmy level of 67% and 87%, respectively. Individual II/3 was deceased at the time of the study (represented as individual 4 in Supplementary material Table 2).
DISCUSSION
This is the first study that aimed to identify and characterise the m.3243A>G population in Scotland, specifically in the West of Scotland. Although the majority had MIDD, a wide range of manifestations were observed including bowel dysmotility, neurological manifestations and fatigue, with a wide spectrum of severity ranging from mild to endstage. This was observed in other studies [6, 7, 32, 33]. We did not find a statistical significance between heteroplasmy levels and the number of general or neurological symptoms. Also, corrected blood heteroplasmy levels were not significantly associated with disease severity. This may be explained by the small size of the cohort, however, we were surprised not to detect even small trends within pedigrees.
The intra-variability of urinary heteroplasmy levels is hypothesised to be compounded by the variation in epithelial cells within urinary samples and underscores the importance of sample timing (first and early morning sample) with concurrent renal function analysis [27]. Current guidance recommends urine heteroplasmy levels as the first line investigation [34]. However, the authors would suggest that these guidelines are amended to also include age-corrected blood heteroplasmy levels as a more reliable measure for routine clinical assessment. The two largest pedigrees in this study lend evidence to phenotype diversity and the limitations of heteroplasmy levels in predicting an individual’s clinical course. One individual (who resides within the Lothian Health Board) is asymptomatic and in fact a marathon runner. It was recommended by the Mitochondrial Specialist Centre in Newcastle that this individual was actively followed up in Glasgow due to having high urinary and blood heteroplasmy levels of 91 and 78 % respectively with a muscle heteroplasmy level of 63%.
Previous studies have reported that the m.3243A>G variant causes diabetes mellitus [35, 36] and that urinary and blood heteroplasmy levels may be associated with HbA1c levels [10], age of diabetes onset [29] and a potential predictor of mortality [29]. HbA1c was not significantly associated with an increased number of overall symptoms but was associated with corrected blood heteroplasmy levels. Nonetheless, a definite trend was apparent between Hb1Ac and disease severity, with the lack of association driven by one patient (who had diabetes alone with high Hb1Ac levels). When this individual was eliminated from the analysis, Hb1Ac was significantly associated with disease severity (F (1,42) = 4.004, p < 0.05, R2 = 0.07). Further research is required to fully assess the potential association between HbA1c and clinical manifestations and what the implications of a significant diabetic burden implies in those with the MIDD phenotype. We observed a trend with an inverse relationship between BMI and clinical manifestations, (Fig. 1c). Previous studies linked BMI and appendicular skeletal mass index with worse disease outcomes including higher prevalence of seizures, encephalopathy and SLEs [37]. Individuals with symptoms of bowel dysmotility significantly displayed more symptoms within other systems (Fig. 1e). This is supported by other studies, which reported bowel dysmotility as contributing towards morbidity and mortality [38]. We hypothesise that reduced production of ATP in mitochondrial cytopathies is compounded by lower BMI and bowel dysmotility..
Our results demonstrate that m.3243A>G individuals are regularly mislabelled by non-neurological specialities with inappropriate use of “MELAS” also noted in death certificates. Although this is recognised, it has not been reported in the literature. Individual 4 (in Supplementary material, Table 2) only had MELAS as the cause of death. Although this individual did fit this phenotype, this is not an appropriate entry for the primary cause of death. Applying phenotypic labels to describe an individual’s clinical manifestation may result in over-reporting of MELAS phenotypes as well as ignoring other manifestations of their condition. We recommend that the term MELAS is avoided; instead the presence of the variant should be used along with a description of the individual’s phenotypic symptoms. This concept should also be applied more widely in genomic research, where acronyms should be avoided and detailed phenotypic descriptions are commended.
We also explored the ICD coding system in relation to mitochondrial disorders [39]. The coding system does not allow classification depending on the specific mitochondrial variant so searching for “m.3243 A > G” returns no results. When searching under “MELAS” this would fall under the subcategory of “Other specified” under the category of “Mitochondrial myopathies (8C73)”. This illustrates the difficulty with the current clinical coding systems and highlights the requirement for simplification. In the case of mitochondrial disorders, there is scope for having a classification based on the specific variant.
There are some limitations to this study. The size of cohort is small and limited to those who were being followed up in the muscle clinic in Glasgow, which would have influenced our results. Moreover, this is a retrospective study, with data collection being limited to correspondence from each individual’s electronic medical records with no standardisation. The application of the Newcastle Mitochondrial Adult Disease Score [40] would have returned more data that would have further assessed disease burden. The measurement of Fibroblast Growth Factor 21 and Growth and Differentiation Factor 15 have both been used as novel biomarkers of mitochondrial diseases [41–43]. Levels were unfortunately not tested in our cohort but would have allowed further analysis of potential predictors of severity.
In conclusion, the West of Scotland cohort with the m.3243 A > G variant present with heterogeneous phenotypes, underscoring the importance of the multidisciplinary team in the surveillance of these patients. From our clinical observations, we inferred that prognosis may be worse in those individuals who have low BMIs, higher HbA1c and in those who experience gastrointestinal symptoms. Further research is required to confirm the relationship between BMI, malabsorption, diabetic control, and clinical manifestations.
ACKNOWLEDGMENTS
The authors would like to thank all patients and their families involved in this study and the clinicians from other specialities caring for these patients.
CONFLICT OF INTEREST
The authors have no conflict of interest to report.
FUNDING
This research did not receive any specific grant from funding agencies in the public, commercial, or not-for-profit sectors.
DATA AVAILABILITY STATEMENT
This work does not include any shared data.
SUPPLEMENTARY MATERIAL
[1] The supplementary material is available in the electronic version of this article: https://dx.doi.org/10.3233/JND-230166.
REFERENCES
[1] | Gorman GS , Schaefer AM , Ng Y , Gomez N , Blakely EL , Alston CL , et al. Prevalence of nuclear and mitochondrial DNA mutations related to adult mitochondrial disease. Ann Neurol (2015) ;77: (5):753–759. doi: 10.1002/ana.24362. |
[2] | Chinnery PF , Howell N , Lightowlers RN , Turnbull DM . Molecular pathology of MELAS and MERRF. The relationship between mutation load and clinical phenotypes. Brain (1997) ;120: (10):1713–1721. doi: 10.1093/brain/120.10.1713. |
[3] | Sproule DM , Kaufmann P . Mitochondrial encephalopathy, lactic acidosis, and strokelike episodes: Basic concepts, clinical phenotype, and therapeutic management of MELAS syndrome. Ann N Y Acad Sci. (2008) ;1142: :133–158. doi: 10.1196/annals.1444.011. |
[4] | Elliott HR , Samuels DC , Eden JA , Relton CL , Chinnery PF . Pathogenic mitochondrial DNA mutations are common in the General Population. Am J Hum Genet (2008) ;83: (2):254–260. doi: 10.1016/j.ajhg.2008.07.004. |
[5] | Manwaring N , Jones MM , Wang JJ , Rochtchina E , Howard C , Mitchell P , et al. Population prevalence of the MELAS AG mutation. Mitochondrion (2007) ;7: (3):230–233. doi: 10.1016/j.mito.2006.12.004. |
[6] | Majamaa K , Moilanen JS , Uimonen S , Remes AM , Salmela PI , Kärppä M , et al. Epidemiology of AG, the mutation for mitochondrial encephalomyopathy, lactic acidosis, and strokelike episodes: Prevalence of the mutation in an adult population. Am J Hum Genet (1998) ;63: (2):447–454. doi: 10.1086/301959. |
[7] | Nesbitt V , Pitceathly RDS , Turnbull DM , Taylor RW , Sweeney MG , Mudanohwo EE , et al. The UK MRC Mitochondrial Disease Patient Cohort Study: Clinical phenotypes associated with the m. A>G mutation - Implications for diagnosis and management. J Neurol Neurosurg Psychiatry (2013) ;84: (8):936–938. doi: 10.1136/jnnp-2012-303528. |
[8] | Dvorakova V , Kolarova H , Magner M , Tesarova M , Hansikova H , Zeman J , et al. The phenotypic spectrum of fifty Czech m. A>G carriers. Mol Genet Metab (2016) ;118: (4):288–295. doi: 10.1016/j.ymgme.2016.06.003. |
[9] | Finsterer J , Laccone F Phenotypic heterogeneity in 5 family members with the mitochondrial variant m. a>g. Am J Case Rep (2020) ;21: :e927938. doi: 10.12659/AJCR.927938. |
[10] | Laloi-Michelin M , Meas T , Ambonville C , Bellanné-Chantelot C , Beaufils S , Massin P , et al. The clinical variability of maternallyinherited diabetes and deafness is associated with the degree ofheteroplasmy in blood leukocytes. J Clin Endocrinol Metab (2009) ;94: (8):3025–3030. doi: 10.1210/jc.2008-2680. |
[11] | Mancuso M , Orsucci D , Angelini C , Bertini E , Carelli V , Comi G Pietro , et al. The m. A>G mitochondrial DNA mutation and related phenotypes. A matter of gender. J Neurol (2014) ;261: (3):504–510. doi: 10.1007/s00415-013-7225-3. |
[12] | Pickett SJ , Grady JP , Ng YS , Gorman GS , Schaefer AM , Wilson IJ , et al. Phenotypic heterogeneity in m. A>G mitochondrial disease: The role of nuclear factors. Ann Clin Transl Neurol (2018) ;5: (3):333–345. doi: 10.1002/acn3.532. |
[13] | Ng YS , Lax NZ , Blain AP , Erskine D , Baker MR , Polvikoski T , et al. Forecasting stroke-like episodes and outcomes in mitochondrial disease. Brain (2022) ;145: (2):542–554. doi: 10.1093/brain/awab353. |
[14] | Liu G , Shen X , Sun Y , Lv Q , Li Y , Du A . Heteroplasmy and phenotype spectrum of the mitochondrial tRNALeu (UUR) gene m. A>G mutation in seven Han Chinese families. J Neurol Sci (2020) ;408: :116562. doi: 10.1016/j.jns.2019.116562. |
[15] | Petty RKH , Harding AE , Morgan-Hughes JA . The Clinical Features of Mitochondrial Myopathy. Brain (1986) ;109: (5):915–938. doi: 10.1093/brain/109.5.915. |
[16] | Ng YS , Bindoff LA , Gorman GS , Horvath R , Martikainen MH , Klopstock T , et al. Consensus-based statements for the management of mitochondrial stroke-like episodes. Wellcome Open Res (2019) ;4: :201. doi: 10.12688/wellcomeopenres.15599.1. |
[17] | El-Hattab AW , Adesina AM , Jones J , Scaglia F . MELAS syndrome: Clinical manifestations, pathogenesis, and treatment options. Mol Genet Metab. (2015) ;116: (1-2):4–12. doi: 10.1016/j.ymgme.2015.06.004. |
[18] | Bates MGD , Bourke JP , Giordano C , D’Amati G , Turnbull DM , Taylor RW Cardiac involvement in mitochondrial DNA disease: Clinical spectrum, diagnosis, and management. Eur Heart J (2021) ;33: (24):3023–3033. doi: 10.1093/eurheartj/ehs275. |
[19] | Narbonne H , Paquis-Fluckinger V , Valero R , Heyries L , Pellissier JF , Vialettes B . Gastrointestinal tract symptoms in Maternally Inherited Diabetes and Deafness (MIDD). Diabetes Metab (2004) ;30: (1):61–66. doi: 10.1016/S1262-3636(07)70090-3. |
[20] | Ng YS , Grady JP , Lax NZ , Bourke JP , Alston CL , Hardy SA , et al. Sudden adult death syndrome in m. A>G-related mitochondrial disease: An unrecognized clinical entity in young, asymptomatic adults. Eur Heart J (2016) ;37: (32):2552–2559. doi: 10.1093/eurheartj/ehv306. |
[21] | Pavlakis SG , Phillips PC , DiMauro S , De Vivo DC , Rowland LP . Mitochondrial myopathy, encephalopathy, lactic acidosis, and strokelike episodes: A distinctive clinical syndrome. Ann Neurol (1984) ;16: (4):481–488. doi: 10.1002/ana.410160409. |
[22] | Hanna MG , Nelson IP , Morgan-Hughes JA , Wood NW . MELAS: A new disease associated mitochondrial DNA mutation and evidence for further genetic heterogeneity. J Neurol Neurosurg Psychiatry (1998) ;65: (4):512–517. doi: 10.1136/jnn65.4.512. |
[23] | Whittaker RG , Blackwood JK , Alston CL , Blakely EL , Elson JL , McFarland R , et al. Urine heteroplasmy is the best predictor of clinical outcome in the ma>g. MTDNA mutation. Neurology (2009) ;72: (6):568–569. doi: 10.1212/01.wnl.0000342121.91336.4d. |
[24] | Fayssoil A , Laforêt P , Bougouin W , Jardel C , Lombès A , Bécane HM , et al. Prediction of long-term prognosis byheteroplasmy levels of the m. A>G mutation in patients with themitochondrial encephalomyopathy, lactic acidosis and stroke-likeepisodes syndrome. Eur J Neurol (2017) ;24: (2):255–261. doi: 10.1111/ene.13176. |
[25] | De Laat P , Koene S , Van Den Heuvel LPWJ , Rodenburg RJT , Janssen MCH , Smeitink JAM . Clinical features and heteroplasmy in blood, urine and saliva in 34 Dutch families carrying the mA>G mutation. J Inherit Metab Dis (2012) ;35: (6):1059–1069. doi: 10.1007/s10545-012-9465-2. |
[26] | Grady JP , Pickett SJ , Ng YS , Alston CL , Blakely EL , Hardy SA , et al. mt DNA heteroplasmy level and copy number indicate disease burden in m. A>G mitochondrial disease. EMBO Mol Med (2018) ;10: (6):1–13. doi: 10.15252/emmm.201708262. |
[27] | de Laat P , Rodenburg RJ , Smeitink JAM , Janssen MCH . Intra-patient variability of heteroplasmy levels in urinary epithelial cells in carriers of the m. A>G mutation. Mol Genet Genomic Med (2019) ;7: (2):e00523. doi: 10.1002/mgg3.523. |
[28] | Mehrazin M , Shanske S , Kaufmann P , Wei Y , Coku J , Engelstad K , et al. Longitudinal changes of mtDNA AG mutation load and level of functioning in MELAS. Am J Med Genet A (2009) ;149A: (4):584–587. doi: 10.1002/ajmg.a.32703. |
[29] | Yang M , Xu L , Xu C , Cui Y , Jiang S , Dong J , et al. The Mutations and Clinical Variability in Maternally Inherited Diabetes and Deafness: An Analysis of 161 Patients. Front Endocrinol (Lausanne) (2021) ;12: :728043. doi: 10.3389/fendo.2021.728043. |
[30] | Papadopoulos C , Wahbi K , Behin A , Bougouin W , Stojkovic T , Leonard-Louis S , et al. Incidence and predictors of total mortality in 267 adults presenting with mitochondrial diseases. J Inherit Metab Dis (2020) ;43: (3):459–466. doi: 10.1002/jimd.12185. |
[31] | R Core Team. R: A language and environment for statistical computing. R Foundation for Statistical Computing, Vienna, Austria, 2020. [Online]. Available: https://www.rproject.org/ |
[32] | Farrugia ME , Longman C , Snadden L , Gorman GS , Schaefer AM , Taylor RW , et al. Ascertainment of the adult patient cohort with mitochondrial disease in Glasgow. J Neuromuscul Dis (2018) ;5: :S128–S129. https://www.embase.com/search/results?subaction=viewrecord&id=L624073194&from=export%0Ahttp://dx.doi.org/10.3233/JND-189001. |
[33] | El-Hattab AW , Emrick LT , Hsu JW , Chanprasert S , Jahoor F , Scaglia F , et al. Glucose metabolism derangements in adults with the MELAS mA>G mutation. Mitochondrion (2014) ;18: :63–69. doi: 10.1016/j.mito.2014.07.008. |
[34] | Mavraki E , Labrum R , Sergeant K , Alston CL , Woodward C , Smith C , et al. Genetic testing for mitochondrial disease: The United Kingdom best practice guidelines. Eur J Hum Genet. (2023) ;31: (2):148–163. doi: 10.1038/s41431-022-01249-w. |
[35] | Li Yee M , Wong R , Datta M , Fazio TN , Ebrahim MM , McNamara EC , et al. Mitochondrial disease: An uncommon but important cause of diabetes mellitus. Endocrinol. Diabetes Metab Case Report (2018) 2018: :18–0091. doi: 10.1530/EDM-18-0091. |
[36] | Lindroos MM , Majamaa K , Tura A , Mari A , Kalliokoski KK , Taittonen MT , et al. m. A<G mutation in mitochondrial DNA leads to decreased insulin sensitivity in skeletal muscle and to progressive β-cell dysfunction. Diabetes. (2009) ;58: (3):543–549. doi: 10.2337/db08-0981. |
[37] | Hou Y , Xie Z , Zhao X , Yuan Y , Dou P , Wang Z . Appendicular skeletal muscle mass: A more sensitive biomarker of disease severity than BMI in adults with mitochondrial diseases. PLoS One (2019) ;14: (7):e0219628. doi: 10.1371/journal.pone.0219628. |
[38] | Ng YS , Feeney C , Schaefer AM , Holmes CE , Hynd P , Alston CL , et al. Pseudo-obstruction, stroke, and mitochondrial dysfunction: A lethal combination. Ann Neurol. (2016) ;80: (5):686–692. doi: 10.1002/ana.24736. |
[39] | World Health Organization (WHO). International Classification of Diseases, Eleventh Revision (ICD-11). [Online]. Available: https://icd.who.int/browse11 |
[40] | Schaefer AM , Phoenix C , Elson JL , McFarland R , Chinnery PF , Turnbull DM . Mitochondrial disease in adults: A scale to monitor progression and treatment. Neurology (2006) ;66: (12):1932–1934. doi: 10.1212/01.wnl.0000219759.72195.41. |
[41] | Koene S , de Laat P , van Tienoven DH , Vriens D , Brandt AM , Sweep FCGJ , et al. Serum FGF21 levels in adult m. A>G carriers. Neurology (2014) ;83: (2):125–33. doi: 10.1212/WNL.0000000000000578. |
[42] | Suomalainen A , Elo JM , Pietiläinen KH , Hakonen AH , Sevastianova K , Korpela M , et al. FGF-21 as a biomarker for muscle-manifesting mitochondrial respiratory chain deficiencies: A diagnostic study. Lancet Neurol (2011) ;10: (9):806–818. doi: 10.1016/S1474-4422(11)70155-7. |
[43] | Poulsen NS , Madsen KL , Hornsyld TM , Eisum AV , Fornander F , Buch AE , et al. Mitochondrion Growth and differentiation factor 15 as a biomarker for mitochondrial myopathy. Mitochondrion (2020) ;50: :35–41.10.1016/j.mito.2019.10.005. |


