
Quantifying Variability in Motor Function in Duchenne Muscular Dystrophy: UK Centiles for the NorthStar Ambulatory Assessment, 10 m Walk Run Velocity and Rise from Floor Velocity in GC Treated Boys
Abstract
Background
Boys with Duchenne Muscular Dystrophy (DMD) display heterogeneous motor function trajectory in clinics, which represents a significant obstacle to monitoring.
Objective:
In this paper, we present the UK centiles for the North Star Ambulatory Assessment (NSAA), the 10 m walk/run time (10MWR) and velocity (10MWRV), and the rise from floor time (RFF) and velocity (RFFV) created from a cohort of glucocorticoid treated DMD boys between the age of 5 and 16 years.
Methods:
Participants were included from the UK NorthStar registry if they had initiated steroids (primarily deflazacorts/prednisolone, intermittent/daily) and were not enrolled in an interventional trial. Assessments were included if the participant had a complete NSAA, the timed tests had been completed or the corresponding items were 0, or the participant was recorded as non-ambulant, in which case the NSAA was assumed 0.
Results:
We analysed 3987 assessments of the NSAA collected from 826 participants. Of these, 1080, 1849 and 1199 were imputed as 0 for the NSAA, RFFV and 10MWRV respectively. The 10th, 25th, 50th, 75th and 90th centiles were presented. The NSAA centiles showed a peak score of 14, 20, 26, 30 and 32 respectively, with loss of ambulation at 10.7, 12.2 and 14.3 years for the 25th, 50th and 75th centiles, respectively. The centiles showed loss of rise from floor at 8.6, 10.1 and 11.9 years and a loss of 10MWR of 0 at 8.9, 10.3 and 13.8 years for the 25th, 50th and 75th centiles, respectively. The centiles were pairwise less correlated than the raw scores, suggesting an increased ability to detect variability in the DMD cohort.
Conclusions:
The NSAA, 10MWR and RFF centiles may provide insights for clinical monitoring of DMD boys, particularly in late ambulatory participants who are uniformly declining. Future work will validate the centiles in national and international natural history cohorts.
INTRODUCTION
Duchenne Muscular Dystrophy (DMD) is a recessive, X-linked disorder caused primarily by out-of-frame pathogenic variants affecting the expression of the dystrophin gene. Patients with DMD broadly move through four disease stages, motor function gain and stability (early ambulatory), progressive motor function loss (late ambulatory), progressive upper-limb function loss (early non-ambulatory) and progressive cardiac and respiratory difficulty (late non- ambulatory) [1]. However, even in the ambulatory stages there is a high degree of disease heterogeneity for age.
There are several factors which contribute to disease course heterogeneity in DMD, ranging from a number of genes which have been demonstrated to modify disease trajectories, to implementation of evolving standards of care. Despite continuous therapeutic developments [2–5], the current standard of care treatment for most DMD boys is glucocorticoid (GC) treatment [6]. In the UK, boys are prescribed prednisolone/prednisone or deflazacort, with a daily or intermittent (10 days on, 10 days off) regime [7]; however, other regimes are in use globally [8] and short-term data from clinical trials have shown that the GC derivative designed to reduce adverse events, Vamorolone, has similar efficacy [9]. The age at starting GC is also varied, with potential impacts on disease trajectory over time.
The North Star Ambulatory Assessment (NSAA) was specifically developed to capture motor function in the ambulatory DMD population [10], with a focus during development on its validity using Rasch analysis [11]. The NSAA total score consists of the sum of 17 items, graded 0, 1 and 2 for inability, ability with compensatory actions, and full ability. Two of the items are timed, item 11 –the rise from supine time (also known as rise from floor time or RFF), and item 17- the 10 m walk/run time (10MWR). The items are age appropriate at different ages in typically developing boys [12], and the NSAA scale is validated in DMD for boys over 5 [10, 13].
The disease heterogeneity limits the utility and interpretability of the motor function assessment for patients, parents and clinical teams. For example, a NSAA score of 20 in a boy of age 5 years may represent an assessment where some of the items where not developmentally acquired yet, whilst in a 7 year old the same score is indicative of a typical boy with DMD and in a 14 year old this score is indicative of a milder or intermediate phenotype. Additionally, in the decline phase of the NSAA trajectory, it can be difficult to characterise whether decline in the NSAA score is typical or represents an abnormal trend where further monitoring or intervention is required.
The extent to which boys with DMD vary also increases with age. This is analogous to growth in children, whereby the variability in height of children becomes more as they get older. Centiles have been developed historically to quantify the spread of this growth data, and as a way to contextualise the relative growth of a child with respect to their peers. More recently, these methods have been developed for other motor function outcomes including the Motor Function Measure (MFM) for DMD [14] and several outcome measures for cerebral palsy [15–17]. Centiles have also recently been presented for the MFMF, 10MWR time and other strength measures in a small cohort (73 patients) in Brazil, however, the low sample size, discretised age and lack of imputation of scores leads to biased trend over time (such as linearly increasing 10MWR times with age) [18]. Centiles for age help to describe the relative heterogeneity. The centile literature contains methods for identifying patients who have abnormal change with time, i.e., those who are tracking up or down on the centiles over time.
Therefore, the aims of this work are 1) to describe the trends and variability of the NSAA, RFF and 10MWR in GC treated DMD boys between ages 5 and 16 years, 2) to show the utility of the centiles on the NSAA trajectories and contextualising the decline phase of the disease, 3) to present reference tables of the centiles and Z-scores for future use and 4) to present threshold values for loss of ambulation, RFF and 10MWR up to a year.
MATERIALS AND METHODS
In October 2006, the UK’s longitudinal DMD registry was established across 23 paediatric neuromuscular centres, with observations captured and stored in the NorthStar database. Patients are scheduled for clinic visits every 6 months, where both physio and medical assessments are performed. Patient care is informed by the standards of care recommendations [6, 19, 20], and clinical assessments are in line with the Declaration of Helsinki (2000) and the Principles of Good Clinical Practice. The NorthStar database has Caldicott Guardian approval, and informed consent is obtained for data to be collected and stored.
Participants
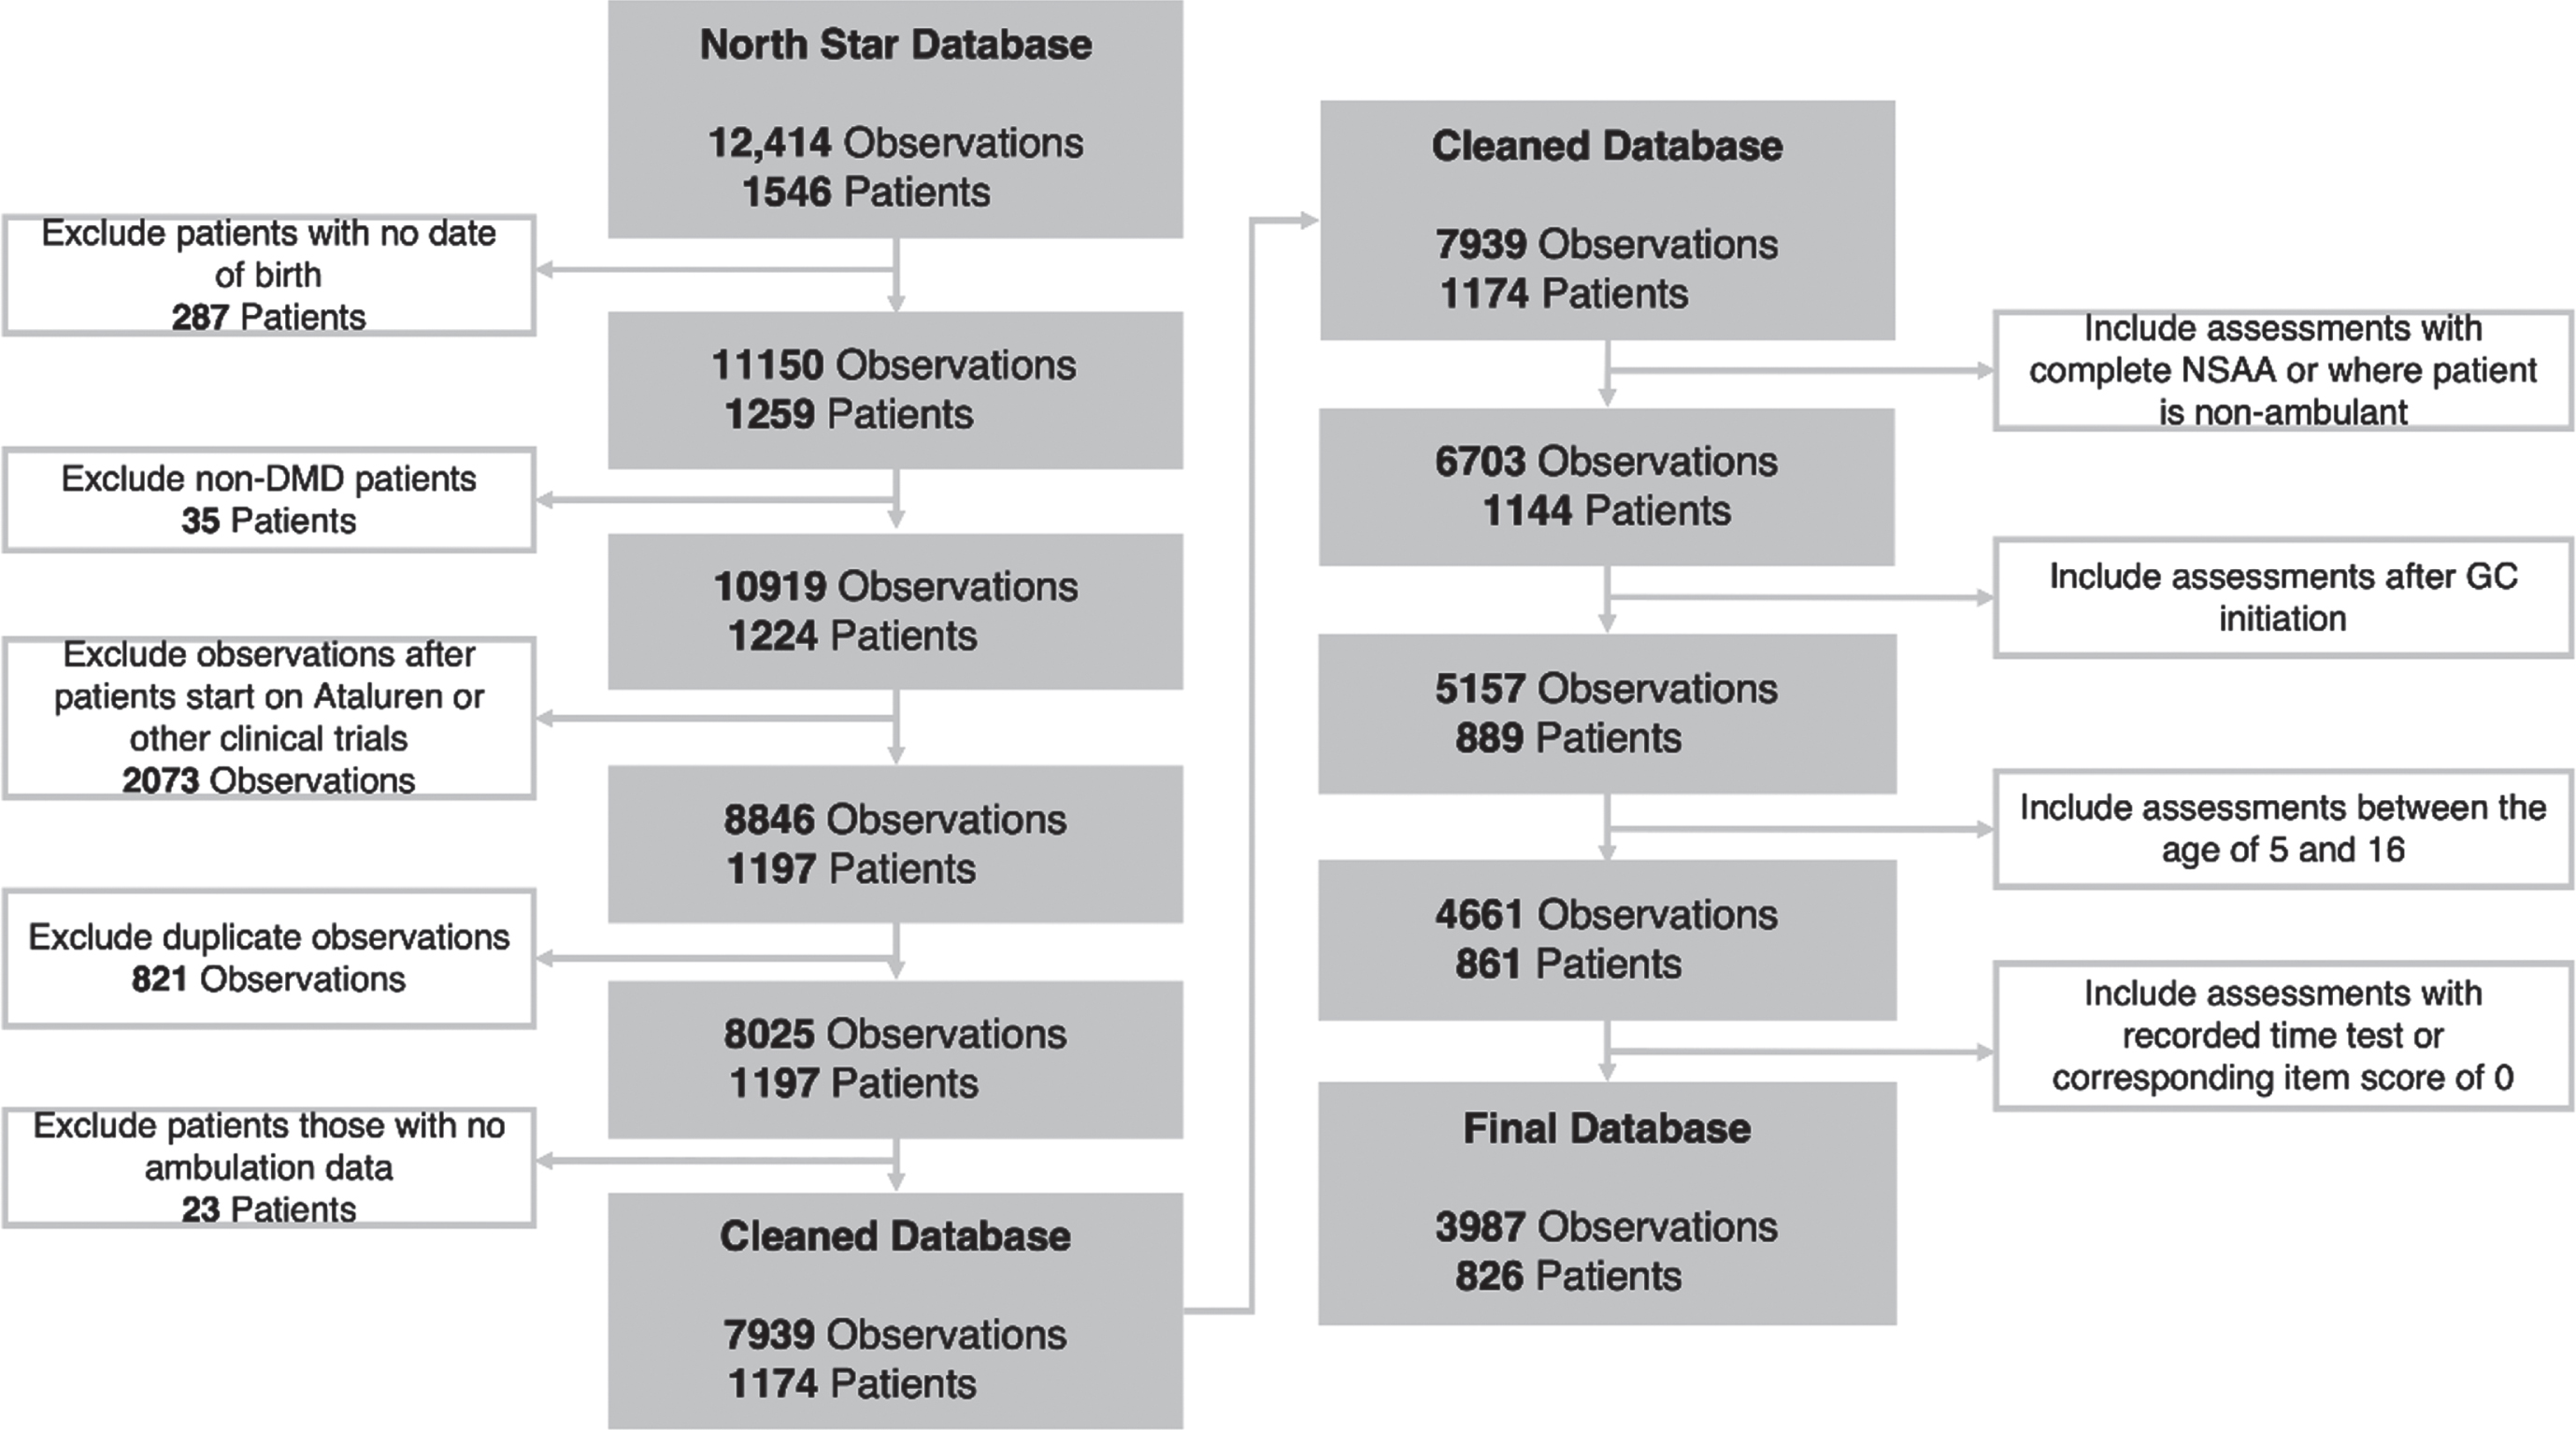
Boys enrolled in the NorthStar Database before July 2022 with diagnosis of DMD (as opposed to Becker Muscular Dystrophy, intermediate DMD and symptomatic carriers) were included in this analysis. Patients were excluded if they had no known ambulatory status or were enrolled in a clinical trial. The cleaning structure was aligned with previous work on the NorthStar Database, although this study utilised a more up to date data cut [21]. The age of 5 years was chosen as the minimum age as at this age the NSAA is age-appropriate in healthy controls [12], whilst the maximum of 16 years was selected as the upper limit as this is the age when patients typically start transition to adult care. The full data cleaning is described in Fig. 1.
Fig. 1
Data diagram.
Patient subgroups
In order to capture those following the standards of care, patients who initiated GC were included in the analysis from the age they started treatment. Patients were primarily on prednisolone or deflazacort, intermittent or daily, but other GC regimes were included. If patients were recorded as on the same type and regime at two time points but had no recorded type or regime between the two, it was assumed that they had stayed on a consistent GC type or regime. Patients were classified to a GC group type and regime based on the type and regime they spent the most time recorded on, between starting GC and their most recent visit.
Patients were also stratified by their dystrophin isoform groups, and their amenability to several exon skipping drugs. The genetic information was interpretable for 82% of patients. Pathogenic variants upstream of exon 44 lead to patients classified as Dp427 negative/Dp140 positive/Dp71 positive, those between exon 51 and 62 inclusive, but not downstream of exon 63, lead to patients classified as Dp427 negative/Dp140 negative/Dp71 positive and changes downstream of exon 63 lead to patients classified as Dp427 negative/Dp140 negative/Dp71 negative. DMD variants affecting the region between exon 45 and exon 51, but not downstream of exon 51, lead to patients classified as Dp427 negative/Dp140 unknown/Dp71 positive as the Dp140 promoter is located in exon 44 and the translation start site for Dp140 is located in exon 51 [22]. Secondly, DMD deletions were classified according to their amenability to skipping of exons 8, 44, 45, 51, and 53.
Informative drop-out in the centile outcomes
Assessments were included only if at that timepoint the patient performed all items of the NSAA, or they were recorded as non-ambulant, in which case their NSAA total score was recorded as 0. Centiles were calculated for the RFF and 10MWR velocities, defined as RFFV = 1/RFF and 10WRV = 10/10MWR respectively, and then back-calculated to get RFF and 10MWR velocities. For these velocities, an inability to complete the item was considered as a velocity of 0. Assessments were included only if the RFF was reported, or if the item 11 (RFF) was recorded as 0, in which case RFFV was imputed as 0. Assessments were included only if the 10MWR time was not missing, or if item 2 (walk) was recorded as 0, suggesting that the patient was unable to walk or could not increase walking speed, as per NSAA scoring criteria. In these cases, the 10MWRV was imputed as 0. Of note, we did not use the corresponding item 17 (run 10 m), as boys who score 0 on this item may still have a valid 10MWR time. For both, times longer than 30 seconds were discarded.
Statistical methods
To fit the centiles, Generalised Additive Models for Location, Scale and Shape (GAMLSS) were used [23]. In order to have scores bounded by 0,1 the NSAA and RFFV were scaled by a factor of 1/34 and 0.1 respectively for the fitting. Seven distributional families were considered (beta, and six forms of logit: normal, generalised beta type 2, Johnson su, logistic, skew exponential power type 1, sinh arcsinh, skew t type 1 and t), which were 0-1 inflated (for the NSAA) or 0-inflated (for the RFFV and 10MWRV which were defined on [0,1)). The family with the optimal fit (defined using residual and marginal plot inspection, when the other model parameters were defined flexibly (using P-splines)) was selected. The mean, variance, floor effect and ceiling effect models (if applicable) were then selected as the combination which minimised the Bayesian Information Criterion (BIC) across constant, linear, quadratic and spline models. The models are visualised as 10th, 25th, 50th, 75th and 90th centile curves in the paper, in line with the MFM centiles previously published in DMD 14], but Supplementary Tables 4–6 contain the data necessary to plot any other centile curves (e.g. the 0.4th, 2nd, 9th, 91st, 98th and 99.6th centiles used in the UK-WHO growth charts). The centiles can also be visualised in Z-score plots, where each centile appears as a horizontal straight line—the link between centile and Z-score is defined by the distribution used in the GAMLSS model. Survival modelling of time-to-loss of the NSAA, RFF and 10MWR was done using the Kaplan Meier curve with adjustment for interval censored data, in that patients attended clinics only every 6 months and were considered to have lost their skill between visits. All analyses were done in R (version number 4.2.2).
RESULTS
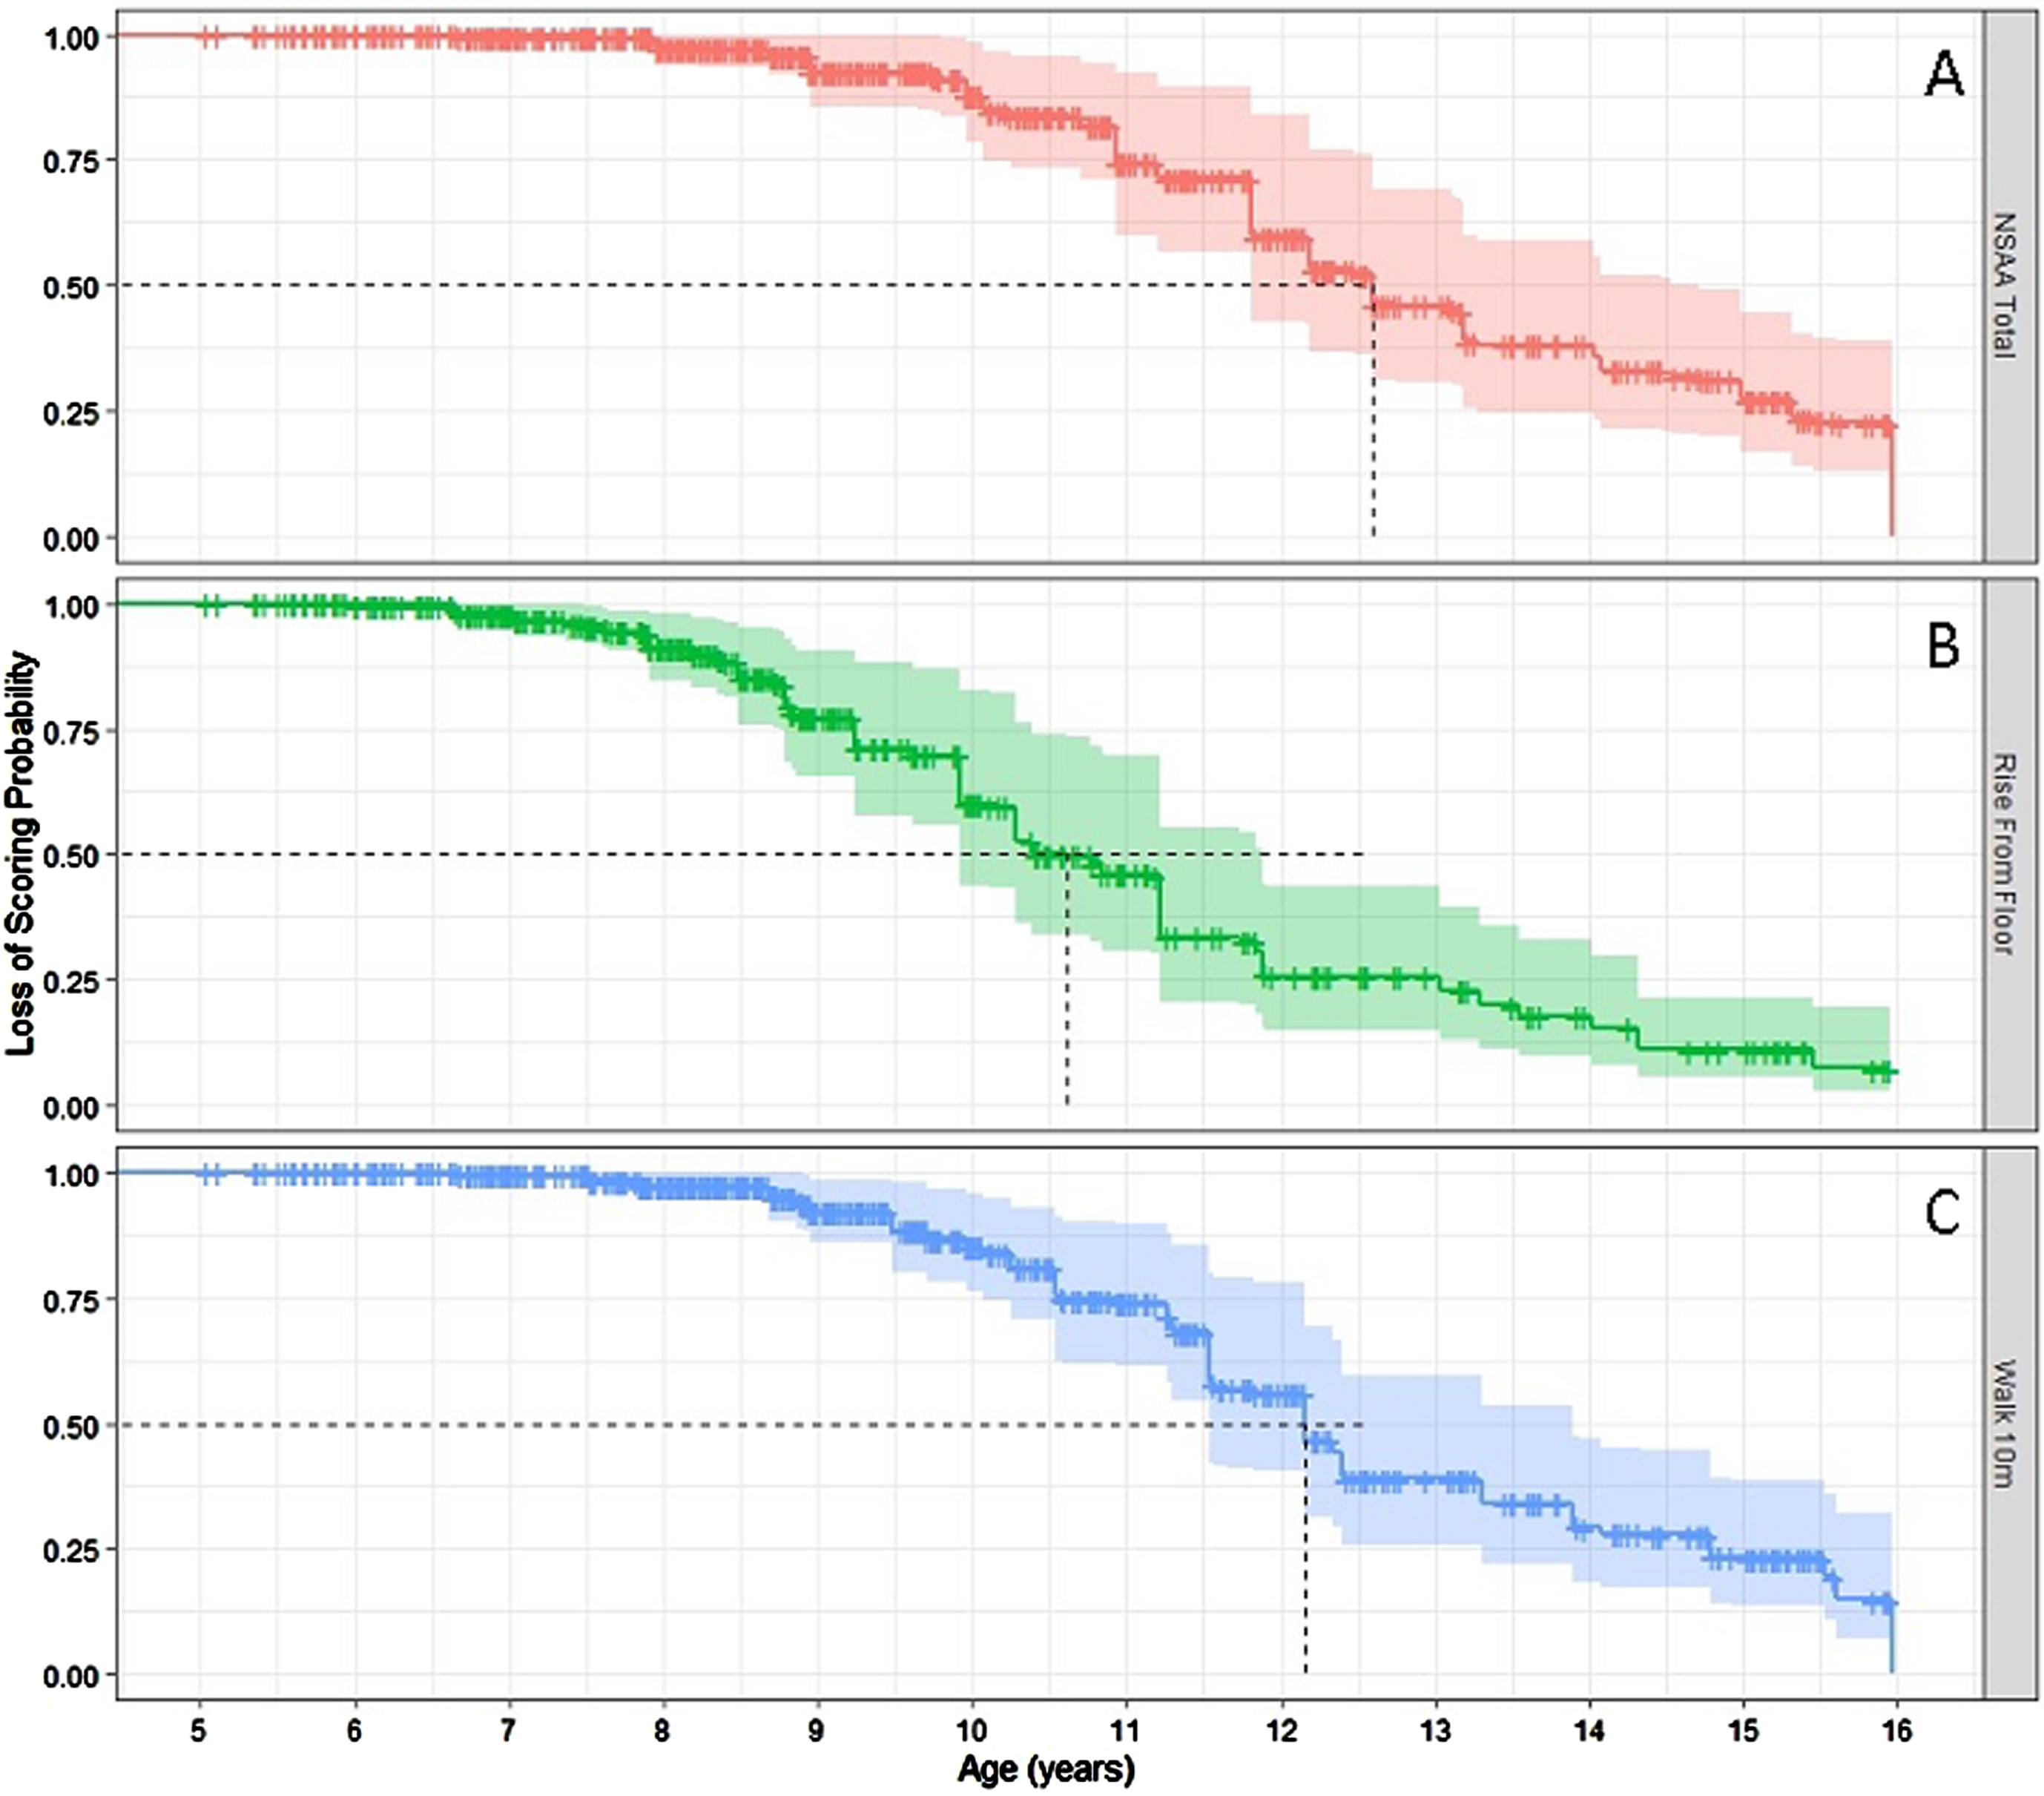
This analysis included 826 UK patients assessed across 3,987 visits, averaging 4.3 visits per person, with a range from 1 to 28 visits. The NSAA total score was imputed as 0 in 337 patients across 1,080 assessments (27%), whilst the RFFV was imputed as 0 in 519 patients across 1849 assessments (46%) and the 10MWRV was imputed as 0 in 381 patients across 1199 assessments (30%). There was a trend of inability to perform the NSAA, RFFV and 10MWRV with time, with older patients much more likely to have no recorded score which was then imputed as 0, as can be seen in Fig. 2. This correlates with median time to loss of RFF, loss of 10MWR and loss of NSAA (which is a broad proxy for loss of ambulation), which is presented in Fig. 3. The median age of loss of NSAA in this cohort is 12.6 years (95% CI: 11.8, 14.7 years, see Fig. 3a). The median age of loss of RFF is 10.6 years (95% CI: 9.9, 11.9 years, see Fig. 3b). The median age at loss of 10MWR is 12.2 years (95% CI: 11.5, 13.9 years, see Fig. 3c).
Fig. 2
Imputation of score 0 by age for the three outcome measures.
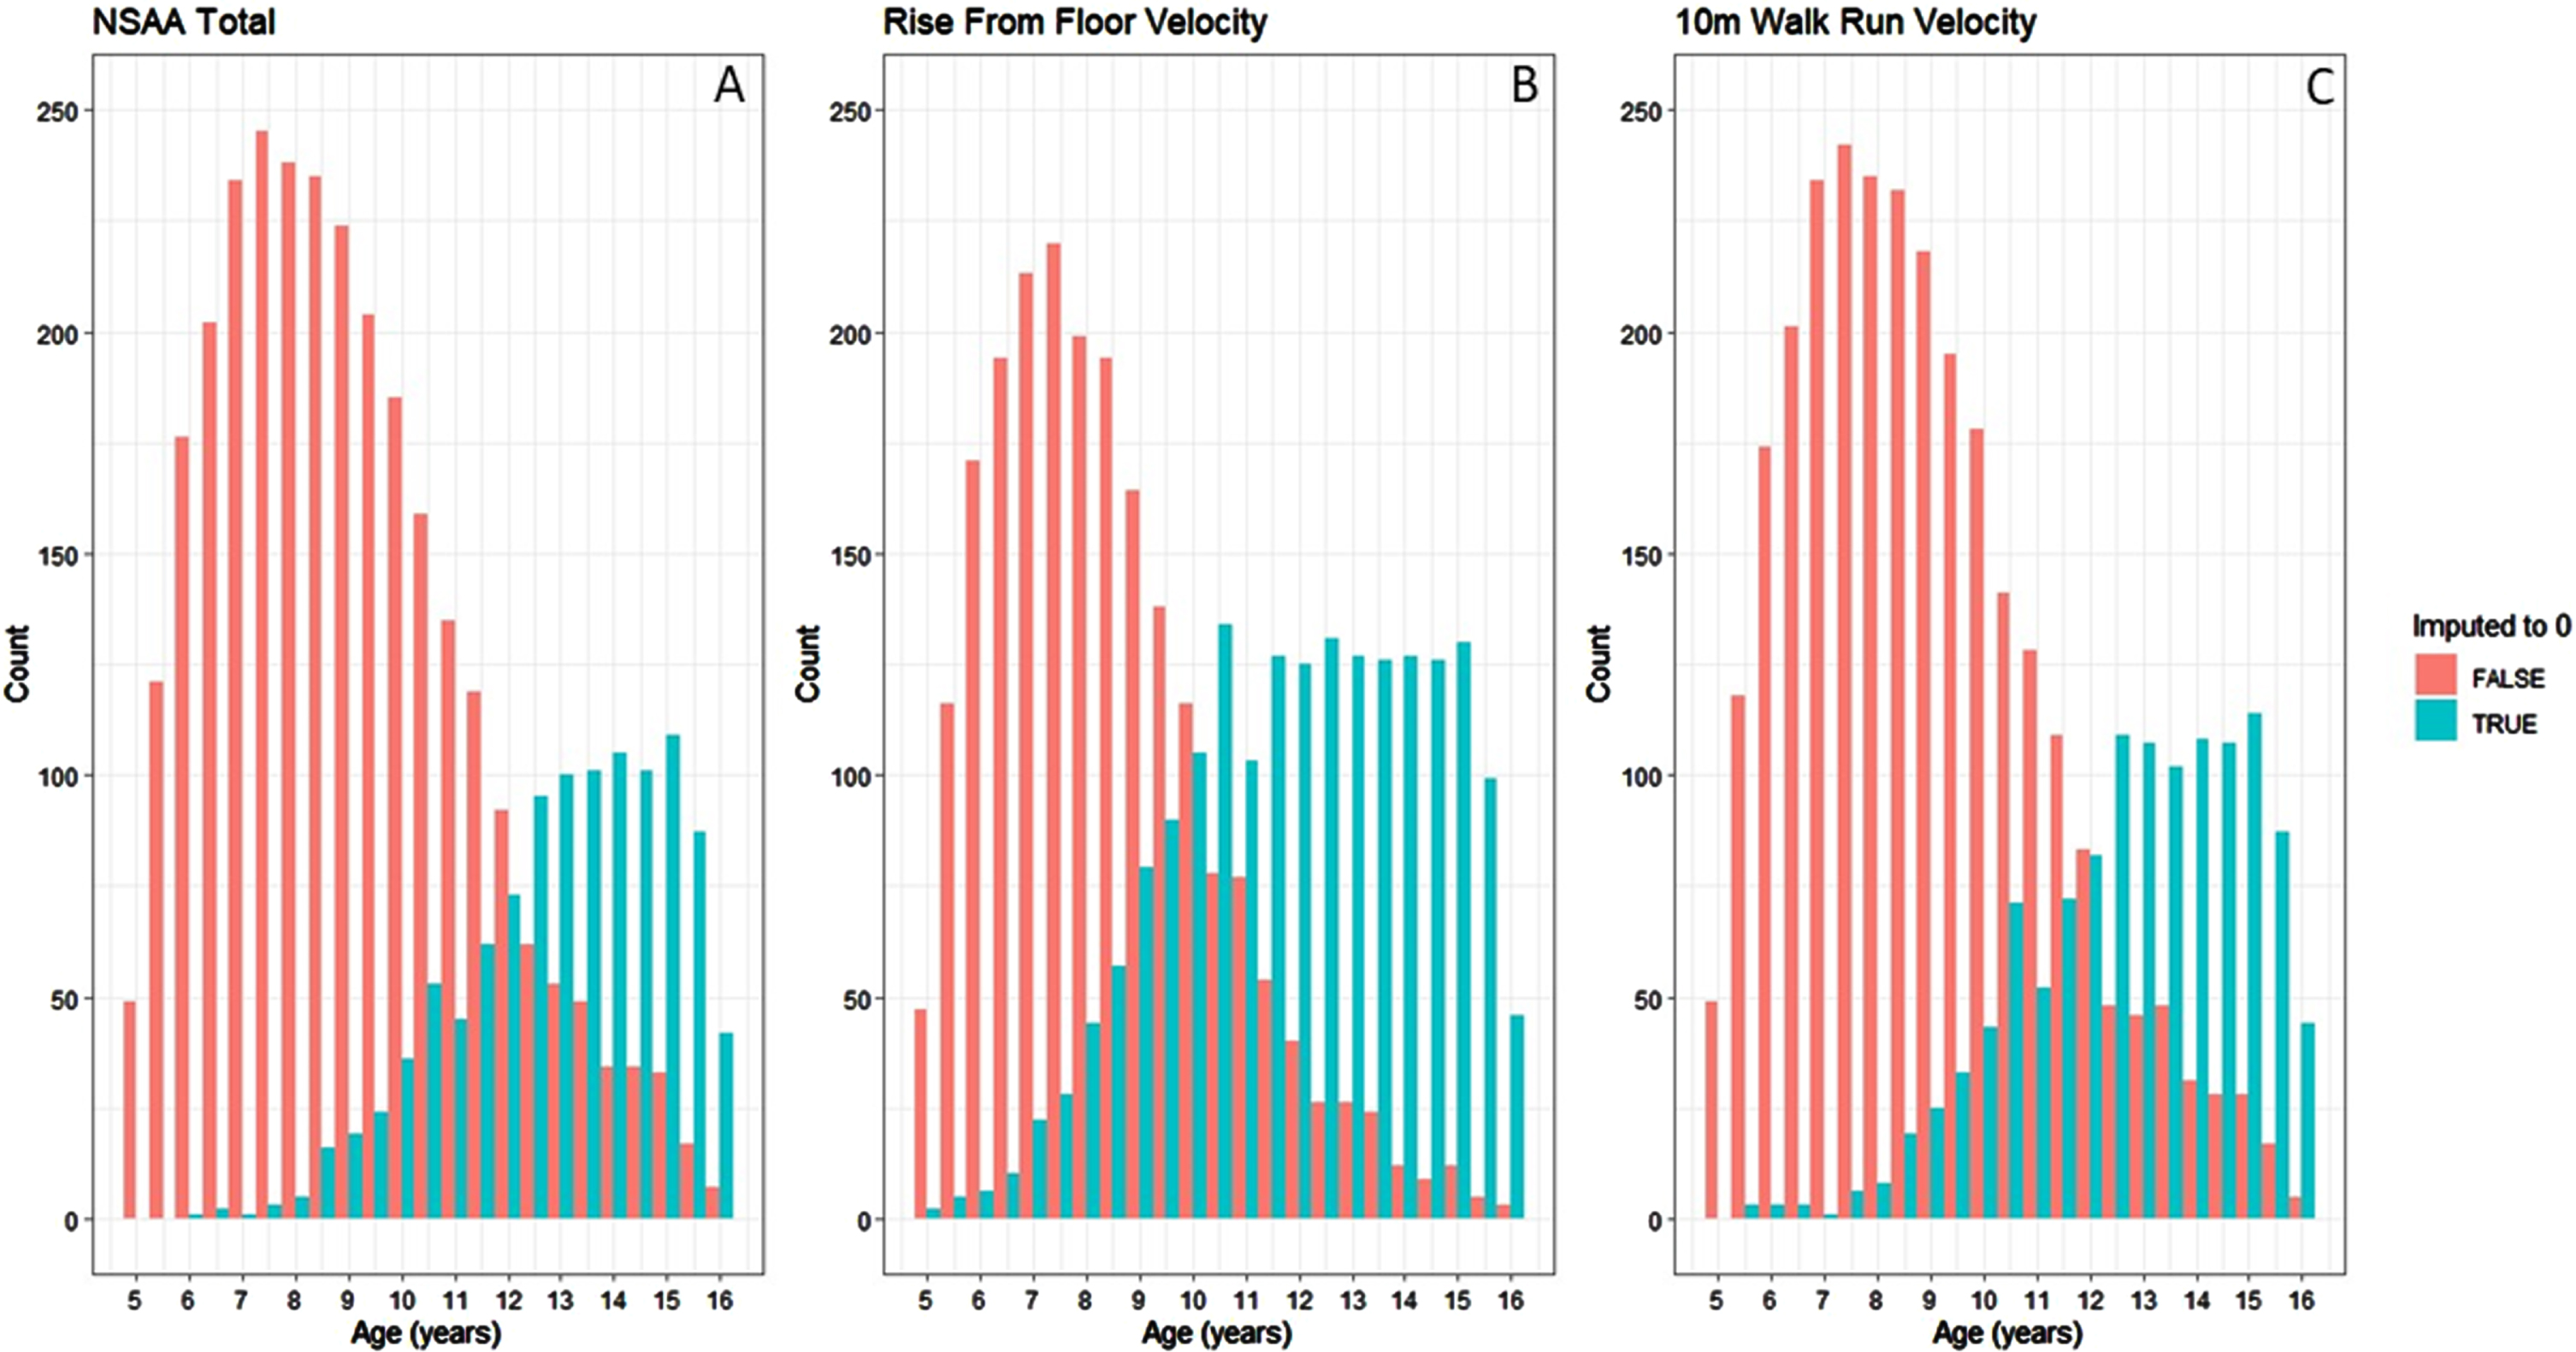
Fig. 3
Relative rates of score 0 on Rise from Floor Velocity, 10m Walk Run Velocity and NSAA.
The patient population at baseline is described by GC subgroups and genetic subgroups in Table 1. The majority (73%) of the patients were on prednisolone, with most of the remaining patients (25%) on deflazacort. Daily was the most common GC regime, with 53% of patients on this regime. In the groups where the GC type and regime were known, the GC start age ranged from 6.0–6.7 years. However, those on the regimes other than daily or intermittent (indicated as prednisolone other and deflazacort other) had an older average GC starting age (median age of 7.45 and 10.64 years respectively). This may be in part due to changes in data quality and standardisation of GC regimes since the publication of the DMD standards of care [6, 19, 20]. There was some variability in the NSAA total, RFF, and 10MWR for each of the GC groups, although this may be due to variability in the average age of the patients in each group. Genetic information was known and interpretable for 679 (82%) of patients. Most of the patients had mutations expected to affect expression of only the Dp427 isoform (40%) or of the Dp427 and Dp71 and isoforms and unknown Dp140 expression (31%).
Table 1
Descriptive statistics of the baseline data
| Group | N | Age [Med | GC Start Age | NSAA [Med | Rise From Floor | Rise From Floor | 10MWR [Med | 10MWRV [Med |
| (IQR)] | [Med (IQR)] | (IQR)] | Time [Med (IQR)] (s) | Time [Med (IQR)] (s-1) | (IQR)] (s) | (IQR)] (s-1) | ||
| All | 826 | 7.6 (6.1–9.7) | 6.7 (5.4–8.8) | 22 (13–28) | 4.8 (3.4–7) | 0.2 (0.05–0.27) | 6.2 (4.8–8.21) | 0.15 (0.1–0.2) |
| Prednisolone | 605 | 7.5 (6.1–9.5) | 6.7 (5.4–8.8) | 22 (14–28) | 4. 9 (3.4–7) | 0.18 (0.06–0.28) | 6.2 (4.9–8.5) | 0.15 (0.1–0.2) |
| Prednisolone Daily | 307 | 7.6 (6.1–9.6) | 6.7 (5.3–8.9) | 22 (15–28) | 4.7 (3.4–6.8) | 0.2 (0.08–0.29) | 6.2 (4.8–8.5) | 0.15 (0.1–0.2) |
| Prednisolone Intermittent | 192 | 7 (5.9–8.6) | 6.3 (5–7.9) | 22 (13–28) | 4.9 (3.5–7) | 0.18 (0.08–0.27) | 6 (4.7–7.9) | 0.15 (0.11–0.2) |
| Prednisolone Other | 104 | 8.6 (6.9–10.6) | 7.5 (6.1–9.3) | 19 (11–27) | 5.6 (3.7–8.4) | 0.15 (0–0.26) | 6.8 (5.2–10) | 0.13 (0.08–0.18) |
| Deflazacort | 204 | 7.7 (6.1–10.1) | 6.4 (5.1–8.8) | 21 (11–26) | 4.5 (3.3–6.4) | 0.18 (0–0.27) | 6.1 (4.7–7.9) | 0.15 (0.09–0.21) |
| Deflazacort Daily | 129 | 7.5 (5.9–9.9) | 6 (5–8.5) | 22 (13–27) | 4.4 (3.3–6.4) | 0.19 (0–0.29) | 6.1 (4.7–8) | 0.15 (0.1–0.21) |
| Deflazacort Intermittent | 56 | 7.3 (6–9.3) | 6.6 (5.8–7.9) | 22 (12–25) | 5 (3.5–7.1) | 0.17 (0.08–0.24) | 6 (4.7–7.8) | 0.16 (0.11–0.21) |
| Deflazacort Other | 18 | 12.3 (8.6–13.4) | 10.6 (8.6–11.8) | 4 (0–23) | 4.3 (2.9–4.6) | 0 (0–0.21) | 6.1 (3.9–7.6) | 0 (0–0.16) |
| Other | 17 | 8 (6.5–9.6) | 7 (6–8) | 22 (14–27) | 5.3 (4.3–7.3) | 0.17 (0–0.2) | 6.2 (4.8–7.4) | 0.15 (0.11–0.2) |
| Dp427–Dp140+ Dp71+ | 271 | 7.8 (6.3–10.3) | 6.9 (5.4–9) | 23 (14–28) | 4.8 (3.3–6.8) | 0.18 (0.02–0.27) | 5.9 (4.6–7.6) | 0.16 (0.1–0.21) |
| Dp427–Dp140 U Dp71+ | 166 | 7.3 (5.8–9.2) | 6.2 (5–7.8) | 21 (12–27) | 5 (3.5–7) | 0.18 (0–0.27) | 6.4 (5–8.9) | 0.14 (0.09–0.2) |
| Dp427–Dp140–Dp71+ | 212 | 7.1 (6.1–9) | 6.4 (5.3–8) | 21 (13–26) | 4.7 (3.5–6.6) | 0.17 (0.07–0.27) | 6.2 (4.9–8.1) | 0.15 (0.1–0.2) |
| Dp427–Dp140–Dp71– | 29 | 7.9 (7–10.6) | 7 (6–8.9) | 20 (11–24) | 5.2 (3.6–8.4) | 0.14 (0–0.24) | 7.1 (5.4–9.4) | 0.14 (0.08–0.17) |
The model selected for the NSAA centiles was a 0-1 inflated logit-normal GAMLSS, with a basis spline for the mean model, a linear model for the variability, and quadratic models for the proportion of scores as 0 and 34. An overview of the UK NSAA centiles between the ages of 5 and 16 is presented in Fig. 4.
Fig. 4
NSAA centiles for age.
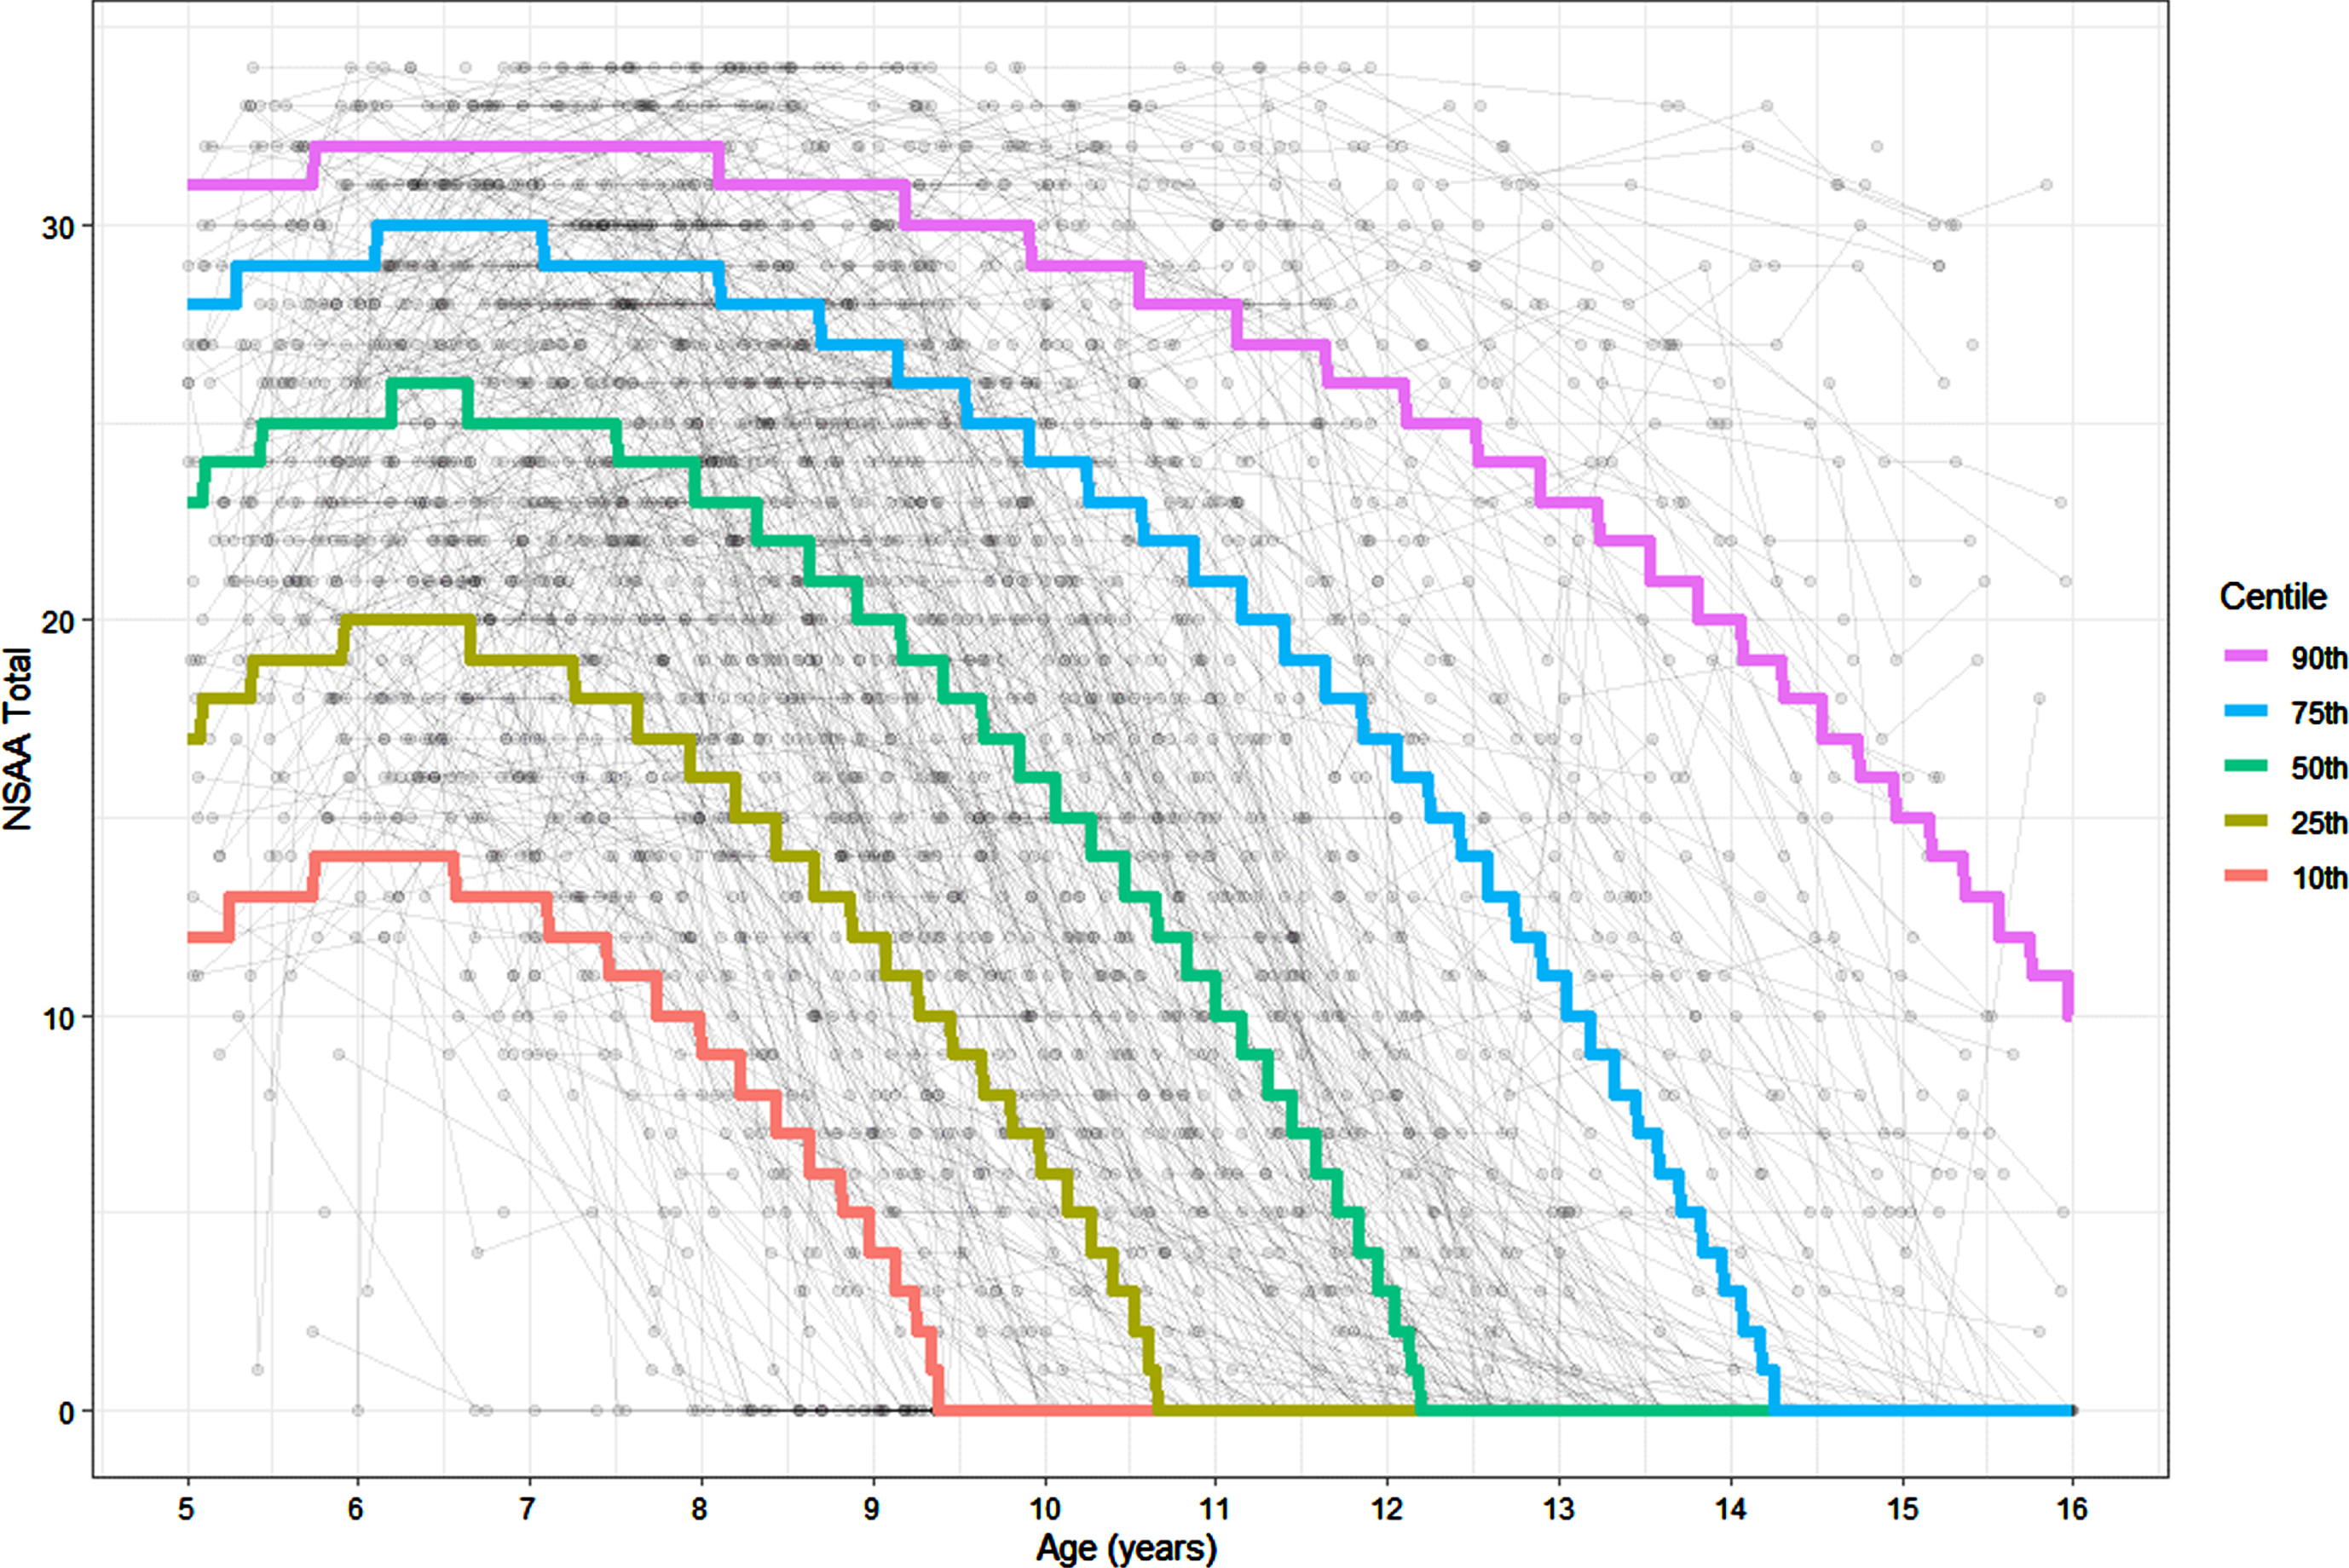
The 50th centile describes a patient who reaches a peak NSAA score of 26 between the ages of 6 years 3 months and 6 years 7 months, with loss of NSAA at 12 years 3 months. This is the typical trajectory of a boy with DMD in the UK. The 10th centile describes a patient who reaches a peak NSAA score of 14 between the ages of 5 years 9 months and 6 years 6 months, with an eventual loss of NSAA at 9 years 5 months. The 25th centile describes a patient who reaches a peak NSAA score of 20 between the ages of 5 years 11 months and 6 years 7 months, with loss of NSAA at 10 years 8 months. The 75th centile describes a patient who reaches a peak NSAA score of 30 between the ages of 6 years 2 months and 7 years, with loss of NSAA at 14 years 4 months. The 90th centile describes a patient who reaches a peak NSAA score of 32 between the ages of 5 years 9 months and 8 years 1 month, with loss of NSAA after the age of 16.
The rate of decline prior to non-completion of the NSAA is consistent across the centiles –in the 5th to 95th centiles, if the centile reached 0 before age 16, the median score 6 months before was 5 (range 3–6) and the median score 12 months before was 8 (range 7–9). Blank NSAA centile charts, with age marked by month, are provided as Figure S1 and SF2. Table ST1 provides values necessary for plotting the centiles, whilst Tables ST2 and ST3 provide the centiles and Z-scores respectively for given NSAA and age combinations.
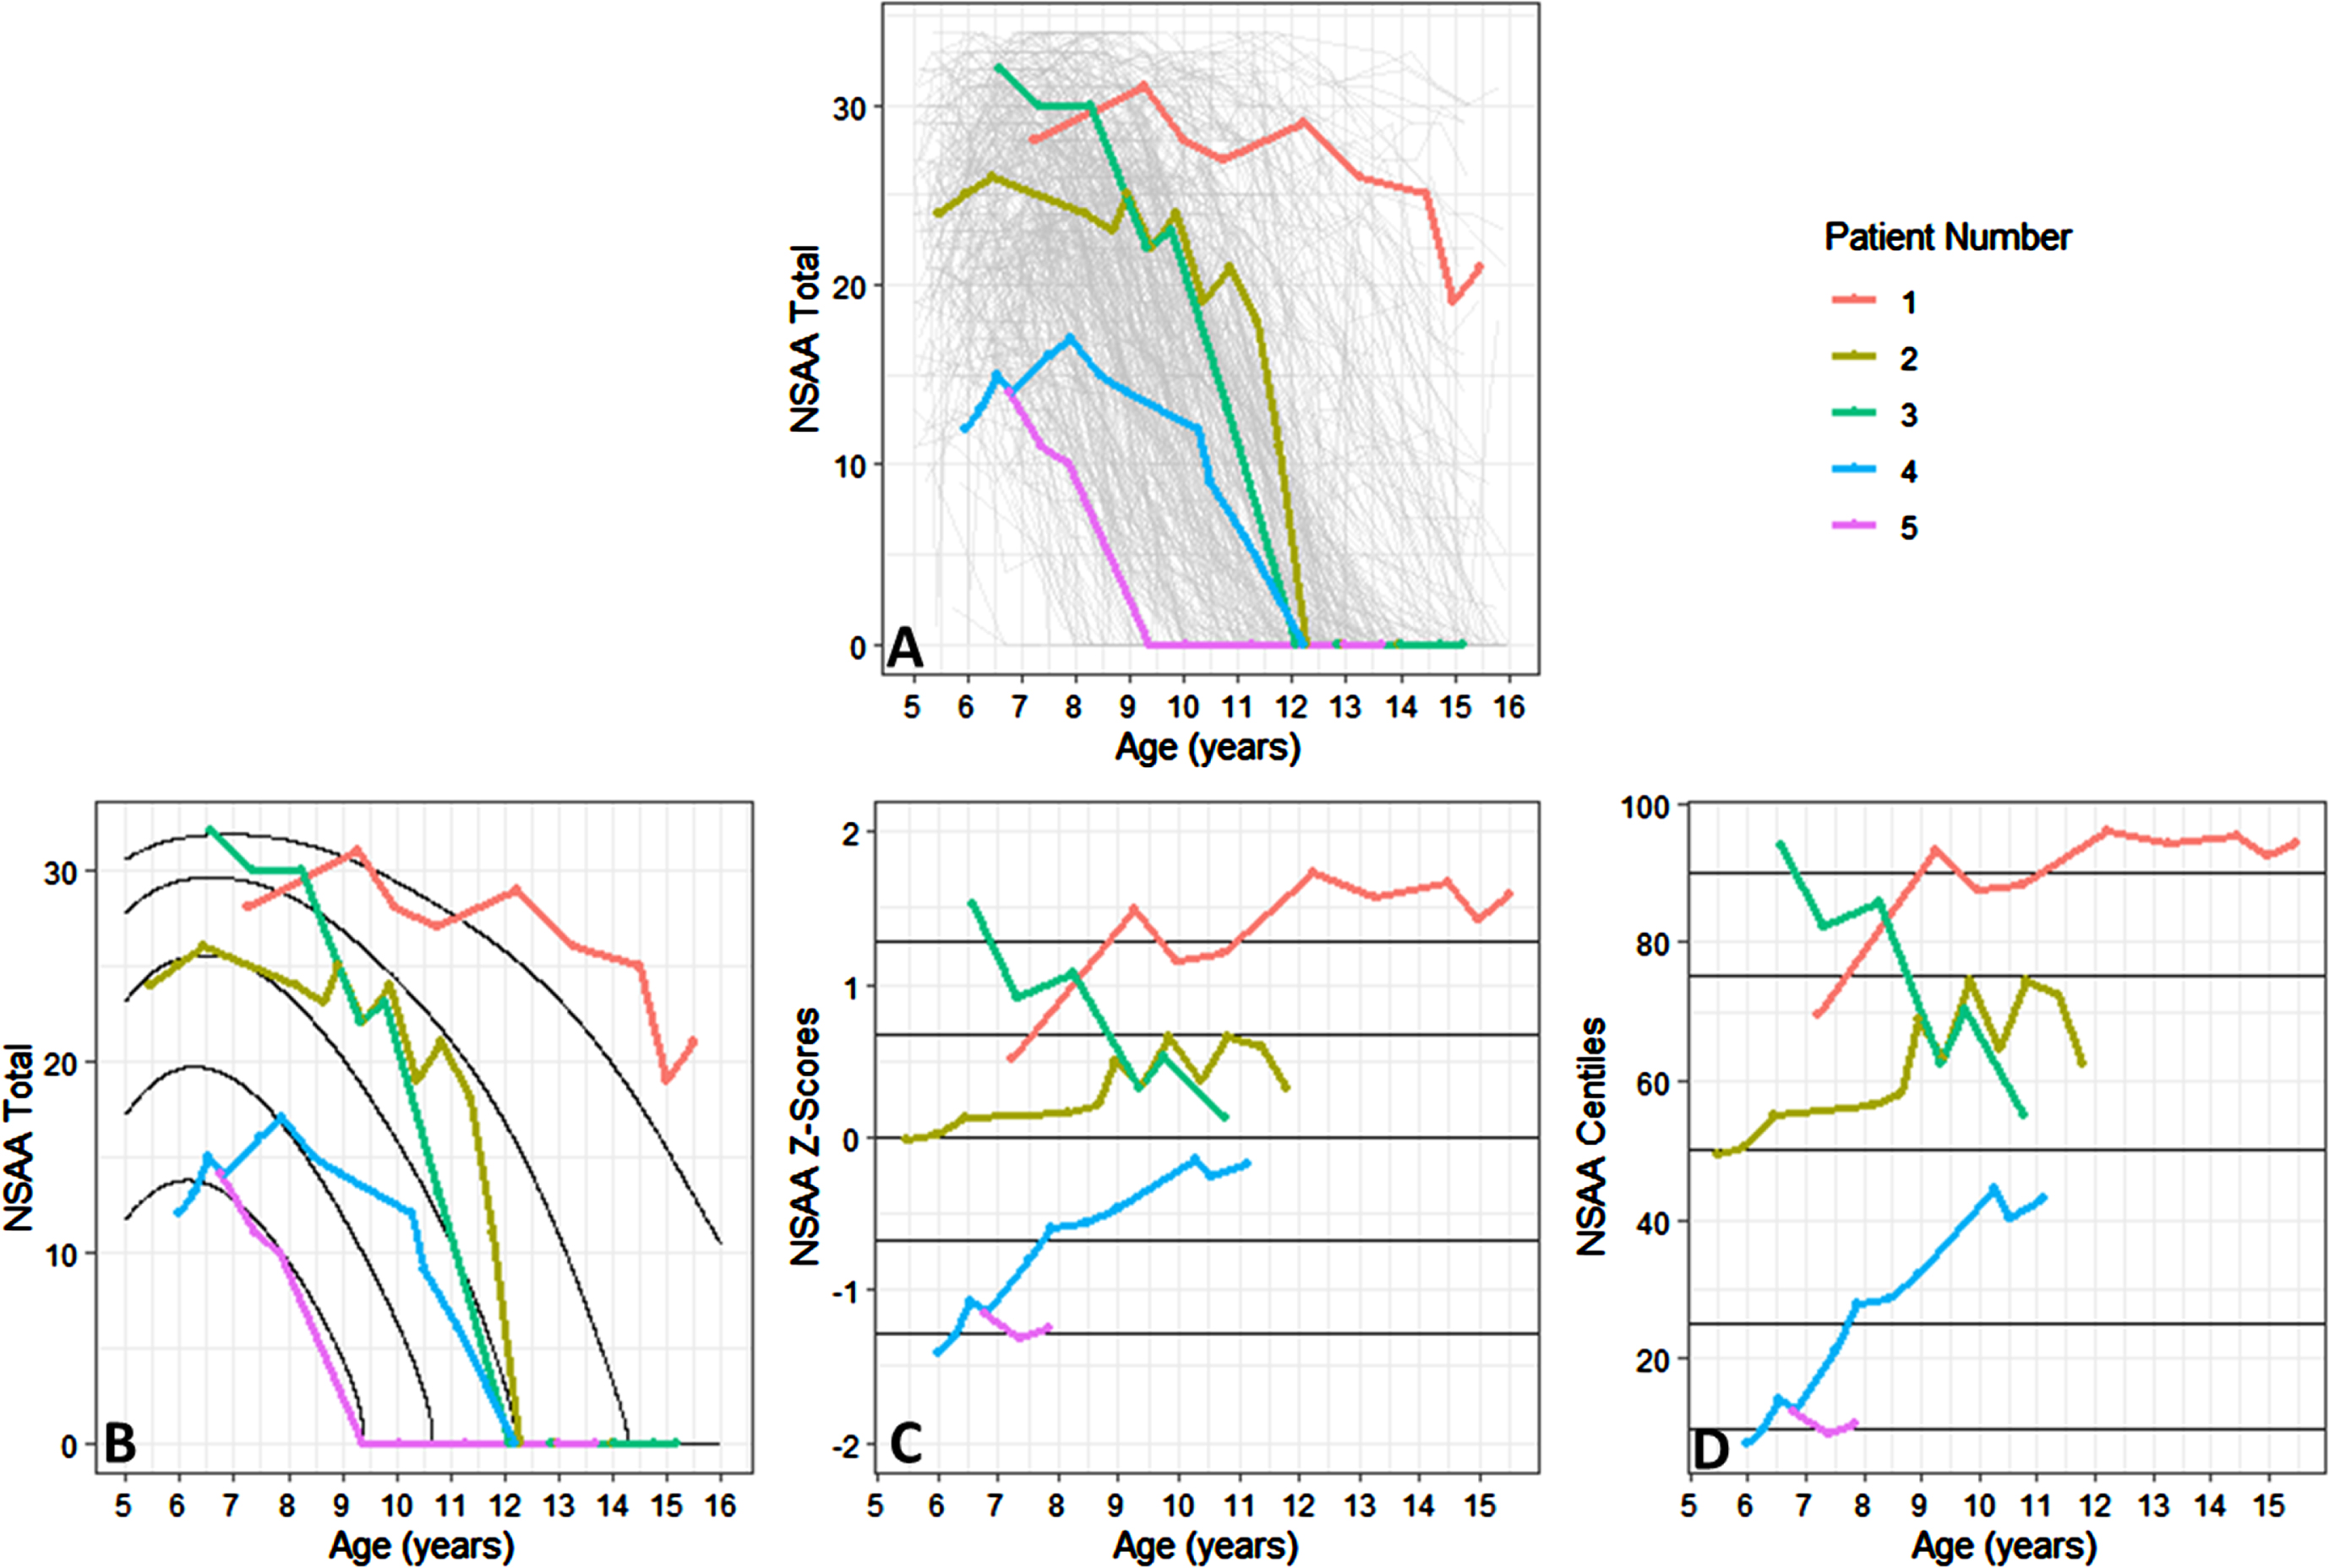
Figure 5a shows five patient trajectories of the NSAA with time, showing the universal trend of decline to loss of ambulation. However, without the centile lines it is difficult to characterise strong vs. weak DMD beyond patient 1 (strong) and patient 5 (weak). However, by overlaying the centile lines (as in Fig. 5b), we can observe that patient 3 is declining at a faster than average rate indicated by crossing of the centile lines, while despite patient 2 varying they are declining at a rate in line with the centile lines. Of note here, the centile which corresponds to a NAA total of 0 increases with age, as more of the patients score 0. Consequently, the assessments where participants scored a 0 are omitted. This is also apparent in Fig. 5c and 5d, which show that when the NSAA centile or Z-score is on the y-axis, the trajectory of patient 2 is slightly better than average, whilst patient 3 declines faster than average. Notably, when the trajectory of NSAA Z-score or NSAA centile is considered with age, the trajectories are linear. The centiles have therefore removed the increasing-stability-decline trend of the data.
Fig. 5
Understanding the NSAA using centiles.
The model selected for the RFFV centiles was a 0 inflated logit-Normal GAMLSS, with a cubic spline with one degree of freedom for the mean model, a quadratic model for the variance, and quadratic models for the proportion of score as 0. An overview of the UK RFFV centiles between the ages of 5 and 16 is presented in Fig. 6. The centiles demonstrate RFFV declines monotonically with age, and no peak.
Fig. 6
Rise from floor velocity centiles for age.
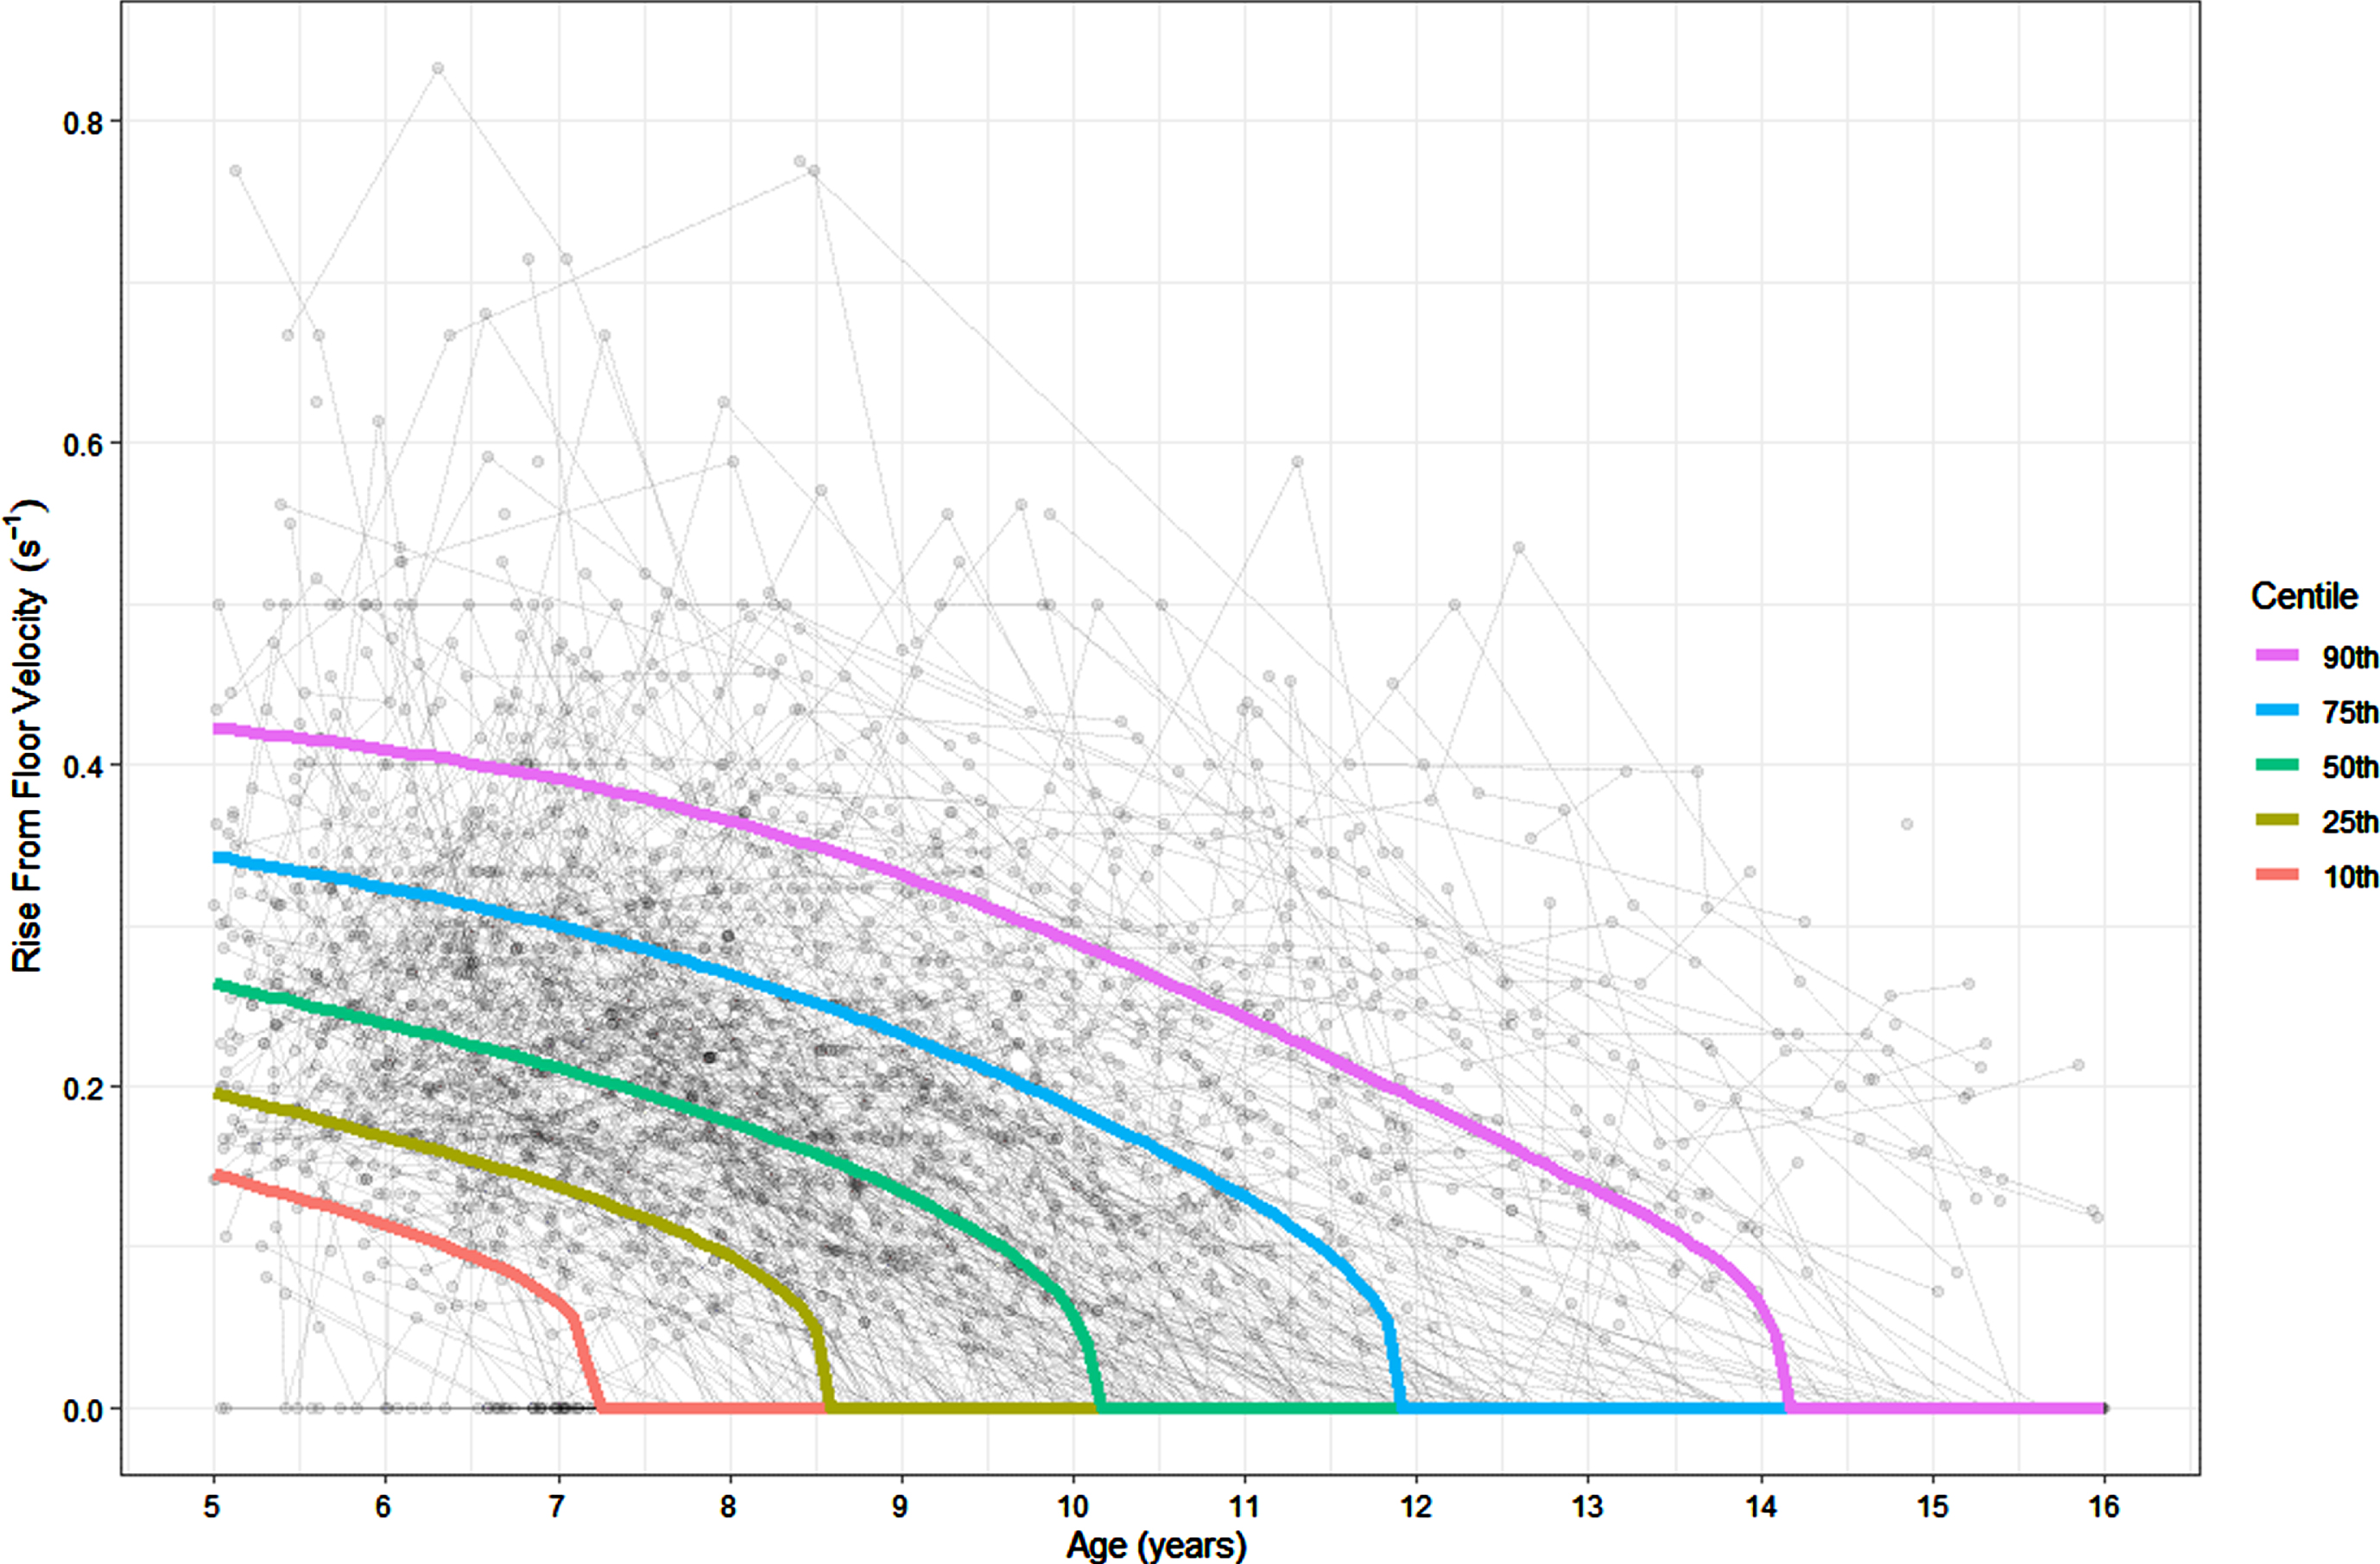
The 50th centile describes a patient who records a RFF time of 5.6 s (with corresponding RFFV of 0.2s–1) at age 8 years with loss of RFF at 10 years 2 months. This is the typical trajectory of a DMD boy in the UK on the RFF. The 10th centile describes a patient who experiences loss of RFF at 7 years 3 months. The 25th centile describes a patient who records a RFF time of 10.6 s (with corresponding RFFV of 0.1s–1) at age 8 years with loss of RFF at 8 years 6 months. The 75th centile describes a patient who records a RFF time of 3.7 s (with corresponding RFFV of 0.3s–1) at age 8 years with loss of RFF at 11 years 11 months. The 90th centile describes a patient who records a RFF time of 2.7 s (with corresponding RFFV of 0.4s–1) at age 8 years with loss of RFF at 14 years 2 months.
The rate of decline to loss of RFF is consistent across the RFF centiles –in the 5th to 95th centiles, if the centile reached RFFV of 0s–1 before age 16, the median RFF time 6 months before was 10.6 s (range 9.4s–12.2 s) and the median RFF time 12 months before was 8.0 s (range 7.3s–9.6 s). Blank RFFV and RFF Time centile charts, with age marked by month, are provided as Figures SF4 and SF5. Table ST4 provides values necessary for plotting the centiles, whilst Tables ST5 and ST6 provide the centiles and Z-scores respectively for given RFF and age combinations.
The model selected for the 10MWRV centiles was a 0 inflated logit-Normal GAMLSS, with a P-spline with one degree of freedom for the mean model, a linear model for the variance, and quadratic models for the proportion of score as 0. An overview of the UK 10MWRV centiles between the ages of 5 and 16 is presented in Fig. 7.
Fig. 7
10m Walk run velocity centiles for age.
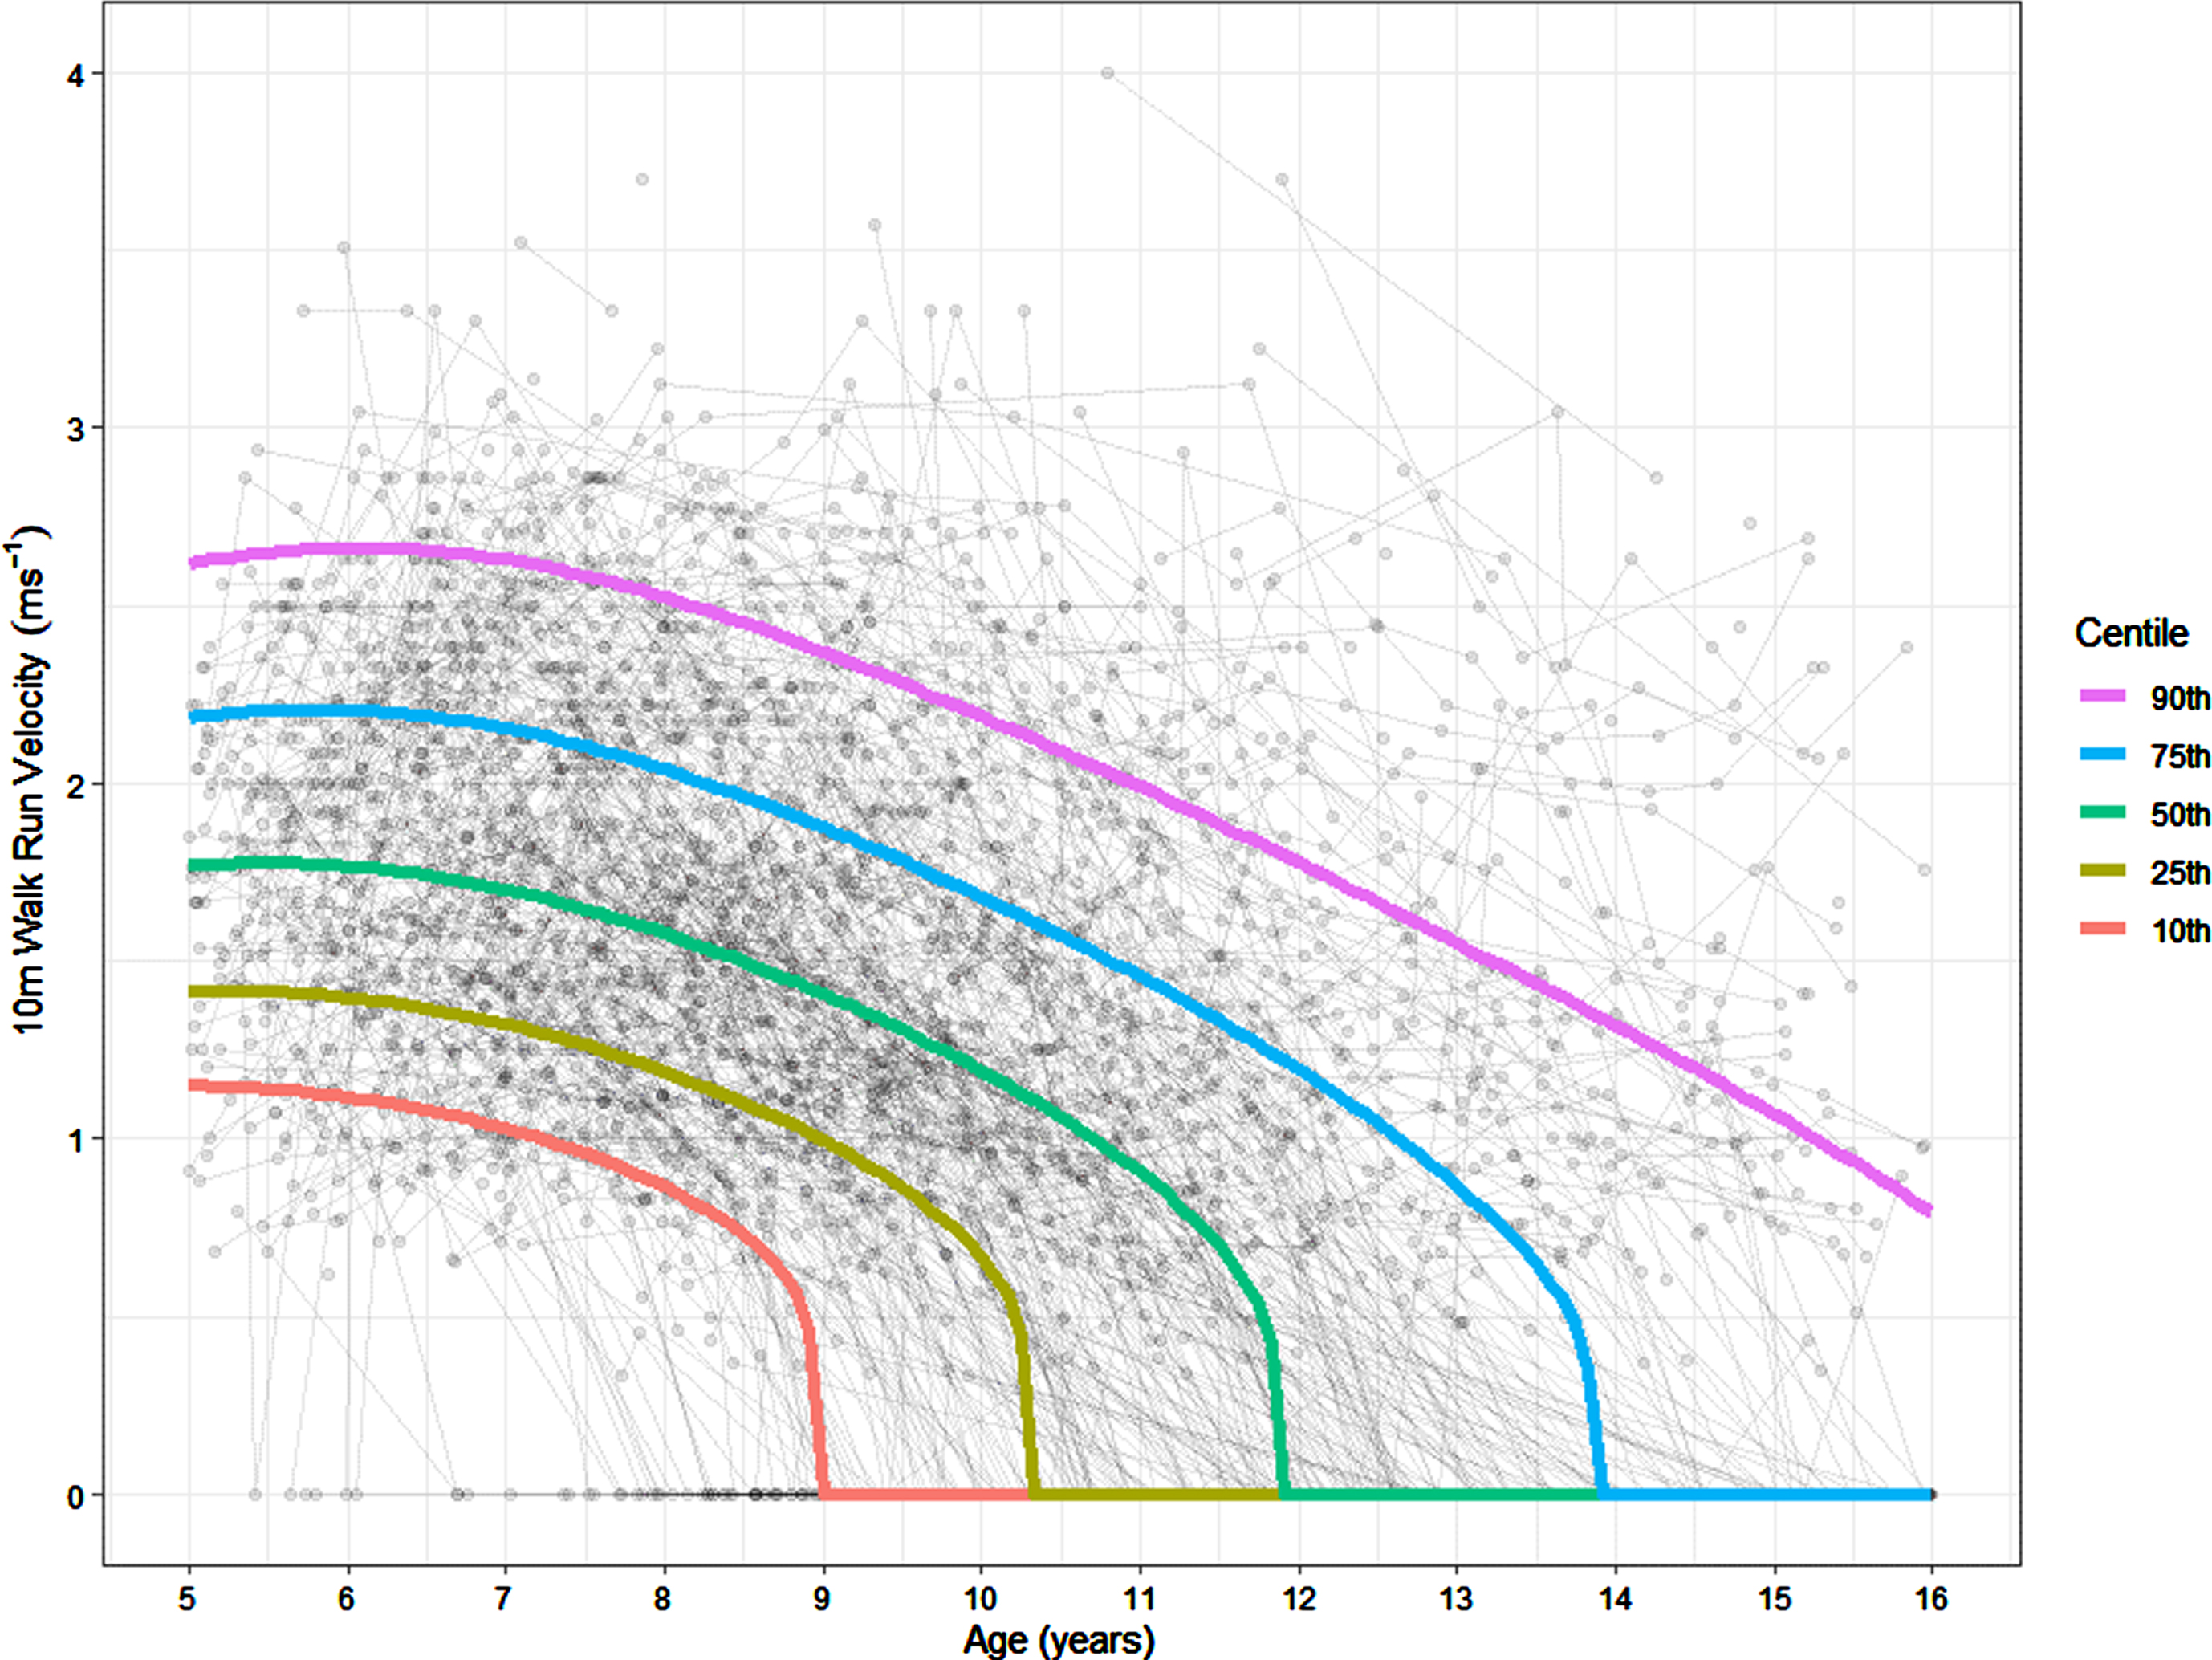
The 50th centile describes a patient who records a 10MWR time of 6.3 s (corresponding to a 10MWRV of 1.6ms–1), and experiences loss of 10MWR at 11 years 11 months. This is the typical trajectory of a boy with DMD for the 10MWR in the UK. The 10th centile describes a patient who records a 10MWR time of 11.5 s (corresponding to a 10MWRV of 0.9ms–1) at 8 years, and experiences loss of 10MWR at 9 years. The 25th centile describes a patient who records a peak 10MWR time of 8.4 s (corresponding to a 10MWRV of 1.2ms–1) and experiences loss of 10MWR at 10 years 4 months. The 75th centile describes a patient who records a peak 10MWR time of 4.9 s (corresponding to a 10MWRV of 2.0ms–1) and experiences loss of 10MWR at 13 years 11 months. The 90th centile describes a patient who records a peak 10MWR time of 4.0 s (corresponding to a 10MWRV of 2.5ms–1) and does not experience loss of 10MWR before 16 years.
The rate of decline to loss of 10MWR is consistent across the 10MWR centiles –in the 5th to 95th centiles, if the centile reached 10MWR of 0s–1 before age 16, the median 10MWR time 6 months before was 13.7 s (range 13.2s–15.6 s) and the median RFF time 12 months before was 11.0 s (range 10.6s–12.0 s). Blank 10MWR centile charts, with age marked by month, are provided as SF6 and SF7. Table ST7 provides values necessary for plotting the percentiles, whilst Tables ST8 and ST9 provide the centiles and Z-scores respectively for given 10MWR and age combinations.
In total there were 2,134 observations where boys did not record a 0 on either the NSAA total score, RFFV or the 10MWRV, which are referred to here as non-zero observations. There was a strong correlation between the RFFV centiles and the 10MWRV centiles across all observations (73%), although in the non-zero observations this correlation was only moderate (53%). The NSAA centiles were moderately correlated with the RFFV centiles across all observations (40%) and the non-zero observations (47%). The NSAA centiles were weakly correlated with the 10MWRV centiles across all observations (34%), and moderately correlated across the non-zero observations (41%).
DISCUSSION
To our knowledge, this paper presents for the first time the centiles of the NSAA, RFFV and 10MWRV, and represents the second approach to centiles in DMD after the centiles of the MFM [14] The data used in this analysis come from the NorthStar Database, one of the largest DMD databases, and includes all the Neuromuscular centres in the UK which regularly monitor patients with DMD.
The NSAA is an ordinal scale with total scores ranging from 0 to 34, and as such a one-point difference in score does not represent the same level of functional change across the scale. To tackle the ordinal nature of the NSAA, a linearised NSAA scale has been proposed, with totals ranging from 0–100 [24], and our method builds on this by enforcing linearity across age. Additionally, centiles are easily interpretable to non-expert audiences (such as patients and caregivers) and can be used to numerically quantify the cross-sectional variability of DMD. The meaningfulness of the NSAA to patients has been established through the MCID, which was considered as between 2.3 and 3.5 points [25].
The centiles proposed in this paper are not the first attempt at characterising variability in boys with DMD. One previous approach seeks to use latent class trajectory analysis to identify homogeneous groups of patients who are then grouped together [26]. The centiles presented here instead view the DMD population as on a spectrum, with some boys displaying less or more severe motor function phenotypes based on a combination of observed and unobserved factors.
The 25th, 50th and 75th NSAA centiles presented by our paper describe patients whose maximum NSAA total scores of 20, 26 and 30 are achieved on average at 6 years 3 months, 6 years 5 months and 6 years 7 months respectively. This is very similar to results related to peak NSAA score between the age of 6 and 7.5 years, where the median (IQR) of the total score are given at 27 [22–31]. The 2-point discrepancy between our 25th centile peak score of 20, and their reported score of 22 is likely due to the inclusion of younger patients in our cohort.
In previous literature, the age at which the peak NSAA score is achieved has been reported as between the age of 6 years 6 months and 8 [24, 27–31], and our results are concordant with this, although towards the lower end of the range. Decline was apparent in all centiles below the 90th after 8 years, suggesting that decline will nearly always be observed in the over 8 years population. Previously, a later peak NSAA score has been reported in stronger patient groups [26] and in this analysis we were able to quantify this later peak as about a 4-month delay in achievement of peak NSAA total score between the 25th and 75th centiles.
Additionally, the average annual change either side of a suggested peak NSAA score age has been reported. Previously, before the peak (at approximately age 7) an increase of between 0 and 2.2 points per year has been reported, whilst after the peak age, an annual decline of between 1.4 and 3.7 points per year have been reported [28–30, 32]. In the centiles presented here, we show that 1 year change is not linear before and after peak, with the 50th (25th, 75th) centiles showing a 1-year change of 2.2 (2.4, 1.6) points between 5 years and 6 years, –0.2 (–0.6, 0.1) points between 6 years and 7 years, –1.8 (–2.7, –0.9) points between 7 years and 8 years and –3.3 (–4.4, –1.8) points between 8 years and 9 years. Those treated with GC whilst ambulant have been shown to have an average loss of ambulation age between 11 and 13 years [33–35], and this is in line with our 50th centile where loss of ambulation is at 12 years 3 months.
The RFF centiles presented here describe a patient whose RFFV declines monotonically over time, with a 50th centile RFFV of 5.6 s (0.2s–1) at 8 years, 25th centile RFFV of 10.6 s (0.1s–1) at 8 years and for the 75th centile RFFV of 3.7 s (0.3s–1) at 8 years. Previously reported peak RFFV values were reported at an average of 6 years 10 months and suggest a median of 0.25s–1, and a 25th centile of 0.18s–1, faster than our recorded values of 022.s–1 and 0.14s–1 respectively. This may be because we record loss of RFF by 6 years 10 months in the lower 7% of patients, who would therefore have been excluded from previous analyses.
The 10MWR centiles presented here describe a patient whose 10MWRV displays a brief period of stability before decline, with a 50th centile 10MWRV of 6.3 s (1.6ms–1) at 8 years, 25th centile 10MWRVof 8.4 s (1.2s–1) at 8 years and 75th centile 10MWRV of 4.9 s (2.0s–1) at 8 years.
The two times tests, the 10 m walk/run (Item 17) and rise from floor (Item 11) have both been shown to be strongly negatively correlated with total NSAA score, with correlations of –0.51 and –0.71 respectively [36]. However, we show moderate positive correlations between the time test centiles and the NSAA centiles of 34–47%, suggesting that some boys are relatively stronger on the time tests compared to the NSAA and vice versa. Consequently, by adjusting the time test and NSAA scores for age, we can capture complementary aspects of disease progression. Therefore, by combining centiles of measures most relevant to the early/late ambulant stages (RFF, NSAA, 10MWR) with early non-ambulant and late non-ambulant disease markers [1], such as the Performance of Upper Limb (PUL) or forced vital capacity (FVC%), we could develop full disease severity centiles.
There are many known factors which can explain some of the heterogeneity in motor function in DMD. Groups amenable to certain exon skipping therapies have been demonstrated to be linked to differential motor function trajectories, such as exon 44 amenable patients having a milder motor function phenotype [37–39]. Additionally, differential expression of dystrophin isoforms, namely affected expression of the Dp71, has been linked to a lower maximum NSAA score than for those with affected expression of Dp427 only or Dp427 and Dp140 [40].
Variability in GC regime has also been shown in observational studies to have differential effects on 1-year NSAA change [28] and loss of ambulation [7, 41], and in the FOR-DMD study to have a differential effect on 3-year change in NSAA, 10MWR and RFF [42]. Whilst some differences have been reported between GC types and motor function, with deflazacort treated patients displaying significantly slower motor function declines in terms of the RFF and the linear NSAA when compared to prednisone treated patients [43], this difference was not found in the For-DMD trial [44].
Differential GC-related side-effects can also have significant impact on motor function. For example, different GC types and regimes have been shown to have differential impacts on growth and weight, which in turn impacts loss of ambulation risk [21]. Boys with DMD are typically on a reduced GC dose per kg as they get older, with patients on an average of 67% of the recommended dose across all ages [8]. However cumulative dose, as well as GC type and regime, have been linked to fracture rates, with deflazacort daily having the highest fracture rates [45] and 14% of DMD boys having reported long bone fractures less than 6 months before loss of ambulation. The impact of GC type, regime and dose on the NSAA centiles will need to be understood in future work.
One limitation of this study is that the data in the NorthStar Database has been collected from 2005 to 2022, and the DMD standards of care were published in 2018 [6, 19, 20]. Therefore, there is likely heterogeneity in the population due to the changing standards of care. The prevalence of GC treatment has risen over time, with the age of GC initiation falling, and increased prescription of Deflazacort [7]. To reduce the heterogeneity here the cohort was restricted to patients on GC. This serves a secondary purpose, as it means that the centiles are more likely to be appropriate for trial applications, as it is a criterion of most trials that patients are maintained on GC. However, how GC-naive patients perform on the centiles warrants further analysis.
Additionally, these centiles represent only the UK NorthStar population, which likely differ from other national cohorts due to differences in recommendations, GC treatments and genetic make-up. The demographics of our cohort have therefore been summarised. Further work will be needed to understand the relevance of the centiles to other national cohorts, as well as the differential impact on the centiles over time of recommendations, GC, and genetics.
Some attempts have been made here to adjust for informative drop-out, in that non-ambulant visits have an imputed NSAA total score of 0, visits where the walk item are recorded as 0 have a 10MWRV imputed as 0, and visits where the RFF item is recorded as 0, the RFFV is imputed as 0. However, one limitation of this study is that there is likely an informative visiting process, with various factors affecting how often boys attend clinics. This informative visiting process could lead to a positive skew in the upper age groups of the data, as it is likely only the strongest patients are being captured.
The NSAA, RFF and 10MWR centiles represent boys with DMD cross-sectionally, and further work will be needed in order for longitudinal inference to be made. By viewing NSAA trajectories in the context of centiles or Z-scores, it will be possible to contextualise typical vs. atypical rates of decline. This is particularly important in the late ambulatory stage of the disease, where any decline is a significant cause for concern for patients and parents. Further work will be needed, drawing on the literature on growth centiles, to develop limits by which decline can be labelled as concerning.
ABBREVIATIONS
• 10MWR –10 Meter Walk/Run Time
• 10MWRV –10 Meter Walk/Run Velocity
• DMD - Duchenne Muscular Dystrophy
• GAMLSS - Generalised Additive Models for Location, Scale and Shape
• GC - Glucocorticoids
• IQR –Inter Quartile Range
• MFM - Motor Function Measure
• NSAA - NorthStar Ambulatory Assessment
• RFF–Rise from Floor Time
• RFFV –Rise from Floor Velocity
ACKNOWLEDGMENTS
We are grateful to the DMD patients and their families, the North Star clinical network study, which is co-led by Francesco Muntoni () and Adnan Manzur (), Muscular Dystrophy UK (MDUK) for funding the North Star network and Certus Technology Associates Limited for hosting the database. Note that the lead authors for the North Star Group are Dr Francesco Muntoni, ; and Dr Adnan Manzur, . The North Star DMD Network is support by a Grant from Muscular Dystrophy UK to Dr Adnan Manzur and Prof Francesco Muntoni, at UCL. Dr. Baranello and Georgia Stimpson are supported by a Grant from the Great Ormond Street Hospital Children’s Charity and Muscular Dystrophy UK.
CONFLICT OF INTEREST
FM reports participation to Scientific Advisory boards and teaching initiatives for Novartis, Biogen, Roche; he is involved as an investigator in clinical trials from Novartis, Biogen, and Roche. Both institutions (UCL and GOSH) receive funding from Biogen and Roche for the SMAREACH SMA registry. GB is PI of clinical trials by Pfizer, NS Pharma, and Reveragen, and has received speaker and/or consulting fees from Sarepta, PTC Therapeutics, Biogen, Novartis Gene Therapies, Inc. (AveXis), and Roche and has worked as principal investigator of SMA studies sponsored by Novartis Gene Therapies, Inc., and Roche. GS, DR, AW, EM, EOR, AM, AS and TS have no conflict of interest to declare.
DATASETS/DATA AVAILABILITY STATEMENT
The data supporting the findings of this study are available on request from the corresponding author and on approval from the NorthStar Steering Committee. The data are not publicly available due to ethical restrictions.
RESEARCH ETHICS
The Northstar project is a natural history registered audit of the National Neuromuscular Database, where data from DMD boys has been collected since 2016, therefore, ethics approval was not required. We are now seeking ethics approval (IRAS Project ID: 242567) as it allows us to establish the network as a research project to collect. Approval has been given via the Caldicott guardian at GOSH and at the audit committee of each trust at the individual centres involved.
FUNDING
The Northstar project is funded by MDUK (Muscular Dystrophy UK) under a 5 year grant and the funding initially started from 01/11/2016 and is due to end on 30/06/2022. The current grant number is: Grant Reference 16NMDB-DB60-0004–5.
SUPPLEMENTARY MATERIAL
[1] The supplementary material is available in the electronic version of this article: https://dx.doi.org/10.3233/JND-230159.
REFERENCES
[1] | Iff J , Zhong Y , Gupta D , Paul X , Tuttle E , Henricson E , et al. Disease progression stages and burden in patients with duchenne muscular dystrophy using administrative claims supplemented by electronic medical records. Adv Ther (2022) 39: (6), 2906–19. |
[2] | Dhillon S . Viltolarsen: First approval. Drugs. (2020) 80: (10), 1027–31. |
[3] | Heo YA . Golodirsen: First approval. Drugs [Internet]. (2021) 80: (3):329–33. Available from: http://link.springer.com/10.1007/s40265-020-01267-2. |
[4] | Shirley M . Casimersen: First approval. Drugs. (2021) 81: (7), 875–9. |
[5] | Syed YY . Eteplirsen: First global approval. Drugs (2016) 76: (17), 1699–704. |
[6] | Birnkrant DJ , Bushby K , Bann CM , Apkon SD , Blackwell A , Brumbaugh D , et al. Diagnosis and management of Duchenne muscular dystrophy, part 1: Diagnosis, and neuromuscular, rehabilitation, endocrine, and gastrointestinal and nutritional management. Vol. 17, The Lancet Neurology. Lancet Publishing Group; 2018, pp. 251-67. |
[7] | Ricotti V , Ridout DA , Scott E , Quinlivan R , Robb SA , Manzur AY , et al. Long-term benefits and adverse effects of intermittent versus daily glucocorticoids in boys with Duchenne muscular dystrophy. J Neurol Neurosurg Psychiatry (2013) 84: (6), 698–705. |
[8] | Cowen L , Mancini M , Martin A , Lucas A , Donovan JM . Variability and trends in corticosteroid use by male United States participants with Duchenne muscular dystrophy in the Duchenne Registry. BMC Neurol. (2019) 19: (1), 1–10. |
[9] | Mah JK , Clemens PR , Guglieri M , Smith EC , Finkel RS , Tulinius M , et al. Efficacy and safety of vamorolone in duchenne muscular dystrophy. JAMA Netw Open. (2022) 5: (1), e2144178. |
[10] | Scott E , Eagle M , Mayhew A , Freeman J , Main M , Sheehan J , et al. Development of a functional assessment scale for ambulatory boys with duchenne muscular dystrophy. Physiotherapy Research International. (2012) 17: (2), 101–9. |
[11] | Mayhew A , Cano S , Scott E , Eagle M , Bushby K , Muntoni F , et al. Moving towards meaningful measurement: Rasch analysis of the North Star Ambulatory Assessment in Duchenne muscular dystrophy. Dev Med Child Neurol (2011) 53: (6), 535–42. |
[12] | De Sanctis R , Pane M , Sivo S , Ricotti V , Baranello G , Frosini S , et al. Suitability of north star ambulatory assessment in young boys with Duchenne muscular dystrophy. Neuromuscular Disorders [Internet]. (2015) ;25: (1):14–8. Available from: http://dx.doi.org/10.1016/j.nmd.2014.09.015. |
[13] | Mazzone ES , Messina S , Vasco G , Main M , Eagle M , D’Amico A , et al. Reliability of the north star ambulatory assessment in a multicentric setting. Neuromuscular Disorders [Internet] (2009) ;19: (7):458–61. Available from: http://dx.doi.org/10.1016/j.nmd.2009.06.368. |
[14] | Hafner P , Schmidt S , Schädelin S , Rippert P , Hamroun D , Fabien S , et al. Implementation of Motor Function Measure score percentile curves - Predicting motor function loss in Duchenne muscular dystrophy. European Journal of Paediatric Neurology (2022) 36: , 78–83. |
[15] | Hanna SE , Bartlett DJ , Rivard LM , Russell DJ . Reference curves for the gross motor function measure: Percentiles for clinical description and tracking over time among children with cerebral palsy. Phys Ther (2008) 88: (5), 596–607. |
[16] | Duran I , Stark C , Martakis K , Hamacher S , Semler O , Schoenau E . Reference centiles for the gross motor function measure and identification of therapeutic effects in children with cerebral palsy. J Eval Clin Pract. (2019) 25: (1), 78–87. |
[17] | Martakis K , Stark C , Rehberg M , Semler O , Duran I , Schoenau E . One-minute walk test in children with cerebral palsy GMFCS level 1 and 2: Reference values to identify therapeutic effects after rehabilitation. Dev Neurorehabil [Internet]. (2020) ;23: (4):201–9. Available from: https://doi.org/10.1080/17518423.2019.1625981. |
[18] | De MA , Leon S , Leite D , Roza D , Gabriela | , De Queiroz B , et al. Generation of percentile curves for strength and functional abilities for boys with Duchenne muscular dystrophy. Muscle Nerve [Internet]. 2023 [cited 2023 Jul 10]. Available from:https://onlinelibrary.wiley.com/doi/full/10.1002/mus.27921. |
[19] | Birnkrant DJ , Bushby K , Bann CM , Alman BA , Apkon SD , Blackwell A , et al. Diagnosis and management of Duchenne muscular dystrophy, part 2: Respiratory, cardiac, bone health, and orthopaedic management. Lancet Neurol [Internet]. (2018) 17: (4):347–61. Available from: https://linkinghub.elsevier.com/retrieve/pii/S1474442218300255. |
[20] | Birnkrant DJ , Bushby K , Bann CM , Apkon SD , Blackwell A , Colvin MK , et al. Diagnosis and management of Duchenne muscular dystrophy, part 3: Primary care, emergency management, psychosocial care, and transitions of care across the lifespan. Lancet Neurol [Internet]. (2018) 17: (5):445–55. Available from: https://linkinghub.elsevier.com/retrieve/pii/S1474442218300267. |
[21] | Stimpson G , Raquq S , Chesshyre M , Fewtrell M , Ridout D , Sarkozy A , et al. Growth pattern trajectories in boys with Duchenne muscular dystrophy. Orphanet J Rare Dis (2022) 17: (20), 1–11. |
[22] | Lidov HGW , Selig S , Kunkel LM . Dp140: A novel 140 kDa CNS transcript from the dystrophin locus. Hum Mol Genet (1995) 4: (3), 329–35. |
[23] | Rigby RA , Stasinopoulos DM . Generalized additive models for location, scale and shape (with discussion). J R Stat Soc Ser C Appl Stat (2005) 54: (3), 507–54. |
[24] | Ricotti V , Ridout DA , Pane M , Main M , Mayhew A , Mercuri E , et al. The northStar ambulatory assessment in duchenne muscular dystrophy: Considerations for the design of clinical trials. J Neurol Neurosurg Psychiatry (2016) 87: (2), 149–55. |
[25] | Ayyar Gupta V , Pitchforth JM , Domingos J , Ridout D , Iodice M , Rye C , et al. Determining minimal clinically important differences in the North Star Ambulatory Assessment (NSAA) for patients with Duchenne muscular dystrophy. PLoS One [Internet].2023[cited 2023 Jul 10]; (2023) 18: (4):e0283669. Available from: http://dx.doi.org/10.1016/j.nmd.2014.09.015. |
[26] | Muntoni F , Domingos J , Manzur AY , Mayhew A , Guglieri M , Sajeev G , et al. Categorising trajectories and individual item changes of the North Star Ambulatory Assessment in patients with Duchenne muscular dystrophy. PLoS One [Internet]. (2019) 14: (9):1–21. Available from: http://dx.doi.org/10.1371/journal.pone.0221097. |
[27] | Zambon AA , Ayyar Gupta V , Ridout D , Manzur AY , Baranello G , Trucco F , et al. Peak functional ability and age at loss of ambulation in Duchenne muscular dystrophy. Dev Med Child Neurol (2022) 64: (8), 979–88. |
[28] | Mazzone E , Vasco G , Sormani MP , Torrente Y , Berardinelli A , Messina S , et al. Functional changes in Duchenne muscular dystrophy: A 12-month longitudinal cohort study. Neurology (2011) 77: (3), 250–6. |
[29] | Mazzone ES , Pane M , Sormani MP , Scalise R , Berardinelli A , Messina S , et al. 24 month longitudinal data in ambulant boys with duchenne muscular dystrophy. PLoS One (2013) 8: (1), 4–9. |
[30] | Pane M , Mazzone ES , Sivo S , Sormani MP , Messina S , D’Amico A , et al. Long term natural history data in ambulant boys with duchenne muscular dystrophy: 36-month changes. PLoS One (2014) 9: (10), 6–11. |
[31] | Coratti G , Pane M , Brogna C , Ricotti V , Messina S , D’Amico A , et al. North star ambulatory assessment changes in ambulant duchenne boys amenable to skip exons 44, 45, 51, and A 3 year follow up . PLoS One [Internet]. (2021) 16: (6 June):1–13. Available from: http://dx.doi.org/10.1371/journal.pone.0253882. |
[32] | Ricotti V , Mandy WPL , Scoto M , Pane M , Deconinck N , Messina S , et al. Neurodevelopmental, emotional, and behavioural problems in Duchenne muscular dystrophy in relation to underlying dystrophin gene mutations. Dev Med Child Neurol [Internet]. (2016) 58: (1)77–84. Available from: http://www.dmd.nl. |
[33] | McDonald CM , Henricson EK , Abresch RT , Duong T , Joyce NC , Hu F , et al. Long-term effects of glucocorticoids on function, quality of life, and survival in patients with Duchenne muscular dystrophy: A prospective cohort study. The Lancet. 3919) (1011) 451–61. |
[34] | Bello L , Gordish-Dressman H , Morgenroth LP , Henricson EK , Duong T , Hoffman EP , et al. Prednisone/prednisolone and deflazacort regimens in the CINRG Duchenne Natural History Study. Neurology (2015) 85: (12), 1048–55. |
[35] | Zhang T , Kong X . Recent advances of glucocorticoids in the treatment of Duchenne muscular dystrophy (Review). Exp Ther Med (2021) 21: (5), 1–7. |
[36] | Mazzone E , Martinelli D , Berardinelli A , Messina S , D’Amico A , Vasco G , et al. North star ambulatory assessment, 6-minute walk test and timed items in ambulant boys with Duchenne muscular dystrophy. Neuromuscular Disorders [Internet]. (2010) 20: (11):712–6. Available from: http://dx.doi.org/10.1016/j.nmd.2010.06.014. |
[37] | Zhang S , Qin D , Wu L , Li M , Song L , Wei C , et al. Genotype characterization and delayed loss of ambulation by glucocorticoids in a large cohort of patients with Duchenne muscular dystrophy. Orphanet J Rare Dis. (2021) 16: (1), 1–8. |
[38] | Bello L , Morgenroth LP , Gordish-Dressman H , Hoffman EP , McDonald CM , Cirak S . DMD genotypes and loss of ambulation in the CINRG Duchenne Natural History Study. Neurology (2016) 87: (4), 401–9. |
[39] | Wang RT , Barthelemy F , Martin AS , Douine ED , Eskin A , Lucas A , et al. DMD genotype correlations from the Duchenne Registry: Endogenous exon skipping is a factor in prolonged ambulation for individuals with a defined mutation subtype. Hum Mutat. (2018) 39: (9), 1193–202. |
[40] | Coratti G , Lenkowicz J , Norcia G , Lucibello S , Ferraroli E , d’Amico A , et al. Age, corticosteroid treatment and site of mutations affect motor functional changes in young boys with Duchenne Muscular Dystrophy. PLoS One. (2022) 17: (7 July). |
[41] | Crabtree NJ , Adams JE , Padidela R , Shaw NJ , Högler W , Roper H , et al. Growth, bone health & ambulatory status of boys with DMD treated with daily vs. intermittent oral glucocorticoid regimen. Bone (2018) 116: , 181–6. |
[42] | Guglieri M , Bushby K , McDermott MP , Hart KA , Tawil R , Martens WB , et al. Effect of different corticosteroid dosing regimens on clinical outcomes in boys with duchenne muscular dystrophy. JAMA [Internet]. (1456) 327: (15)1456. Available from: https://jamanetwork.com/journals/jama/fullarticle/2790925. |
[43] | McDonald CM , Sajeev G , Yao Z , McDonnell E , Elfring G , Souza M , et al. Deflazacort vs prednisone treatment for Duchenne muscular dystrophy: A meta-analysis of disease progression rates in recent multicenter clinical trials. Muscle Nerve (2020) 61: (1), 26–35. |
[44] | Guglieri M , Bushby K , McDermott MP , Hart KA , Tawil R , Martens WB , et al. Effect of different corticosteroid dosing regimens on clinical outcomes in boys with duchenne muscular dystrophy. JAMA [Internet]. 2022;1-13. Available from:https://jamanetwork.com/journals/jama/fullarticle/2790925. |
[45] | Joseph S , Wang C , Di Marco M , Horrocks I , Abu-Arafeh I , Baxter A , et al. Fractures and bone health monitoring in boys with Duchenne muscular dystrophy managed within the Scottish Muscle Network. Neuromuscular Disorders [Internet]. (2019) 29: (1):59–66. Available from: https://doi.org/10.1016/j.nmd.2018.09.005. |


