
Resistance Exercise Training Rescues Mitochondrial Dysfunction in Skeletal Muscle of Patients with Myotonic Dystrophy Type 1
Abstract
Background:
Myotonic dystrophy type 1 (DM1) is a dominant autosomal neuromuscular disorder caused by the inheritance of a CTG triplet repeat expansion in the Dystrophia Myotonica Protein Kinase (DMPK) gene. At present, no cure currently exists for DM1 disease.
Objective:
This study investigates the effects of 12-week resistance exercise training on mitochondrial oxidative phosphorylation in skeletal muscle in a cohort of DM1 patients (n = 11, men) in comparison to control muscle with normal oxidative phosphorylation.
Methods:
Immunofluorescence was used to assess protein levels of key respiratory chain subunits of complex I (CI) and complex IV (CIV), and markers of mitochondrial mass and cell membrane in individual myofibres sampled from muscle biopsies. Using control’s skeletal muscle fibers population, we classified each patient’s fibers as having normal, low or high levels of CI and CIV and compared the proportions of fibers before and after exercise training. The significance of changes observed between pre- and post-exercise within patients was estimated using a permutation test.
Results:
At baseline, DM1 patients present with significantly decreased mitochondrial mass, and isolated or combined CI and CIV deficiency. After resistance exercise training, in most patients a significant increase in mitochondrial mass was observed, and all patients showed a significant increase in CI and/or CIV protein levels. Moreover, improvements in mitochondrial mass were correlated with the one-repetition maximum strength evaluation.
Conclusions:
Remarkably, 12-week resistance exercise training is sufficient to partially rescue mitochondrial dysfunction in DM1 patients, suggesting that the response to exercise is in part be due to changes in mitochondria.
INTRODUCTION
Myotonic dystrophy type 1 (DM1) is a dominant autosomal disorder that affects 1 in 20,000 worldwide [1]. Population incidences vary in different parts of the world, reaching a higher frequency of 1 in 475 in the Québec region of Saguenay—Lac-Saint-Jean (Canada) [2]. DM1 etiology is explained by the toxic gain of function of the Dystrophia Myotonica Protein Kinase (DMPK), which originates from a CTG triplet repeat expansion in the 3’ untranslated region of the DMPK gene [3, 4]. The CTG triplet repeat microsatellite region contains between 5 and 37 repeats in non-DM1 individuals [5, 6]. In DM1 patients however, the expansion may range from 50 to thousands of repeats but may further expand in post-mitotic cells, such as skeletal muscle (SKM), presenting as somatic mosaicism [7, 8]. Depending on the number of inherited CTG triplet repeats, the age of onset can vary (congenital, childhood, juvenile, adult, or late) [9]. Although presenting as a systemic disease, the most prominent symptoms affect the SKM apparatus with muscle weakness, muscle wasting and myotonia [10].
The DMPK gain of function triggers RNA toxicity, characterized by nuclear sequestration of transcription and splicing factors that eventually dysregulate the downstream alternative splicing machinery [11]. Traditionally, research has focused on understanding RNA toxicity and reversing the mechanisms of the aberrant splicing program. However, a myriad of proteins and mechanisms are affected in DM1 pathology, including nuclear and cytosolic alterations, but also organelle-specific perturbations, such as mitochondria [12]. DMPK has been found to specifically bind to the outer mitochondrial membrane [13], and its overexpression in myoblasts induces fragmentation and perinuclear clustering of mitochondria, resulting in the increase of both autophagy and apoptosis [14]. Moreover, DMPK interacts with tyrosine kinase Src and Hexokinase-II in the formation of a multimeric complex on the outer mitochondrial membrane, which orchestrates a fine-tuned regulation of intracellular oxidative stress and pro-survival processes via glucose starvation stimuli [15–17]. Strikingly, there is evidence that SKM from DM1 patients presents with different mitochondrial morphology, dynamics and function affecting the structure of the sarcoplasmic reticulum with subsequent mitochondrial aggregation [18], metabolic impairment [19] and neuromuscular junction alterations [20, 21]. Recent in vivo studies demonstrated that DM1 patients present with oxidative metabolism impairment in both SKM and brain [22]. Like mitochondrial myopathy patients, DM1 patients present with elevated FGF21 serum level, which is thought to be correlated to insulin resistance and mitochondrial dysfunction [23, 24]. Furthermore, it was recently demonstrated that metformin treatment could reverse the impaired metabolism and mitochondrial dysfunction in DM1-derived fibroblasts [25, 26].
Although DM1 is one of the most common adult-onset neuromuscular disorders, there is no curative therapies currently available. Many different approaches, including the genomic correction of the DMPK gene, the generation of antisense oligonucleotides for the alternative splicing correction and the use of small molecules for the modulation of signaling pathways, have been extensively explored to treat DM1 pathology with several clinical trials now underway [27, 28]. At present, the only option for DM1 patients is symptomatic therapy. To this end, in the last few decades, exercise therapy has been investigated as a beneficial and effective approach to treat neuromuscular disorders patients [29, 30], as well as in conjunction with cognitive behavioral therapy in DM1 patients [31, 32]. Resistance exercise training has been proved to be an accessible, low-cost way to improve SKM weakness and increase strength by inducing muscle hypertrophy in DM1 patients [33–39]. In mitochondrial myopathy patients, resistance exercise training was demonstrated to induce amelioration in the oxidative phosphorylation (OXPHOS) defects [40]. Mitochondrial OXPHOS defects can be detected in cells and tissues by using a single cell analysis combined to immunofluorescence, which has previously been shown to correlate with results obtained both from cytochrome c oxidase/succinate dehydrogenase histochemistry and mitochondrial enzymatic activity assays [41, 42]. Recently, mitochondrial OXPHOS deficiency has been found in DM1 patients compared to healthy individuals [43]. However, the effects of resistance exercise training on mitochondrial OXPHOS deficiency have never been assessed before at a single cell level in SKM from DM1 patients. Therefore, the aim of this study is to investigate baseline mitochondrial dysfunction and the impact of 12-week resistance exercise training in a cohort of DM1 patients to better elucidate the role of mitochondria in DM1 disease.
MATERIALS AND METHODS
Experimental design
This study is a secondary analysis of a larger project, in which DM1 patients (n = 11, men) were recruited to participate in a 12-week resistance exercise training program [38]. DM1 patients were aged between 31 and 60 years old; were able to walk independently and to give informed consent. Control muscle was obtained from healthy individuals, who voluntarily donated their tissue. Control muscle has previously been shown to have normal OXPHOS in immunofluorescence experiments. Vastus lateralis muscle biopsies from controls (n = 3, men) and DM1 patients (n = 11, men) pre- and post-exercise (Table 1) were collected at the Centre Intégré Universitaire de Santé et de Services Sociaux du Saguenay–Lac-St-Jean (Canada) [38]. Biopsy sections (10μm) were cut on glass slides at the Université du Québec à Chicoutimi (Canada). Samples were stored on dry ice until shipment to Newcastle University (Newcastle upon Tyne, United Kingdom). Upon receipt, samples were stored at –80°C.
Table 1
Characteristics of sex matched controls and DM1 participants enrolled in the resistance exercise training program
| Controls | Sex | Ages | PA | ||||
| # | years | hs/wk | |||||
| C4 | M | 33 | 4 | ||||
| C10 | M | 45 | 10 | ||||
| C13 | M | 23 | 1 | ||||
| Mean | 33.7 | ||||||
| SD | 9 | ||||||
| Participant number | Sex | Age | Age of onset | Duration of disease | CTG | MIRS | Phenotypical |
| # | years | years | years | n | presentation onset | ||
| 523 | M | 58 | 35 | 23 | 85 | 2 | Late |
| 907 | M | 59 | 34 | 25 | 533 | 3 | Adult |
| 1242 | M | 53 | 20 | 33 | 1200 | 3 | Juvenile |
| 1791 | M | 47 | 25 | 22 | 349 | 4 | Adult |
| 1806 | M | 40 | 13 | 27 | 608 | 4 | Juvenile |
| 1955 | M | 60 | 50 | 10 | 63 | 3 | Late |
| 2002 | M | 31 | 25 | 6 | 603 | 2 | Adult |
| 2005 | M | 60 | 54 | 6 | 74 | 3 | Late |
| 2019 | M | 50 | 44 | 6 | 67 | 3 | Late |
| 2110 | M | 34 | 30 | 4 | 86 | 1 | Late |
| 2182 | M | 36 | 24 | 12 | 414 | 4 | Adult |
| Mean | 48 | 32.2 | 15.8 | 371.1 | |||
| SD | 10.6 | 12.2 | 9.9 | 339.0 |
The following details are listed: participant number, sex, age, physical activity reported in hours per week, age of onset of the disease, duration of disease since diagnosis or first symptoms appearance, number of CTG triplet repeats expansion measured in blood, muscle impairment rating scale (MIRS) and phenotypical presentation.
Resistance exercise training
All participants completed a supervised 12-week resistance exercise training with two exercise sessions every week [38]. During the first session, the weight for each type of exercise was determined with the one-repetition maximum (1 RM) method, which consists in the execution of full-range movement before failure for each participant, calculated using the Epley formula [44]. During all sessions, participants completed 3 series of 6–8 RM of five lower limb training exercises, which included leg extension, leg press, hip abduction, squat, and plantar extension.
Clinical measurements
All clinical measurements related to the DM1 cohort, such as age, age of onset, CTG triplet repeat expansion in blood and muscular impairment rating scale (MIRS), were collected accordingly to previously published protocols [38]. Muscle strength was assessed with the 1-RM method pre- and post-training. Individual changes after the training program were reported in percentage compared to the pre-exercise value ([post-exercise value –pre-exercise value]/pre-exercise value * 100). An average composite score of lifted weight was then calculated with the following exercise (leg extension, leg press, hip abduction and squat). The phenotypical presentations were classified as juvenile when the age of onset is between 10 and 20 years old; adult when the age of onset is between 20 and 40 years old; late when at least two of these criteria are met: i) age of onset is >40yo, ii) CTG triplet repeat expansion is <200, iii) MIRS is 2 (minimal signs) or 1 (no muscle impairment) (Table 1).
Quadruple immunofluorescence
SKM sections were stained for quadruple immunofluorescence (QIF) to assess OXPHOS. The staining included the immunolabelling of key subunit NADH:Ubiquinone Oxidoreductase Subunit B8 (NDUFB8) for CI and Mitochondrially Encoded Cytochrome C Oxidase I (COX1) for CIV, together with Voltage Dependent Anion Channel 1 (VDAC1) as a mitochondrial mass marker and Laminin subunit alpha-1 (LAMA1) as a cell membrane marker [41].
Fluorescent microscopy
Fluorescent images were taken with Zeiss Cell Discoverer 7 (CD7) and analyzed using Zen 2011 (black edition) software. The CD7 includes the following parts: a Hamamatsu Fusion and a Zeiss Axiocam 506 monochrome camera; 5x/0.35, 20x/0.7 and 50x/1.2NA lenses; a Zeiss LED light source (Colibri 7). Image acquisition was performed at 20x magnification using a motorized stage AxioImager M1 and the tiling function in Zen software. For each section, a.czi file was generated using the stitching function in Zen.
Image analysis
Stitched images of the SKM sections (.czi files) were analyzed using Quadruple Immuno Analyser, an in-house software written in MatLab R2015a. The software automatically created a segmentation map of the SKM fibers’ boundaries using LAMA1 signal. The mean signal intensities for each channel in each single SKM fiber were exported in tabular format as.csv files [41].
Linear regression and 95% predictive interval model
Statistical analysis of QIF data was conducted using a 95% predictive interval linear regression model based on combined control population of fibers. As previously described, combined controls with normal OXPHOS is needed to quantify relative levels of deficiency in putative samples [45–47]. In patients’ samples, all fibers lying within the control predictive interval were classified as normal for NDUFB8 or COX1 (fibersnormal). Fibers below the interval were classified as fibers with a low level (fiberslow), and above the interval as fibers with a high level (fibershigh). The relationships between VDAC1 and NDUFB8 or COX1, respectively, for each patient and all controls are shown as scatterplots, here referred as 2Dmito plots (https://github.com/VDLNCL/DM1-mitochondria/blob/main/Report.pdf).
Bootstrapping and permutation test
We used statistical bootstrapping to estimate uncertainty about the proportions of fibers classified as fibersnormal, fiberslow and fibershigh. We used the permutation test to estimate whether observed differences in proportions after resistance exercise training are significant. The number of resamples was set as N = 5,000. We also generated bootstrapping estimates of Δfiberslow and Δfibershigh, the differences in proportion of fibers in each class (post-exercise - pre-exercise) to quantify our uncertainty about changes after exercise. A permutation test was performed for each class of fibers in each patient to calculate whether exercise-induced changes were statistically significant using the null hypothesis that the labels “pre-exercise” and “post-exercise” are interchangeable. The permutation test provided p-values through a one-sided t-test. Δfiberslow for both NDUFB8 and COX1 was classified as significant when there was a decrease after exercise (Δfiberslow <0) and p < 0.05. Δfibershigh for both NDUFB8 and COX1 was classified as significant when there was an increase after exercise (Δfibershigh >0) and the p-value was <0.05. All p-values were corrected for multiple testing by controlling for the False Discovery Rate [48].
Statistical tests
All statistical tests were performed in R (version 3.5.2, https://intro2r.com/citing-r.html). A t-test was used to assess the difference between the population means for VDAC1. The function t.test was used to perform two-sided t-test. An ANOVA test was used to test any significant difference in the mean of independent populations (control and pre-exercise fibers’ populations, or pre- and post-exercise fibers’ populations). The function aov was used to perform two-way ANOVA test. An over-representation test was used to test the statistical over-representation of a subset of observations (COX1low or COX1high) within a subset of collected data (NDUFB8low or NDUFB8high). The function hypertest (https://github.com/VDLNCL/DM1-mitochondria/blob/main/Over-representation%20test.R) was used to perform the over-representation test, where x was defined as number of NDUFB8low &COX1low or NDUFB8high&COX1high, m as number of COX1low or COX1high, y as number of NDUFB8low or NDUFB8high, n as the total number of fibers per sample.
RESULTS
DM1 cohort genotypic and phenotypical presentations
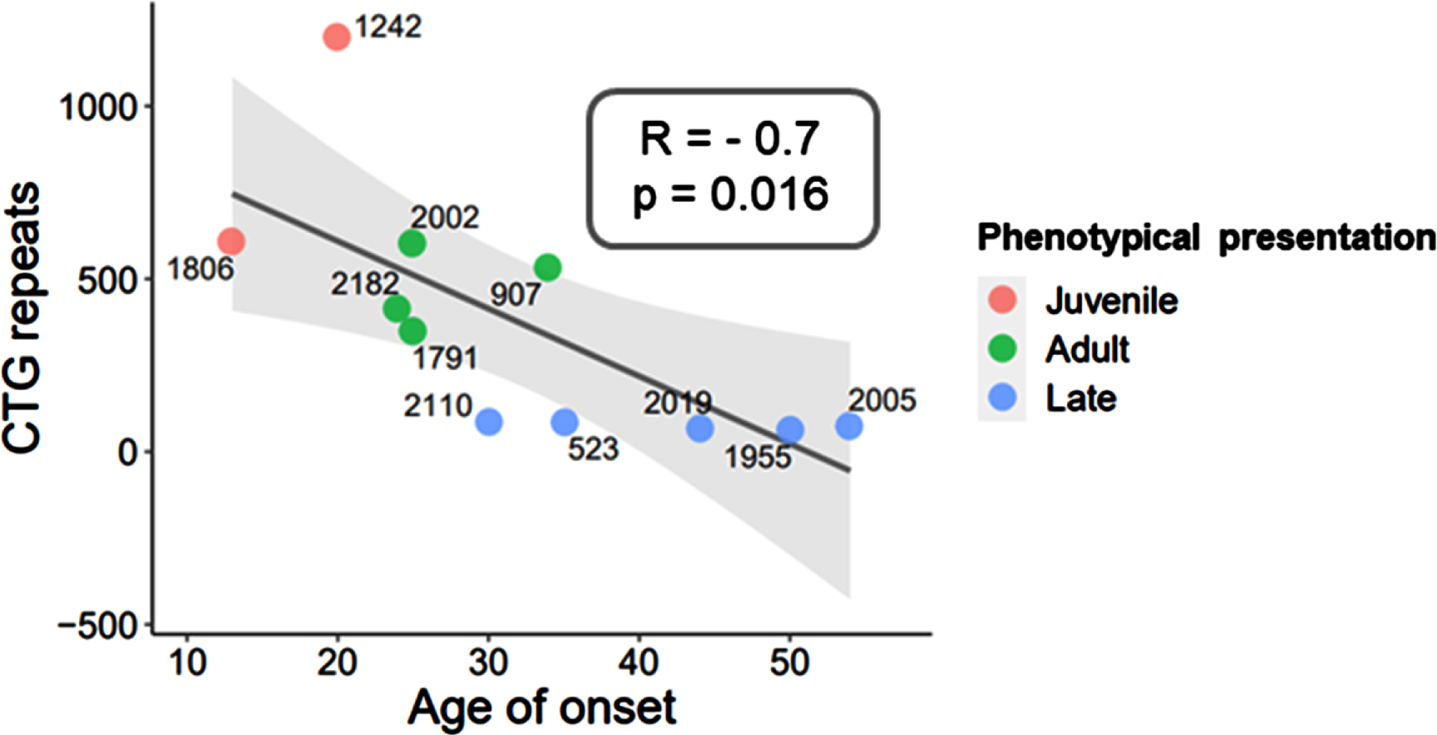
The cohort of subjects used in this study included DM1 participants (n = 11, men) and control muscle with normal OXPHOS (n = 3) (Table 1). The DM1 cohort presents with a mean age of 48±10.6 years, and a mean age of onset of 32.2±12.2 years. The CTG triplet repeat expansion varies between a minimum n = 63 (patient #1955) and a maximum n = 1,200 (patient #1242) of CTG triplet repeats. As expected, the CTG triplet repeat expansion shows a strong negative correlation with the age of onset displaying a slope significantly different from zero (Pearson, R = –0.7; p-value = 0.016, Fig. 1). The phenotypical presentations observed in the DM1 cohort were juvenile (n = 2), adult (n = 4) and late (n = 5) onset (Table 1), in accordance with previous publications [9, 38]. Importantly, duration of disease varies extremely across the DM1 cohort with more than 20 years in some patients (min = 22, max = 33, n = 5) or less than 20 years in others (min = 4, max = 12, n = 6) (Table 1).
Fig. 1
Genotypic and phenotypical presentation of DM1 cohort. The CTG triplet repeat expansion negatively correlates with the age of onset of DM1 disease, resulting in three phenotypical presentation classes: juvenile, adult, and late onset. Correlation coefficient (R) and p-value are indicated.
Mitochondrial mass deficiency and changes after resistance exercise training
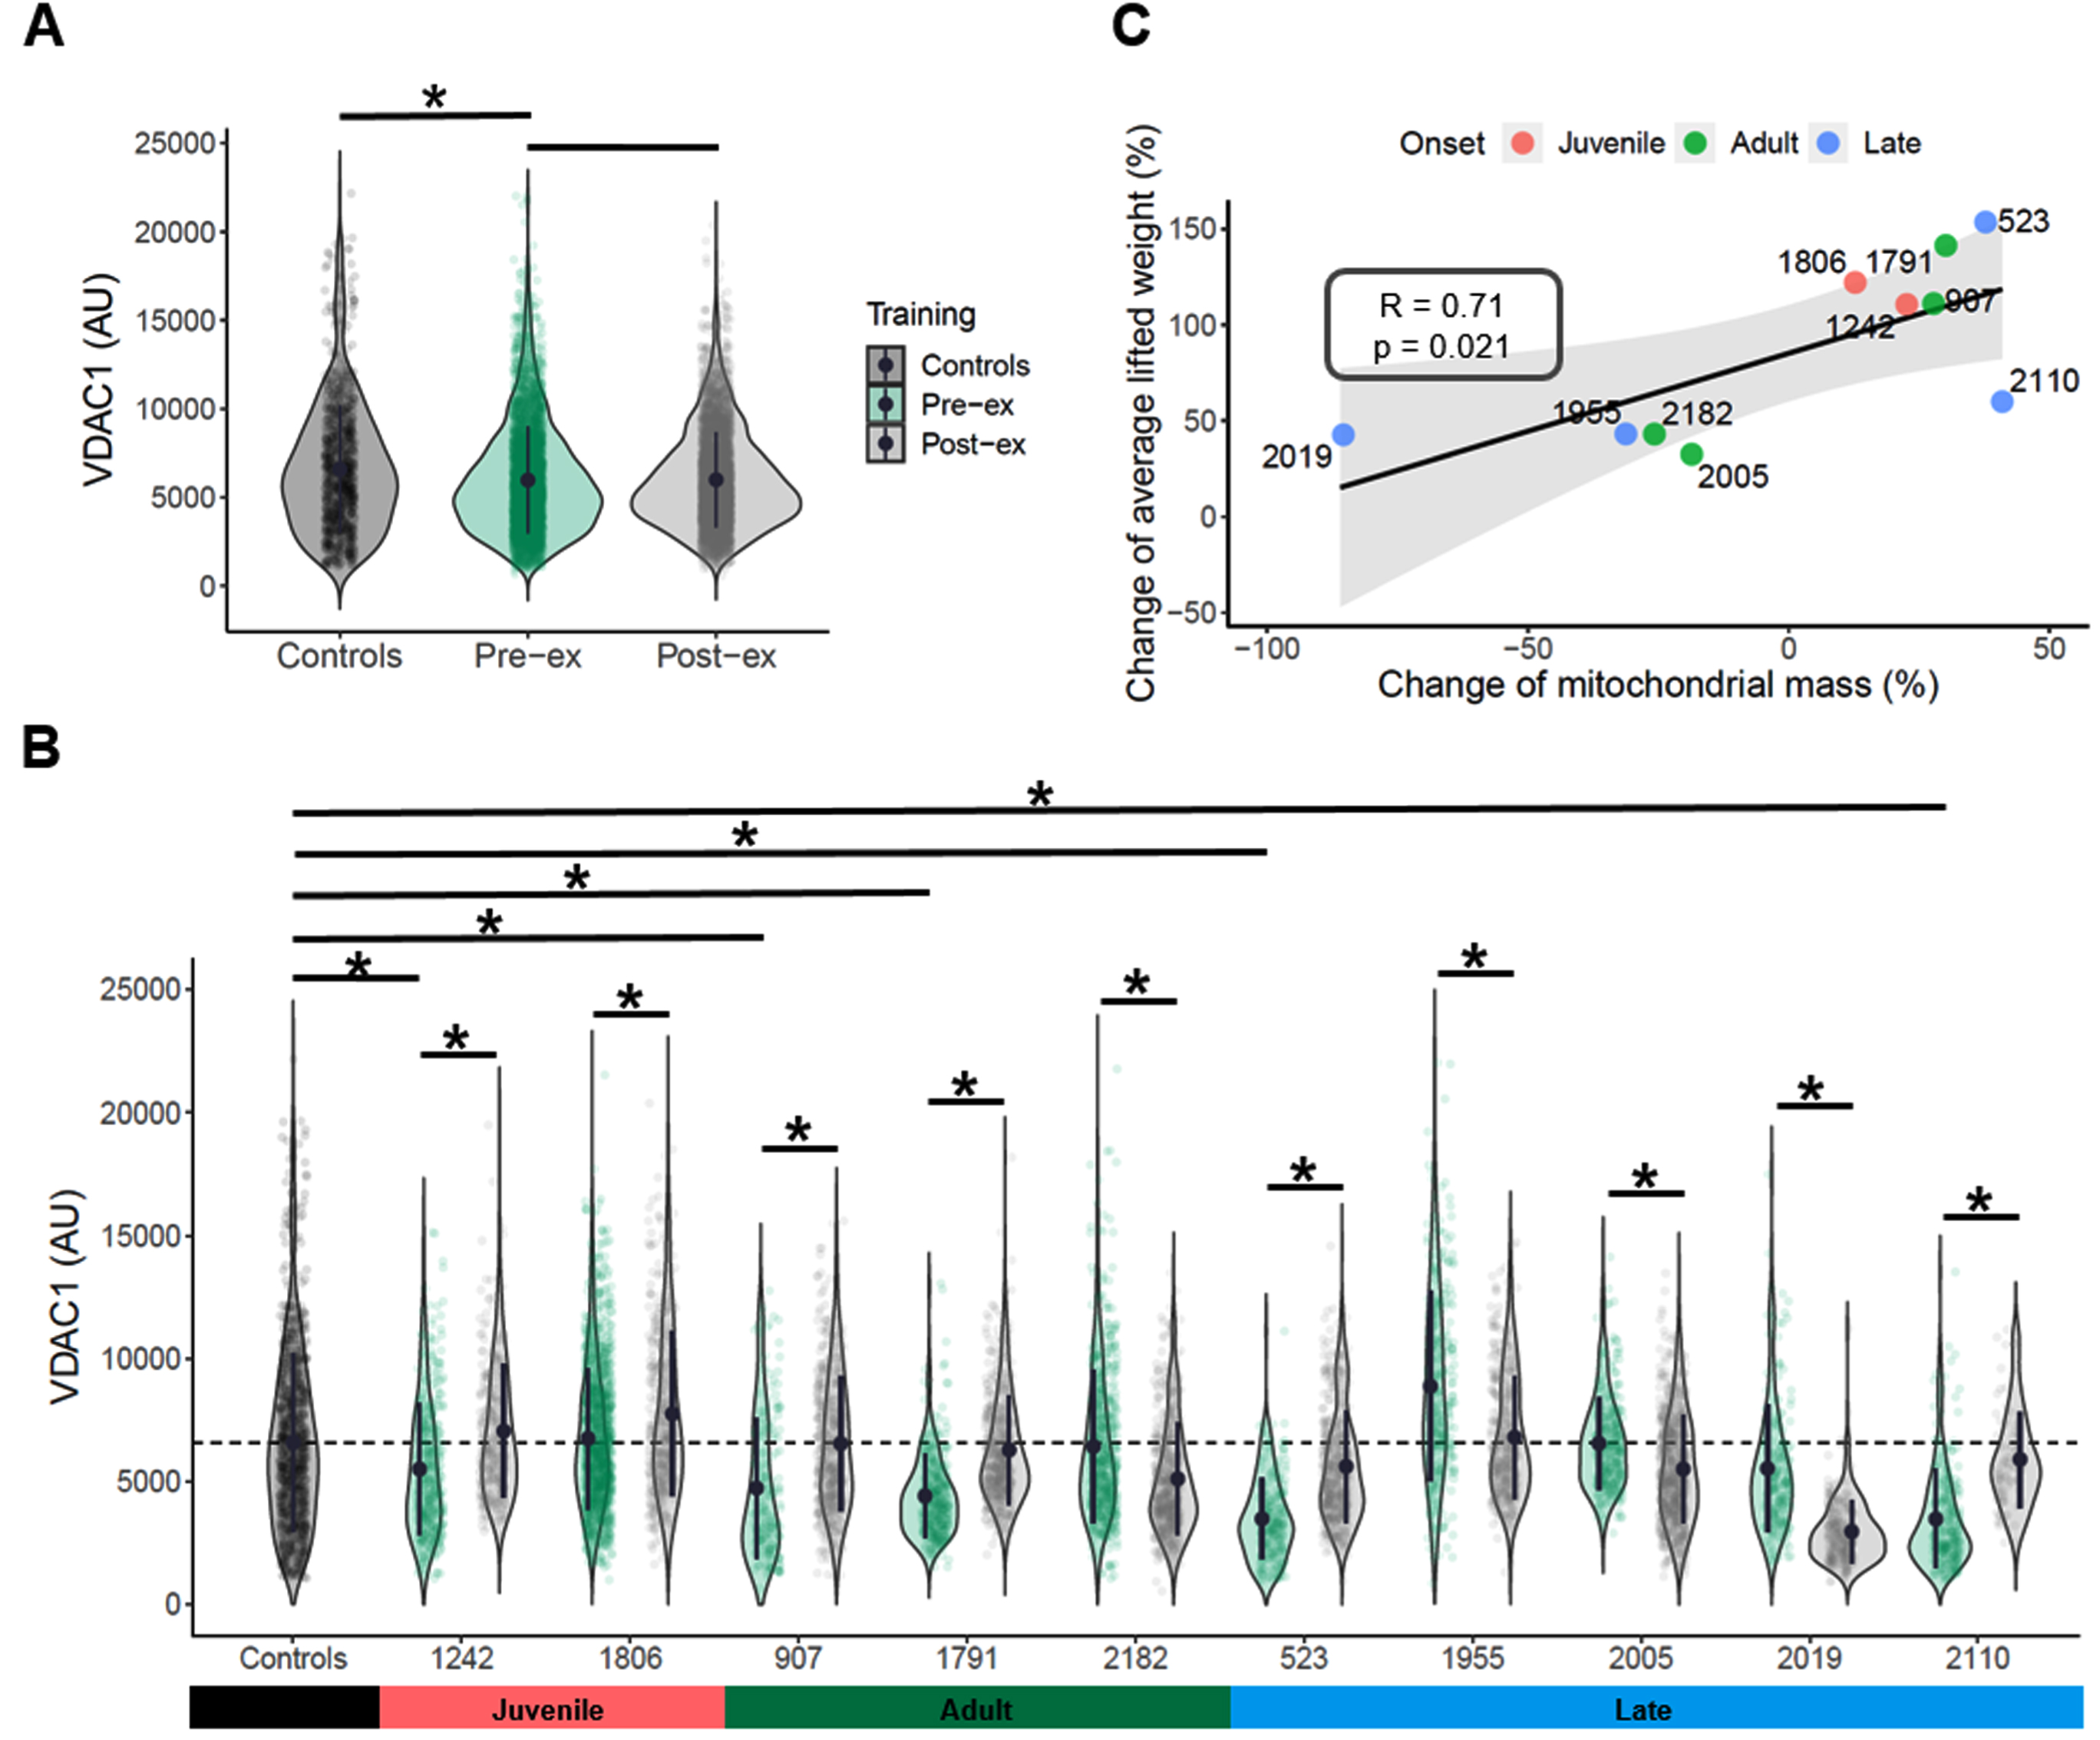
QIF labelling of NDUFB8, COX1, VDAC1 and LAMA1, was used to investigate mitochondrial mass and OXPHOS defects in the SKM biopsies of the DM1 cohort. QIF staining was not possible in pre-exercise section of case #2002, so the patient was excluded from further analyses. A representative image of the QIF staining is provided in Fig. 2, including one control and one patient sample (pre- and post- exercise). VDAC1 intensities from single myofibres in each section were assessed to calculate a mean value for each pre- and post-exercise sample across the DM1 cohort [45]. The DM1 pre-exercise group (mean = 5979.1 AU) shows significantly decreased mitochondrial mass compared to healthy controls (mean = 6591.6 AU) (two-way ANOVA test, p-value <0.0001, Fig. 3A). Grouped analysis of pre- and post-exercise samples (mean = 5,998 AU) does not show any significant change after exercise (Fig. 3A). However, when comparing individually each pair of pre- and post-exercise samples, six of 10 patients exhibit a significant increase in VDAC1 mean value (t-test two-sided, p-value <0.05, Fig. 3B). Four patients (cases #2182, #1955, #2005 and # 2019) present with a significant decrease in mitochondrial mass after exercise (t-test two-sided, p-value <0.05, Fig. 3B). Interestingly, after exercise these patients present with the smallest change both in mitochondrial mass and in average of lifted weight, which show a significant positive correlation (R = 0.71; p-value = 0.021, Fig. 3C).
Fig. 2
Representative QIF images of control subject, pre- and post-exercise pair from DM1 cohort after resistance exercise training. Representative images of quadruple immunofluorescence staining for LAMA1 (membrane marker), VDAC1 (mitochondrial mass marker), NDUFB8 (complex I marker) and COX1 (complex IV marker) in SKM sections from healthy Ctrl-13, P907 PRE (pre-exercise) and P907 POST (post-exercise) biopsies. The last row is the merge of all channels.
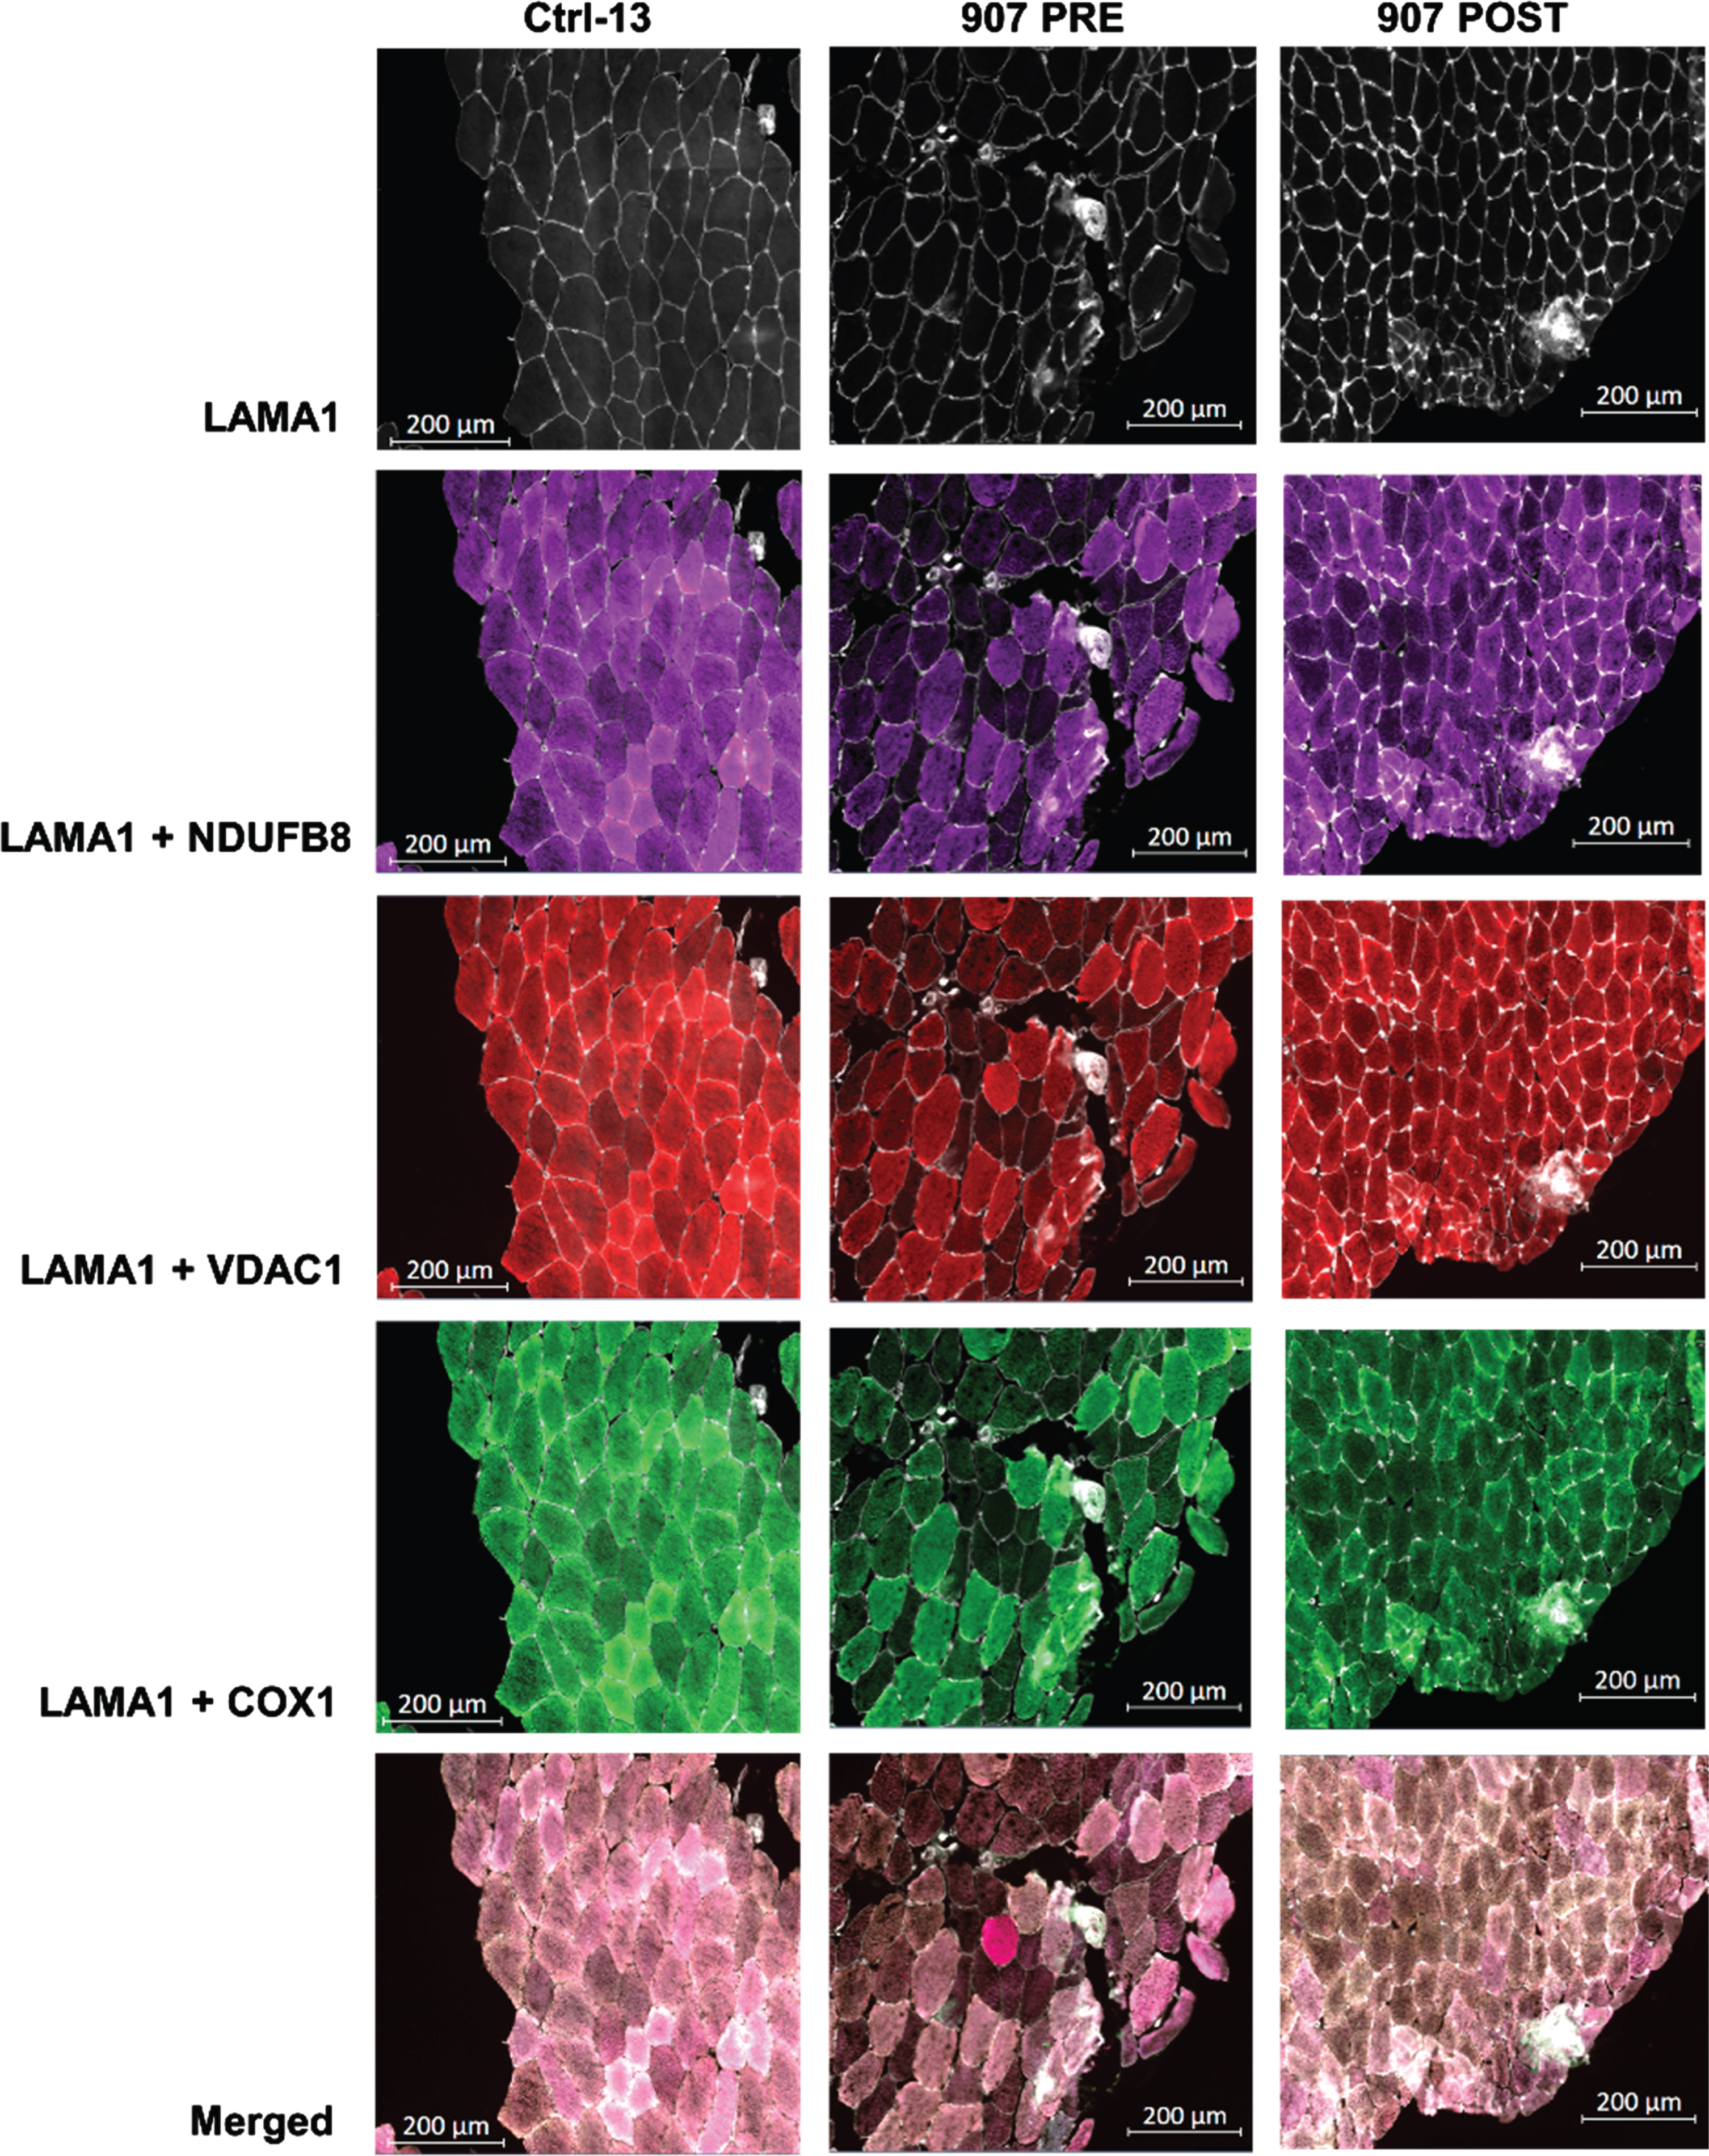
Fig. 3
Mitochondrial mass and exercise-induced effects in DM1 cohort. VDAC1 values were compared between pre-exercise group and controls or post-exercise group. Mean values, two-way ANOVA test, p-value <0.05 (*) (A). The mean value of mitochondrial mass in controls fibers is indicated as dashed black line. VDAC1 mean values were compared between each pre-exercise case and grouped controls. VDAC1 mean values were compared between pre- and post-exercise samples for each patient. Whiskers indicate the min and max values. Mean values, two-sided t-test, p-value <0.05 (*) (B). The change of mitochondrial mass after exercise was correlated to the change of the average composite score of lifted weight. Pearson’s correlation test was performed in R core; R factor and p value are reported for each correlation test (C).
CI and CIV deficiency in DM1 patients
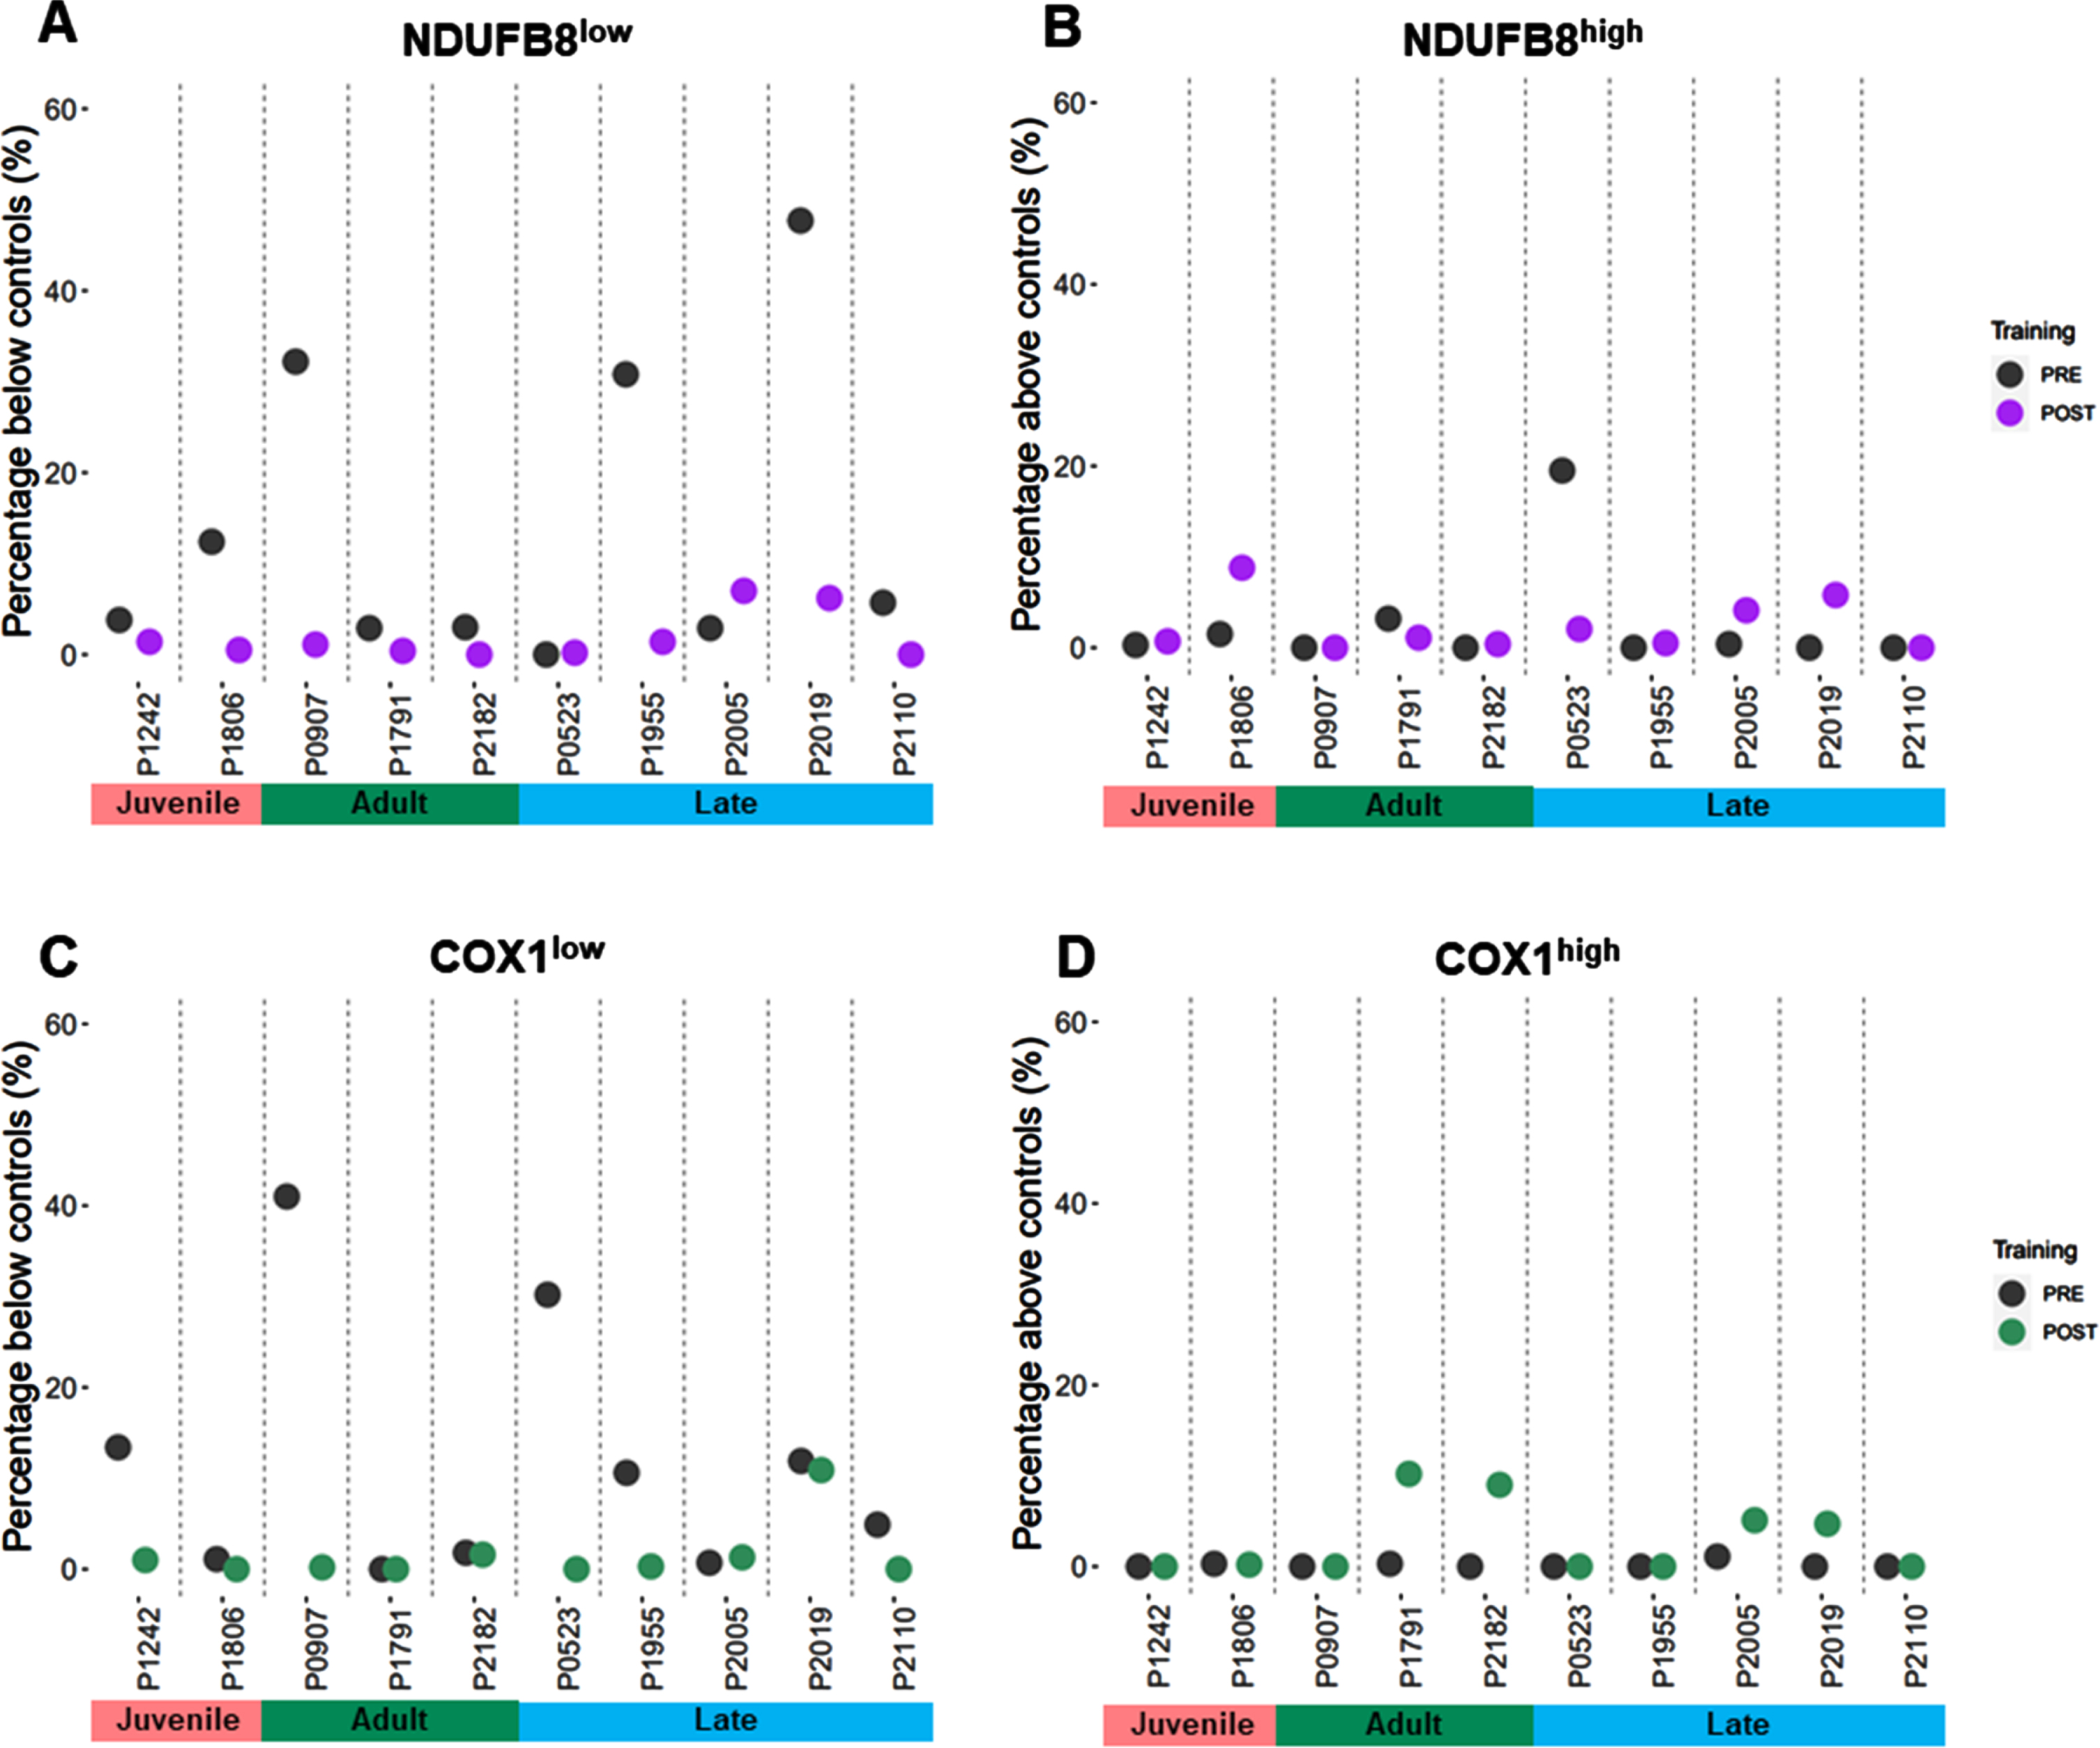
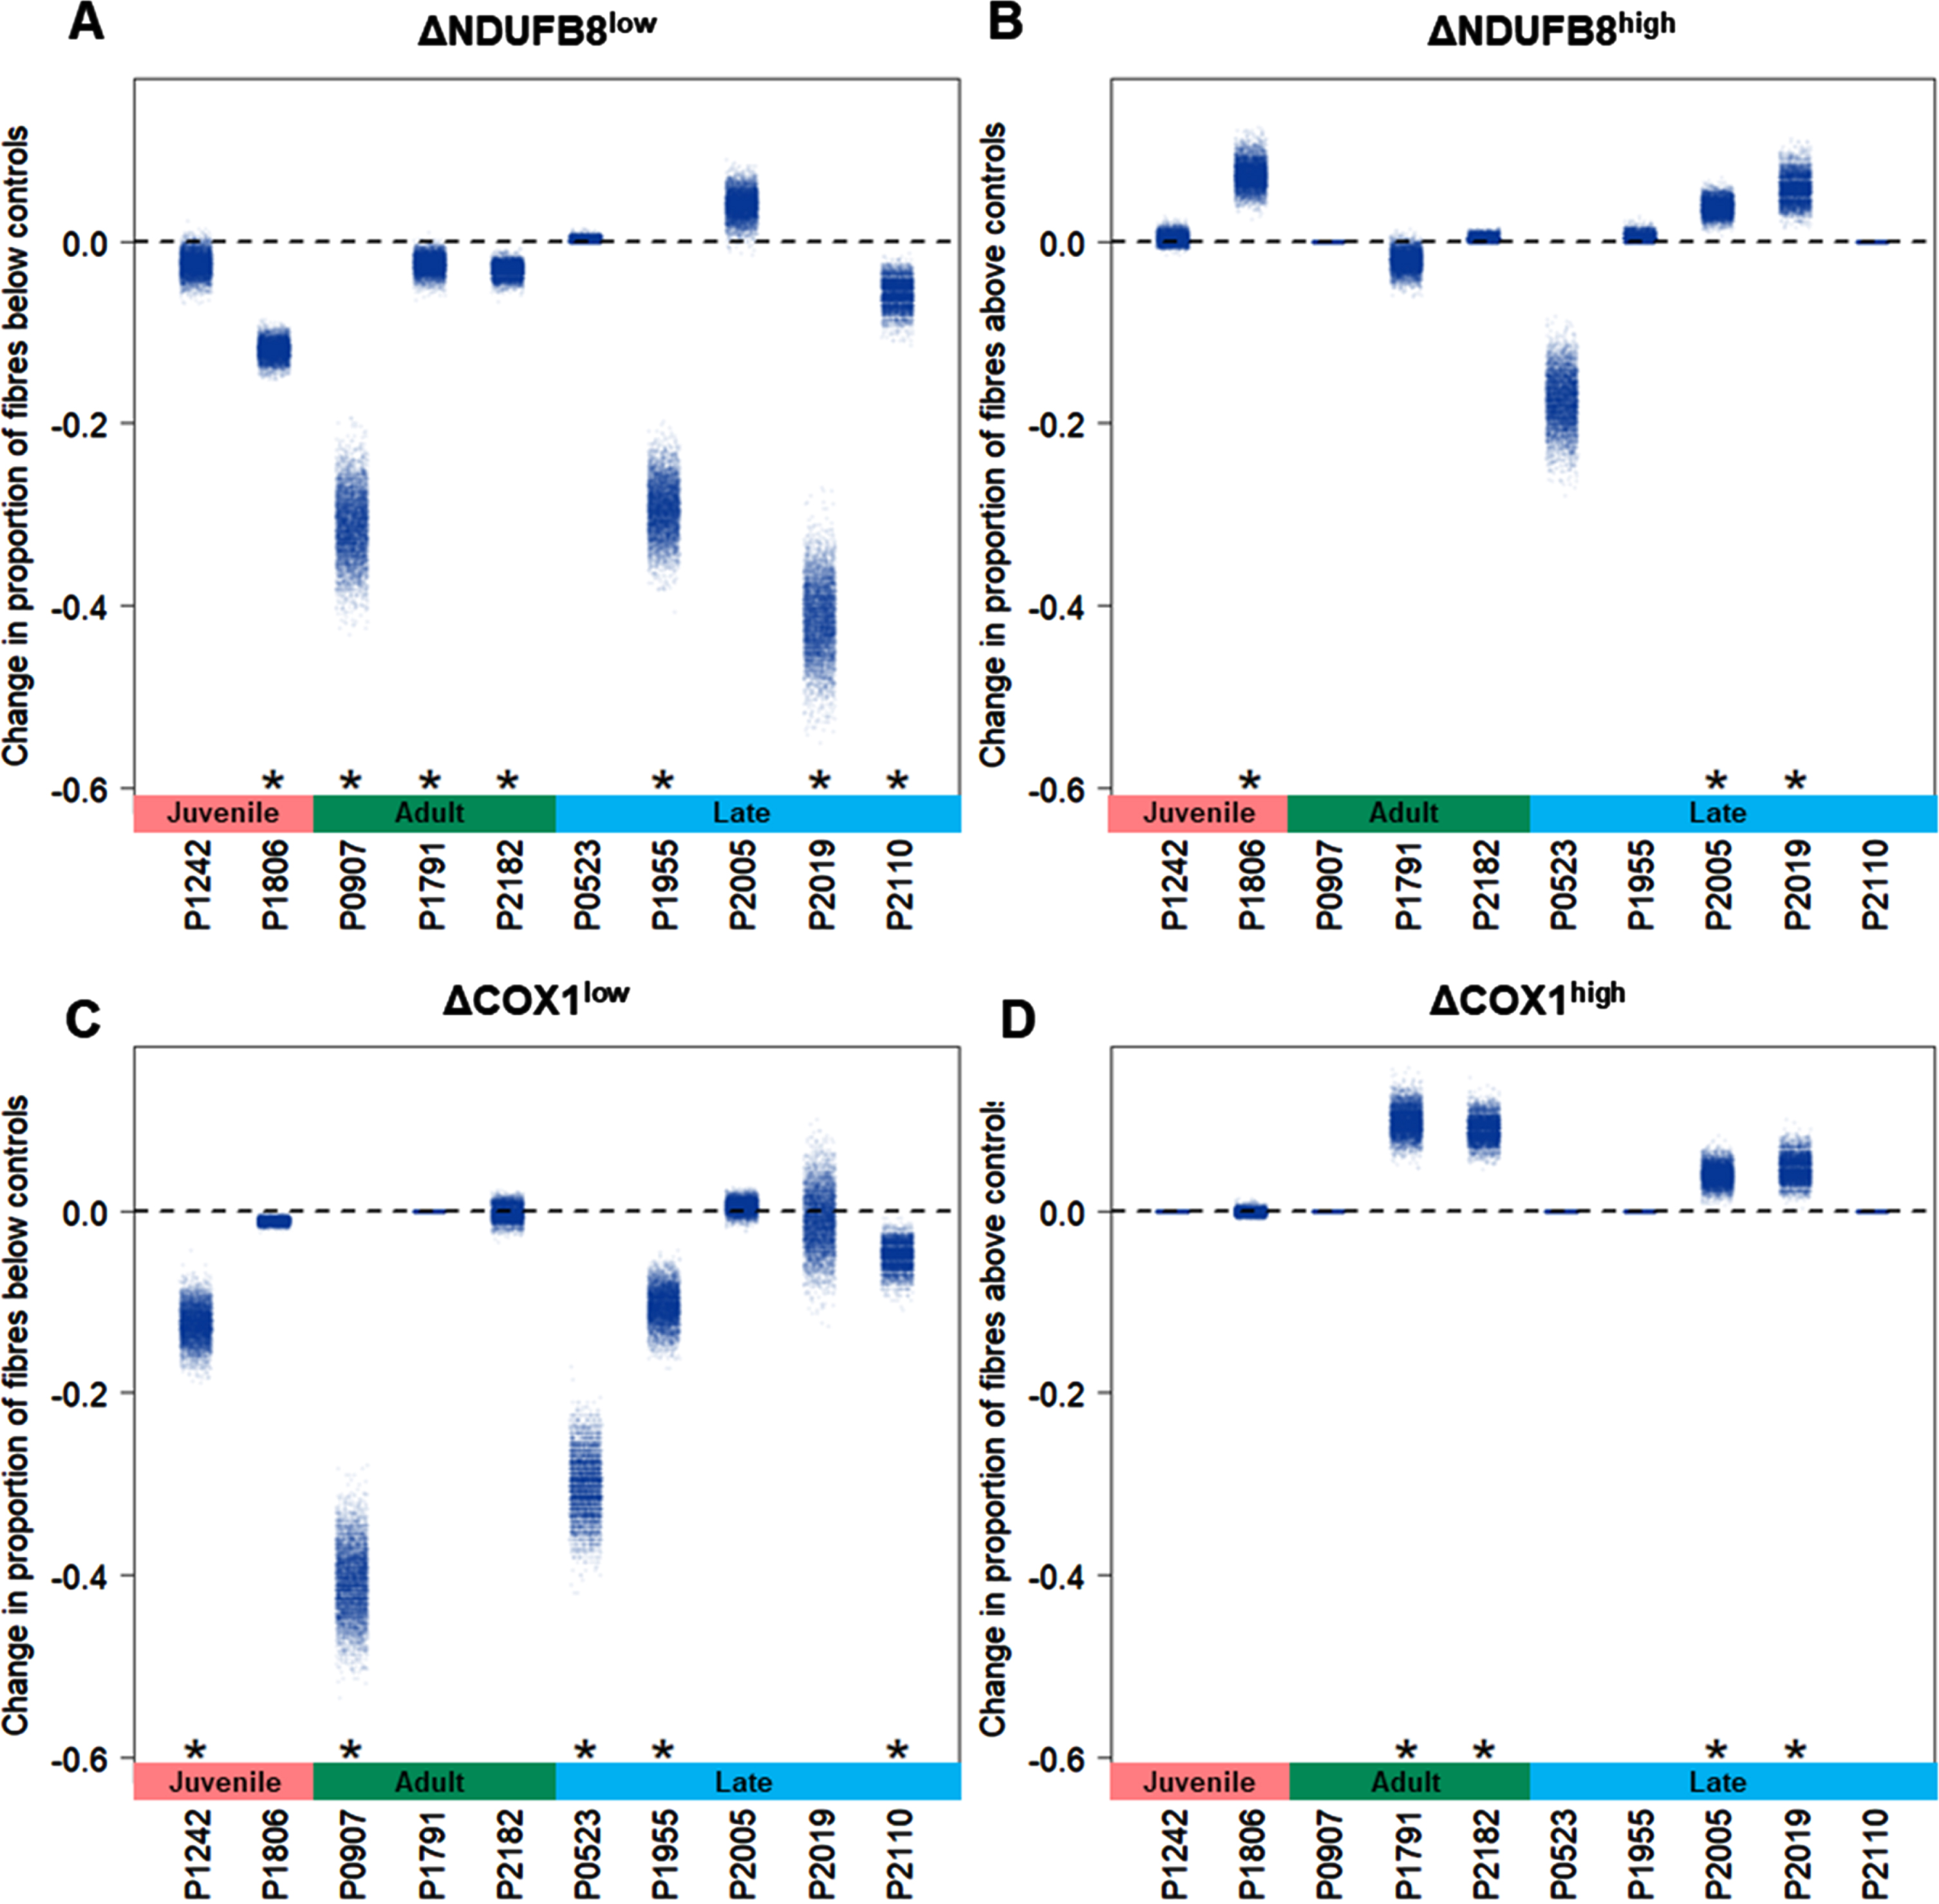
We classified single myofibres after QIF staining using a linear regression between VDAC1 intensity and either NDUFB8 or COX1, using data from combined healthy control muscle. Patients’ fibers were classified by comparison with the 95% predictive interval from the regression. A typical output of the statistical analysis is shown in Supplementary Figure 1. Percent of fibers below and above the control population, NDUFB8low and COX1low, NDUFB8high and COX1high fibers respectively, were calculated for each pair of samples for each patient in the DM1 cohort (Table 2). At baseline, only patient #523 presents with 0% NDUFB8low fibers. The rest of the DM1 cohort present with NDUFB8low fibers, although patients #1242, #1791, #2182 and #2005 display less than 5% fibers classified as NDUFB8low (Fig. 4A). Similarly, five of 10 patients show a high proportion of COX1low fibers (#1242, #907, #523, #1955 and #2019, (Fig. 4C). The proportion of NDUFB8high fibers is high in patient #523 before exercise (Fig. 4B), whereas the proportion of COX1high fibers is close to 0% in most patients before exercise (Fig. 4D).
Table 2
Classification of fibers across the DM1 cohort
| #Patient | Training | NDUFB8low | NDUFB8high | COX1low | COX1high |
| #523 | PRE | 0% | 19.5% | 30.2% | 0% |
| POST | 0.2% | 2.1% | 0% | 0% | |
| #907 | PRE | 32.2% | 0% | 41% | 0% |
| POST | 1.1% | 0% | 0.2% | 0% | |
| #1242 | PRE | 3.8% | 0.3% | 13.4% | 0% |
| POST | 1.4% | 0.0% | 1% | 0% | |
| #1791 | PRE | 2.9% | 3.2% | 0% | 0.3% |
| POST | 0.4% | 1.1% | 0% | 10.2% | |
| #1806 | PRE | 12.4% | 1.5% | 1.1% | 0.3% |
| POST | 0.5% | 8.8% | 0% | 0.2% | |
| #1955 | PRE | 30.8% | 0% | 10.6% | 0% |
| POST | 1.4% | 0.5% | 0.3% | 0% | |
| #2005 | PRE | 2.9% | 0.4% | 0.7% | 1.1% |
| POST | 7% | 4.1% | 1.3% | 5.1% | |
| #2019 | PRE | 47.7% | 0% | 11.9% | 0% |
| POST | 6.2% | 5.8% | 10.9% | 4.7% | |
| #2110 | PRE | 5.7% | 0% | 4.9% | 0% |
| POST | 0% | 0% | 0% | 0% | |
| #2182 | PRE | 3% | 0% | 1.8% | 0% |
| POST | 0% | 0.4% | 1.6% | 9% |
Fibers with low and high level of NDUFB8 and COX1 are reported in percent (%) for each sample of the DM1 cohort. Abbreviations: POST, post-exercise; PRE, pre-exercise.
Fig. 4
Overview of proportion of fibers with NDUFB8 and COX1 low or high in DM1 cohort. QIF data were analyzed by the 95% predictive interval model. The proportion of fibers are reported as proportion below controls with low level fibers for NDUFB8 (A) and COX1 (C), or as proportion above the controls with high level fibers for NDUFB8 (B) and COX1 (D).
Exercise-induced OXPHOS effects
To assess any significant change in the proportion of fiberslow and fibershigh after resistance exercise training, the changes between post- and pre-exercise cases were estimated by calculating delta (Δ). All patients, except #1242, #523 and #2005, display a significant decrease in the proportion of NDUFB8low fibers after exercise (p-value <0.05, Fig. 5A). Five patients (#1242, #907, #523, #1955, and #2110) exhibit a significant decrease in the proportion of COX1low fibers too (p-value <0.05, Fig. 5C). Furthermore, after exercise a significant increase in both NDUFB8high (n = 3) and COX1high (n = 4) proportion of fibers was observed (p-value <0.05, Fig. 5B-D). Overall, after resistance exercise training all patients in the DM1 cohort display a significant change (p-value <0.05) in at least one of the four classes of fibers identified (NDUFB8low, NDUFB8high, COX1low and COX1high fibers).
Fig. 5
Exercise-induced effects in OXPHOS activity in DM1 cohort. Changes in the proportion of fibers (Δ) between post- and pre-exercise cases were calculated and bootstrapped to give estimates of uncertainty. Significance of changes were tested using permutation test. Changes in the proportion of fibers were analyzed in fibers below the controls with low level for NDUFB8 (A) and COX1 (C), and in fibers above with high level for NDUFB8 (B) and COX1 (D). One-sided t-test between mean values of the proportion of fibers is indicated for each patient; p-value <0.05 (*).
Combined CI/CIV deficiency is improved after resistance exercise
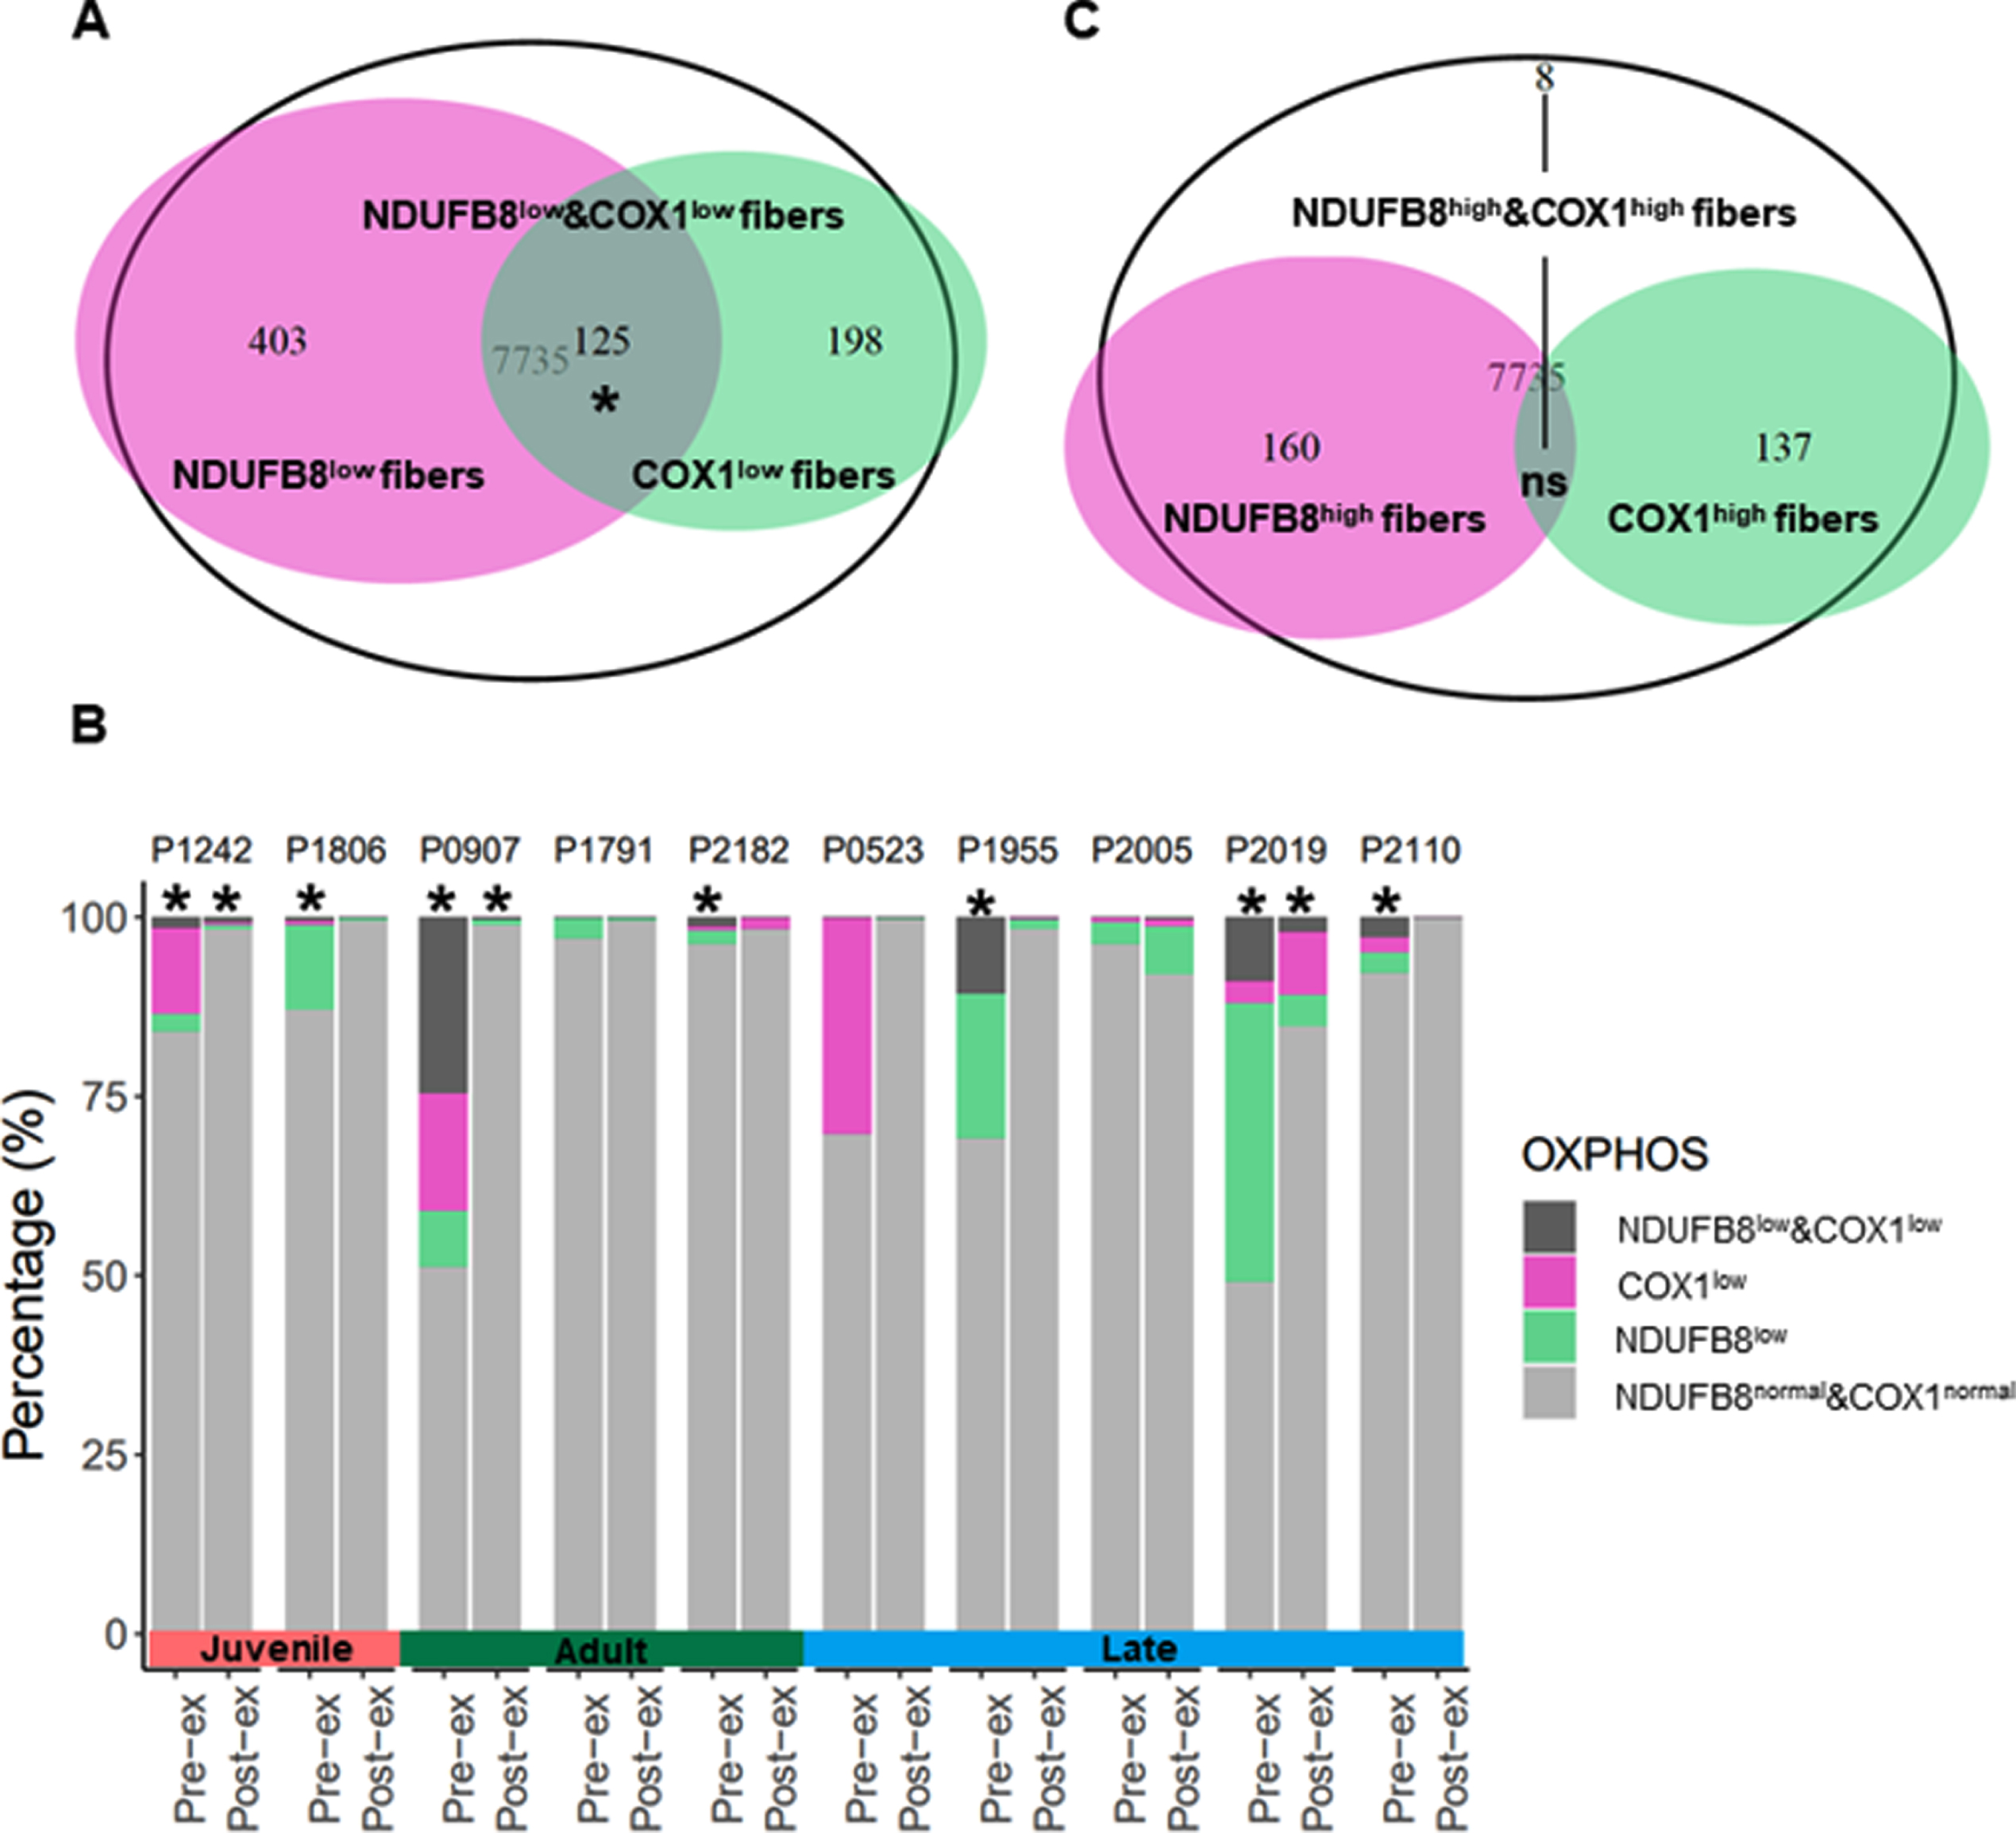
To establish whether DM1 patients present specifically with isolated CI deficiency, isolated CIV deficiency or combined CI/CIV deficiency, an over-representation test was utilized to assess the proportion of COX1low fibers (n = 323) among NDUFB8low fibers (n = 528). NDUFB8low &COX1low fibers were found to be significantly over-represented across the DM1 cohort including both pre- and post-exercise cases (p-value <0.05, Fig. 6A). However, a significant proportion of NDUFB8low &COX1low fibers is over-represented in seven pre-exercise cases (#1242, #1806, #907, #2182, #1955, #2019 and #2110), and in only three post-exercise cases (#1242, #907 and #2019), where the proportion of all deficient classes of fibers decrease dramatically after exercise intervention (Fig. 6B). Similarly, the proportion of fibershigh was investigated and an over-representation test was used to assess the proportion of COX1high fibers (n = 145) among NDUFB8high fibers (n = 168). Only eight NDUFB8high&COX1high fibers were identified in patient #2005 post-exercise sample, suggesting no overall significant over-representation of this class of fibers across the DM1 cohort (Fig. 6C).
Fig. 6
OXPHOS deficiency is a secondary trait of DM1 pathology. The total number of SKM fibers from the DM1 cohort includes 7,735 fibers, excluding the healthy control subjects. Some of the OXPHOS deficient fibers present with isolated NDUFB8 deficiency (NDUFB8low, n = 528), isolated COX1 deficiency (COX1low, n = 323) or both NDUFB8 and COX1 deficiency (NDUFB8low &COX1low, n = 125) (A). Pre- and post-exercise pairs of samples are shown displaying the percent of fibers NDUFB8low, COX1low and NDUFB8low &COX1low (B). Some fibers present with high level of NDUFB8 (NDUFB8high, n = 168), high level of COX1 (COX1high, n = 145), and with high level of NDUFB8 and COX1 (NDUFB8high&COX1high, n = 8) (C). Over-representation test was performed, p-value <0.05 (*).
DISCUSSION
The aim of this study was to investigate any potential OXPHOS dysfunction and OXPHOS protein changes after 12-week resistance exercise training in a cohort of DM1 patients [38]. Aerobic exercise training has been demonstrated to ameliorate OXPHOS deficiency in DM1 patients [43]. However, for the first time in the context of resistance exercise training, we investigated OXPHOS at a single-fiber level in SKM from DM1 patients. Our method using QIF has been extensively applied to study both complex I and complex IV, which before was not possible by using standard COX/SDH histochemistry, since only complex IV and complex II activities are measured, respectively [41]. QIF allows single cell quantification of the level of expression of the putative complexes normalized to the level of mitochondrial mass, which it has been demonstrated to correlate to the enzymatic complexes’ activity too [41]. Importantly, the identification of the proteins with western blot and immunofluorescence have been previously correlated to its genetic loss determined by activity assays and by spectrophotometer [42, 49, 50]. In this way, mitochondrial dysfunction has been investigated in both primary and secondary mitochondrial diseases, gathering information at a single cell level in muscle [47, 51], neurons and brain [52–55], pancreas [56] and bone [57].
It is important to mention that the healthy control cohort used in this study was not aged-matched to the DM1 cohort. We were able to recruit a limited number of healthy volunteers. We chose to focus on control biopsies from vastus lateralis, the same muscle biopsied in the DM1 patients, to limit the inter-muscle variability. Indeed, mitochondrial content depends on factors such as age and physical activity [58–60]. It could be speculated that the level of physical activity of the healthy controls would therefore be higher than the DM1 patients since the level of physical activity of this population is known to be reduced. However, due to strict exclusion criteria, participants who have been selected had the physical ability to be enrolled in the resistance exercise study. Overall, the interpretation of our results relies mainly on the comparison of pre- and post- biopsies from each DM1 patient; as such, the controls do not alter our interpretation of these paired comparisons. Whilst each fiber from DM1 patients’ samples were clustered in comparison to the control muscle population of fibers, here the importance is that the control samples have no mitochondrial OXPHOS deficiency.
By studying the involvement of mitochondrial dysfunction in DM1 SKM on a single cell level, we showed that DM1 SKM biopsies (n = 10) present with an overall decrease in mitochondrial mass when compared to healthy muscle with normal OXPHOS activity. Seven of 10 patients showed isolated or combined NDUFB8 and/or COX1 deficiency compared to healthy controls; findings that strongly resemble mitochondrial defects observed in mitochondrial myopathy patients with primary mitochondrial dysfunction [40, 45–47]. Both DM1 and primary mitochondrial disease patients demonstrate a heterogeneous clinical phenotype; yet both diseases present with overlapping symptoms, including but not limited to neuromuscular symptoms [61, 62]. Interestingly, SKM-specific mitochondrial dysfunction has also been described in other neuromuscular disorders, such as inclusion body myositis [63, 64], dysferlin-related myopathy [65] and myofibrillar myopathy [66]. A 12-week resistance exercise training program was sufficient to induce significant changes in OXPHOS defects in SKM of DM1 patients. A significant increase in mitochondrial mass was observed in six of 10 patients independent of age and phenotypical presentation. Strikingly, these patients, excluding case #2110, present with duration of disease greater than 20 years and reported considerable improvements in the ability to lift weights after resistance exercise training compared to other participants (Fig. 3B). Patients #2182, #1955, #2005 and #2019 did not exhibit an increase in mitochondrial mass, but rather a significant decrease after exercise intervention. It is important to note that VDAC1 mean value of pre-exercise cases in these patients was similar or even higher than the healthy controls mean, suggesting that the mitochondrial mass was not affected at baseline. Similarly, some of the smallest changes in lifting weights after resistance exercise training were reported in patients who were some of the strongest at baseline (Fig. 3B). These patients also had a duration of disease less than 20 years compared to the rest of the DM1 cohort. Altogether, these observations suggest that irrespective of which phenotypical presentation patients are classified as, there is potential for improvement in both terms of augmenting muscle strength [38] and increasing SKM mitochondrial mass. Moreover, due to the high heterogeneity observed in the DM1 cohort, significant improvements in OXPHOS function were mainly uncovered when analyzing each patient individually, suggesting that further investigation of DM1 individuals may benefit individual therapy/medicine.
After resistance exercise training, a significant improvement in mitochondrial OXPHOS capacity of complex I and/or complex IV was observed in all DM1 patients by either the decrease of deficient fibers (fiberslow) or the increase of fibers with higher protein level (fibershigh) compared to baseline measures. Indeed, significant changes were observed in at least one of the four classes of fibers (NDUFB8low, NDUFB8high, COX1low and COX1high) for each patient, indicating that the 12-week resistance exercise training is sufficient to induce increase of OXPHOS protein level in SKM of DM1 patients. Similarly, resistance exercise training has been reported to induce a significant increase in COX1 level in healthy individuals [67, 68], and in mitochondrial myopathy patients [40]. Furthermore, significant improvements have been observed both at the transcriptomic level by inducing changes in splicing events and differential gene expression [69], which strongly correlates to strength improvements, and at the proteomic level by increasing the level of mitochondrial proteins involved in a variety of different functions and pathways [70]. Similarly, mitochondrial functions have been found to play a prominent role in the amelioration of both cognitive and physical capabilities in DM1 disease [43, 71].
In DM1 patients, the CTG triplet repeat expansion is used as a marker of disease severity. The rescue of NDUFB8 and COX1 however is achieved in an independent manner to CTG triplet repeat expansion, meaning that even patients with the highest CTG triplet repeat expansions (#1242 and #1806) showed improvements in NDUFB8 and COX1 deficiency after resistance exercise training intervention. Indeed, the proportion of fibers with combined NDUFB8 and COX1 deficiency (NDUFB8low &COX1low) is significantly higher in pre-exercise cases compared to post-exercise case. Moreover, #1242, #907 and #2019 post-exercise display a decrease of NDUFB8low &COX1low fibers compared to the proportion observed before exercise. The changes in CI and CIV deficiency are independent of the phenotypical presentation classification, implying that overall OXPHOS defects might be a secondary trait in DM1 disease pathology, hence a DM1 hallmark that may be useful to determine the effects of exercise training intervention and disease progression [38, 43]. Herein, we highlight that the SKM adaptations triggered by resistance exercise training in DM1 are driven by the activation of mitochondrial molecular pathways that directly modify the pathogenicity of DM1. A multi-level mitochondrial characterization will be therefore crucial for the understanding of DM1 disease.
Limitations
There are several limitations of this study. Firstly, while this study included the largest cohort of DM1 patients enrolled in a resistance exercise training program, the number of DM1 patients included in the resistance exercise training trial was statistically low [29, 37, 38]. However, the 12-week resistance exercise trial provided effective relief in DM1 patients, and improvements in the clinical outcome showed a significant correlation both with increased mitochondria mass and transcriptomic changes [69]. Secondly, although samples were collected from the same individual and from the same leg muscle, it is unfeasible to conduct the analysis on the same myofibres due to repeated biopsies. This implies a certain degree of natural intra-muscle variability, which is a topic of particular relevance in relation to mitochondrial dysfunction in primary mitochondrial diseases [72]. Finally, only DM1 men were enrolled in the resistance exercise training program [38], although this is not unusual for exercise trials designed for neuromuscular patients’ cohort [29]. Hence, findings cannot be necessarily extrapolated to women, since sex is a modifying factor influencing DM1 disease [73, 74]. While this narrowed the inter-individual variability linked to sex, it will be important to assess the effects of resistance exercise training on a cohort of DM1 women, for which an ongoing trial has been carried over (NCT05400629).
CONCLUSIONS
In conclusion, for the first time we demonstrate that a supervised 12-week resistance exercise training program is sufficient to rescue SKM mitochondrial deficiency in a cohort of DM1 patients presenting with defects in both mitochondrial mass and OXPHOS. We show that the observed mitochondrial OXPHOS changes are independent of CTG triplet repeat expansion length and display both a decrease of isolated and combined deficient fibers for CI and CIV (NDUFB8low, COX1low, NDUFB8low &COX1low) and an increase of fibers with higher level of NDUFB8 and COX1 (NDUFB8high, COX1high). This implies not only that mitochondrial dysfunction might be classified as a secondary trait of DM1 pathology, but also that physical improvement is independent from the CTG triplet repeat expansion carried by DM1 patients. Resistance exercise training triggers important mitochondrial molecular pathways that lead to the rescue of mitochondrial function and to amelioration of the clinical phenotype observed in DM1 patients.
ACKNOWLEDGMENTS INCLUDING SOURCES OF SUPPORT
The authors of this study would like to thank all the participants who decided to enroll in the resistance exercise training program and to donate their samples to research. We would like to thank all the colleagues who have been involved in the recruitment of patients, organization of the resistance exercise training program and in the collection of the samples. Dre Cynthia Gagnon, who provided support with her research team, the Groupe de recherche interdisciplinaire sur les maladies neuromusculaires. Hélène Simard, who recruited all the participants in this study. Dre Catherine Savard and Dre Mylène Perron, who performed muscle biopsies. Dr Richard Debigaré, who gave support for the interpretation of the results. We would like to thank both Université du Québec à Chicoutimi, in particular the sports center for the access to equipment and rooms for training and evaluations. We would like to thank Newcastle University, particularly the Wellcome Centre for Mitochondrial Research for the access to the lab and equipment for the analysis of the skeletal muscle biopsies, and the Bioimaging Unit for the support provided.
FUNDING SOURCES
This work was supported by the Fondation du Grand Défi Pierre Lavoie, by the Centre d’Excellence en Recherche sur les Maladies Orphelines – Fondation Courtois (CERMO-FC), the Wellcome Centre for Mitochondrial Research (203105/A/16/Z), the NIHR Newcastle Biomedical Research Centre (BRC: -BRC-1215-20005) in order to access resources and equipment. The Wellcome Centre for Mitochondrial Research supported Dr V. Di Leo through a Ph.D. project match funded by Newcastle University (C0163N3028) and direct salary. The Fonds de recherche du Quebec-sante supported this work through a Chercheur boursier Junior 1 salary awarded to Dr E. Duchesne (FRQS-311186) and a Ph.D. study grant awarded to M.-P. Roussel (FRQS-35965). Dr A.E. Vincent is funded by a Sir Henry Wellcome Postdoctoral Fellowship (215888/Z/19/Z).
CONFLICT OF INTEREST
The authors have no conflict of interest to report.
AUTHOR CONTRIBUTIONS
E.D. and M-P.R. were responsible for collection of the skeletal muscle samples and training of the DM1 patient cohort. V.D.L. was responsible for the study conception and design. V.D.L., C.L. and T.B.G. performed the statistical analysis of the data generated during the study. M-P.R. and E.D. ensured consistency between the previous study [38] and the study here presented. V.D.L., C.L., M-P.R., E.D. and A.E.V. were involved in the interpretation of the data. A.E.V., G.S.G., O.M.R. and H.A.L.T. were responsible for the supervision of the project as part of a Ph.D. program. V.D.L. was responsible for drafting the manuscript. V.D.L. and all authors evaluated the manuscript and reviewed the final publication.
DATASETS/DATA AVAILABILITY STATEMENT
The data supporting the findings of this study are openly available in VDLNCL/DM1-mitochondria at https://github.com/VDLNCL/DM1-mitochondria.
SUPPLEMENTARY MATERIAL
[1] The supplementary material is available in the electronic version of this article: https://dx.doi.org/10.3233/JND-230099.
REFERENCES
[1] | Theadom A , Rodrigues M , Roxburgh R , Balalla S , Higgins C , Bhattacharjee R , et al. Prevalence of muscular dystrophies: A systematic literature review. Neuroepidemiology. (2014) ;43: (3-4):259–68. |
[2] | Bouchard G , Roy R , Declos M , Mathieu J , Kouladjian K . Origin and diffusion of the myotonic dystrophy gene in the Saguenay region (Quebec). Can J Neurol Sci. (1989) ;16: (1):119–22. |
[3] | Brook JD , McCurrach ME , Harley HG , Buckler AJ , Church D , Aburatani H , et al. Molecular basis of myotonic dystrophy: Expansion of a trinucleotide (CTG) repeat at the 3’ end of a transcript encoding a protein kinase family member. Cell. (1992) ;68: (4):799–808. |
[4] | Mahadevan M , Tsilfidis C , Sabourin L , Shutler G , Amemiya C , Jansen G , et al. Myotonic dystrophy mutation: An unstable CTG repeat in the 3’ untranslated region of the gene. Science. (1992) ;255: (5049):1253–5. |
[5] | Lavedan C , Hofmann-Radvanyi H , Shelbourne P , Rabes JP , Duros C , Savoy D , et al. Myotonic dystrophy: Size- and sex-dependent dynamics of CTG meiotic instability, and somatic mosaicism. Am J Hum Genet. (1993) ;52: (5):875–83. |
[6] | Thornton CA . Myotonic dystrophy. Neurol Clin. (2014) ;32: (3):705–19, viii. |
[7] | Thornton CA , Johnson K , Moxley RT 3rd. Myotonic dystrophy patients have larger CTG expansions in skeletal muscle than in leukocytes. Ann Neurol. (1994) ;35: (1):104–7. |
[8] | Savic Pavicevic D , Miladinovic J , Brkusanin M , Svikovic S , Djurica S , Brajuskovic G , et al. Molecular genetics and genetic testing in myotonic dystrophy type 1. Biomed Res Int. (2013) ;2013: :391821. |
[9] | De Antonio M , Dogan C , Hamroun D , Mati M , Zerrouki S , Eymard B , et al. Unravelling the myotonic dystrophy type 1 clinical spectrum: A systematic registry-based study with implications for disease classification. Rev Neurol (Paris). (2016) ;172: (10):572–80. |
[10] | Mankodi A , Logigian E , Callahan L , McClain C , White R , Henderson D , et al. Myotonic dystrophy in transgenic mice expressing an expanded CUG repeat. Science. (2000) ;289: (5485):1769–73. |
[11] | Lopez-Martinez A , Soblechero-Martin P , de-la-Puente-Ovejero L , Nogales-Gadea G , Arechavala-Gomeza V . An overview of alternative splicing defects implicated in myotonic dystrophy type I. Genes (Basel). (2020) ;11: (9). |
[12] | Ozimski LL , Sabater-Arcis M , Bargiela A , Artero R . The hallmarks of myotonic dystrophy type 1 muscle dysfunction. Biol Rev Camb Philos Soc. (2021) ;96: (2):716–30. |
[13] | van Herpen RE , Oude Ophuis RJ , Wijers M , Bennink MB , van de Loo FA , Fransen J , et al. Divergent mitochondrial and endoplasmic reticulum association of DMPK splice isoforms depends on unique sequence arrangements in tail anchors. Mol Cell Biol. (2005) ;25: (4):1402–14. |
[14] | Oude Ophuis RJ , Wijers M , Bennink MB , van de Loo FA , Fransen JA , Wieringa B , et al. A tail-anchored myotonic dystrophy protein kinase isoform induces perinuclear clustering of mitochondria, autophagy, and apoptosis. PLoS One. (2009) ;4: (11):e8024. |
[15] | Livigni A , Scorziello A , Agnese S , Adornetto A , Carlucci A , Garbi C , et al. Mitochondrial AKAP121 links cAMP and src signaling to oxidative metabolism. Mol Biol Cell. (2006) ;17: (1):263–71. |
[16] | Pantic B , Trevisan E , Citta A , Rigobello MP , Marin O , Bernardi P , et al. Myotonic dystrophy protein kinase (DMPK) prevents ROS-induced cell death by assembling a hexokinase II-Src complex on the mitochondrial surface. Cell Death Dis. (2013) ;4: (10):e858. |
[17] | Roberts DJ , Miyamoto S . Hexokinase II integrates energy metabolism and cellular protection: Akting on mitochondria and TORCing to autophagy. Cell Death Differ. (2015) ;22: (2):364. |
[18] | Ueda H , Shimokawa M , Yamamoto M , Kameda N , Mizusawa H , Baba T , et al. Decreased expression of myotonic dystrophy protein kinase and disorganization of sarcoplasmic reticulum in skeletal muscle of myotonic dystrophy. J Neurol Sci. (1999) ;162: (1):38–50. |
[19] | Siciliano G , Mancuso M , Tedeschi D , Manca ML , Renna MR , Lombardi V , et al. Coenzyme Q10, exercise lactate and CTG trinucleotide expansion in myotonic dystrophy. Brain Res Bull. (2001) ;56: (3-4):405–10. |
[20] | Wheeler TM , Krym MC , Thornton CA . Ribonuclear foci at the neuromuscular junction in myotonic dystrophy type 1. Neuromuscul Disord. (2007) ;17: (3):242–7. |
[21] | Panaite PA , Gantelet E , Kraftsik R , Gourdon G , Kuntzer T , Barakat-Walter I . Myotonic dystrophy transgenic mice exhibit pathologic abnormalities in diaphragm neuromuscular junctions and phrenic nerves. J Neuropathol Exp Neurol. (2008) ;67: (8):763–72. |
[22] | Gramegna LL , Giannoccaro MP , Manners DN , Testa C , Zanigni S , Evangelisti S , et al. Mitochondrial dysfunction in myotonic dystrophy type 1. Neuromuscul Disord. (2018) ;28: (2):144–9. |
[23] | Suomalainen A . Fibroblast growth factor A novel biomarker for human muscle-manifesting mitochondrial disorders. Expert Opin Med Diagn. (2013) ;7: (4):313–7. |
[24] | Lovadi E , Csereklyei M , Merkli H , FuLop K , Sebok A , Karcagi V , et al. Elevated FGF 21 in myotonic dystrophy type 1 and mitochondrial diseases. Muscle Nerve. (2017) ;55: (4):564–9. |
[25] | Vial G , Detaille D , Guigas B . Role of mitochondria in the mechanism(s) of action of metformin. Front Endocrinol (Lausanne). (2019) ;10: :294. |
[26] | Garcia-Puga M , Saenz-Antonanzas A , Fernandez-Torron R , Munain AL , Matheu A . Myotonic Dystrophy type 1 cells display impaired metabolism and mitochondrial dysfunction that are reversed by metformin. Aging (Albany NY). (2020) ;12: (7):6260–75. |
[27] | Gao Z , Cooper TA . Antisense oligonucleotides: Rising stars in eliminating RNA toxicity in myotonic dystrophy. Hum Gene Ther. (2013) ;24: (5):499–507. |
[28] | Timchenko L . Development of therapeutic approaches for myotonic dystrophies type 1 and type 2. Int J Mol Sci. (2022) ;23: (18). |
[29] | Stefanetti RJ , Blain A , Jimenez-Moreno C , Errington L , Ng YS , McFarland R , et al. Measuring the effects of exercise inneuromuscular disorders: A systematic review and meta-analyses. Wellcome Open Res. (2020) ;5: :84. |
[30] | Jones K , Hawke F , Newman J , Miller JA , Burns J , Jakovljevic DG , et al. Interventions for promoting physical activity in people with neuromuscular disease. Cochrane Database Syst Rev. (2021) ;5: (5):CD013544. |
[31] | van Engelen B , Consortium O . Cognitive behaviour therapy plus aerobic exercise training to increase activity in patients with myotonic dystrophy type 1 (DM1) compared to usual care (OPTIMISTIC): Study protocol for randomised controlled trial. Trials. (2015) ;16: :224. |
[32] | Okkersen K , Jimenez-Moreno C , Wenninger S , Daidj F , Glennon J , Cumming S , et al. Cognitive behavioural therapy with optional graded exercise therapy in patients with severe fatigue with myotonic dystrophy type 1: A multicentre, single-blind, randomised trial. Lancet Neurol. (2018) ;17: (8):671–80. |
[33] | Lindeman E , Leffers P , Spaans F , Drukker J , Reulen J , Kerckhoffs M , et al. Strength training in patients with myotonic dystrophy and hereditary motor and sensory neuropathy: A randomized clinical trial. Arch Phys Med Rehabil. (1995) ;76: (7):612–20. |
[34] | Lindeman E , Spaans F , Reulen J , Leffers P , Drukker J . Progressive resistance training in neuromuscular patients. Effects on force and surface EMG. J Electromyogr Kinesiol. (1999) ;9: (6):379–84. |
[35] | Tollback A , Eriksson S , Wredenberg A , Jenner G , Vargas R , Borg K , et al. Effects of high resistance training in patients with myotonic dystrophy. Scand J Rehabil Med. (1999) ;31: (1):9–16. |
[36] | Voet NB , van der Kooi EL , van Engelen BG , Geurts AC . Strength training and aerobic exercise training for muscle disease. Cochrane Database Syst Rev. (2019) ;12: (12):CD003907. |
[37] | Roussel MP , Morin M , Gagnon C , Duchesne E . What is known about the effects of exercise or training to reduce skeletal muscle impairments of patients with myotonic dystrophy type 1? A scoping review. BMC Musculoskelet Disord. (2019) ;20: (1):101. |
[38] | Roussel MP , Hebert LJ , Duchesne E . Strength-training effectively alleviates skeletal muscle impairments in myotonic dystrophy type 1. Neuromuscul Disord. (2020) ;30: (4):283–93. |
[39] | Lessard I , Gaboury S , Gagnon C , Bouchard K , Chapron K , Lavoie M , et al. Effects and acceptability of an individualized home-based 10-week training program in adults with myotonic dystrophy type 1. J Neuromuscul Dis. (2021) ;8: (1):137–49. |
[40] | Murphy JL , Blakely EL , Schaefer AM , He L , Wyrick P , Haller RG , et al. Resistance training in patients with single, large-scale deletions of mitochondrial DNA. Brain. (2008) ;131: (Pt 11):2832–40. |
[41] | Rocha MC , Grady JP , Grunewald A , Vincent A , Dobson PF , Taylor RW , et al. A novel immunofluorescent assay to investigate oxidative phosphorylation deficiency in mitochondrial myopathy: Understanding mechanisms and improving diagnosis. Sci Rep. (2015) ;5: :15037. |
[42] | Willis JH , Capaldi RA , Huigsloot M , Rodenburg RJ , Smeitink J , Marusich MF . Isolated deficiencies of OXPHOS complexes I and IV are identified accurately and quickly by simple enzyme activity immunocapture assays. Biochim Biophys Acta. (2009) ;1787: (5):533–8. |
[43] | Mikhail AI , Nagy PL , Manta K , Rouse N , Manta A , Ng SY , et al. Aerobic exercise elicits clinical adaptations in myotonic dystrophy type 1 patients independently of pathophysiological changes. J Clin Invest. (2022) ;132: (10). |
[44] | Wood TM , Maddalozzo GF , Harter RA . Accuracy of seven equations for predicting 1RM performance of apparently healthy, sedentary older adults. Meas Phys Educ Exerc Sci. (2002) ;6: (2):67–94. |
[45] | Warren C , McDonald D , Capaldi R , Deehan D , Taylor RW , Filby A , et al. Decoding mitochondrial heterogeneity in single muscle fibres by imaging mass cytometry. Sci Rep. (2020) ;10: (1):15336. |
[46] | Rocha MC , Rosa HS , Grady JP , Blakely EL , He L , Romain N , et al. Pathological mechanisms underlying single large-scale mitochondrial DNA deletions. Ann Neurol. (2018) ;83: (1):115–30. |
[47] | Ahmed ST , Alston CL , Hopton S , He L , Hargreaves IP , Falkous G , et al. Using a quantitative quadruple immunofluorescent assay to diagnose isolated mitochondrial Complex I deficiency. Sci Rep. (2017) ;7: (1):15676. |
[48] | Benjamini Y , et al. Controlling the false discovery rate: A practical and powerful approach to multiple testing. Journal of the Royal Statistical Society. Series B (Methodological). (1995) ;57: (1):289–300. |
[49] | Schilling B , Murray J , Yoo CB , Row RH , Cusack MP , Capaldi RA , et al. Proteomic analysis of succinate dehydrogenase and ubiquinol-cytochrome c reductase (Complex II and III) isolated by immunoprecipitation from bovine and mouse heart mitochondria. Biochim Biophys Acta. (2006) ;1762: (2):213–22. |
[50] | Dennerlein S , Rehling P . Human mitochondrial COX1 assembly into cytochrome c oxidase at a glance. J Cell Sci. (2015) ;128: (5):833–7. |
[51] | Sithamparanathan S , Rocha MC , Parikh JD , Rygiel KA , Falkous G , Grady JP , et al. Skeletal muscle mitochondrial oxidative phosphorylation function in idiopathic pulmonary arterial hypertension: In vivo and in vitro study. Pulm Circ. (2018) ;8: (2):2045894018768290. |
[52] | Chrysostomou A , Grady JP , Laude A , Taylor RW , Turnbull DM , Lax NZ . Investigating complex I deficiency in Purkinje cells and synapses in patients with mitochondrial disease. Neuropathol Appl Neurobiol. (2016) ;42: (5):477–92. |
[53] | Grunewald A , Lax NZ , Rocha MC , Reeve AK , Hepplewhite PD , Rygiel KA , et al. Quantitative quadruple-label immunofluorescence of mitochondrial and cytoplasmic proteins in single neurons from human midbrain tissue. J Neurosci Methods. (2014) ;232: (100):143–9. |
[54] | Smith LA , Erskine D , Blain A , Taylor RW , McFarland R , Lax NZ . Delineating selective vulnerability of inhibitory interneurons in Alpers’ syndrome. Neuropathol Appl Neurobiol. (2022) ;48: (6):e12833. |
[55] | Smith LA , Chen C , Lax NZ , Taylor RW , Erskine D , McFarland R . Astrocytic pathology in Alpers’ syndrome. Acta Neuropathol Commun. (2023) ;11: (1):86. |
[56] | Yu X , Arden C , Berlinguer-Palmini R , Chen C , Bradshaw C , Smith AL , et al. Mitochondrial complex I subunit deficiency promotes pancreatic alpha-cell proliferation. Mol Metab. (2022) ;60: :101489. |
[57] | Dobson PF , Rocha MC , Grady JP , Chrysostomou A , Hipps D , Watson S , et al. Unique quadruple immunofluorescence assay demonstrates mitochondrial respiratory chain dysfunction in osteoblasts of aged and PolgA(-/-) mice. Sci Rep. (2016) ;6: :31907. |
[58] | Sun N , Youle RJ , Finkel T . The mitochondrial basis of aging. Mol Cell. (2016) ;61: (5):654–66. |
[59] | Amorim JA , Coppotelli G , Rolo AP , Palmeira CM , Ross JM , Sinclair DA . Mitochondrial and metabolic dysfunction in ageing and age-related diseases. Nat Rev Endocrinol. (2022) ;18: (4):243–58. |
[60] | Memme JM , Erlich AT , Phukan G , Hood DA . Exercise and mitochondrial health. J Physiol. (2021) ;599: (3):803–17. |
[61] | Wenninger S , Montagnese F , Schoser B . Core clinical phenotypes inmyotonic dystrophies. Front Neurol. (2018) ;9: :303. |
[62] | Jimenez-Moreno AC , Pinto CA , Levitan B , Whichello C , Dyer C , Van Overbeeke E , et al. A study protocol for quantifying patient preferences in neuromuscular disorders: A case study of the IMI PREFER Project. Wellcome Open Res. (2020) ;5: :253. |
[63] | Oldfors A , Moslemi AR , Jonasson L , Ohlsson M , Kollberg G , Lindberg C . Mitochondrial abnormalities in inclusion-body myositis. Neurology. (2006) ;66: (2 Suppl 1):S49–55. |
[64] | Rygiel KA , Miller J , Grady JP , Rocha MC , Taylor RW , Turnbull DM . Mitochondrial and inflammatory changes in sporadic inclusion body myositis. Neuropathol Appl Neurobiol. (2015) ;41: (3):288–303. |
[65] | Vincent AE , Rosa HS , Alston CL , Grady JP , Rygiel KA , Rocha MC , et al. Dysferlin mutations and mitochondrial dysfunction. Neuromuscul Disord. (2016) ;26: (11):782–8. |
[66] | Vincent AE , Grady JP , Rocha MC , Alston CL , Rygiel KA , Barresi R , et al. Mitochondrial dysfunction in myofibrillar myopathy. Neuromuscul Disord. (2016) ;26: (10):691–701. |
[67] | Bengtsson J , Gustafsson T , Widegren U , Jansson E , Sundberg CJ . Mitochondrial transcription factor A and respiratory complex IV increase in response to exercise training in humans. Pflugers Arch. (2001) ;443: (1):61–6. |
[68] | Parise G , Brose AN , Tarnopolsky MA . Resistance exercise training decreases oxidative damage to DNA and increases cytochrome oxidase activity in older adults. Exp Gerontol. (2005) ;40: (3):173–80. |
[69] | Davey EE , Legare C , Planco L , Shaughnessy S , Lennon CD , Roussel MP , et al. Individual transcriptomic response to strength training for myotonic dystrophy type 1 patients. JCI Insight. 2023. |
[70] | Aoussim A , et al. Towards the identification of biomarkers for muscle function improvement in myotonic dystrophy type 1, Accepted in Journal of Neuromuscular Diseases. |
[71] | van Cruchten RTP , van As D , Glennon JC , van Engelen BGM , t Hoen PAC , Consortium O , et al. Clinical improvement of DM1 patients reflected by reversal of disease-induced gene expression in blood. BMC Med. (2022) ;20: (1):395. |
[72] | Maeda K , Kawai H , Sanada M , Terashima T , Ogawa N , Idehara R , et al. Clinical phenotype and segregation of mitochondrial 3243A>G mutation in 2 pairs of monozygotic twins. JAMA Neurol. (2016) ;73: (8):990–3. |
[73] | Dogan C , De Antonio M , Hamroun D , Varet H , Fabbro M , Rougier F , et al. Gender as a modifying factor influencing myotonic dystrophy type 1 phenotype severity and mortality: A nationwide multiple databases cross-sectional observational study. PLoS One. (2016) ;11: (2):e0148264. |
[74] | Gagnon C , Petitclerc E , Kierkegaard M , Mathieu J , Duchesne E , Hebert LJ . A 9-year follow-up study of quantitative muscle strength changes in myotonic dystrophy type 1. J Neurol. (2018) ;265: (7):1698–705. |


