
IMPatienT: An Integrated Web Application to Digitize, Process and Explore Multimodal PATIENt daTa
Abstract
Medical acts, such as imaging, lead to the production of various medical text reports that describe the relevant findings. This induces multimodality in patient data by combining image data with free-text and consequently, multimodal data have become central to drive research and improve diagnoses. However, the exploitation of patient data is problematic as the ecosystem of analysis tools is fragmented according to the type of data (images, text, genetics), the task (processing, exploration) and domain of interest (clinical phenotype, histology). To address the challenges, we developed IMPatienT (Integrated digital Multimodal PATIENt daTa), a simple, flexible and open-source web application to digitize, process and explore multimodal patient data. IMPatienT has a modular architecture allowing to: (i) create a standard vocabulary for a domain, (ii) digitize and process free-text data, (iii) annotate images and perform image segmentation, (iv) generate a visualization dashboard and provide diagnosis decision support. To demonstrate the advantages of IMPatienT, we present a use case on a corpus of 40 simulated muscle biopsy reports of congenital myopathy patients. As IMPatienT provides users with the ability to design their own vocabulary, it can be adapted to any research domain and can be used as a patient registry for exploratory data analysis. A demo instance of the application is available at https://impatient.lbgi.fr/.
INTRODUCTION
Patient data now incorporates the results of numerous technologies, including imaging, next-generation sequencing and more recently wearable devices. Furthermore, medical acts such as echography, radiology or histology, produce imaging data that are generally combined with medical reports to describe the relevant findings. Thus, multimodality is induced in patient data, as imaging data is inherently linked to free-text reports. The link between image and report data is crucial as raw images can be re-interpreted during the patient’s medical journey with new domain knowledge or by different experts leading to complementary reports. The use of multimodal data has been shown to increase disease understanding and diagnosis [1–4]. For example, Venugopalan et al. integrated genetic data with image data and medical records (free-text data) to improve diagnosis of Alzheimer’s disease [4]. In Mendelian diseases, integration of multiple levels of information is key to the establishment of a diagnosis. For instance, in congenital myopathies (CM), a combination of muscle biopsy analysis (imaging information) with medical records and sequencing data is essential for differential diagnosis between CM subtypes [5–7]. Centralization of multimodal data using dedicated software is essential to implement such an approach. First, multimodal patient data needs to be processed in an integrated way to preserve this link in a single database or data warehouse. Second, useful tools to process and explore multimodal data are essential to drive research and improve diagnosis.
Unfortunately, the ecosystem of software tools for the exploitation of patient data is heavily fragmented, according to the type of data (images, text, genetic sequences), the task to be performed (digitization, processing, exploration) and the domain of interest (clinical phenotype, histology, etc.). Exploitation tools can be divided into two main categories: (i) software to process the data and (ii) software to explore the data.
Clinical reports are generally written using free-text, and therefore processing relies on the use of a standard vocabulary, such as the Unified Medical Language System (UMLS) [8] or the Human Phenotype Ontology (HPO)[9]. Several tools have been developed to easily manage and extend these standard vocabularies, including Protégé [10]. Text mining processes have been developed that exploit these standard vocabularies to automatically detect important keywords in free-text data. For example, Doc2HPO [11] can extract a list of HPO terms from free-text medical records. Other software packages, e.g. Phenotips [12], have been developed to centralize and process general patient information, including demographics, pedigree, common measurements, phenotypes and genetic results. SAMS [13] and RD-Connect PhenoStore [14] are further examples of web applications that aim to perform deep phenotyping of patients by building a single database of standardized patient data using well-established ontologies such as HPO.
A number of tools have been developed to analyze and explore patient data, based on a list of HPO terms describing a patient’s specific phenotypic profile. For example, Phenolyzer [15] and Phenomizer [16] can be used to help prioritize candidate genes or rank the best-matching diseases. However, these tools are restricted to the use of HPO terms to describe the patient’s profile and are not compatible with other ontologies. Ontology agnostic algorithms have also been developed that predict an outcome based on a list of terms from any normalized vocabulary, such as the Bayesian Ontology Query Algorithm (BOQA) [17].
Finally, for imaging data, software to process and annotate gigapixel scale microscopy images are widely used, including Cytomine [18], SlideRunner [19] and Ilastik [20]. While Cytomine incorporates an ontology builder and complex image processing tools, it is restricted to image data only. For exploitation of patient images, guidelines and frameworks have been proposed to standardize the measurement of pathological features for example from DICOM lung images [21]. Some multimodal approaches such as ClinPhen [22] and Exomiser [23] have successfully combined multiple levels of information with both phenotype information (HPO terms) and genetic information (variants) to rank candidate genes in Mendelian diseases. Other tools such as INTEGRO [24] have been developed to automatically mine disease-gene associations for a specific input disease from multiple curated sources of knowledge.
This large ecosystem of tools highlights the need for an integrated tool that can: (i) process and explore patient data, (ii) manage multimodal data (text and images), and (iii) work in any domain of interest.
In this study, we present IMPatienT (Integrated digital Multimodal PATIENt daTa), a free and open-source web application designed to provide an integrated tool to digitize, process and explore multimodal patient data. IMPatienT is a turnkey solution that can aggregate patient data and provides simple tools and interfaces allowing clinicians to easily extract information from multimodal patient data. IMPatienT is based on a modular architecture, and currently incorporates four components to: (i) create a standard vocabulary describing a domain of interest, (ii) digitize and process free-text records by automatically mapping them to a set of standard terms, (iii) annotate and segment images with standard vocabulary, and (iv) generate a dashboard with automatic visualizations to explore the patient data and perform automatic diagnosis suggestions.
We demonstrate the usefulness of IMPatienT on a set of congenital myopathy (CM) cases. CM are a family of rare genetic diseases, including multiple distinct subtypes, that still lack proper diagnosis with more than 50% of patients without a genetic cause identified [25]. We exploited IMPatienT to create a vocabulary of standard muscle-histology terms that were then used to process patient histological records and annotate biopsy images. Finally, multiple exploratory visualizations were automatically generated.
MATERIALS AND METHODS
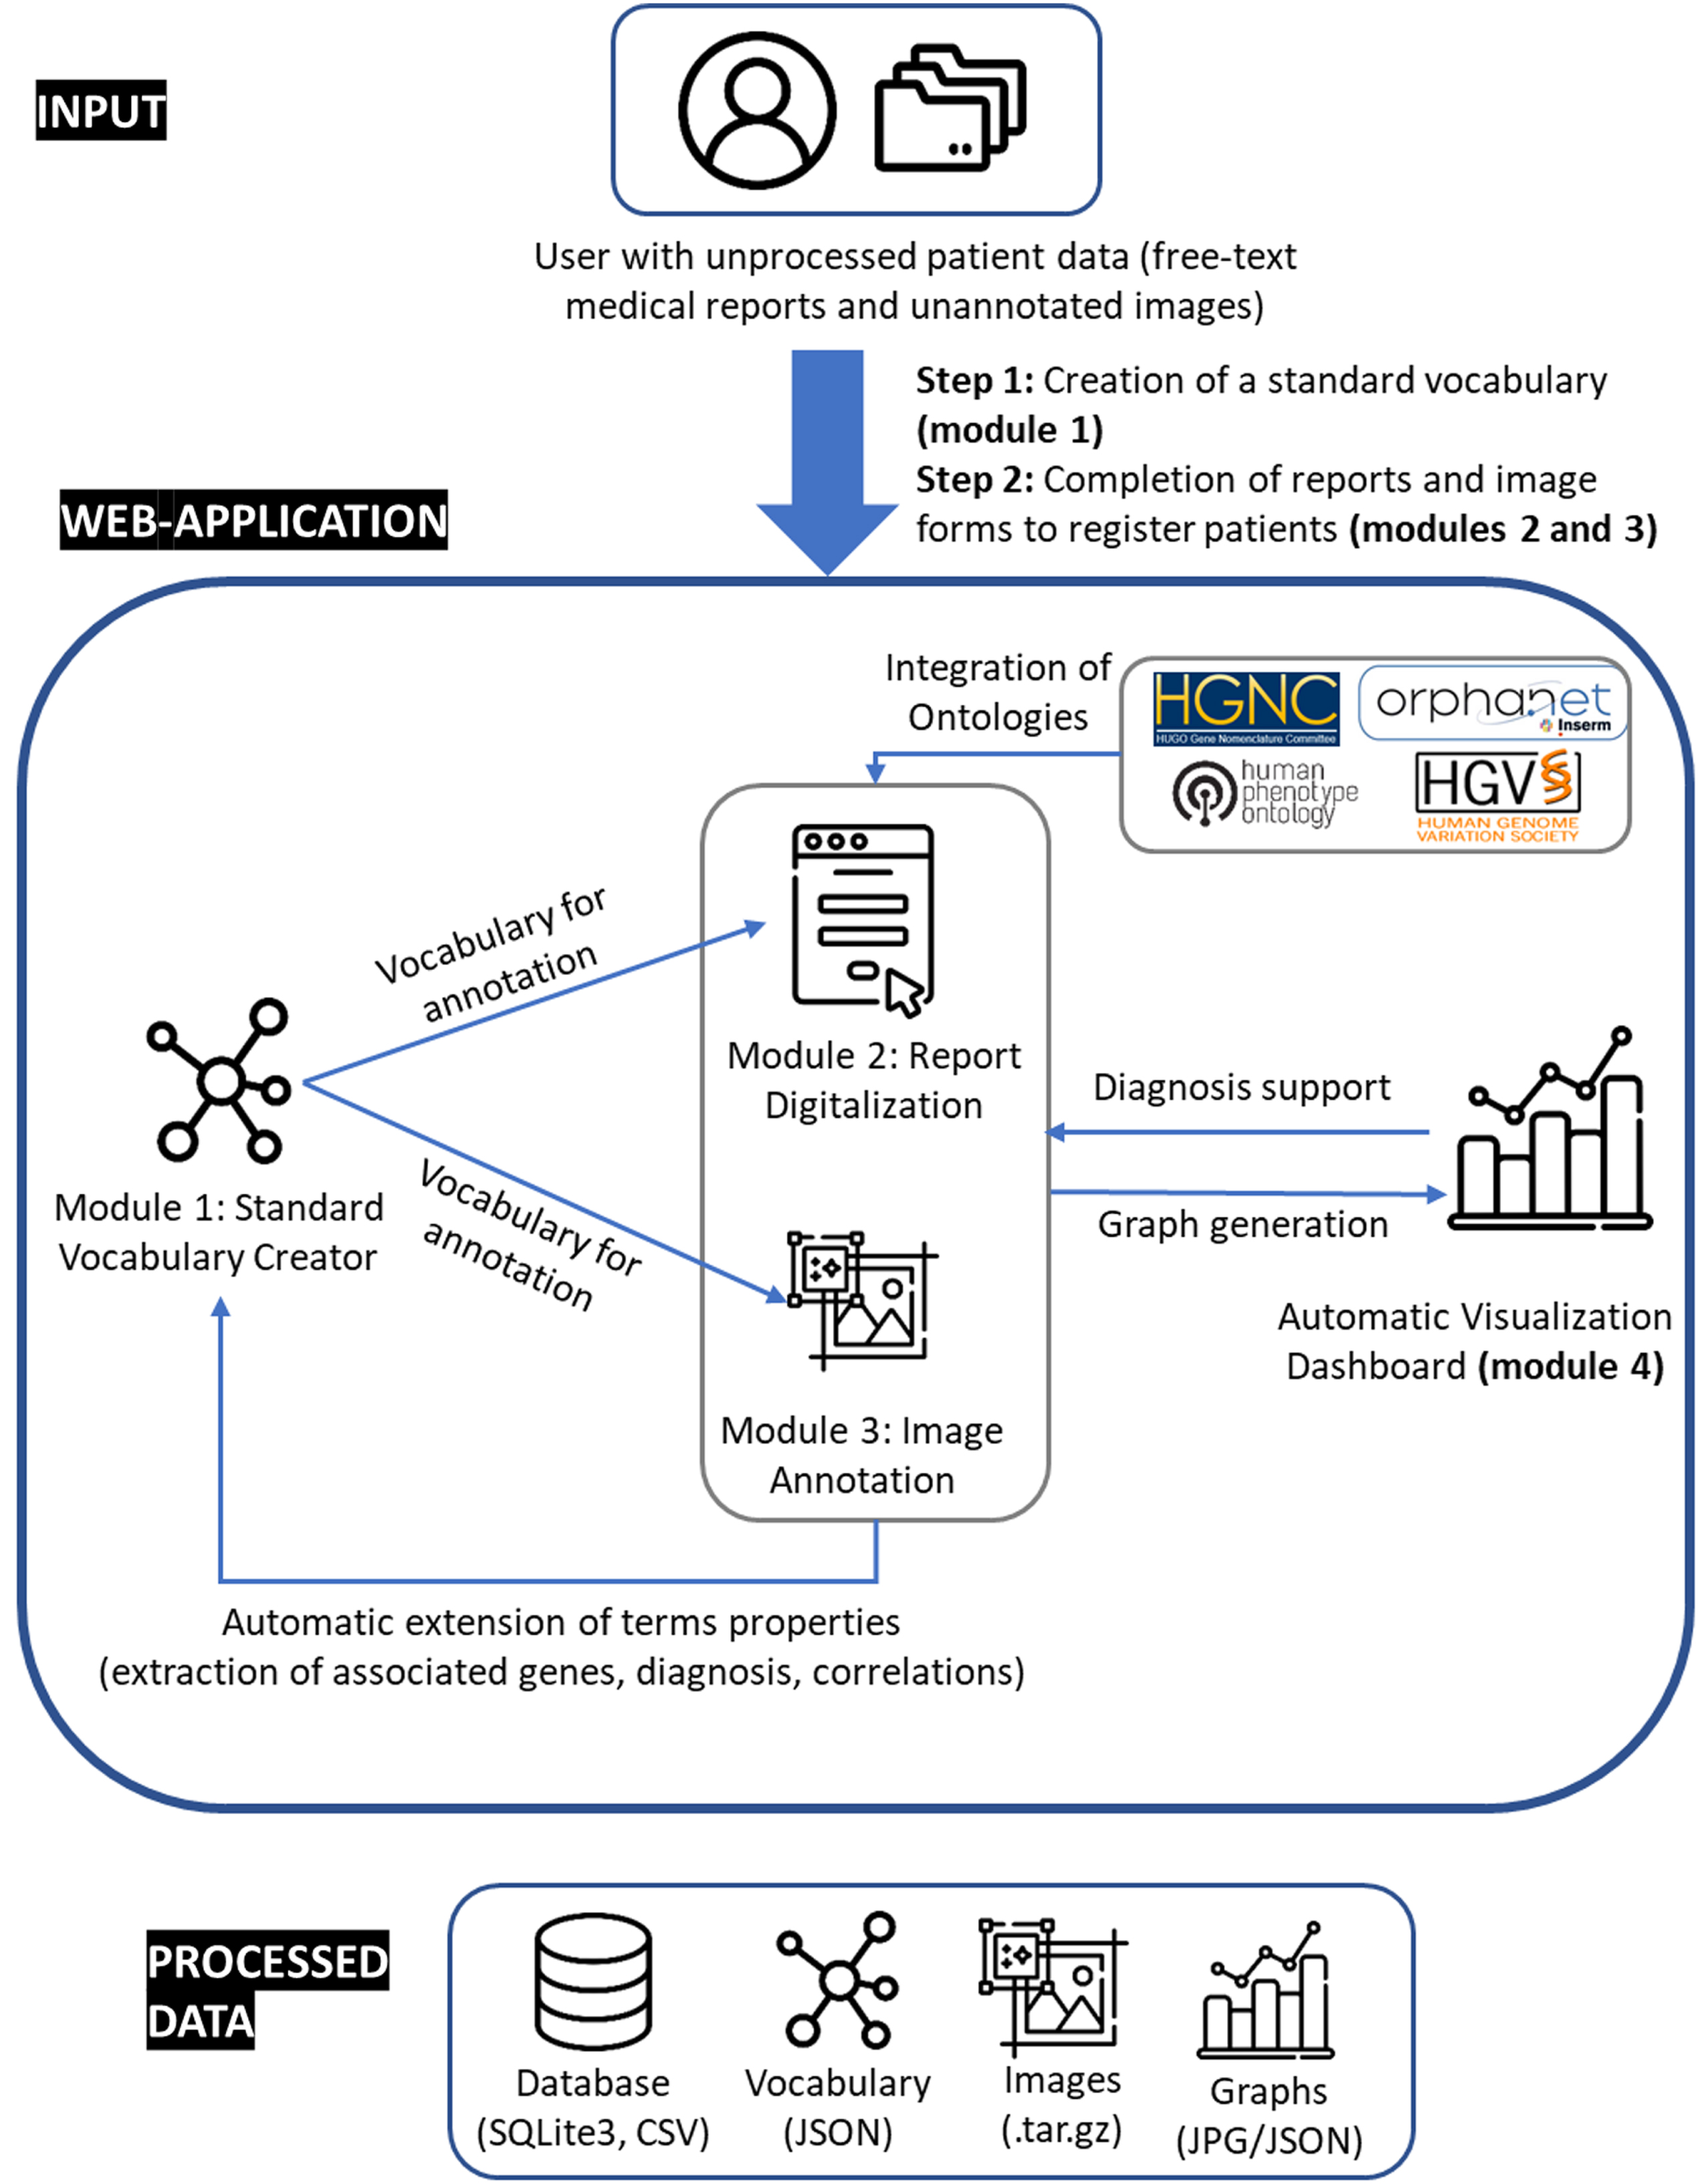
IMPatienT is a web application developed with the Flask micro-framework, which is a Python-based web framework. Figure 1 illustrates the global organization of the web application, currently composed of four modules: (i) Standard Vocabulary Creator, (ii) Report Digitization, (iii) Image Annotation, and (iv) Automatic Visualization Dashboard. All modules incorporate free, open-source and well-maintained libraries that are described in detail in the corresponding sections.
Fig. 1
Organization of IMPatienT web application.
Module 1: standard vocabulary creator
The standard vocabulary creator module allows to create and modify a hierarchical list of vocabulary terms with rich definitions that can be used as image annotation classes, for processing of text reports, or diagnosis decision support. Alternatively, users can also import existing vocabularies in OBO format instead. The standard vocabulary creator is an essential module as it interacts with all subsequent modules. This module also has export function to download the current standard vocabulary created in IMPatienT in JSON and OBO format (Open Biological and Biomedical Ontologies file format).
Figure 2 shows a screenshot of the page used to create/import, manage and export the standard vocabulary tree. The tree is generated and rendered with the JavaScript library JSTree (version 3.3.12). Each node in the tree represents a vocabulary term, and each term can have only one parent. The ergonomic drag and drop system use the graphical user interface (GUI) and allows the user to intuitively and quickly edit and reorganize the vocabulary by adding new terms or modifying existing ones. For each created node (vocabulary term), the user can assign a name and organize the tree structure (hierarchy).
Fig. 2
Screenshot of the Standard Vocabulary Creator module (module 1). (a) The hierarchical structure viewer and editor tool that supports drag and drop modification and creation/deletion/modification using the mouse. (b) The properties of the selected term node with its unique identifier (ID), name, alternative language translation, synonyms, description, associated genes and diseases and correlated terms extracted from the application instance database.
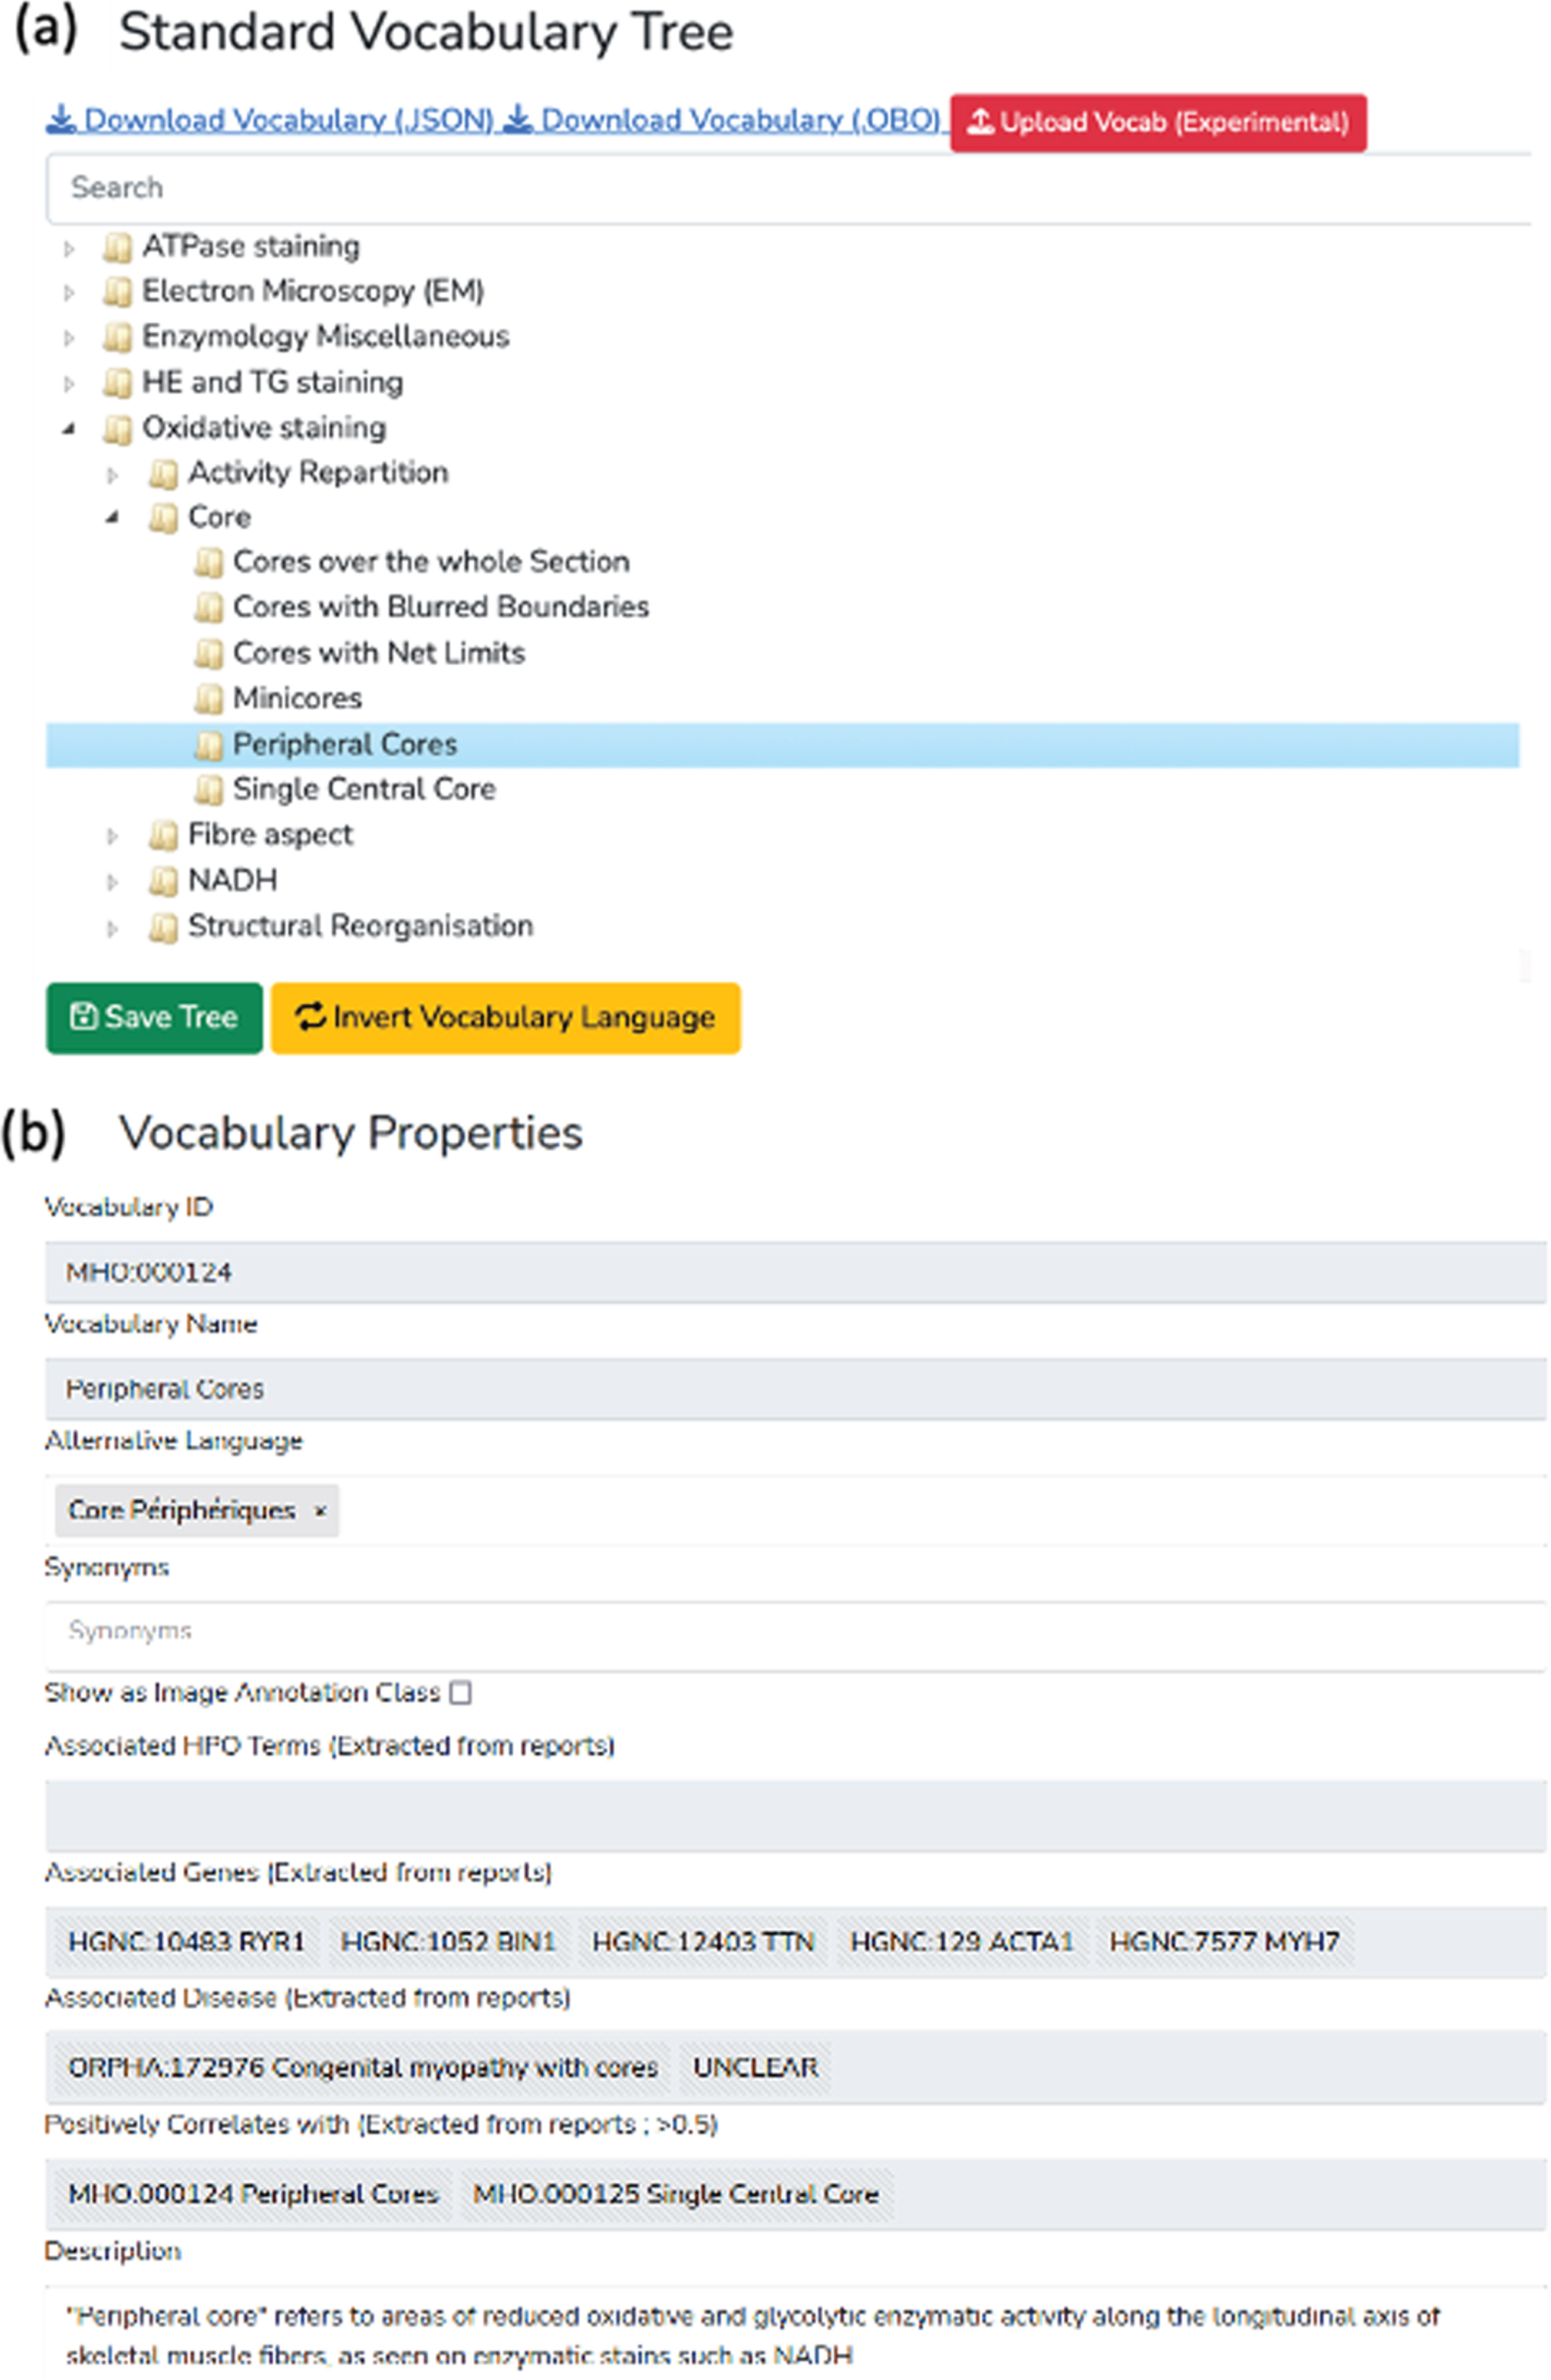
Each term in the tree is associated with nine optional properties, available via the vocabulary term (node) detailed form. Four properties are defined by the user: description, list of synonyms, translation in another language, and use as annotation class. Two properties are automatically generated: the unique identifier (ID) and the hexadecimal color associated with the term (for image annotation). Additional term properties, including associated diagnosis/disease class, associated genes, and the list of positively correlated terms (i.e. co-occurring terms in reports), are extracted from patient records registered in the database.
Finally, if the user defines an alternative translation for terms, there is an “invert vocabulary language” button to conveniently switch between languages. For instance, the user can create a vocabulary in any language and define the translation in English, then switch between the two display modes easily.
Module 2: report digitization
The standard vocabulary terms are used to process documents that are in a free-text format. Module 2 uses a semi-automatic approach for digitization and processing of free-text reports that combines fast automatic detection of terms with manual reviewing of the detection. The interface of Module 2 is a form divided into four parts (Fig. 3).
Fig. 3
Screenshot of the interface for the report digitalization module. (a) PDF upload section for automatic keyword detection in the text. Detected keywords have a green background, detected and negated keywords have a red background. (b) Patient information section (age, document ID, gene, mutation, phenotype). (c) Standard vocabulary tree viewer to select keywords with associated slider to manually indicate keyword value (absence or presence level). Keywords marked as present are indicated with a green check mark, absent keywords are marked with a red cross. (d) Overview section of all annotated terms, diagnosis selection and commentaries with automatic diagnosis support using the BOQA algorithm.
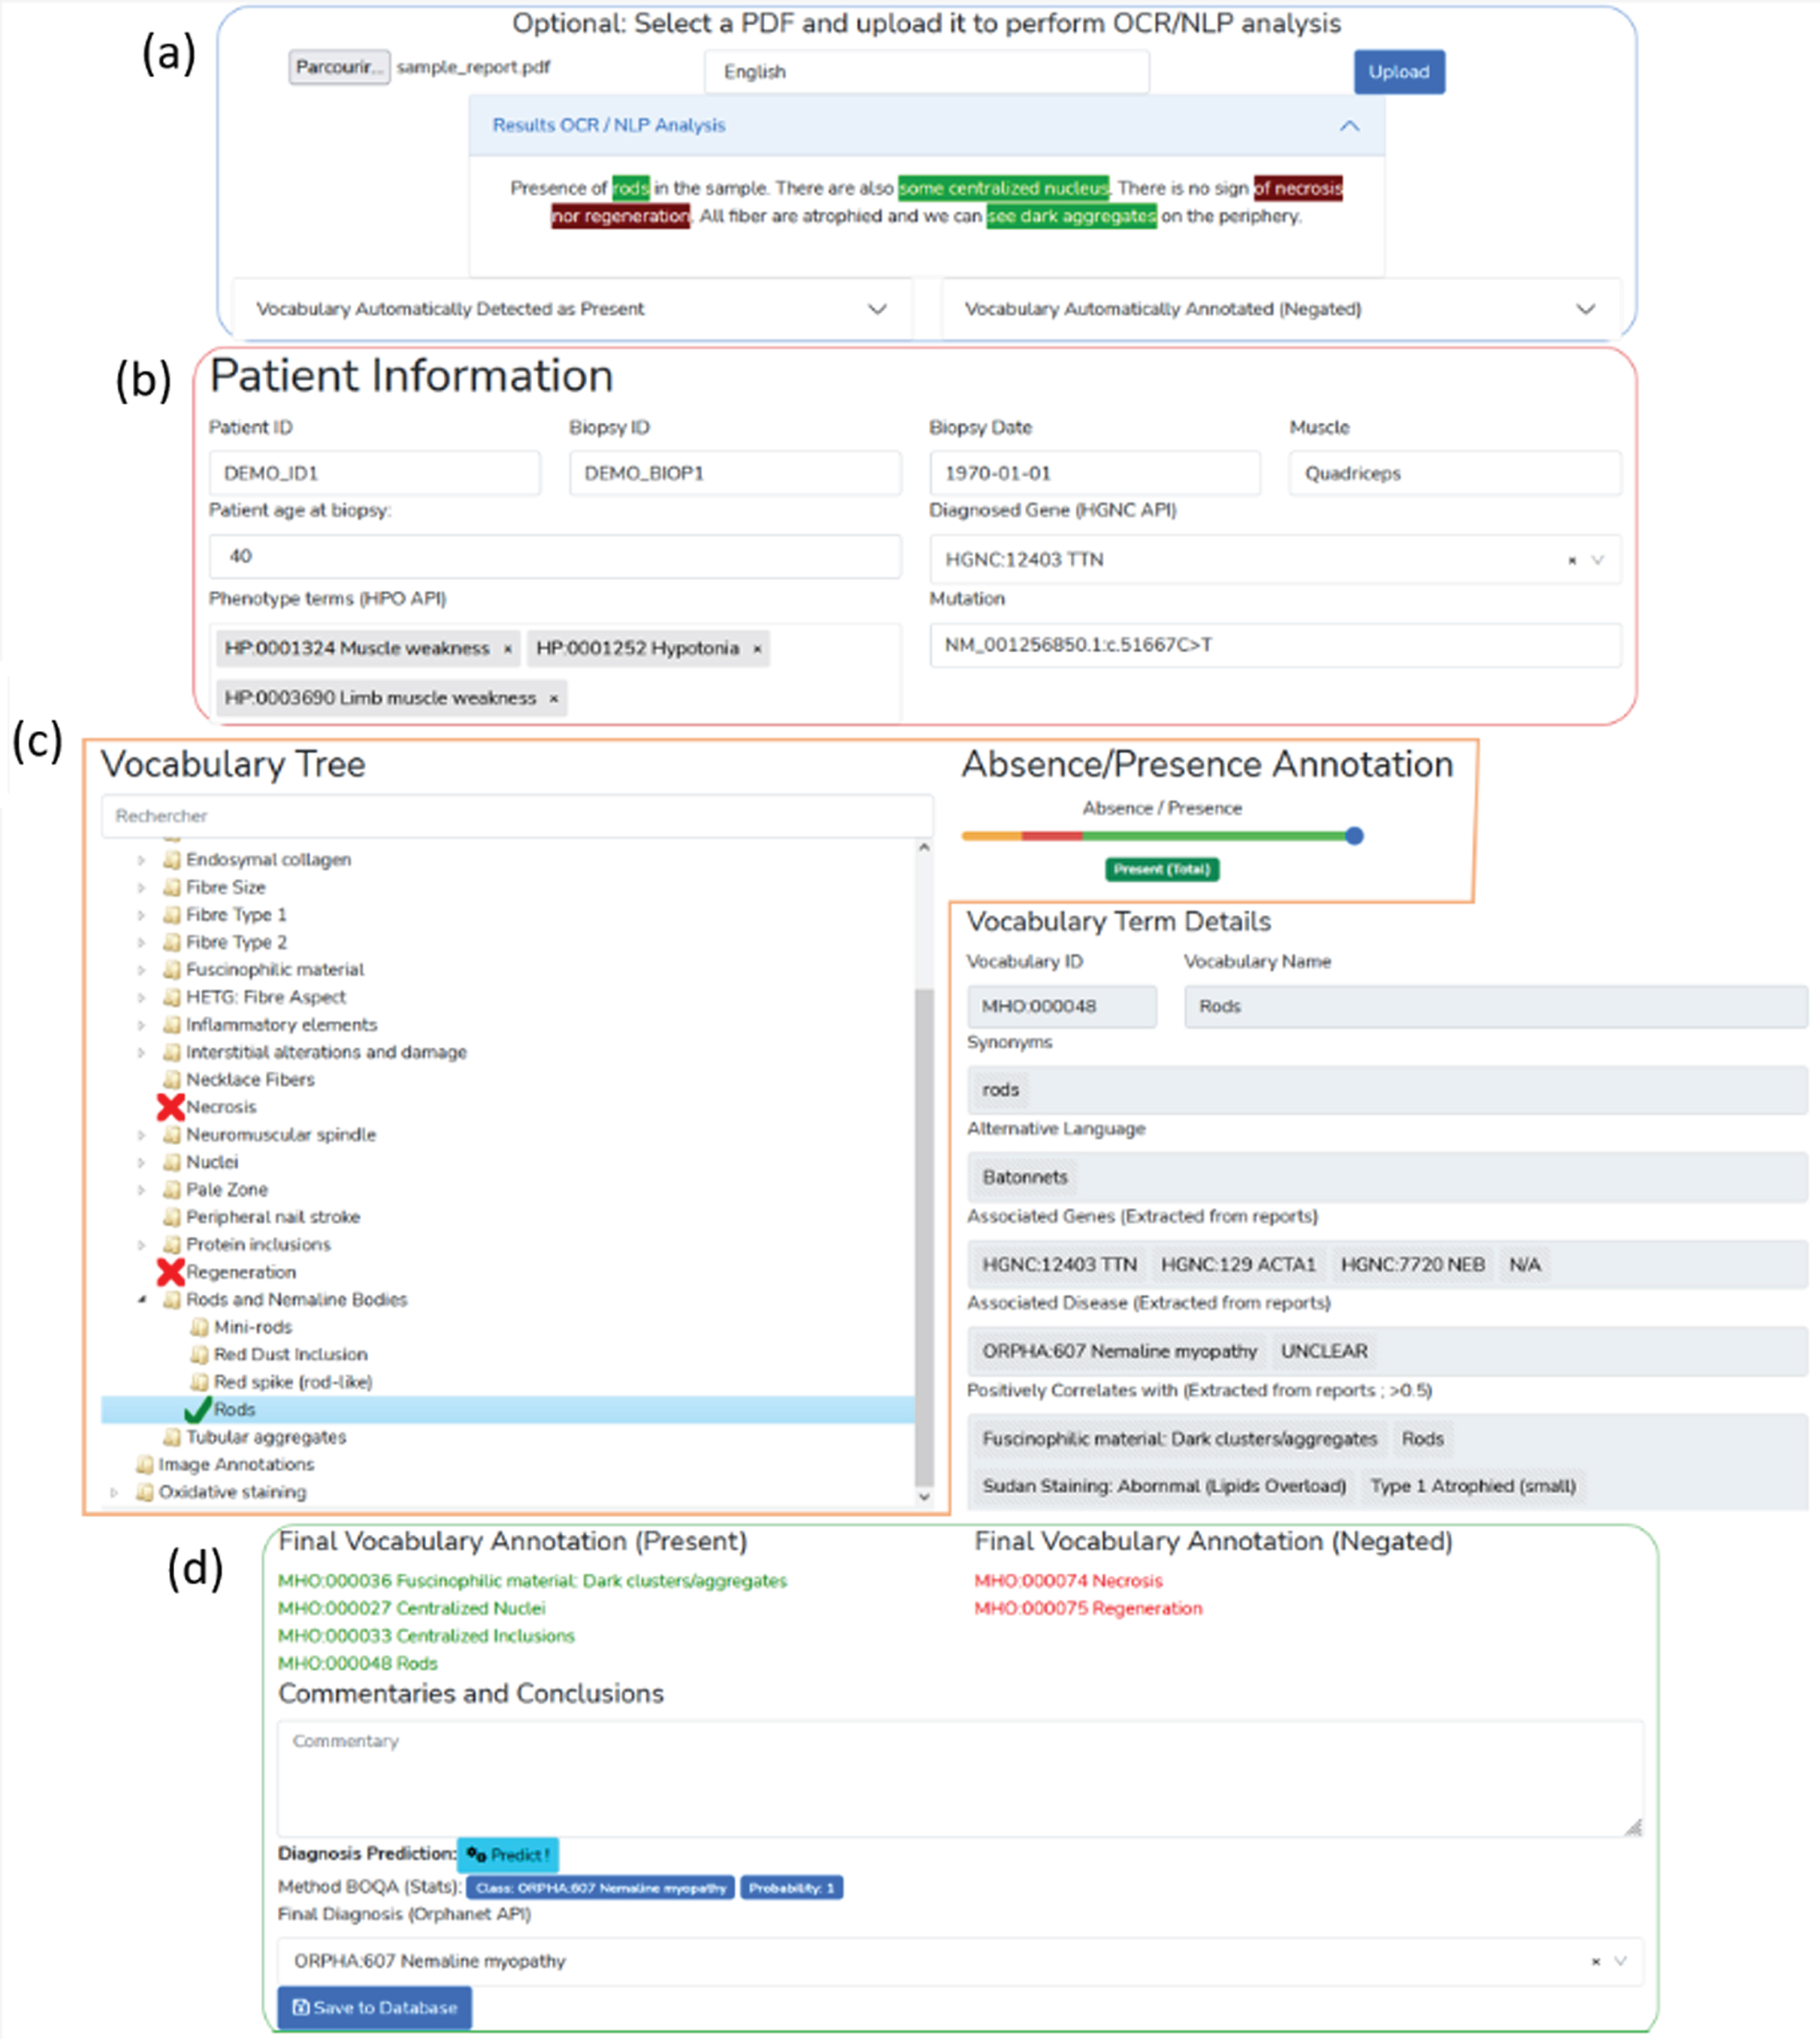
In the first part of the digitization form (Fig. 3a), a PDF file of the free-text report can be uploaded for natural language processing (NLP) of the content. The text of the PDF report is automatically extracted and processed with NLP. The NLP method is only used to detect histological terms defined in the standard vocabulary. Detected standard vocabulary terms are highlighted (see corresponding section below “Optical Character Recognition and Vocabulary Term Detection”). Highlighted terms allow to easily identify which standard vocabulary terms were detected as present in positive or in negative form. This is useful for quantitative performance assessment.
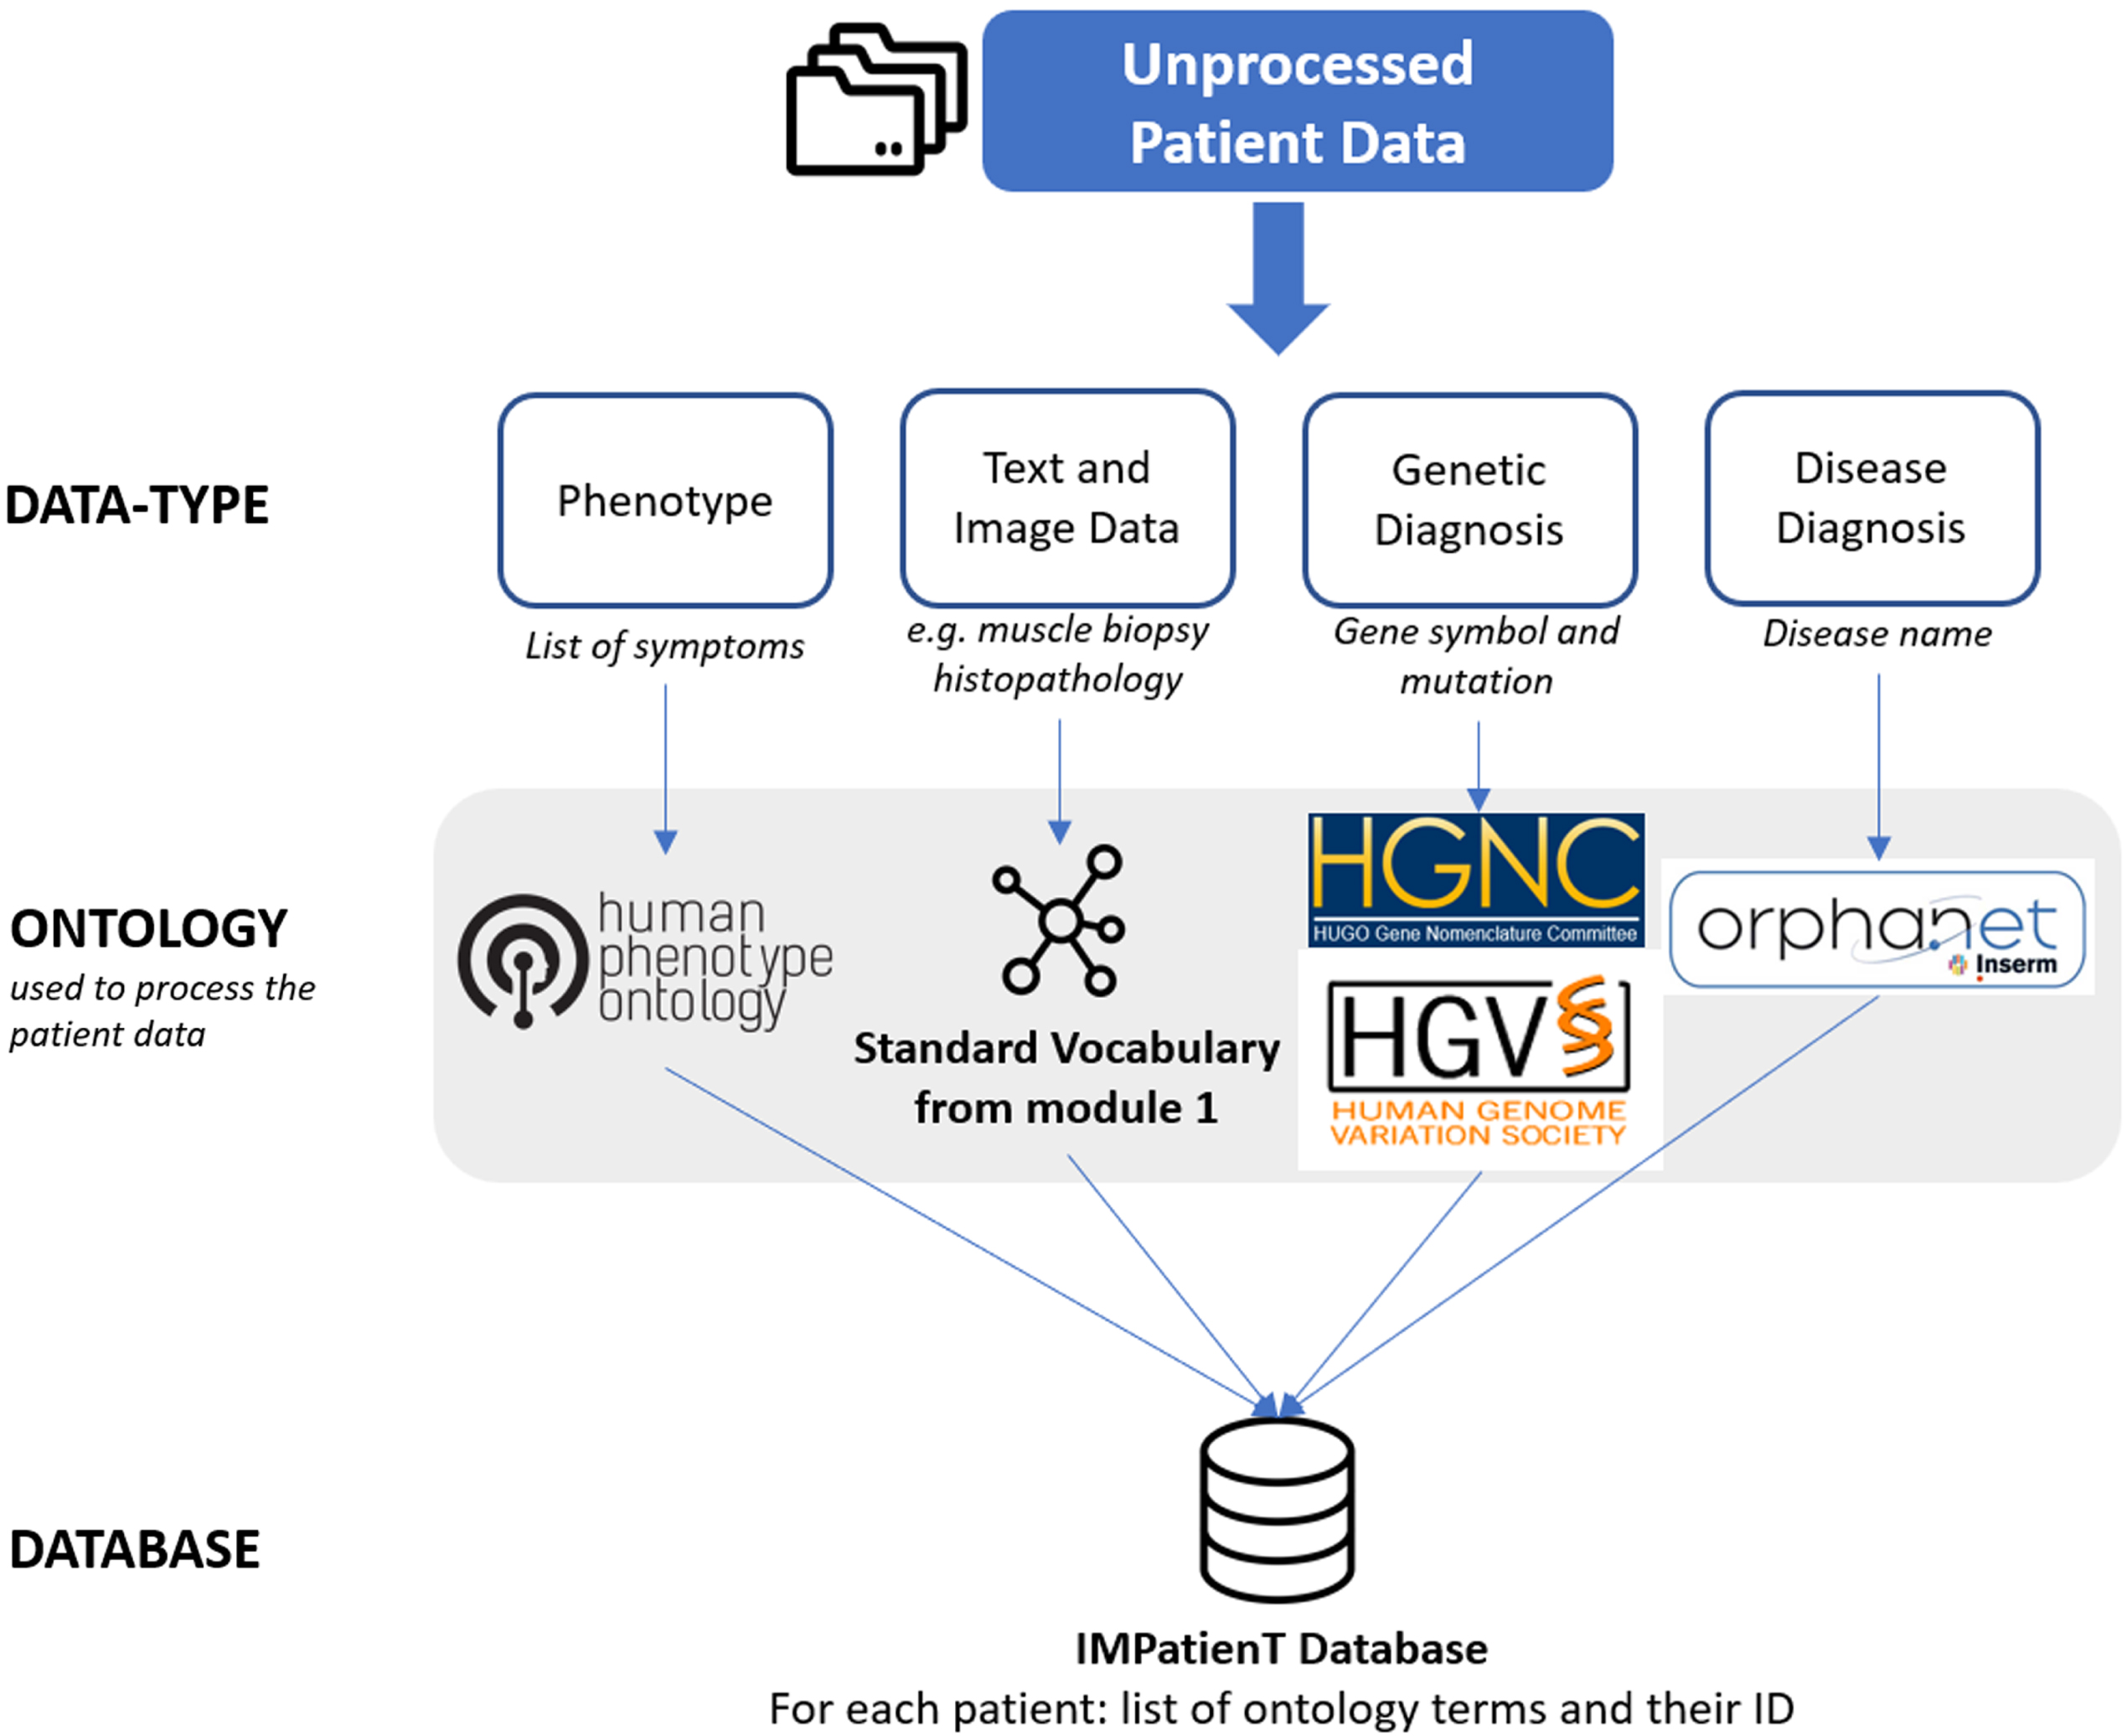
The second part (Fig. 3b) of the digitization form contains patient information, such as patient ID, document ID, patient age. This section also allows the user to input patient information that is not defined by the standard vocabulary and thus, not processed in the NLP section. For example, IMPatienT exploits well-established ontologies to normalize the genetic diagnosis and phenotypes (Fig. 4). For example, in the gene field, when the user inputs a character string, gene symbols are retrieved from the HUGO Gene Nomenclature Committee (HGNC) and suggested [26]. Mutation notations are formatted according to the Human Genome Variation Society (HGVS) sequence variant nomenclature [27]. Phenotypes are retrieved and suggested using the HPO. These fields do not contain patient-identifying data and are optional.
Fig. 4
Overview of the ontologies used by IMPatienT to process patient data in the report digitization module (module 2).
The third part of the digitization form (Fig. 3c) contains the standard vocabulary tree viewer with an absence/presence slider. This section allows the user to correct the automatic detection of the NLP method or to add new observations. Each vocabulary term can be marked as present, absent or no information. For terms marked as present, the slider is used to indicate a notion of quantity or certainty of the term. For example, the statement “There are a small number of fibers containing rods” can be annotated by hand by setting the vocabulary “Rods” to the value “Present” with a low quantity value. For terms that have been automatically detected, this slider value is automatically set to 0 (present in a negated sentence) or 1 (present).
The fourth part (Fig. 3d) of the form allows the user to input comments and a final diagnosis for the patient. Disease names are extracted and suggested from the Orphanet [28] knowledge base. It also includes an automatic disease suggestion based on already registered patients and the BOQA algorithm [17] (see the corresponding section below “Method for Patient Disease Suggestions”).
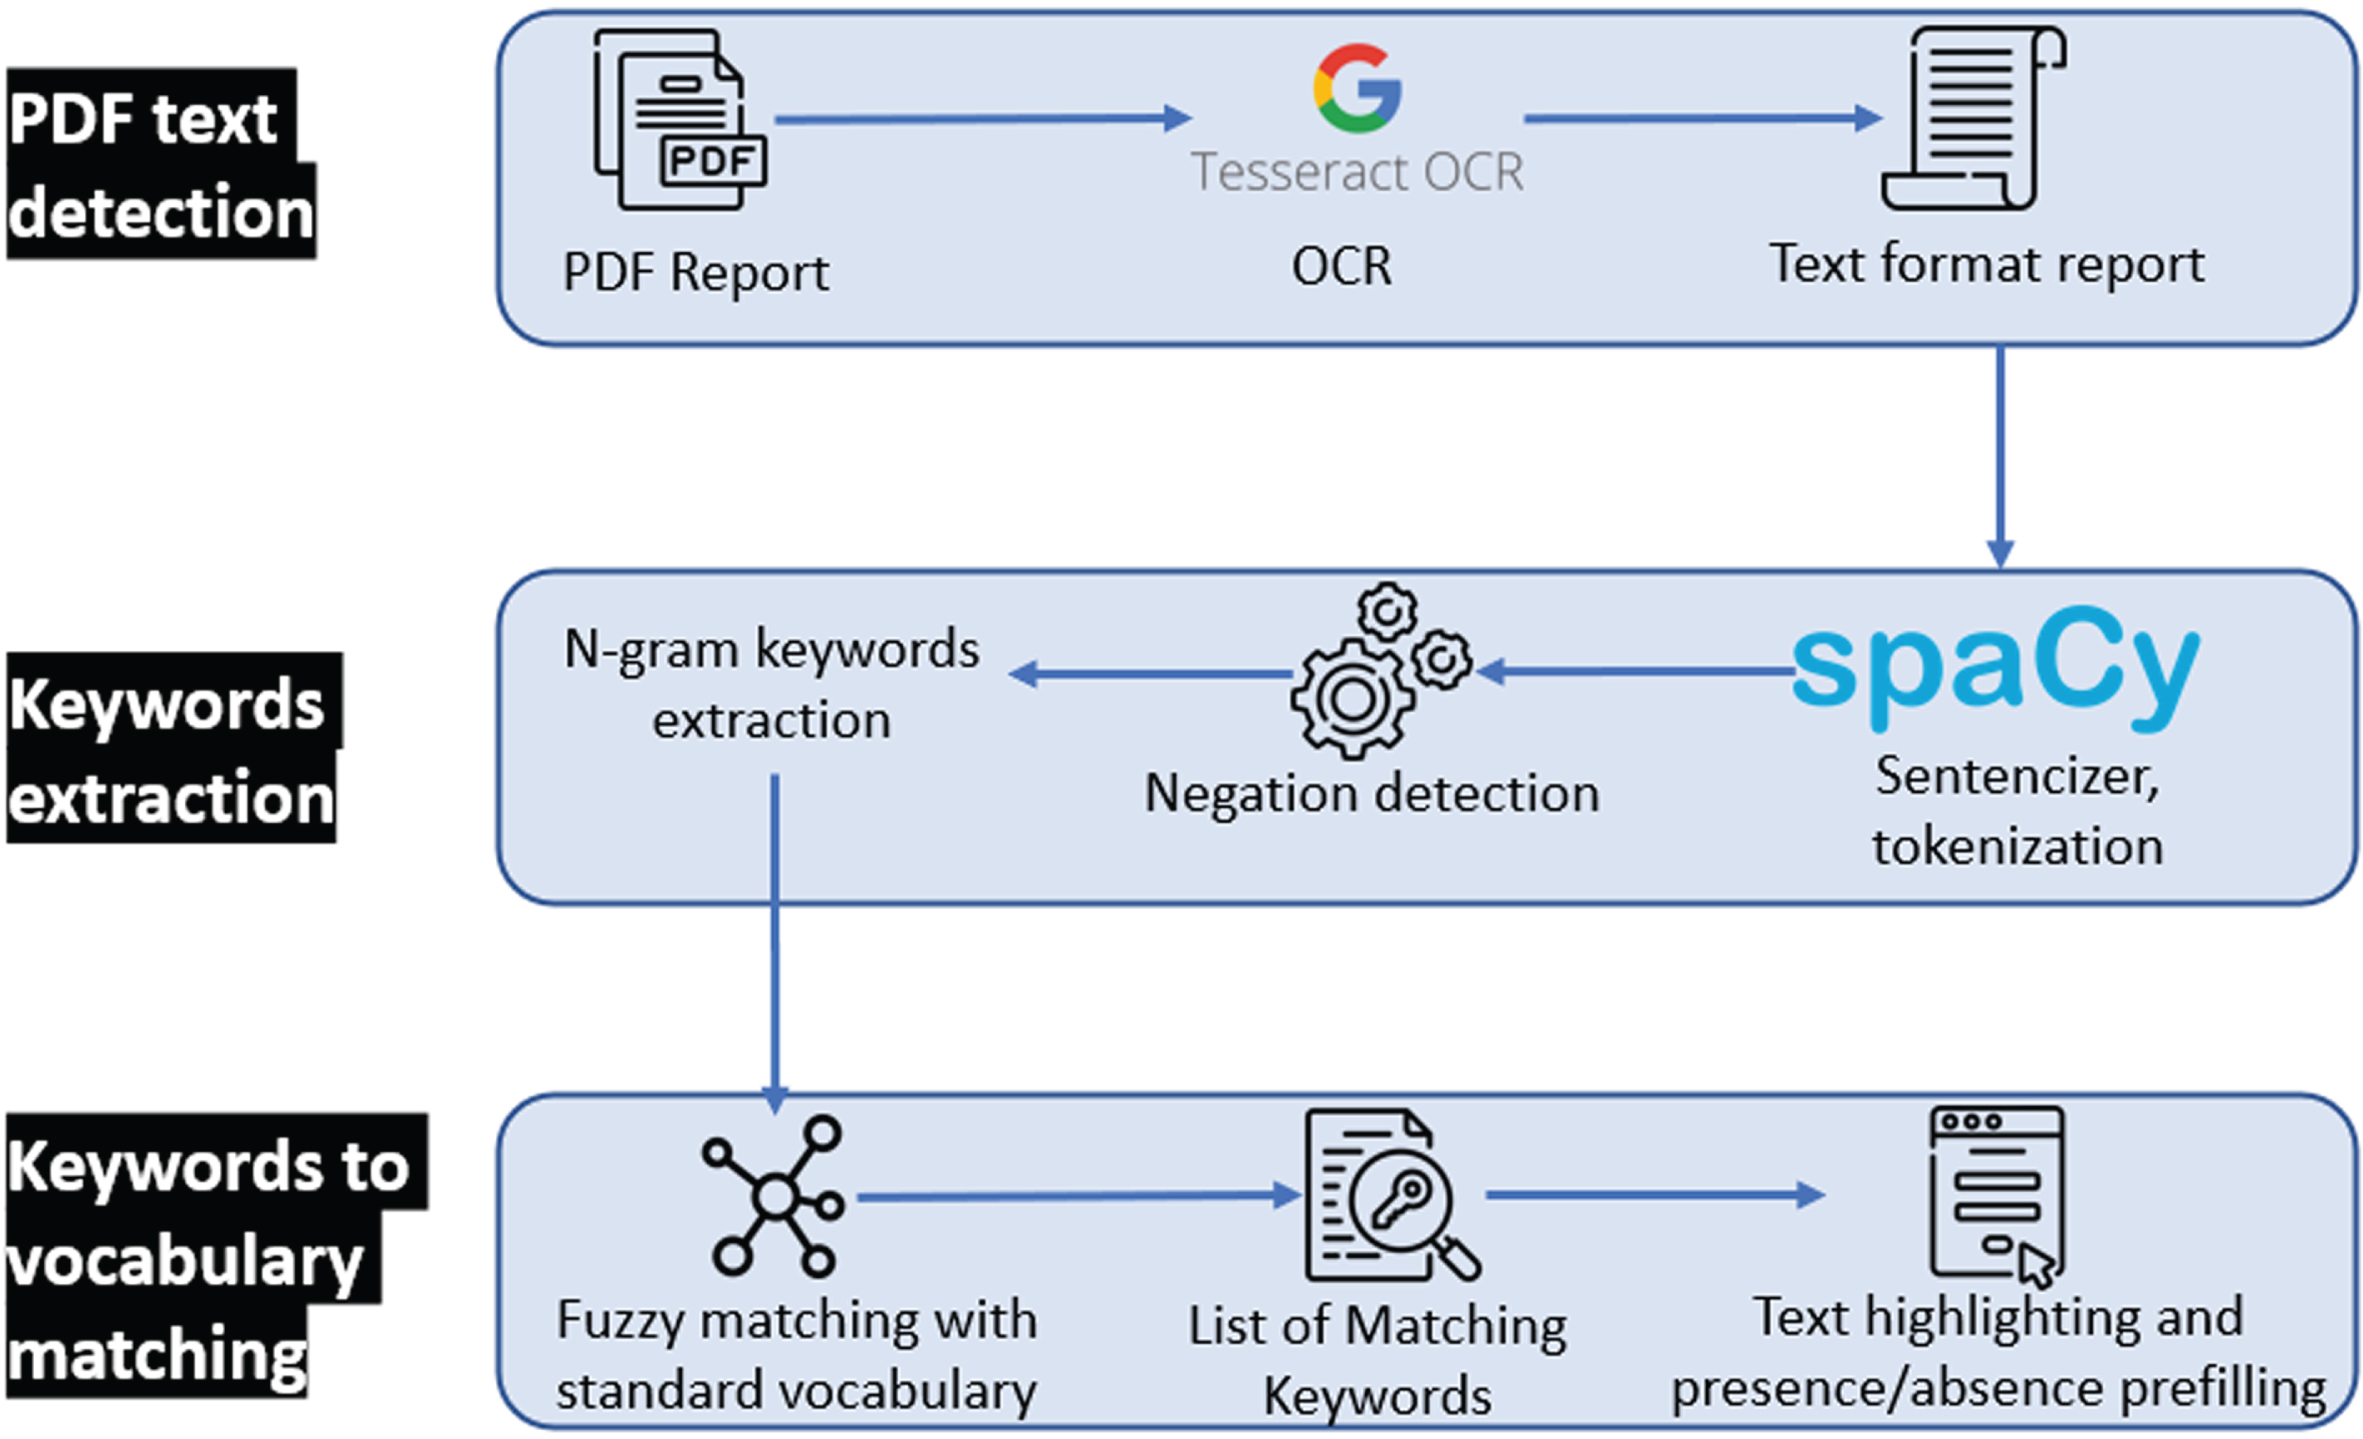
Optical character recognition and vocabulary term detection
The patient report digitization in module 2 is facilitated by an automatic text recognition and keyword detection method. The user uploads a PDF version of the text reports to perform Optical Character Recognition (OCR), followed by Natural Language Processing (NLP) to automatically detect terms from the standard vocabulary in the report. The NLP method only matches the raw text to the standard vocabulary defined in Standard Vocabulary Module 1. Figure 5 shows the workflow of the vocabulary terms detection method. First, the PDF file is converted to plain text using the Tesseract OCR (implemented in python as pyTesseract). Then, the text is processed with Spacy, an NLP python library, by splitting the text into sentences and then into individual words. The resulting list of sentences is processed to detect negation using a simple implementation of the concept of NegEx [29]. An n-gram (monograms, digrams, and trigrams) procedure is applied to the list of words to identify contiguous words in the context of all the sentences of the report. The n-grams are then mapped against the user-created standard vocabulary using fuzzy partial matching (based on Levenshtein distance) with a score threshold of 0.8. Matched keywords are kept and shown on the interface by green or red highlighting of the detected text using the Mark.JS JavaScript library (green indicates the presence of the keyword, red indicates the presence in a negated sentence). Keywords are also automatically marked as present or absent (negated) in the vocabulary tree.
Fig. 5
Optical character recognition and vocabulary term detection method used in the report digitization module (module 2) to automatically analyze free-text reports.
Disease suggestions
The report digitization module 2 contains an implementation of the BOQA algorithm described by Bauer et al. [17], for disease recommendation. Basically, the implemented BOQA algorithm computes the similarity between a list of input vocabulary terms annotated as “present” for a patient (the query) and a simulated patient profile for each disease class (model report) that is generated based on the data from already registered patients.
We implemented the BOQA algorithm in python and modified it to use the frequencies of vocabulary terms per disease for the generation of the model report instead of the initial deterministic way (not frequency aware). This means that the model report is generated based on the probability (frequency) of each vocabulary term. For example, if disease A is annotated with vocabulary term B at a frequency = 0.9 and vocabulary term C at a frequency = 0.1, the generated model report for disease A will have a probability = 0.9 of containing vocabulary term B and a probability = 0.1 of containing vocabulary term C.
Due to the stochastic nature of the generation of the model report, for any given prediction, the generation and computation of the similarity with the query is repeated 50 times. For each repetition, if a disease has a prediction probability > 0.5, it is considered to be the best prediction, otherwise the prediction is “no prediction”. Finally, of the 50 repetitions, the prediction with the highest occurrence is taken as the final prediction.
Module 3: AI-assisted image annotation using automatic segmentation
To process patient image data, we developed the image annotation module (module 3) to upload, annotate and perform image segmentation with standard vocabulary terms. This module is based on the “interactive image segmentation with Dash and Scikit-image” demonstration application [30–32]. The original source code was modified to be compatible with the standard vocabulary tree and the database.
The interactive interface to annotate image features with standard vocabulary terms is presented in Figs. 6a and 6b. The interface allows the user to draw a free-shape area (annotation) associated with a standard vocabulary term (class). Then, with a minimal number of user annotations, the whole image is segmented based on the annotations (shapes) provided by the user.
Fig. 6
Screenshot of the image annotation module. (a) Image viewer used to navigate, zoom and annotate the histology image. (b) Menu interface to select the annotation label, brush width and segmentation parameters.
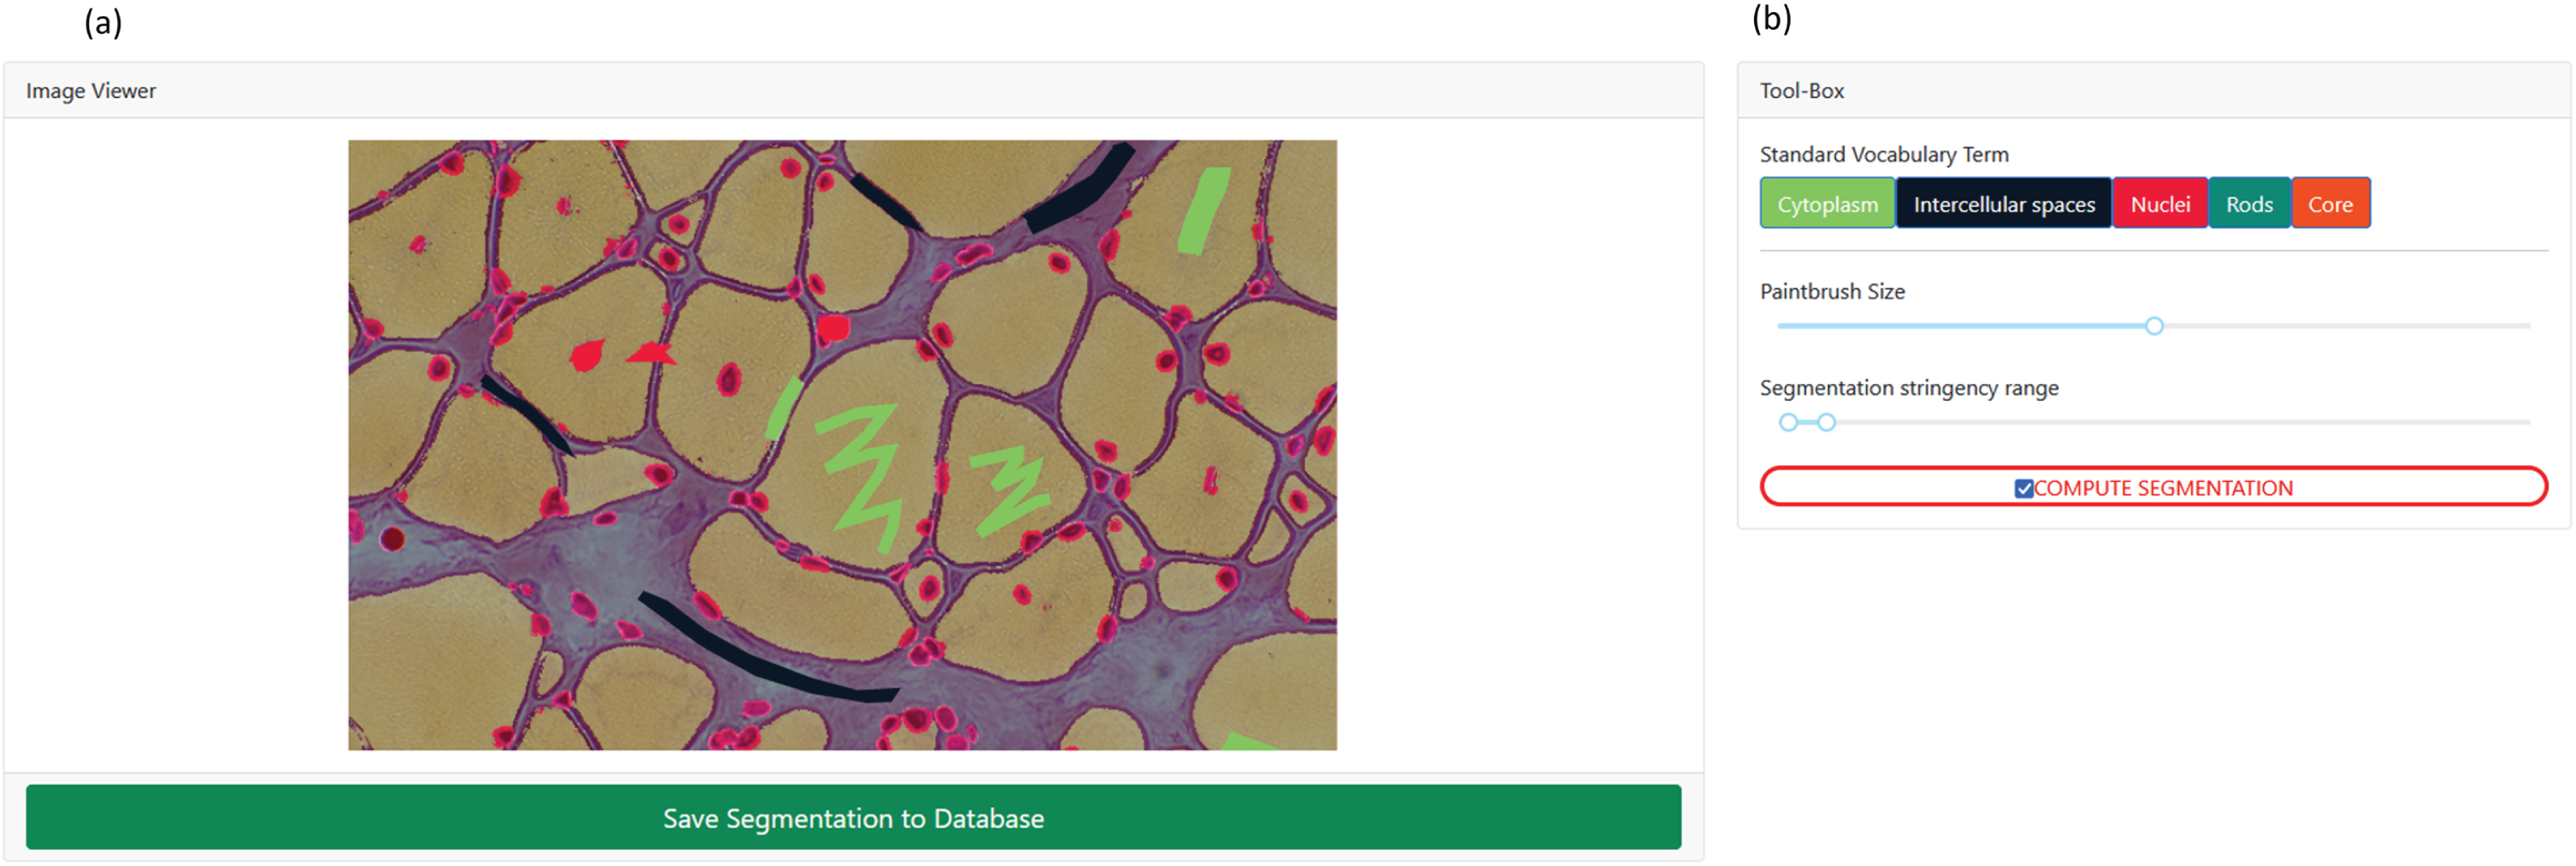
To perform image segmentation, on the server side, local features (intensity, edges, texture) are extracted from the labeled areas of the image and are used to train a dedicated AI random-forest classifier model. This dedicated model is then applied to predict similar areas in the whole image. Finally, every pixel of the image is labeled with a standard vocabulary term corresponding to the AI prediction based on the annotations.
The segmentation is entirely interactive. After the initial segmentation, the user can correct the classification by adding more annotation shapes to the image and can modify the paintbrush width setting to make more precise annotation marks. In addition, the stringency range parameter of the model can be adapted using the slider to modify the model behavior and automatically recompute the segmentation in real time.
Results of the segmentation are retrievable as a single archive including the raw image, the annotations (JSON format), the random-forest trained classifier, the blended image and the segmentation mask image.
Module 4: Automatic visualization dashboard
The automatic visualization dashboard module is designed to perform exploratory data analysis by generating multiple graphs based on the patient data in the database. All visualizations are created using Plotly, a python graph library, that allows the creation of interactive graphs.
Interaction between the modules
IMPatienT is divided into four modules that are interconnected. The standard vocabulary module provides the vocabulary used for the image annotation module and for the NLP method used for the (histologic) standard vocabulary term detection in the report digitization module. Any modification in the vocabulary is automatically propagated to these modules, updating the form templates and triggering the recalculation of all visualizations with the latest vocabulary information. Any modification to the standard vocabulary also updates all patients in the database to the latest version of the vocabulary, meaning that term names and definitions will be updated, and deleted terms will be marked as outdated. Adding patient information in the database, whether they are text reports (module 2) or image data (module 3), will automatically update the visualization dashboard with the latest patient information in the database. The term frequency statistics calculated by the visualization dashboard and used by the disease suggestion algorithm are automatically updated as well, increasing live performances. The visualization dashboard is also directly linked to the standard vocabulary and during the generation of the visualizations, the rich definition of the standard terms is updated with newly associated genes, diagnosis and positively correlated terms.
Application security and personal data
IMPatienT is developed as a free and open-source project meaning that the code can be audited by anyone in the GitHub code repository (https://github.com/lambda-science/IMPatienT).
The code is regularly scanned for known issues and outdated libraries to mitigate security issues. There is no patient-identifying data kept in the database, only a custom identifier and age. The synthetic dataset generated and analyzed during the current study is also available in the same repository. No name or date of birth is required or stored. Additionally, access to all modules and data entered via the web application is restricted by a login-page and user accounts can only be created by the administrator of the platform. No user information is stored except for the username, email and salted and hashed passwords.
RESULTS
IMPatienT is an interactive and user-friendly web application that integrates a semi-automatic approach for text and image data digitization, processing, and exploration. Due to its modular architecture and its standard vocabulary creator, it has a wide range of potential uses.
IMPatienT main functionalities
Table 1 shows the main functionalities of IMPatienT compared to other similar tools used in the community. IMPatienT aims to be a one-stop platform that integrates tools for an end-to-end analysis workflow of multi-modal patient’s data. Out of 18 selected features, IMPatienT integrates 14 of them versus a mean of 4.4 for other software with the best ones being SAMS and PhenoStore integrating 6 features each. Nevertheless, software such as SAMS, PhenoStore, Phenotips and Cytomine each integrate features that are not yet present in IMPatienT.
Table 1
Functionalities of IMPatienT compared to common state-of-the-art tools
| Group | Functionalities | IMPatienT | Phenotips | PhenoStore | SAMS | Protégé | Doc2HPO | Cytomine | Ilastik | INTEGRO |
| General Application | Web application | X | X | X | X | X | X | |||
| Characteristics | Patient database | X | X | X | X | |||||
| Free to use | X | X | X | X | X | X | X | X | ||
| Open source | X | X | X | X | X | |||||
| Support multimodal data | X | X | ||||||||
| Support for patient pedigree data | X | X | X | |||||||
| Standard Vocabulary | Vocabulary Builder | X | X | X | ||||||
| Advanced vocabulary terms definition | X | X | X | |||||||
| Full-featured ontology builder | X | X | ||||||||
| Report digitization | Integrates reference ontologies (HPO,Orphanet) | X | X | X | X | X | ||||
| Form for patient medical report digitization | X | X | X | |||||||
| Text recognition with OCR | X | |||||||||
| Text processing with NLP | X | X | ||||||||
| Export data to Phenopacket format | X | X | X | |||||||
| Image annotation | Image annotation and segmentation with AI | X | X | X | ||||||
| Support for DICOM and whole slide images | X | X | ||||||||
| Patient data | Automatic visualization dashboard | X | X | |||||||
| exploitation | Diagnosis prediction system | X | X | |||||||
| Data mining of information for specificdiagnosis | X | X |
IMPatienT implements novel functionalities to process and exploit patient data. For example, IMPatienT is compatible with any research domain thanks to its standard vocabulary builder. Also, with the OCR/NLP method, IMPatienT can process histologic text reports, allowing the user to exploit scanned documents. Finally, IMPatienT provides useful tools to exploit patient data with the various visualizations, the term, frequency table, correlation matrix and the automatic enrichment of the vocabulary term definitions (associated genes and diseases).
IMPatienT usage
Figure 1 shows how the user can interact with the web application to digitize, process, and explore patient data. In IMPatienT, modules can be used independently, allowing users to only use the tools they need. For example, a user might only have text report data, in this case they would be able to use the standard vocabulary creator, the report digitization tools and the visualization dashboard to process and explore their data. In another scenario, a user could only be interested in annotating an image dataset using a shared standard vocabulary that can be modified and updated collaboratively. In this use case, they would be able to only use the standard vocabulary creator and the image annotation module. However, the main strength of IMPatienT lies in the multimodal approach it provides and the strong interactions between modules.
For the complete multimodal approach, the first step is to create a standard vocabulary using the Standard Vocabulary Creator interface (module 1). The user only needs to create a few terms (nodes) to begin using the web application. Defining the properties of the terms (definition, synonyms, etc.) is optional, and organizing them in a hierarchical structure is also optional.
In the second step, the user can start digitizing patient reports using module 2. This can be done either manually by filling out the form in module 2 and checking terms as present or absent in a given report, or automatically using the Vocabulary Term Matching method to process a PDF version of the report. Using module 3, the user can also upload, annotate, and segment image data.
Finally, the user can explore multiple visualizations (histograms, correlation matrix, confusion matrix, frequency tables) that are automatically generated in module 4. All data entered via the web application are retrievable in standard formats, including the whole database of reports as a single SQLite3 file or CSV files, the images and their segmentation models and masks as a GZIP archive, the standard vocabulary with annotation as a JSON file and various graphs and tables as JSON or PNG files.
Use case: congenital myopathy histology reports
As a use case of IMPatienT, we focused on congenital myopathies (CM). We used the standard vocabulary creator to create a sample muscle histology standard vocabulary based on common terms used in muscle biopsy reports from the Paris Institute of Myology. Then, we inserted 40 digitally generated patients in the database with random sampling of standard vocabulary terms and associated a gene and disease class from a list of common CM genes and three recurring CM subtypes (nemaline myopathy, core myopathy and centronuclear myopathy). All these data are available on the demo instance of IMPatienT (https://impatient.lbgi.fr/).
For text data, Supplementary Figure S1 shows the results of the automatic NLP method applied to an artificial muscle histology report. Twenty-two keywords were detected that match to the standard vocabulary and seven of them were detected in negated sentences (red highlight). Out of the twenty-two keywords, eighteen were correctly detected and one was detected in the wrong state of negation: “abnormal fiber differentiation” is highlighted as negated although it is present is a non-negated sentence part. Three keywords (fiber type, internalized nuclei, centralized nuclei) were detected as matching for multiple keywords from the vocabulary due to high similarity. For example, the keywords “internalized nuclei” and “centralized nuclei” have a similarity score of 86 using the Levenstein distance. Two keywords defined in the standard vocabulary were missed and not highlighted: “biopsy looks abnormal” (“abnormal biopsy” in the vocabulary) and “purplish shade” (“purplish aspect“ in the vocabulary).
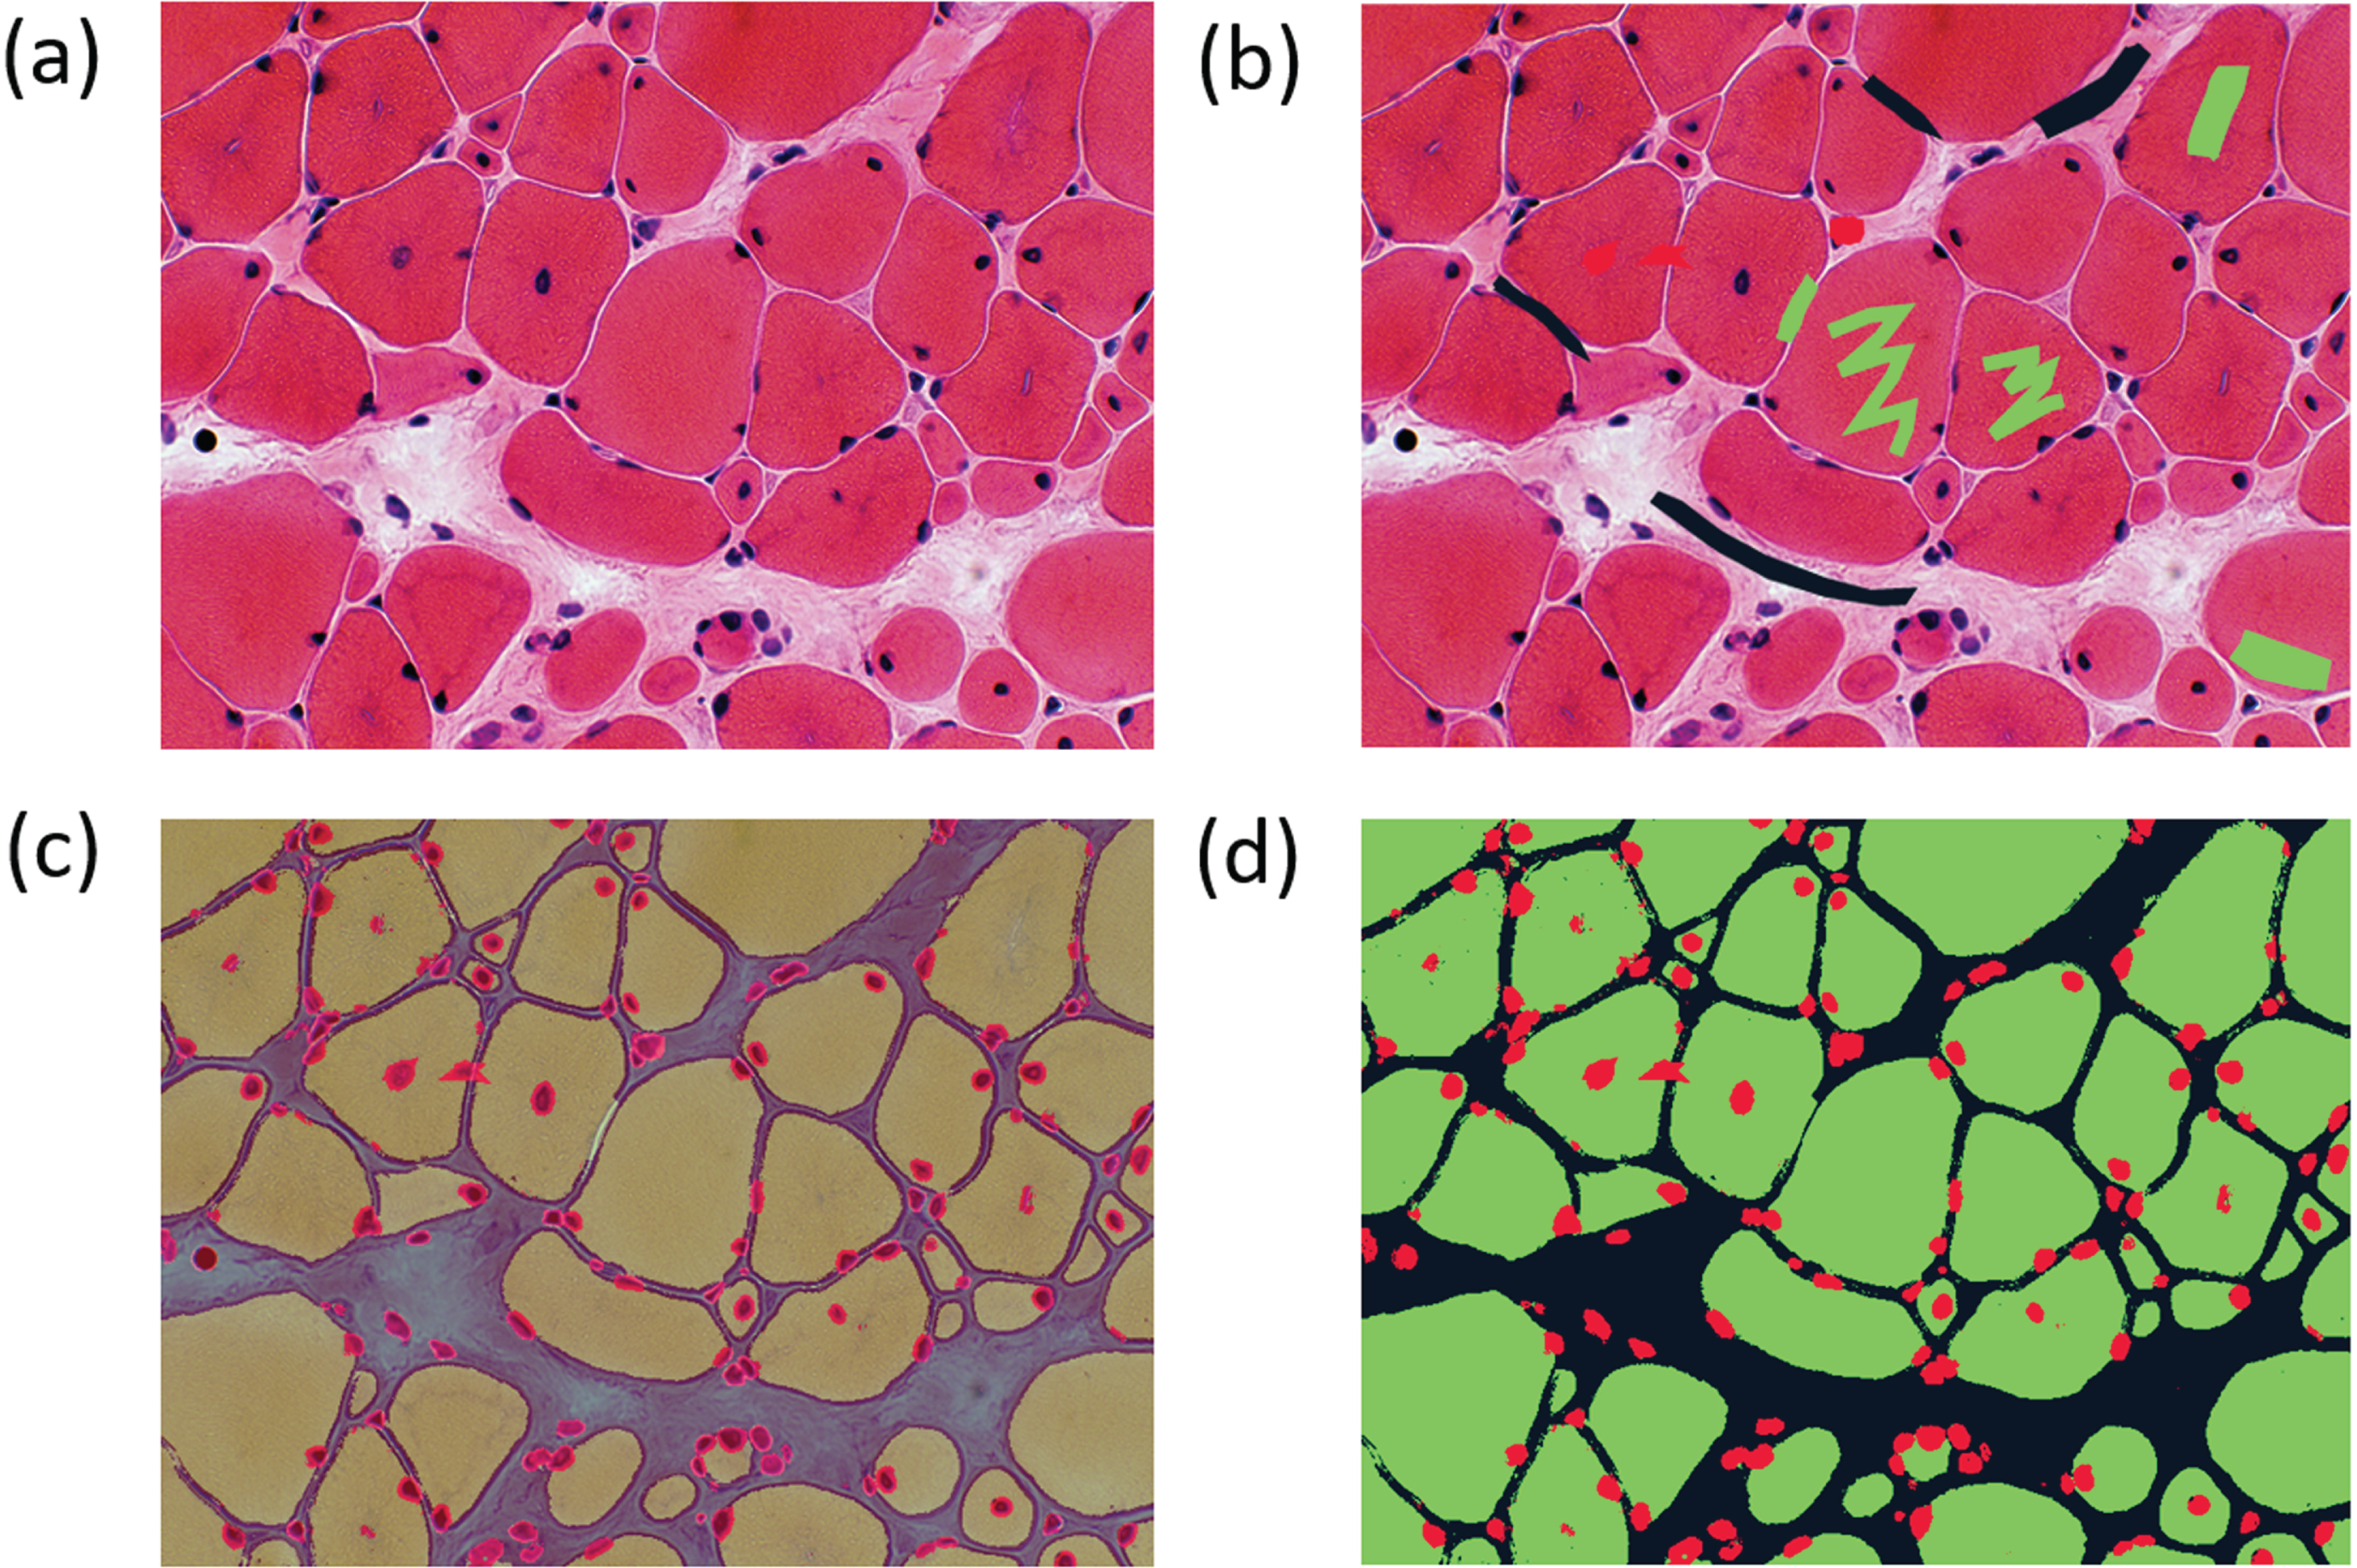
For the image data, Fig. 7 shows an example of the segmentation of a biopsy image, where we annotated the cytoplasm of the cells (green), intercellular spaces (black) and cell nuclei (red). The raw image (Fig. 7a) is annotated with free-shape areas associated with standard vocabulary terms (Fig. 7b). Then, the whole image is automatically segmented based on the annotations, producing the segmentation mask where each pixel is associated with a class (Figs. 7c, 7d).
Fig. 7
Image segmentation process in the image segmentation module. (a) Raw image input before annotation. (b) Image with limited manual annotation of cytoplasm (green), cell nucleus (red) and intercellular space (black). (c) Blended image of the raw image and segmented image after automated segmentation with a random-forest classifier. (d) Segmented image mask alone.
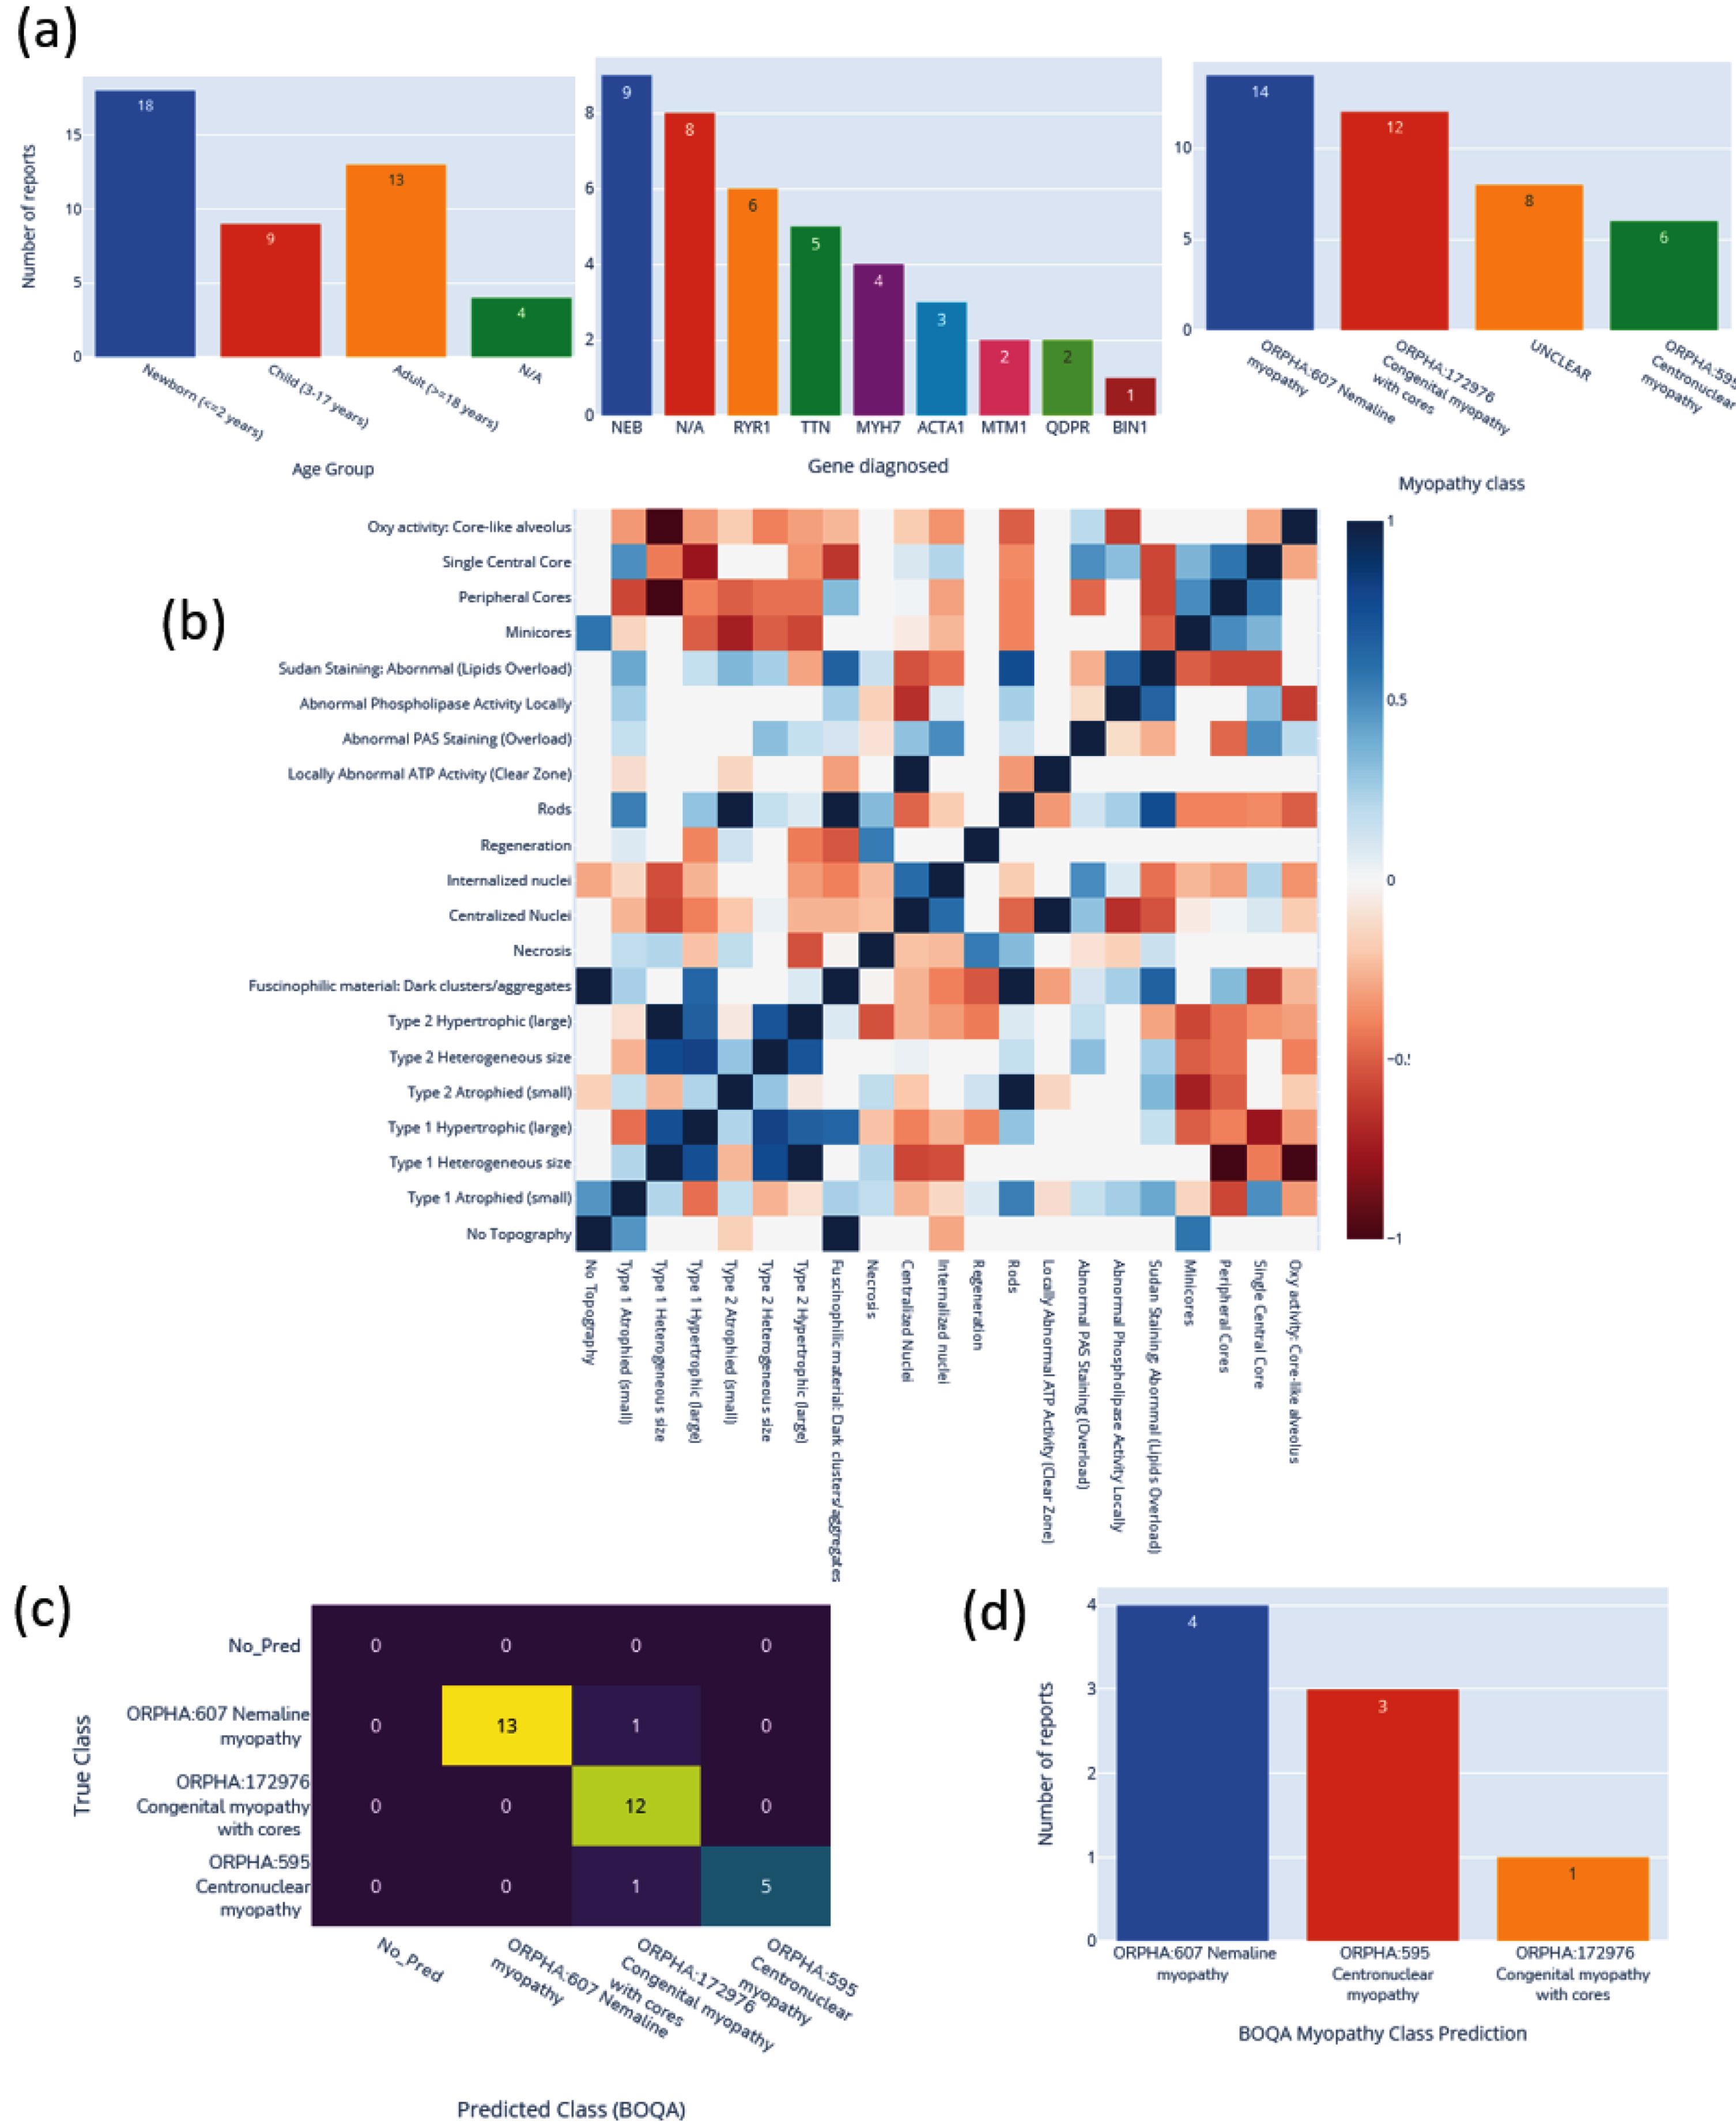
The automatic visualization dashboard was used to generate the six visualizations provided in Fig. 8. These visualizations include a breakdown of the patients in the database by age, genes, or diagnosis (Fig. 8a). A correlation matrix (using Pearson correlation coefficient) between the occurrences of standard vocabulary terms is generated (Fig. 8b), which can serve as a starting point for exploration of co-occurrence of features in patients. The confusion matrix of the final diagnosis of patients versus the suggested disease name with BOQA (Fig. 8c) allows the user to monitor the accuracy of the disease suggestion function. In addition, a histogram showing the classification of patients without a final diagnosis is provided to indicate possible prognosis of undiagnosed patients (Fig. 8d). Finally, the frequency of each standard vocabulary term by gene and by disease is automatically calculated and shown in two tables ( Supplementary Tables S1 and S2 ).
Fig. 8
Automatic visualization of 40 generated congenital myopathy reports. (a) Histogram of the number of reports by age group, by diagnosed gene (top 9) or by congenital myopathy class. (b) Correlation matrix of standard vocabulary terms after annotation for all reports. (c) Confusion matrix of BOQA algorithm performance for suggestion of the three main congenital myopathy classes (NM, COM, CNM, n = 32). Colors indicate the number of reports for each cell of the matrix, the lighter the color the more reports. (d) Histogram of the reclassification by BOQA of reports without a final diagnostic (n = 8).
DISCUSSION
IMPatienT is a one-stop platform that simplifies the digitization, processing, and exploration of both textual and image patient data. The web application is centered around the concept of a standard vocabulary tree (that is easy to create or to import existing ones) and used to process text and image data. This allows IMPatienT to work with patient data from domains that still lack a consensus ontology and rely on well-established ontologies for patient data, such as HPO for phenotypes, Orphanet for disease names or HGCN/HGVS for genetic diagnoses.
The semi-automatic approach implemented in IMPatienT offers faster digitization processes while ensuring accuracy through manual review. This is achieved by analyzing text data using OCR and NLP to automatically match the text to the standard vocabulary, followed by manual correction. For image data, the user first provides sparse annotations on the image, which are then used to compute an automatic segmentation of the whole image. For data exploration, IMPatienT uses a fully automatic approach including various visualizations as well as diagnosis suggestions, while allowing the user to extract the processed data in a standard format for further analysis (database, images, frequency tables).
IMPatienT aims to integrate multiple approaches in a unified platform with two main objectives: universality (i.e. not restricted to a specific domain) and multimodality (i.e. integration of multiple data types). To our knowledge, other tools similar to IMPatienT do not fulfill both objectives.
We performed a comparison of the main functionalities of IMPatienT with other tools used in the community. Workflows such as Phenotips, SAMS and PhenoStore are similar to IMPatienT as they are designed as a patient information database. However, they are restricted to processing patient phenotype data using HPO and do not integrate multimodal data. IMPatienT goes further by allowing custom observations with the vocabulary builder for fields of study currently without ontology (e.g. histology) and with automatic digitization with OCR/NLP as well as integrating tools to exploit image data. In contrast to a tool like Protégé that is the reference tool to build an ontology, the module 1 of IMPatienT provides a user-friendly interface where non-ontology experts can start building a vocabulary in a tree representation way. To improve the interoperability, IMPatienT allows the export in OBO format, which is compatible with Protégé for further improvement of the created vocabulary based on ontological best practices.
Other tools are available that implement the functionality of one or two IMPatienT modules. For example, Doc2HPO is a tool that also uses a semi-automatic approach to digitize clinical text according to a list of HPO terms, based on NLP methods and negation detection. However, as Doc2HPO is restricted to HPO, it does not provide custom vocabulary tree facilities. In contrast IMPatienT is suitable for digitization of text data from any domain of interest that can be covered with its vocabulary creation module when no ontology is currently available.
For image data, software such as Cytomine and Ilastik are widely used and perform well on biological data. In contrast to these standalone tools that can process big raw image data locally, the module 3 of IMPatienT is currently a web application that can process lightweight images (in Mega-octet). However, lightweight images (e.g. JPEG) are the most common form images available in patients data for histopathologies in myopathies or eye fundus in retinopathies for instance. Moreover, IMPatienT allow the user to take into consideration the multimodal aspects of patient data by keeping the raw image and the expert interpretation (histological report) in a single database along with a collaborative and rich user-defined vocabulary.
Finally, in IMPatienT we reimplemented the diagnosis support algorithm called BOQA that is also used in Phenomizer, a tool to rank a list of the top matching diseases based on a list of input HPO terms. We modified the algorithm to consider frequencies of vocabulary terms by disease to have meaningful predictions. In contrast, BOQA uses binary states for terms (terms are marked as present or absent) and is not compatible with numeric features. In the future, it will be interesting to implement a more complex system such as explainable AI with learning classifier systems [33]. This should improve accuracy, explainability, and handling of quantitative values, although at the cost of computational power.
IMPatienT still lacks some features compared to other tools, such as a pedigree editor, support for DICOM and gigapixel images and phenotypic data export to the Phenopacket format. In the future, we plan to further develop IMPatienT by adding these features to the interface. We also plan to add a vocabulary search engine and sharing feature to encourage reuse or to explore the automatization of the standard vocabulary creation with the analysis of a complete corpus of text. For text analysis, we intend to implement additional context comprehension, i.e. not only negation but also hypothetical statements, uncertainty and family context as well as better text-vocabulary terms matching. Finally, we plan to expand the scope of the OCR/NLP method by integrating existing NLP tools that will automatically detect and align to HPO terms, gene symbols and disease names in the report text.
ACKNOWLEDGMENTS
We thank the BiGEst-ICube platform for their assistance. We thank the Agence Nationale de la Recherche (ANR), 80 | Prime CNRS (MYO-xIA Project), the University of Strasbourg and INSERM for funding this work.
CONFLICTS OF INTEREST
The authors have no conflict of interest to report.
SUPPLEMENTARY MATERIAL
[1] The supplementary material is available in the electronic version of this article: https://dx.doi.org/10.3233/JND-230085.
REFERENCES
[1] | Kerr WT , Hwang ES , Raman KR , Barritt SE , Patel AB , Le JM , et al. Multimodal diagnosis of epilepsy using conditional dependence and multiple imputation. 2014 Int. Workshop Pattern Recognit. Neuroimaging, 2014, p. 1-4. https://doi.org/10.1109/PRNI.2014.6858526 |
[2] | Yan R , Ren F , Rao X , Shi B , Xiang T , Zhang L , et al. Integration of Multimodal Data for Breast Cancer Classification Using a Hybrid Deep Learning Method. In: Huang D-S, Bevilacqua V, Premaratne P, editors. Intell. Comput. Theor. Appl., Cham: Springer International Publishing; 2019, p. 460-9. https://doi.org/10.1007/978-3-030-26763-6_44 |
[3] | Liu X , Chen K , Wu T , Weidman D , Lure F , Li J . Use of multimodality imaging and artificial intelligence for diagnosis and prognosis of early stages of Alzheimer’s disease. Transl Res J Lab Clin Med (2018) ;194: :56–67. https://doi.org/10.1016/j.trsl.2018.01.001 |
[4] | Venugopalan J , Tong L , Hassanzadeh HR , Wang MD . Multimodal deep learning models for early detection of Alzheimer’s disease stage. Sci Rep (2021) ;11: :3254. https://doi.org/10.1038/s41598-020-74399-w |
[5] | North KN , Wang CH , Clarke N , Jungbluth H , Vainzof M , Dowling JJ , et al. Approach to the diagnosis of congenital myopathies. Neuromuscul Disord NMD (2014) ;24: :97–116. https://doi.org/10.1016/j.nmd.2013.11.003 |
[6] | Cassandrini D , Trovato R , Rubegni A , Lenzi S , Fiorillo C , Baldacci J , et al. Congenital myopathies: clinical phenotypes and new diagnostic tools. Ital J Pediatr (2017) ;43: :101. https://doi.org/10.1186/s13052-017-0419-z |
[7] | Böhm J , Vasli N , Malfatti E , Le Gras S , Feger C , Jost B , et al. An integrated diagnosis strategy for congenital myopathies. PloS One (2013) ;8: :e67527. https://doi.org/10.1371/journal.pone.0067527 |
[8] | Bodenreider O . The Unified Medical Language System (UMLS): integrating biomedical terminology. Nucleic Acids Res (2004) ;32: :D267–70. https://doi.org/10.1093/nar/gkh061 |
[9] | Köhler S , Gargano M , Matentzoglu N , Carmody LC , Lewis-Smith D , Vasilevsky NA , et al. The Human Phenotype Ontology in 2021 .Nucleic Acids Res (2021) ;49: :D1207–17. https://doi.org/10.1093/nar/gkaa1043 |
[10] | Musen MA . The Protégé Project: A Look Back and a Look Forward. AI Matters (2015) ;1: :4–12. https://doi.org/10.1145/2757001.2757003 |
[11] | Liu C , Peres Kury FS , Li Z , Ta C , Wang K , Weng C . Doc2Hpo: a web application for efficient and accurate HPO concept curation. Nucleic Acids Res (2019) ;47: :W566–70. https://doi.org/10.1093/nar/gkz386 |
[12] | Girdea M , Dumitriu S , Fiume M , Bowdin S , Boycott KM , Chénier S , et al. PhenoTips: Patient Phenotyping Software for Clinical and Research Use. Hum Mutat (2013) ;34: :1057–65. https://doi.org/10.1002/humu.22347 |
[13] | Steinhaus R , Proft S , Seelow E , Schalau T , Robinson PN , Seelow D . Deep phenotyping: symptom annotation made simple with SAMS. Nucleic Acids Res (2022) ;50: (W1):W677–81. https://doi.org/10.1093/nar/gkac329 |
[14] | Laurie S , Piscia D , Matalonga L , Corvó A , Fernández-Callejo M , Garcia-Linares C , et al. The RD-Connect Genome-Phenome Analysis Platform: Accelerating diagnosis, research, and gene discovery for rare diseases. Hum Mutat (2022) ;43: :717–33. https://doi.org/10.1002/humu.24353 |
[15] | Yang H , Robinson PN , Wang K . Phenolyzer: phenotype-based prioritization of candidate genes for human diseases. Nat Methods (2015) ;12: :841–3. https://doi.org/10.1038/nmeth.3484 |
[16] | Köhler S , Schulz MH , Krawitz P , Bauer S , Dölken S , Ott CE , et al. Clinical diagnostics in human genetics with semantic similarity searches in ontologies. Am J Hum Genet (2009) ;85: :457–64. https://doi.org/10.1016/j.ajhg.2009.09.003 |
[17] | Bauer S , Kohler S , Schulz MH , Robinson PN . Bayesian ontology querying for accurate and noise-tolerant semantic searches. Bioinformatics (2012) ;28: :2502–8. https://doi.org/10.1093/bioinformatics/bts471 |
[18] | Marée R , Rollus L , Stévens B , Hoyoux R , Louppe G , Vandaele R , et al. Collaborative analysis of multi-gigapixel imaging data using Cytomine. Bioinformatics (2016) ;32: :1395–401. https://doi.org/10.1093/bioinformatics/btw013 |
[19] | Aubreville M , Bertram C , Klopfleisch R , Maier A . SlideRunner eRunner – A Tool for Massive Cell Annotations in Whole Slide Images. ArXiv180202347 Cs 2018:309-14. https://doi.org/10.1007/978-3-662-56537-7_81 |
[20] | Berg S , Kutra D , Kroeger T , Straehle CN , Kausler BX , Haubold C , et al. ilastik: interactive machine learning for (bio)image analysis. Nat Methods (2019) ;16: :1226–32. https://doi.org/10.1038/s41592-019-0582-9 |
[21] | Cinaglia P , Tradigo G , Cascini GL , Zumpano E , Veltri P . A framework for the decomposition and features extraction from lung DICOM images. Proc. 22nd Int. Database Eng. Appl. Symp., New York, NY, USA: Association for Computing Machinery; 2018, p. 31-6. https://doi.org/10.1145/3216122.3216127 |
[22] | Deisseroth CA , Birgmeier J , Bodle EE , Kohler JN , Matalon DR , Nazarenko Y , et al. ClinPhen extracts and prioritizes patient phenotypes directly from medical records to expedite genetic disease diagnosis. Genet Med (2019) ;21: :1585–93. https://doi.org/10.1038/s41436-018-0381-1 |
[23] | Smedley D , Jacobsen JOB , Jäger M , Köhler S , Holtgrewe M , Schubach M , et al. Next-generation diagnostics and disease-gene discovery with the Exomiser. Nat Protoc (2015) ;10: :2004–15. https://doi.org/10.1038/nprot.2015.124 |
[24] | Cinaglia P , Guzzi PH , Veltri P . INTEGRO: an algorithm for data-integration and disease-gene association. 2018 IEEE Int. Conf. Bioinforma. Biomed. BIBM, 2018, p. 2076-81. https://doi.org/10.1109/BIBM.2018.8621193 |
[25] | Jungbluth H , Treves S , Zorzato F , Sarkozy A , Ochala J , Sewry C , et al. Congenital myopathies: disorders of excitation-contraction coupling and muscle contraction. Nat Rev Neurol (2018) ;14: :151–67. https://doi.org/10.1038/nrneurol.2017.191 |
[26] | Tweedie S , Braschi B , Gray K , Jones TEM , Seal RL , Yates B , et al. Genenames.org: the HGNC and VGNC resources in 2021.. Nucleic Acids Res (2021) ;49: :D939-46–46. https://doi.org/10.1093/nar/gkaa980 |
[27] | den Dunnen JT , Dalgleish R , Maglott DR , Hart RK , Greenblatt MS , McGowan-Jordan J , et al. HGVS Recommendations for the Description of Sequence Variants: 2016 Update. Hum Mutat (2016) ;37: :564–9. https://doi.org/10.1002/humu.22981 |
[28] | INSERM. Orphanet: an online database of rare diseases and orphan drugs 1997. http://www.orpha.net (accessed February 13, 2022). |
[29] | Chapman WW , Bridewell W , Hanbury P , Cooper GF , Buchanan BG . A Simple Algorithm for Identifying Negated Findings and Diseases in Discharge Summaries. J Biomed Inform (2001) ;34: :301–10. https://doi.org/10.1006/jbin.2001.1029 |
[30] | Gouillart E . Machine Learning –Image segmentation. GitHub 2020. https://github.com/plotly/dash-sample-apps/tree/main/apps/dash-image-segmentation (accessed November 23, 2021). |
[31] | Walt van de S , Schönberger JL , Nunez-Iglesias J , Boulogne F , Warner JD , Yager N , et al. scikit-image: image processing in Python. PeerJ (2014) ;2: :e453. https://doi.org/10.7717/peerj.453 |
[32] | Hossain S . Visualization of Bioinformatics Data with Dash Bio. Proc 18th Python Sci Conf 2019:126-33. https://doi.org/10.25080/Majora-7ddc1dd1-012 |
[33] | Urbanowicz RJ , Moore JH . ExSTraCS 2.0: Description and Evaluation of a Scalable Learning Classifier System. Evol Intell (2015) ;8: :89–116. https://doi.org/10.1007/s12065-015-0128-8 |


