
IL-6 and TNF are Potential Inflammatory Biomarkers in Facioscapulohumeral Muscular Dystrophy
Abstract
Background:
FSHD is a highly prevalent inherited myopathy with a still poorly understood pathology.
Objective:
To investigate whether proinflammatory cytokines are associated with FSHD and which specific innate immune cells are involved in its pathology.
Methods:
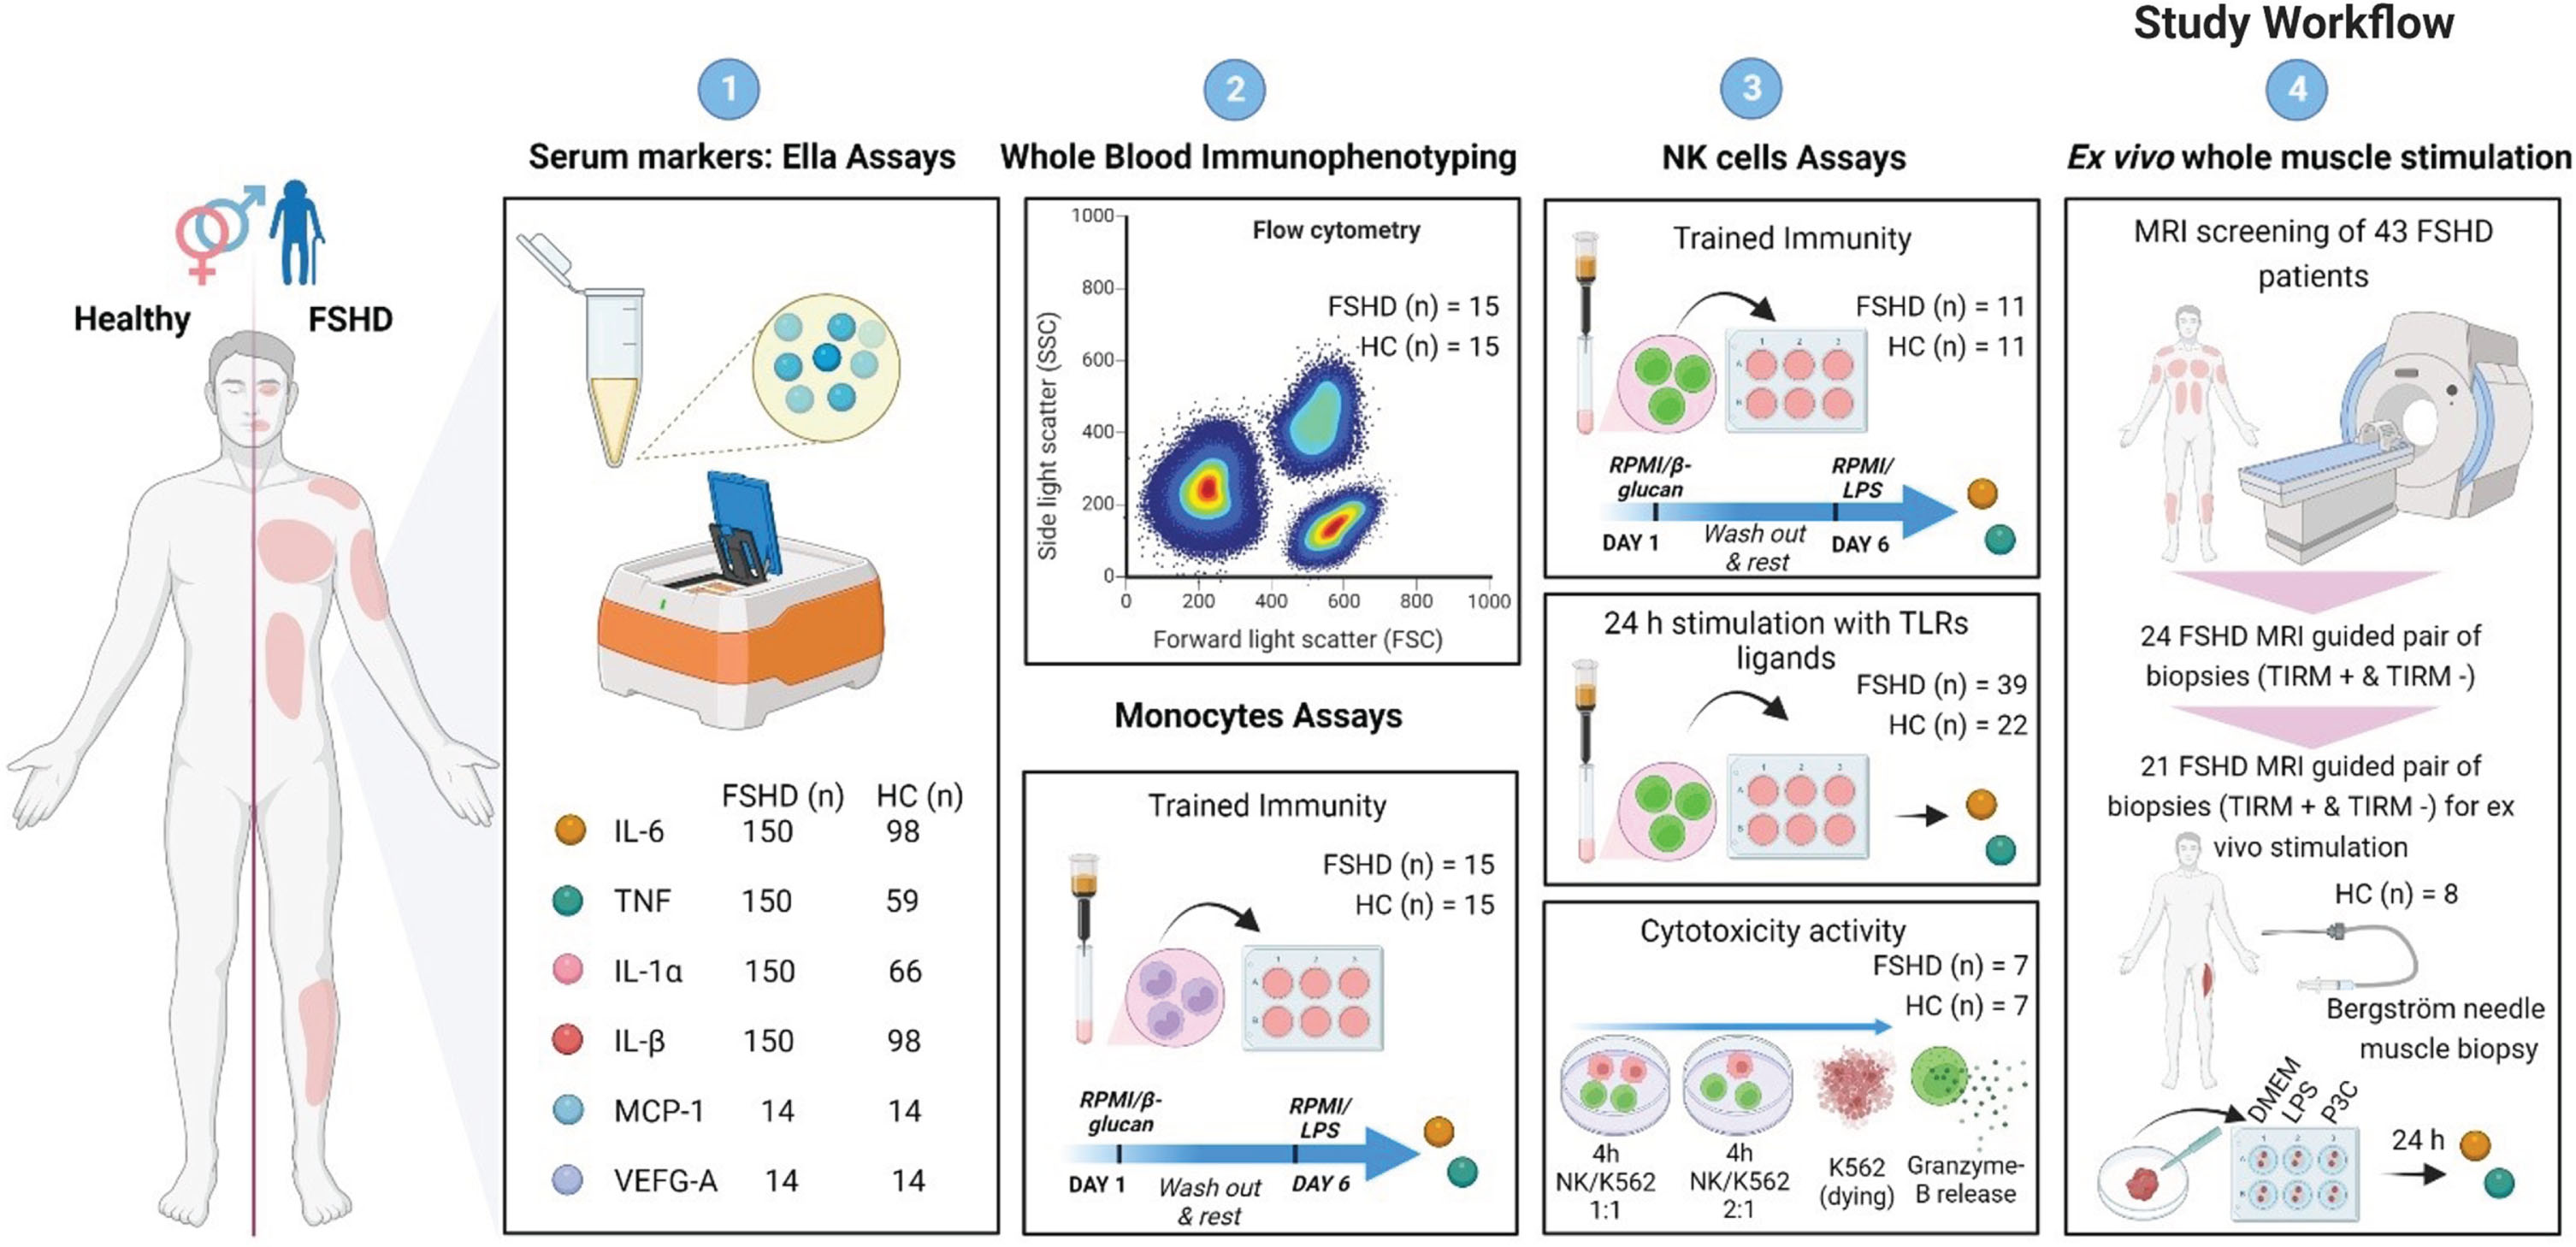
First, we measured circulating cytokines in serum samples: IL-6 (FSHD, n = 150; HC, n = 98); TNF (FSHD, n = 150; HC, n = 59); IL-1α (FSHD, n = 150; HC, n = 66); IL-1β (FSHD, n = 150; HC, n = 98); MCP-1 (FSHD, n = 14; HC, n = 14); VEGF-A (FSHD, n = 14; HC, n = 14). Second, we tested trained immunity in monocytes (FSHD, n = 15; HC, n = 15) and NK cells (FSHD, n = 11; HC, n = 11). Next, we explored the cytokine production capacity of NK cells in response to different stimuli (FSHD, n = 39; HC, n = 22). Lastly, we evaluated the cytokine production of ex vivo stimulated MRI guided inflamed (TIRM+) and paired MRI guided non inflamed (TIRM–) muscle biopsies of 21 patients and of 8 HC muscle biopsies.
Results:
We included a total of 190 FSHD patients (N = 190, 48±14 years, 49% men) and of 135 HC (N = 135, 44±15 years, 47% men). We found that FSHD patients had higher concentrations of IL-6 and TNF measured (a) in the circulation, (b) after ex-vivo stimulation of NK cells, and (c) in muscle specimens. Besides, IL-6 circulating concentrations, as well as its production by NK cells and IL-6 content of FSHD muscle specimens, showed a mild correlation with disease duration, disease severity, and muscle weakness.
Conclusion:
These results show that IL-6 and TNF may contribute to FSHD pathology and suggest novel therapeutic targets. Additionally, the activation of NK cells in FSHD may be a novel pathway contributing to FSHD pathology.
INTRODUCTION
Facioscapulohumeral dystrophy (FSHD) is the second most common muscular dystrophy worldwide [1, 2] and it is characterized by progressive weakness and atrophy of skeletal muscles [3].
Two genetic forms of FSHD have been described: type 1 (FSHD1) and type 2 (FSHD2), which are clinically identical. FSHD1 (approximately 95% of cases) is caused by the contraction of the repeat array D4Z4, located at chromosome 4q35, to 10 repeat units or less. FSHD2 (approximately 5% of cases) is caused by the mutation of a [4] chromatin modifier gene, most often SMCHD1 [5, 6]. Both classes of mutations are associated with partial chromatin relaxation of the D4Z4 region, resulting in failure to repress the Double Homeobox 4 gene (DUX4) [7], which is toxic to skeletal muscles.
Magnetic resonance imaging (MRI) studies suggest the presence of inflammation in the muscles of patients with FSHD [8, 9]. FSHD muscles showing turbo inversion recovery magnitude (TIRM) hyperintensity on MRI are considered to be in an active phase of the disease, which possibly reflects inflammation [10, 11]. In fact, inflammatory infiltrates containing T cells and macrophages were described in FSHD muscle biopsies from muscles that were TIRM hyperintense on MRI [10, 12].
Macrophages are originated from circulating blood monocytes and are an important source of proinflammatory cytokines such as IL-6 and TNF [13, 14]. Besides, the repeated stimulation of monocytes with specific microbial ligands, pathogens or vaccines induces long-term epigenetic and transcriptional reprogramming [15], resulting in an enhanced inflammatory response upon heterologous secondary restimulation [16, 17]. This process is known as innate immune memory or trained immunity [18, 19]. Similar to monocytes, natural killer (NK) cells, which are innate immune cells able to release both inflammatory cytokines (such as IL-6, TNF) and killing granules (Granzyme-B and Perforins) [20], can gain immune memory characteristics as well [21]. The stimulation with β-glucan for instance, a fungal cell wall component, has been shown to induce trained immunity in monocytes and induce protection against infections (18). On the other side, inappropriate upregulation of the function of innate immune cells such as monocytes and NK cells can have a detrimental effect in immune-mediated diseases: the hyperproduction of inflammatory cytokines with subsequent tissue damage [19].
The contribution of the innate immune system to FSHD pathophysiology remains poorly investigated. In this study, we hypothesized that innate inflammatory cytokines are associated with FSHD pathophysiology and that monocytes and NK cells are hyperactivated in patients with FSHD resulting in increased production of proinflammatory cytokines. To investigate this hypothesis, we carried out a translational case-control study aimed at characterizing in patients with FSHD and matched healthy subjects: (i) serum concentration of circulating inflammatory markers, (ii) the cytokine production capacity of monocytes and NK cells, and (iii) the cytokine production capacity of muscle specimens.
MATERIALS AND METHODS
Participants
To investigate whether inflammatory cytokines are associated with FSHD, and which specific immune cells may contribute to its pathophysiology, we included patients with FSHD and unrelated sex and age matched healthy controls from 2015 to 2019. All participants were invited at the Neurology outpatient clinic of Radboud University Medical Center, Nijmegen, The Netherlands. Selected patients fulfilled the following inclusion criteria: 1) genetically confirmed diagnosis of FSHD and 2) age ≥18 years old. Patients were excluded in case of: 1) presence of infectious and/or inflammatory comorbidities; 2) presence of autoimmune comorbidities (such as but not limited to Graves’disease, Hashimoto thyroiditis, multiple sclerosis, myasthenia gravis, Pernicious anemia, Addison disease, celiac disease, dermatomyositis, inclusion body myositis, rheumatoid arthritis, autoimmune vasculitis, type 1 diabetes, etc); 3) past or present history of malignancy; 4) use of corticosteroids; 5) use of statins; 6) use of anti-inflammatory medication. Unrelated healthy controls older than 18 years old were included if: 1) absence of all conditions mentioned in criteria 1 to 5; 2) absence of any personal/family medical history of neuromuscular disorders; 3) absence of muscle weakness during physical examination.
Demographics (sex, age at examination, race) and anthropometrics (length, weight, body mass index) were recorded from all included patients and healthy controls through usual history taking collection. Moreover, multiple clinical features (disease duration, Ricci score, Lamperti score, Medical Research Council sum score) were collected from all included patients through a standardized physical examination conducted by a physician (A. Greco or K. Mul). The MRC Sum Score measures muscle strength in twelve muscle and the total score ranges from 0 (complete paralysis) to 60 (normal muscle strength. The Ricci score is a 0–10 scale that takes into account the extent of weakness in various body regions and considers the descending spread of symptoms from face and shoulders to pelvic and leg muscles typical of FSHD [22]. The Lamperti score evaluates functionality and strength of six body muscle regions with a total score ranging from 0 to 15: (1) facial region (scored from 0 to 2); (2) scapular region (scored from 0 to 3); (3) upper limb region (scored from 0 to 2); (4) lower limb region (scored from 0 to 2); (5) pelvic region (scored from 0 to 5); and (6) abdominal region (scored from 0 to 1) [23]. FSHD genetics characteristics (FSHD type and D4Z4 repeat length) were recorded from all patients with FSHD. Participants characteristics are listed in Table 1.
Table 1
Subjects characteristics
| FSHD patients | HC | |
| Demographics &Antropometrics | ||
| Number of participants (% male) | 190 (49%) | 135 (47%) |
| Age at examination mean y±SD | 48±14 | 44±15 |
| BMI mean±SD | 25±4 | 24±5 |
| African background n/tot. n | 1/190 | 1/135 |
| Asian background n/tot. n | 2/190 | 2/135 |
| Caucasian background n/tot. n | 187/190 | 132/135 |
| Clinical outcomes | ||
| Disease duration mean y±SD | 24±15 | n/a |
| MRC Sum Score (0–60) mean±SD | 49±10 | 60 |
| Ricci Score (01–10) mean±SD | 5±3 | n/a |
| Lamperti Score (0–15) mean±SD | 6±4 | n/a |
| Genetics | ||
| FSHD1 n/tot. n | 182/190 | n/a |
| FSHD2 n/tot. n | 8/190 | n/a |
| D4Z4 repeat units mean±SD | 6±2 | n/a |
All the study procedures were performed after regional medical ethical committee approval (CMO Arnhem-Nijmegen) under file number NL64690.091.18. All subjects provided written informed consent. Data were handled according to Good Clinical Practice guidelines.
Study workflow
The study here presented in its entirety is the result of subsequent measurements each of them driven by the observations made previously, in a stepwise manner explained as follow. We started our research by:
(1) retrospectively measuring a selected group of markers (IL-6, TNF, IL-1α, IL-1β) in 150 FSHD serum samples and in sex and age matched control serum samples (IL-6, n = 98; TNF, n = 59; IL-1α, n = 66; IL-1β, n = 98). Patients samples fulfilling all the criteria explained in paragraph “Participants” were selected from the Dutch FSHD-FOCUS cohort (K. Mul et al. [24]). 120 patients out of 150 underwent an MRI examination as well during the FSHD-FOCUS study. Therefore, for these patients it is was possible to look as well at differences in circulating markers between patients with inflamed muscles (reported as TIRM+, n = 58 out of 120) and with no inflamed muscles (TIRM–, n = 62 out of 120). These results are presented in Supplementary Figure 1. MCP-1 and VEGF-A were measured in serum samples of new prospectively included FSHD patients (n = 14) and matched healthy controls (n = 14) to indirect explore monocyte functionality. These patients did not undergo as well an MRI examination. IL-6 and TNF were chosen given their well-known role as key inflammatory cytokines and their known implication with muscle homeostasis and pathology [25]. IL-1α and IL-1β were chosen given the modulator role of IL-1 family cytokine in inducing immune training [26]. MCP-1 and VEGF-A were added to the initial selection as exploratory markers of monocytes functionality [27]. Given the pure exploratory nature of the study we included as many patient samples as possible trying for every set of experiment to maintain a case-control ratio close to at least 2 : 1 whenever possible.
(2) after having measured the selected group of serum markers and have observed that IL-6 and TNF were the two markers standing out of the analysis, we decided to further investigate which immune cells in the first place would be responsible for the observed serum increase and investigate whether trained innate immunity could be the possible immune mechanism behind it. After the first exploratory measurements in serum, we included a set of new 15 patients and 15 sex and age matched healthy controls. Whole blood immunophenotyping and trained immunity of monocytes was studied in this new set of participants. As both stimulation and trained immunity of monocytes did not explain the previously observed serum increased of IL-6 and of TNF in the patient group,
(3) we proceeded by studying other immune cells which are 1) an important source of both cytokine, 3) can undergo trained immunity and 3) never have been studied so far in FSHD patients: Natural Killer cells.
(4) additionally, we characterized inflammation not only at a systemic but also at a local level using the highly targeted MRI-guided muscle biopsies. So, subsequently, a new set of patients and of sex and age matched healthy controls was recruited, allowing the collection of 24 pair of FSHD MRI guided biopsies (inflamed as TIRM+ and non-inflamed as TIRM–) and of 8 HC muscle biopsies.
Blood samples collection
EDTA blood samples and serum samples were collected from all participants at the beginning of each scheduled appointment between 9.00 and 11.00 a.m. Participants were not asked to fast prior sample collection. Serum samples were stored at –80 degrees within 2 hours from samples collection. Cells (PBMCs, monocytes and NK cells) were isolated from a subset of patients and control individuals on the same day and within 2 hours from blood sampling as described in the following sections.
Serum circulating markers assay
As a first step, we retrospectively measured the concentration of a selected group of circulating inflammatory markers (IL-6, TNF, IL-1α, IL-1β, MCP-1, and VEGF-A) in serum samples of patients with FSHD and sex and age matched healthy controls. IL-6 and IL-1β were measured in serum samples of 150 FSHD patients and 98 healthy controls. TNF was measured in serum samples of 150 FSHD patients and 59 healthy controls. IL-1α was measured in serum samples of 150 FSHD patients and 66 healthy controls. MCP-1 and VEGF-A were measured in serum samples of a new set 14 FSHD patients and 14 healthy controls to explore monocyte functionality. Prior to the assay, patient and healthy control serum samples were thawed and centrifugated for 10 minutes at room temperature at 3400 rpm in order to remove particulates. After centrifugation, all samples were diluted 1:2 in sample diluent. Concentration levels of circulating markers were detected in patient and healthy control serum samples using the highly sensitive multi-analyte Ella Simple Plex Cartridge Kit (ProteinSimple, San Jose, CA, USA) following manufacturer instructions.
Whole blood flow cytometry analysis
As a second step, we measured the whole blood immunophenotyping of a subset of 15 FSHD patients and 15 new sex-age healthy controls. Samples were not pre-selected out of an initial pool. Peripheral fresh whole blood samples were analysed by flow cytometry as described by Aguirre-Gamboa et al. [28]. Briefly, samples were stained with a antibody cocktail containing the following fluorochrome conjugated antibodies (dilution, cone, distributor): CD45-KO (1:50, J33, Beckman Coulter), CD16-FITC (1:50, 3G8, Beckman Coulter), HLA-DR-PE (1:10, immu-357, Beckman Coulter), CD14-ECD (1:100, UCHT1, Beckman Coulter), CD4-PE-Cy5.5 (1:200, 13B8.2, Beckman Coulter), CD25-PC7 (1:50, M-A251, Becton & Dickinson), CD56-APC (1:50, N901, Beckman Coulter), CD8-APC-AF700 (1:400, B9.11, Beckman Coulter), CD19-APC-AF750 (1:50, J3-119, Beckman Coulter), CD3-PB (1:50, UCHT1, Beckman Coulter). Surface expression was measured on a 10-color Navios flow cytometer (Beckman Coulter) and analysed using Kaluza software version 1.3 (Beckman Coulter) (see Supplemental Figure 2 for gating strategy).
Isolation of monocytes and NK cells from PBMCs
Next, we selected monocytes and NK cells for further ex vivo stimulation experiment, as described in the following sections. PBMCs were isolated by dilution of fresh EDTA blood in sterile phosphate-buffered saline (PBS) and density centrifugation over Ficoll-Paque (GE healthcare, Zeist, The Netherlands) as described by Gresnigt et al. [29] within 2 hours from samples collection. Monocytes and NK cells were purified from isolated PBMCs using magnetic activated cell separation (MACS, Mitenyi Biotec) and following the instruction of the commercial Pan Monocytes Isolation Kit (Mylteni Biotec) and CD56 Micro Beads kit (Mylteni Biotec) respectively. Cells were reconstituted in Dutch modified RPMI 1640 culture medium (Invitrogen, CA, USA) supplemented with pyruvate (10 mM), L-glutamine (10 mM) and the antibiotic gentamycin (10 mg/ml) (Gibco, Life Technologies, USA) to which we will refer to as complete culture medium. Cell suspension composition and cell amount were determined by Sysmex analyser. Cells were kept in complete culture medium at 1*106 cells/mL. An extra purification step was added by allowing MACS-isolated monocytes to adhere to polystyrene flat-bottom plates (Corning, NY, USA) for 1 h at 37°C; the cells were then washed with warm PBS to obtain maximal purity. Purity of MACS-isolated NK cells was confirmed by an extra fluorescent staining of cells with CD3-FITC (HIT3a, Biolegend) and CD56-PECY7 (B901, Beckman Coulter) followed by flow cytometry analysis (Beckman Coulter) (see Supplementary Figure 3 for gating strategy).
Ex vivo training of monocytes and NK cells
Trained immunity was induced ex vivo in adherent MACS-isolated monocytes of 15 FSHD patients and 15 sex and age matched healthy controls and in MACS-isolated NK cells of 11 FSHD patients and 11 healthy controls as described previously [30]. Briefly, 100,000 cells/well were incubated with either 10% pool human serum supplemented complete culture medium (taken as negative control) or with 1μg/ml of β-glucan (β-1,3-(d)-Glucan, kindly provided by David Williams, TN, USA), for 24 hours at 37°C, 5% CO2. Thereafter, cells were washed with warm PBS and incubated with 200μl/well of warm 10% pool serum supplemented complete culture medium for 5 days. On the sixth day of incubation, cells were restimulated with 200μl/well of complete culture medium (negative control) or with 10 ng/mL Escherichia coli LPS (serotype 055:B5, Sigma-Aldrich). After 24 hours, supernatants were collected and stored at –20°C until cytokine measurement.
Ex vivo stimulation of NK cells
Next, we further characterized the cytokine production capacity of NK cells in a new subset of patients and controls, once again samples were not pre-selected out of an initial pool, but new participants were subsequently recruited to further addressing our research questions. MACS-isolated NK cells of 39 FSHD patients and 22 healthy controls were seeded in a round bottom 96 well plate (100,000 cells/well) and incubated with either complete culture medium or the following stimuli: LPS (10 ng/mL E. coli LPS serotype 055:B5, Sigma-Aldrich), P3C (10μg/mL Pam3CysK4, Tübingen, Germany; L2000), C. albicans heat killed (1×10⁶ microorganisms/ml, strain UC8201, heat-killed at 100°C for 1 h). Supernatant was collected after 24 hours and 48 hours and immediately stored at –20°C until cytokine assays. NK cells harvested for 48 hours were incubated in 10% pool serum supplemented complete culture medium.
NK cells cytotoxicity and intracellular degranulation marker assay
Next, being NK cells not only cytokine producing cells but especially cells realising lytic granules we also explored their cytotoxicity capacity in a subset of samples. Fresh MACS-isolated NK cells of 7 FSHD patients and 7 healthy controls kept in complete culture medium at 1*106 cells/mL were effector cells. K562 (human immortalised myelogenous leukaemia cell line) were target cells. K562 cells were cultured and maintained in complete culture medium supplemented with 10% FBS (Gibco, Life Technology). K562 cells were maintained at 1*106 cells/mL and the medium was refreshed every 48 to 72 hours. Cells were incubated at 37°C, 5% CO2 at an NK:K562 ratio of 1:1 (100,000:100,000) or 2:1 (100,000:50,000). After 4 hours of incubation, cells were analysed using CytoFlex (Beckman Coulter) for apoptosis and necrosis of K562 cells using respectively Annexin V(Ann V)-FITC (1:100, Biovision) and Propidium Iodide (PI)-PE (1,5 ug/mL, Sigma) staining. Additionally, the expression of intracellular degranulation markers of effector NK cells was achieved through an extra 4 hour incubation step with with Golgiplug inhibitor (BD Pharmingen) prior to transfer to tube and staining with the following antibodies (dilution, clone, distributor): CD45- BV510 (1:20, 2D1, ITK Diagnostics), CD3-FITC (1:20, HIT3a, Biolegend), CD56 PECY7 (1:10, B901, Beckman Coulter), CD107-PECY5 (1:5, H4A3, BD Bioscience), and Granzyme B-PE (1:20, GB11, Life Technologies). Cells were then measured using Cytoflex flow cytometer (Beckman Coulter) and analysed with Kaluza software version 1.5a (Beckman Coulter) (see Supplementary Figure 4 for gating strategy).
Muscle biopsies collection
Parallel to understand which circulating immune cells may drive the increased circulating concentrations of cytokines, we also moved the focus of our research to FSHD local pathology. To this end, 43 FSHD patients received a whole leg MRI examination adapting the protocol described by Mul et al. [24]. Briefly, transversal Dixon and TIRM sequences were acquired from the upper and lower leg to evaluate the degree of muscle fatty infiltration and inflammation respectively. We will refer to this MRI exam as screening MRI. 24 patients with FSHD out of 43 displayed at least one TIRM positive muscle leg on screening MRI and underwent within 6 weeks the MRI guided biopsy procedure adapting the protocol described by Lassche et al. [31]. Briefly, MRI guided muscle biopsies targeting a TIRM negative healthy appearing muscle vastus lateralis were collected from each selected FSHD patient. Additionally, a second sample was collected from a suitable muscle leg scored as TIRM hyperintense on MRI (presumed active inflammation). Bergström needle muscle biopsy from the muscle vastus lateralis were collected as well from 8 healthy controls as described by Tarnopolsky et al. [32]. See Supplementary Data for additional information.
Analysis
Ex vivo stimulation of whole muscle specimens
Immediately after collection, muscle samples were gently washed in sterile PBS to rinse out all residual blood, portioned in identical pieces of 3 mm of diameter using a sterile 3 mm punch biopsy instrument and kept in culture medium DMEM (Gibcotrademark DMEM) supplemented with 100 U/ml penicillin and 100μg/ml streptomycin (Sigma-Aldrich) to prevent contamination. We will refer to this medium as basal culture medium. Merely due the available size of each muscle biopsy, it was possible to perform this ex vivo assay in 21 out of 24 FSHD muscle samples and in all 8 healthy control muscle samples. Whole muscle specimens were incubated for 24 hours at 37°C with either basal culture medium or LPS (10 ng/mL E. coli LPS serotype 055:B5, Sigma-Aldrich) and P3C (10μg/mL Pam3CysK4, Tübingen, Germany; L2000). Two muscle samples of 3 mm of diameter were used per condition. Supernatant was collected after 24 hours of stimulation and immediately stored at –20°C until cytokine assay.
Histological and immunostaining analysis
Along with fresh ex vivo muscle specimens stimulation, muscle biopsies were also immediately snap frozen in isopentane and stored at –80°C for further histology and immunostaining analysis. Serial muscle cryosections of 6μm were obtained from each sample. Cryosections were stained with Hematoxylin-phloxine (Hphlox) to assess 1) variability in fiber size, 2) extent of central nucleation, 3) presence of necrosis/regeneration, 4) presence of interstitial fibrosis. The severity of each category was scored as normal (0), mild (1), moderate (2), or severe (3) as previously described by Lassche et al. [31]. Briefly, the sum score of each category was used to assess the pathology grade which ranges from 0 (normal) to 12 (severe muscular dystrophy). In addition, immunohistochemistry was performed on serial muscle cryosections using the following primary antibodies (clone number; firma): CD3 (5740; Dako), CD4 (SP35; Cell Marque), CD8 (C8-144B; Dako), CD56 (123C3; Dako), CD68 (KP1; Dako), and HLA-ABC (W6-32; Exbio) to evaluate the degree of inflammatory infiltrates. Pathology grade and microscopic evaluation of CD3+, CD4+, CD8+, CD56+, CD68+, and HLA-ABC+ was done by an expert neuropathologist who was aware of the presence of both patient and healthy control muscle samples but not of the exact diagnosis.
A detailed (immune)histological analysis of all samples is currently in progress and will be object of a separate follow up research article. Here, we include the analysis of a representative patient and healthy control sample (Fig. 7).
Ex vivo cytokine measurements
Cytokines produced by ex vivo stimulated monocytes, NK cells, and muscle specimens were measured in cell/tissue supernatant by enzyme-linked immunosorbent assay (ELISA) using commercial kits (R&D Systems, Minneapolis, MN, USA), following manufacturer’s instructions.
Data availability statement
The data that support the findings of this study are available from the corresponding author upon reasonable request.
Statistics
Given the exploratory nature of our case-control study, the sample size was not based on a power statistical analysis. All statistical analysis were conducted using GraphPad prism 9 (GraphPad software, La Jolla, CA) or SPSS version 21.0 (SPSS Inc, Chicago, IL). Means were compared with the non-parametric Mann Whitney test or the non-parametric Wilcoxon paired t-test. Results were expressed as mean±SEM. Spearman rho analyses were used to determine correlation. Differences with a 2-sided p level <0,05 were considered statistically different. In case of multiple comparison, with adjusted the raw p-valued after Bonferroni correction.
RESULTS
Participants
We included a total number of hundred and ninety patients with FSHD (N = 190, 48±14 years, 49% men) and one hundred thirty-five healthy controls (N = 135, 44±15 years, 47% men). Demographic, clinical, and genetics characteristics of participants are summarized in Table 1.
Exact number of samples used per set of experiments are indicated in each following paragraph and corresponding figure legend. Also, we refer the reader to Fig. 1 where our stepwise workflow is illustrated.
Fig. 1
Study Workflow. (1) As a first step a selected group of markers (IL-6, TNF, IL-1α, IL-1β, MCP-1, and VEGF-A) were measured in serum samples of FSHD patients and sex- and age matched healthy control using the highly sensitive multi-analyte Ella Simple Plex Cartridge Kit. (2) Next, whole blood immunophenotyping and trained immunity of monocytes was studied in FSHD patients and matched healthy controls. (3) Third, trained immunity and ex vivo stimulation with TLRs ligands was studied in NK cells of FSHD patients and matched healthy controls. (4) Lastly, we characterized inflammation not only at a systemic but also at a local level using the highly targeted MRI-guided muscle biopsies. 21 pair of FHSD MRI guided muscle biopsies (TIRM+ and TIRM–) and 8 healthy control muscle biopsies were ex vivo stimulated for 24 hours.
Circulating IL-6 is significantly increased in FSHD patient sera
IL-6 and IL-1β were measured in serum samples of 150 FSHD patients and 98 healthy controls. TNF was measured in serum samples of 150 FSHD patients and 59 healthy controls. IL-1α was measured in serum samples of 150 FSHD patients and 66 healthy controls. MCP-1 and VEGF-A were measured in serum samples of 14 FSHD patients and 14 healthy controls. The serum concentrations of IL-6 was higher in the patient group than in the control group (Fig. 2A-B). We observed a higher TNF concentration in the serum of the patient group (raw p value = 0.0174), however, after multiple correction with Bonferroni test, we did not observe anymore a significant statistical difference (adjusted p value = 0. 0696). Conversely, IL-1α serum concentrations were higher in the control group than in the patient group (Fig. 2C). IL-1β serum concentrations did not significantly differ between patients and healthy controls (Fig. 2D). Finally, the serum concentrations of both MCP-1 and VEGF-A were lower in patients with FSHD compared to healthy controls (Fig. 2E-F). IL-6 had a low correlation with several patient demographic and clinical features: age, body mass index (BMI), disease duration, disease severity, and muscle weakness (Table 2). In addition, we observed a low association as well between circulating TNF and muscle weakness (Table 2). Finally, VEGF-A showed a moderate correlation with both disease severity and muscle weakness (Table 2). Additionally, within the patient group, 120 patients out of 150 underwent an MRI examination of the leg. Of these, 58 out 120 patients were scored as MRI TIRM+ (presence of inflamed muscles) and 62 out 120 were scored as MRI TIRM–(absence of inflamed muscles). We did not find differences in circulating concentrations of IL-6, TNF, IL-1α, and IL-1β between FSHD patients scored as MRI TIRM+ and FSHD patients scored as MRI TIRM–(Supplementary Figure 1). An overview of raw and adjusted p-values after Bonferroni correction is available in Supplementary Table 2.
Fig. 2
Serum circulating inflammatory markers. The concentrations (pg/ml) of a selected group of circulating inflammatory markers were measured in sera samples of patients with FSHD and sex and age matched healthy controls. (A) Mean±SD of IL-6 measured in serum samples of 150 patients with FSHD and 98 sex and age matched healthy controls. (B) Mean±SD of TNF measured in serum samples of 150 patients with FSHD and 59 sex and age matched healthy controls. (C) Mean±SD of IL-1α measured in serum samples of 150 patients with FSHD and 66 sex and age matched healthy controls. (D) Mean±SD of IL-1β measured in serum samples of 150 patients with FSHD and 98 sex and age matched healthy controls. (E) Mean±SD of MCP-1 measured in serum samples of 14 patients with FSHD and 14 sex and age matched healthy controls. (F) Mean±SD of VEGF-A measured in serum samples of 14 patients with FSHD and 14 sex and age matched healthy controls. Groups were compared with the non-parametric Mann Whitney test. The obtained raw p-values were adjusted after multiple correction with Bonferroni test. *p < 0,05, **p < 0,005, ***p < 0,001.
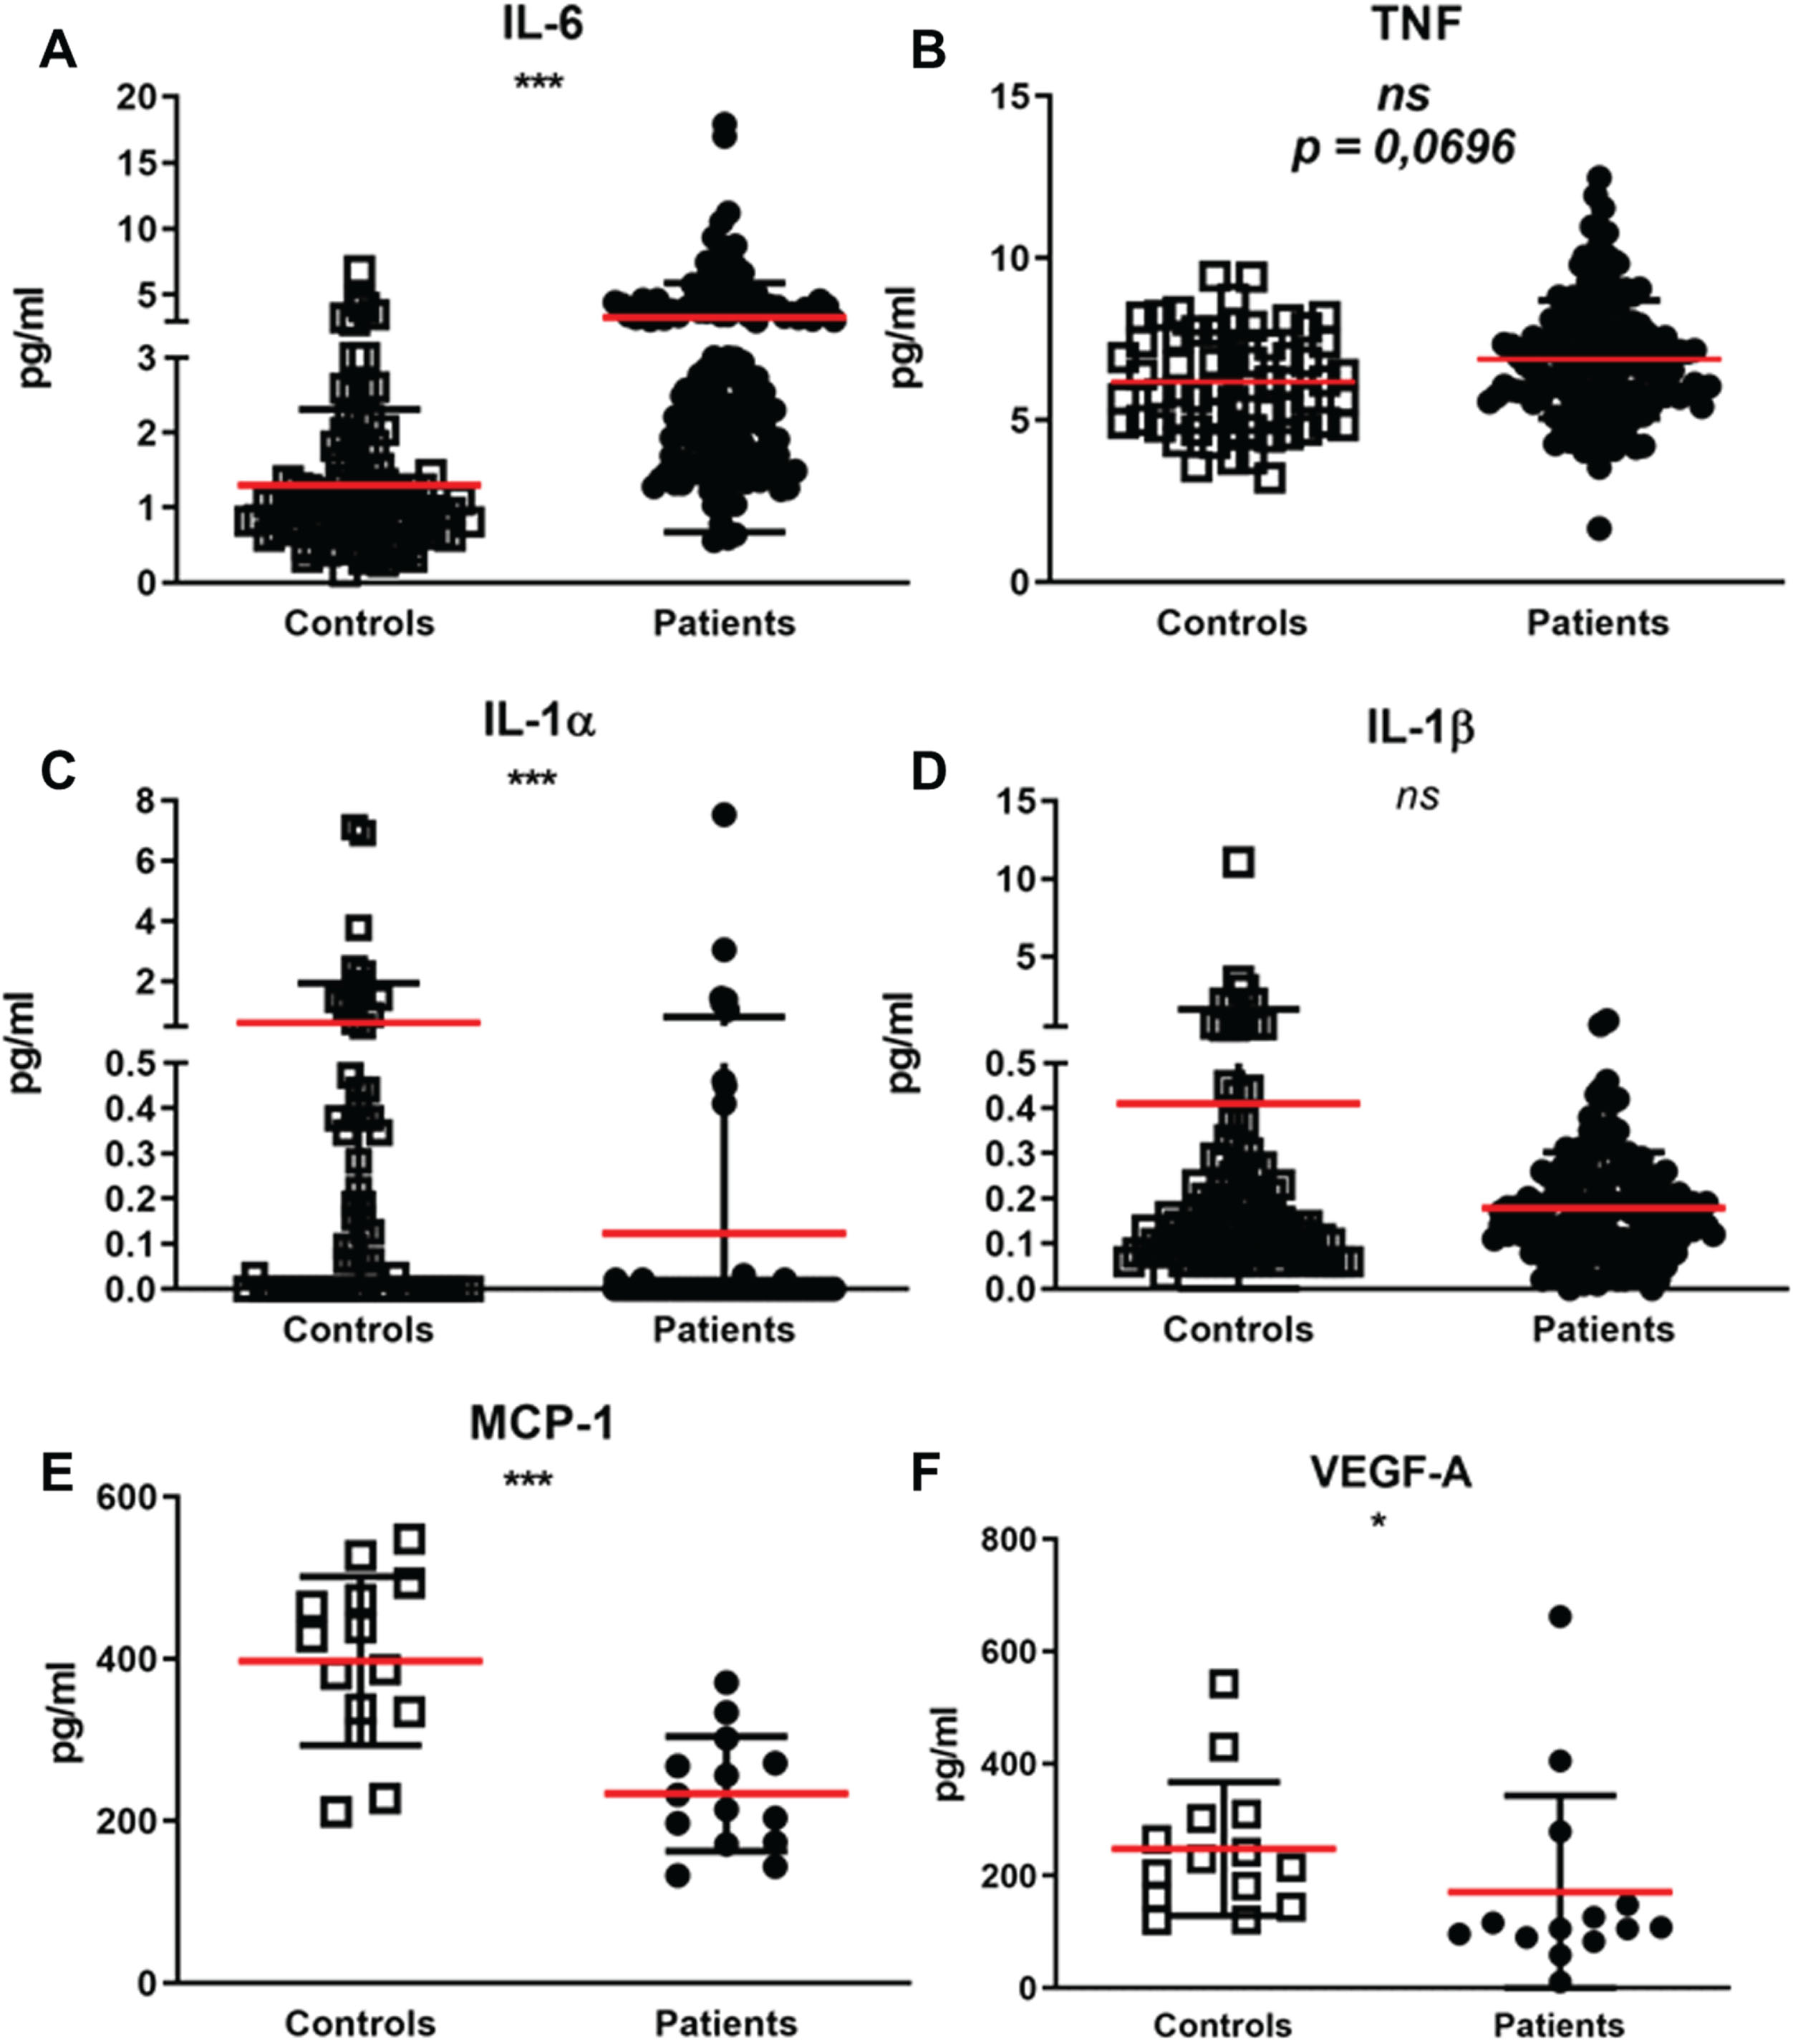
Table 2
Clinical correlations
| Correlations among circulating inflammatory markers and demographic and clinical features | |||||||
| sIL-6 | sTNF | sIL-1α | sIL-1β | sMCP-1 | sVEGF-A | ||
| Age | rs | 0.318** | 0.097 | –0.039 | –0.240* | 0.064 | 0.278 |
| Gender | rs | –0.200 | 0.173* | –0.126 | –0.045 | –0.322 | –0.322 |
| BMI | rs | 0.313** | 0.051 | 0.040 | –0.039 | 0.059 | –0.033 |
| Disease duration | rs | 0.329** | 0.171 | 0.108 | –0.049 | –0.220 | 0.262 |
| D4Z4 repeat unit | rs | 0.154 | 0.065 | 0.019 | 0.020 | 0.106 | –0.249 |
| Ricci Score | rs | 0.338** | 0.068 | 0.083 | –0.040 | –0.138 | 0.571* |
| Lamperti Score | rs | 0.298** | 0.137 | 0.118 | –0.024 | –0.270 | 0.525 |
| MRC Sum Score | rs | –0.310** | –0.187* | –0.089 | 0.029 | 0.033 | –0.782** |
| Correlations among the cytokine capacity of LPS restimulated trained monocytes of FSHD patients and demographic and clinical features | |||||||
| IL-6 (–) LPS | IL-6 (+) LPS | TNF (–) LPS | TNF (+) LPS | ||||
| Age | rs | 0.349 | 0.629* | 0.393 | 0.432 | ||
| Gender | rs | 0.000 | –0.062 | 0.278 | 0.124 | ||
| BMI | rs | 0.261 | –0.025 | –0.043 | –0.108 | ||
| Disease duration | rs | 0.307 | 0.440 | 0.411 | 0.47 | ||
| D4Z4 repeat units | rs | 0.207 | 0.510 | 0.356 | 0.727** | ||
| Ricci Score | rs | 0.089 | 0.073 | 0.148 | –0.135 | ||
| Lamperti Score | rs | 0.167 | 0.124 | 0.048 | –0.143 | ||
| MRC Sum Score | rs | 0.030 | 0.218 | 0.220 | 0.526* | ||
| Correlation among the cytokine capacity of TLRs ligands stimulated NK Cells of FSHD patients and demographic and clinical features | |||||||
| IL-6 LPS | IL-6 P3C | IL-6 CANDIDA | TNF LPS | TNF P3C | TNF Candida | ||
| Age | rs | 0.276 | 0.231 | 0.167 | 0.102 | 0.201 | 0.127 |
| Gender | rs | 0.265 | 0.155 | 0.320* | 0.165 | 0.159 | 0.242 |
| BMI | rs | 0.095 | 0.034 | 0.048 | –0.124 | –0.220 | –0.062 |
| Disease duration | rs | 0.160 | 0.211 | 0.116 | 0.154 | 0.229 | 0.123 |
| D4Z4 repeat units | rs | –0.098 | –0.056 | –0.172 | –0.038 | –0.170 | –0.183 |
| Ricci Score | rs | 0.506** | 0.479** | 0.377* | 0.400* | 0.391* | 0.407* |
| Lamperti Score | rs | 0.491** | 0.483** | 0.430** | 0.401* | 0.380* | 0.435** |
| MRC Sum Score | rs | –0.422** | –0.438** | –0.363* | –0.304 | –0.265 | –0.310 |
LPS = stimulation with lipopolysaccharides; P3C = stimulation with Pam3Cys; Candida = stimulation with C. albicans heat killed. (–) LPS restimulated monocytes, RPMI trained. (+) LPS restimulated macrophages derived monocytes, β-glucan trained. rs = spearman’s rho correlation coefficient. *Correlation is significant at the 0.05 level (2-tailed). **Correlation is significant at the 0.01 level (2-tailed).
Patients with FSHD and healthy subjects have comparable circulating immune cell compositions
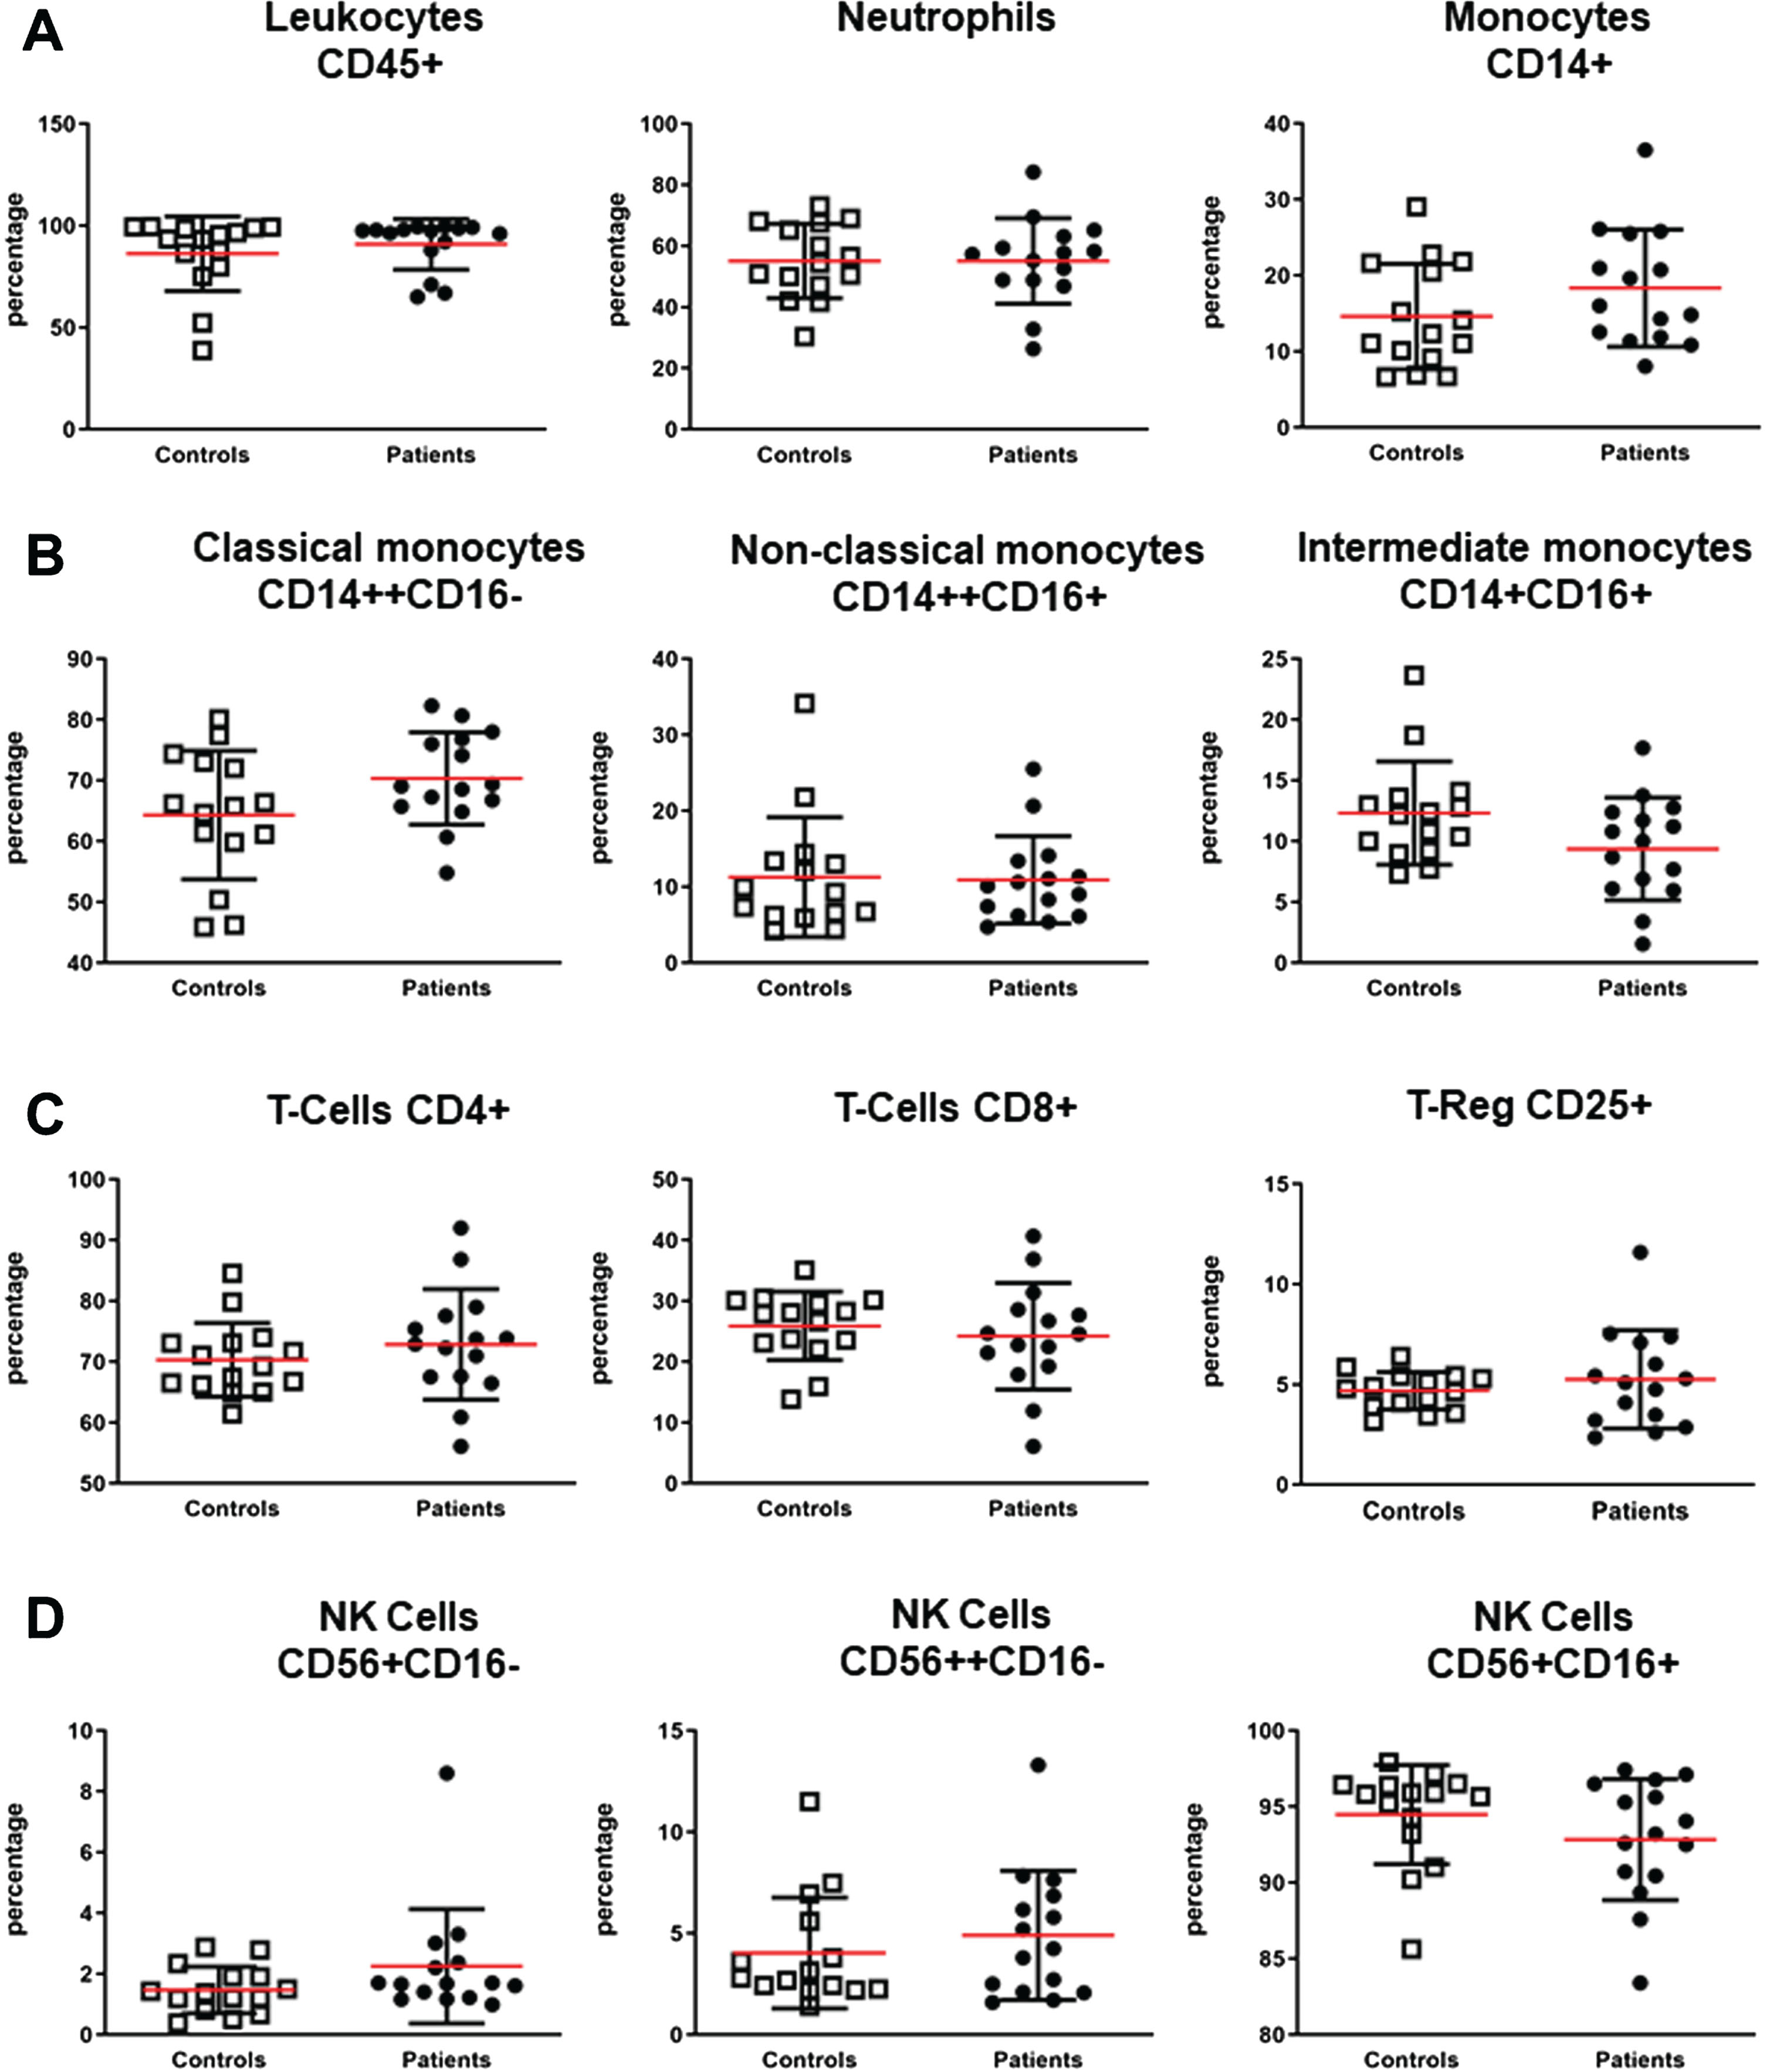
To study whether a different immune cell composition was responsible for the increased serum concentration of IL-6 and TNF in patients with FSHD, whole blood flow cytometry analysis was performed in 15 FSHD patients and 15 healthy controls. Flow cytometry analyses of peripheral blood samples of a subset of patients with FSHD and matched healthy controls revealed no significantly different percentages of all measured cells: leukocytes (CD45+), neutrophils, total monocytes (CD14+), classical monocytes (CD14++CD16–), non-classical monocytes (CD14++CD16+), intermediate monocytes (CD14+CD16+), total B cells (CD19+), total T cells (CD3+CD56–), T cells subsets (CD4+ and CD8+ respectively), regulatory T cells (CD4+ CD25+), NKT cells (CD3+CD56+), and NK cells subsets (CD56+CD16–, CD56++CD16–, CD56+CD16+) (Fig. 3).
Fig. 3
Whole blood immunophenotyping. EDTA blood samples of 15 patients with FSHD and 15 sex and age matched healthy controls were stained for 30 minutes in dark at 4°C with the following fluorophore-conjugated antibodies cocktail: CD45, CD14, CD16, CD3, CD56, CD19, CD4, CD8, CD25. Samples were analysed on a 10-color Navios flow cytometer (Beckman Coulter). (A) Mean±SD of percentages of total leukocytes (CD45+), total neutrophils, and total monocytes (CD14+). (B) Mean±SD of classical (CD14++CD16–), non-classical (CD14++CD16+), and intermediate monocytes (CD14+CD16+). (C) Mean±SD of T-Cells CD4+, T-Cells CD8+, and T-Cells CD25+ (T-Reg). (D) Mean±SD of NK CD56+CD16–, CD56++CD16–, and CD56+CD16+. Groups were compared with the non-parametric Mann Whitney test.
However, since monocytes and NK cells are a major source of IL-6 and TNF and are known to gain immune memory after repeated stimulation, these innate immune cells were selected for further investigation of cytokine production capacity.
β-glucan-induced trained immunity in monocytes and NK cells of patients with FSHD
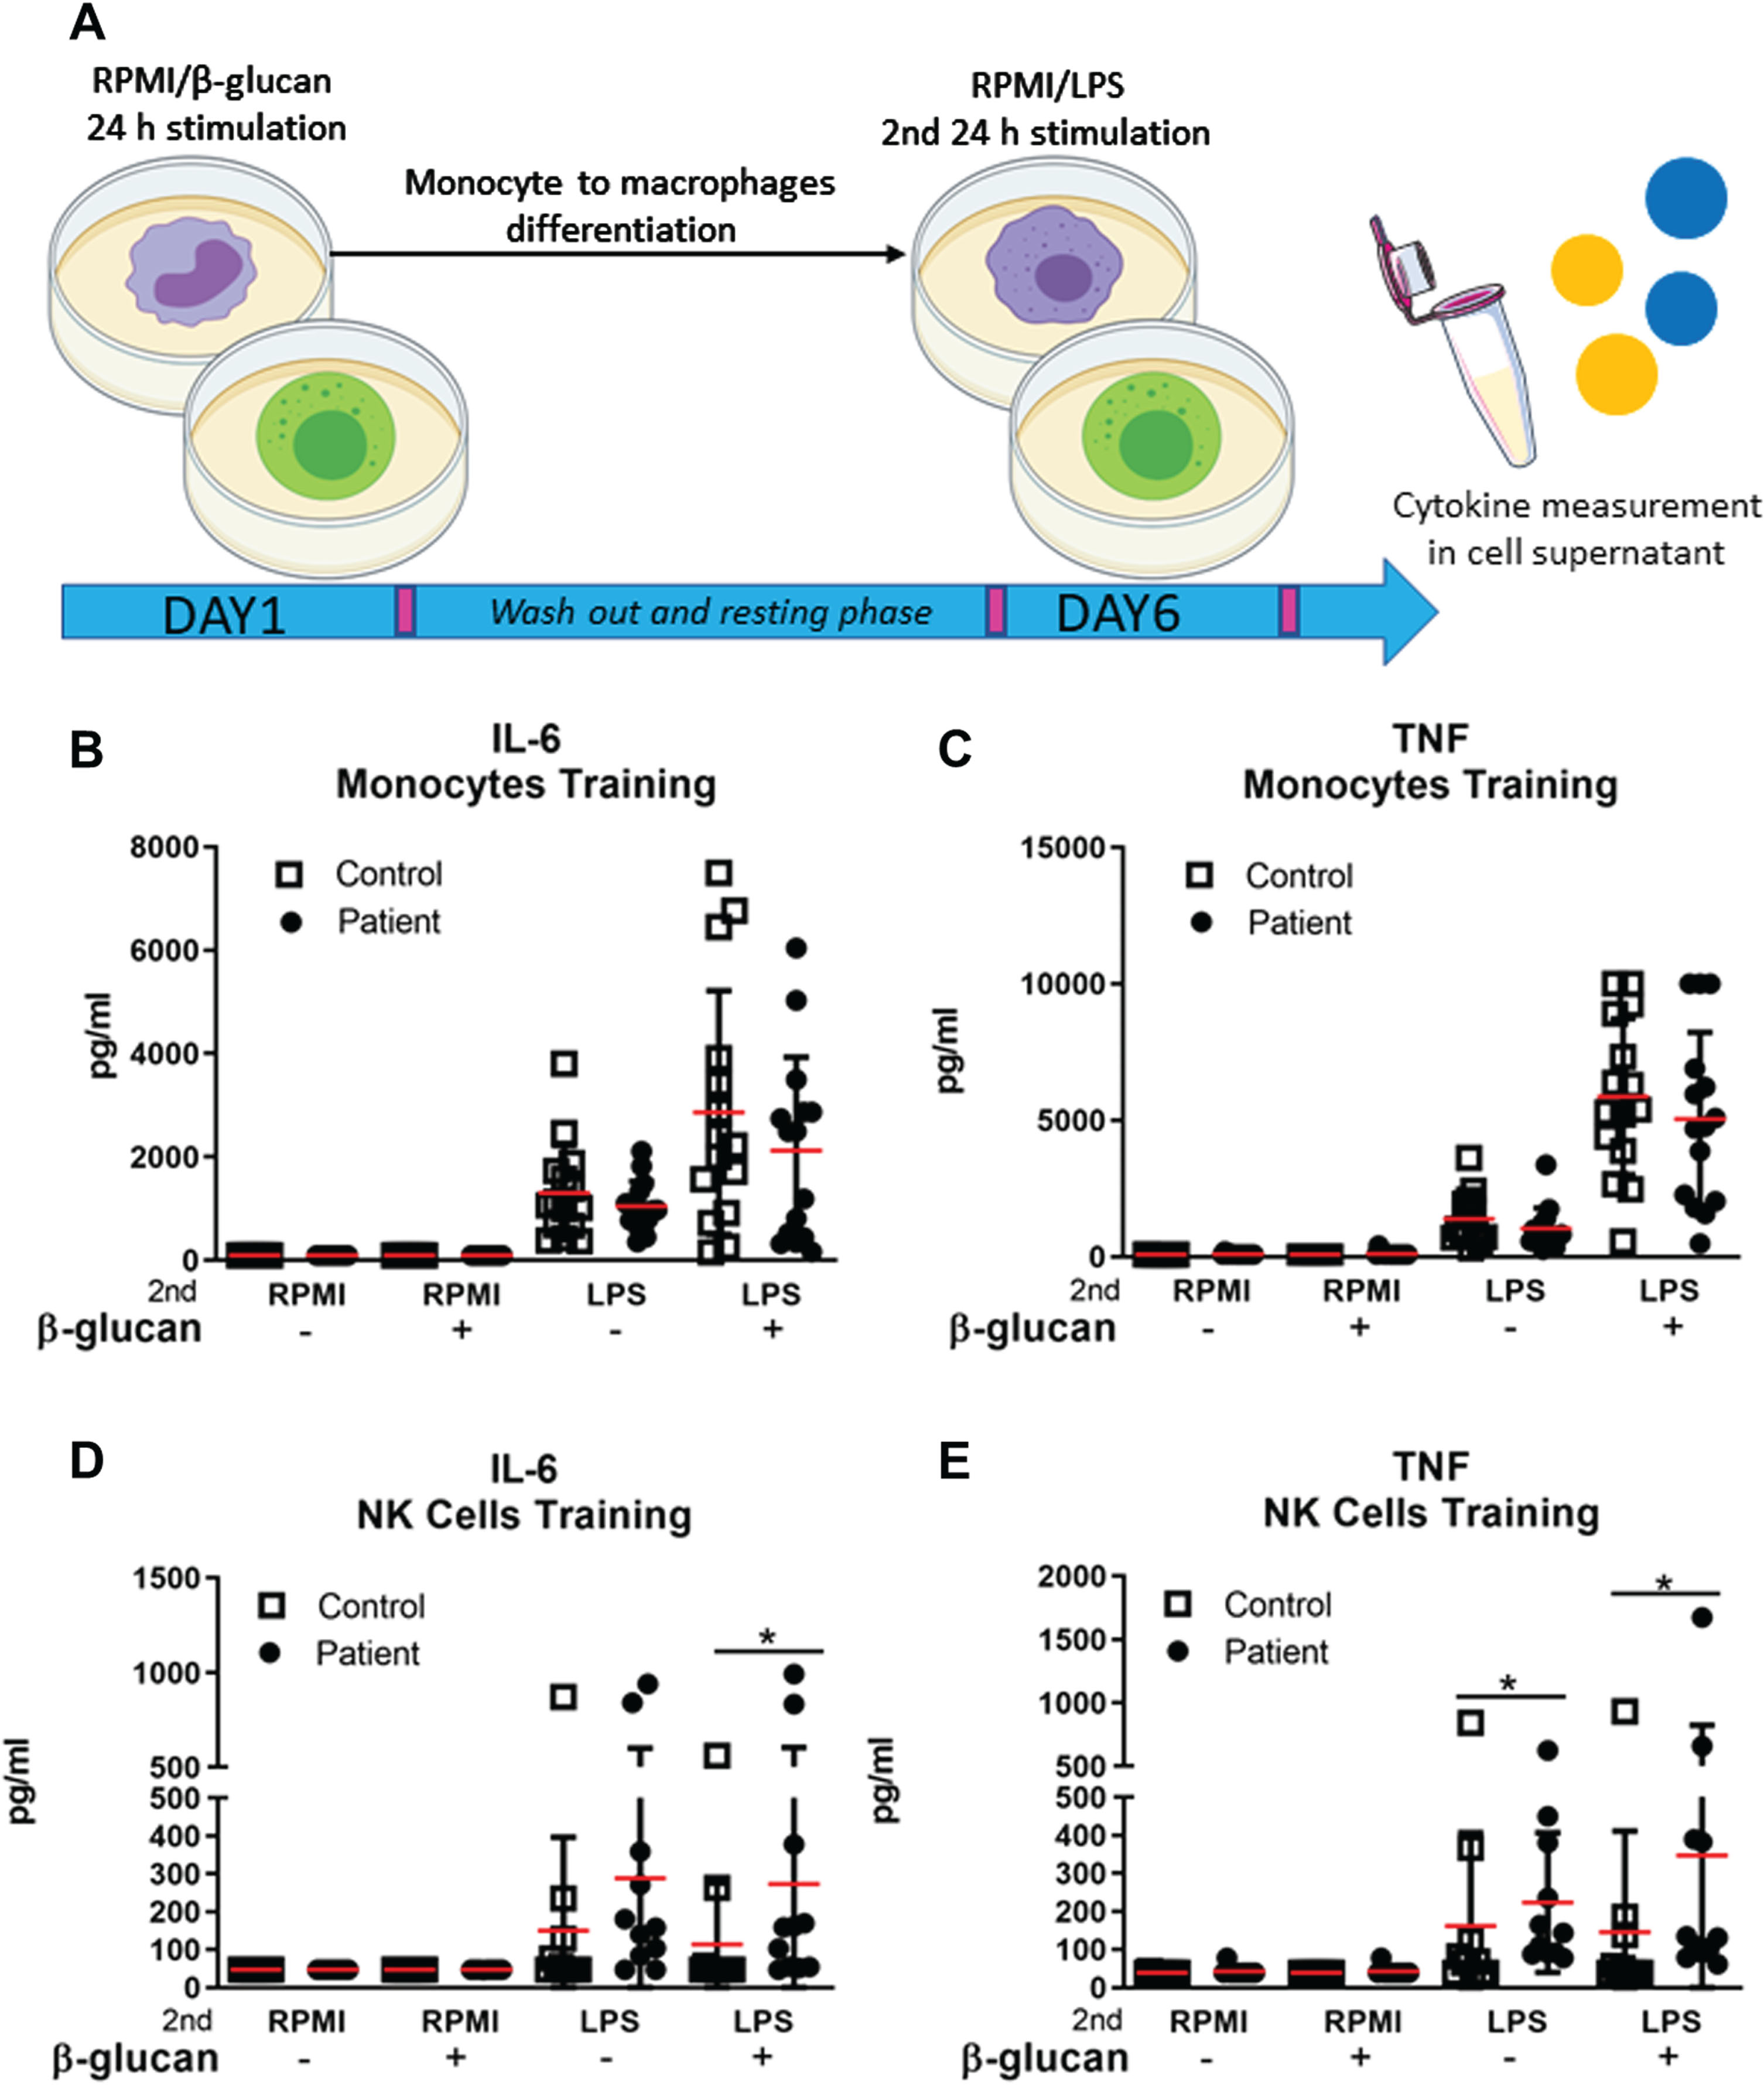
Since long term repeated stimulation of innate immune cells such as monocytes and NK cells can elicit the hyperproduction of inflammatory cytokines, we investigated whether trained immunity could explain the increased serum concentration of IL-6 and TNF in patients with FSHD. Monocytes of 15 FSHD patients and 15 healthy controls and NK cells of 11 FSHD patients 11 sex and age matched healthy controls were exposed to the training inducer β-glucan for 24 hours and restimulated at day 6 with lipopolysaccharide (LPS) (Fig. 4A). IL-6 and TNF production was evaluated after 24 hours of restimulation with LPS. IL-6 and TNF production of trained monocytes of both patients and controls did not differ significantly (Fig. 4B-C). NK cells from patients with FSHD produced a higher amount of IL-6 and TNF after the secondary LPS challenge compared to NK cells from healthy subjects (Fig. 4D-E). An overview of raw and adjusted p-values after Bonferroni correction is available in Supplementary Table 3. IL-6 production by trained monocytes correlated with age both in the patient group (rs = 0.629) (Table 2) and in the control group (rs = 0.683) (Supplementary Table 1).
Fig. 4
Ex vivo β-glucan induction of trained immunity in monocytes and NK cells of patients with FSHD and sex and age matched healthy controls. (A) Monocytes and NK cells of patients with FSHD and healthy controls were trained with RPMI (–), taken as negative control, or β-glucan (+) for 24 hours. On day 6, monocytes differentiated into macrophages and NK cells were secondary stimulated with either RPMI or LPS for 24 hours. (B-C) Mean±SD of IL-6 and TNF concentration (pg/ml) measured in the supernatant of LPS restimulated monocytes derived macrophages of 15 patients with FSHD and 15 sex and age matched healthy controls. (D-E) Mean±SD of IL-6 and TNF concentration (pg/ml) measured in the supernatant of LPS restimulated NK cells of 11 patients with FSHD and 11 sex and age matched healthy controls. Groups were compared with the non-parametric Mann Whitney test. The obtained raw p-values were adjusted after multiple correction with Bonferroni test. *p < 0,05.
NK cells of patients with FSHD produce higher IL-6 and TNF concentrations upon ex vivo exposure to TLRs ligands
After having observed that ex vivo trained NK cells of patients with FSHD produced higher amounts of IL-6 and TNF, we further explored the cytokine production capacity of NK cells of 39 FSHD patients and 22 healthy controls in response to a 24 hours challenge with different Toll Like Receptors (TLRs) ligands: LPS, Pam3Cys (P3C), and heat killed Candida albicans (C. albicans) (Fig. 5–1). NK cells from patients with FSHD produced higher amount of IL-6 in response to LPS, P3C, and C. albicans compared to NK cells from healthy controls (Fig. 5A). In addition, NK cells from patients with FSHD reacted to both LPS and C. albicans challenge with a higher TNF secretion compared to NK cells from healthy subjects (Fig. 5A). An overview of raw and adjusted p-values after Bonferroni correction is available in Supplementary Table 4. IL-6 production after LPS, P3C, and C. albicans stimulation had a mild correlation with disease severity and with muscle weakness. Similarly, we observed a mild association between TNF production and disease severity (Table 2).
Fig. 5
NK cells 24 h ex vivo TLRs ligands stimulation and cytotoxicity activity. (A) Graphical representation of experimental set-up. 1) NK cells of 39 patients with FSHD and 22 sex and age matched healthy controls were ex vivo stimulated with RPMI (cell medium), LPS (lipopolysaccharide), P3C (Pam3Cys), and Candida (C. albicans Heat Killed) for 24 hours. 2) As a second step, NK cells cytotoxicity assay was performed in a subset of 7 patients with FSHD and 7 sex and age matched healthy controls. NK/K562 target ratio 1:1 and NK/K562 target ratio 2:1 was stained with Ann V, PI, CD107a, and Granzyme B after 4 hours of co-incubation (B) Mean±SD of IL-6 and TNF concentration (pg/ml) measured in the supernatant of TLRs stimulated NK cells. (C) Percentage of target cells showing uptake of Ann V only, PI only, and Ann/PI respectively. (D) Percentage of NK cells showing expression of CD107a and Granzyme B following stimulation with K562 cell at 1:1 ratio or stimulation with K562 cells at a 2:1 ratio Groups were compared with the non-parametric Mann Whitney test. The obtained raw p-values were adjusted after multiple correction with Bonferroni test. *p < 0,05; **p < 0,005.
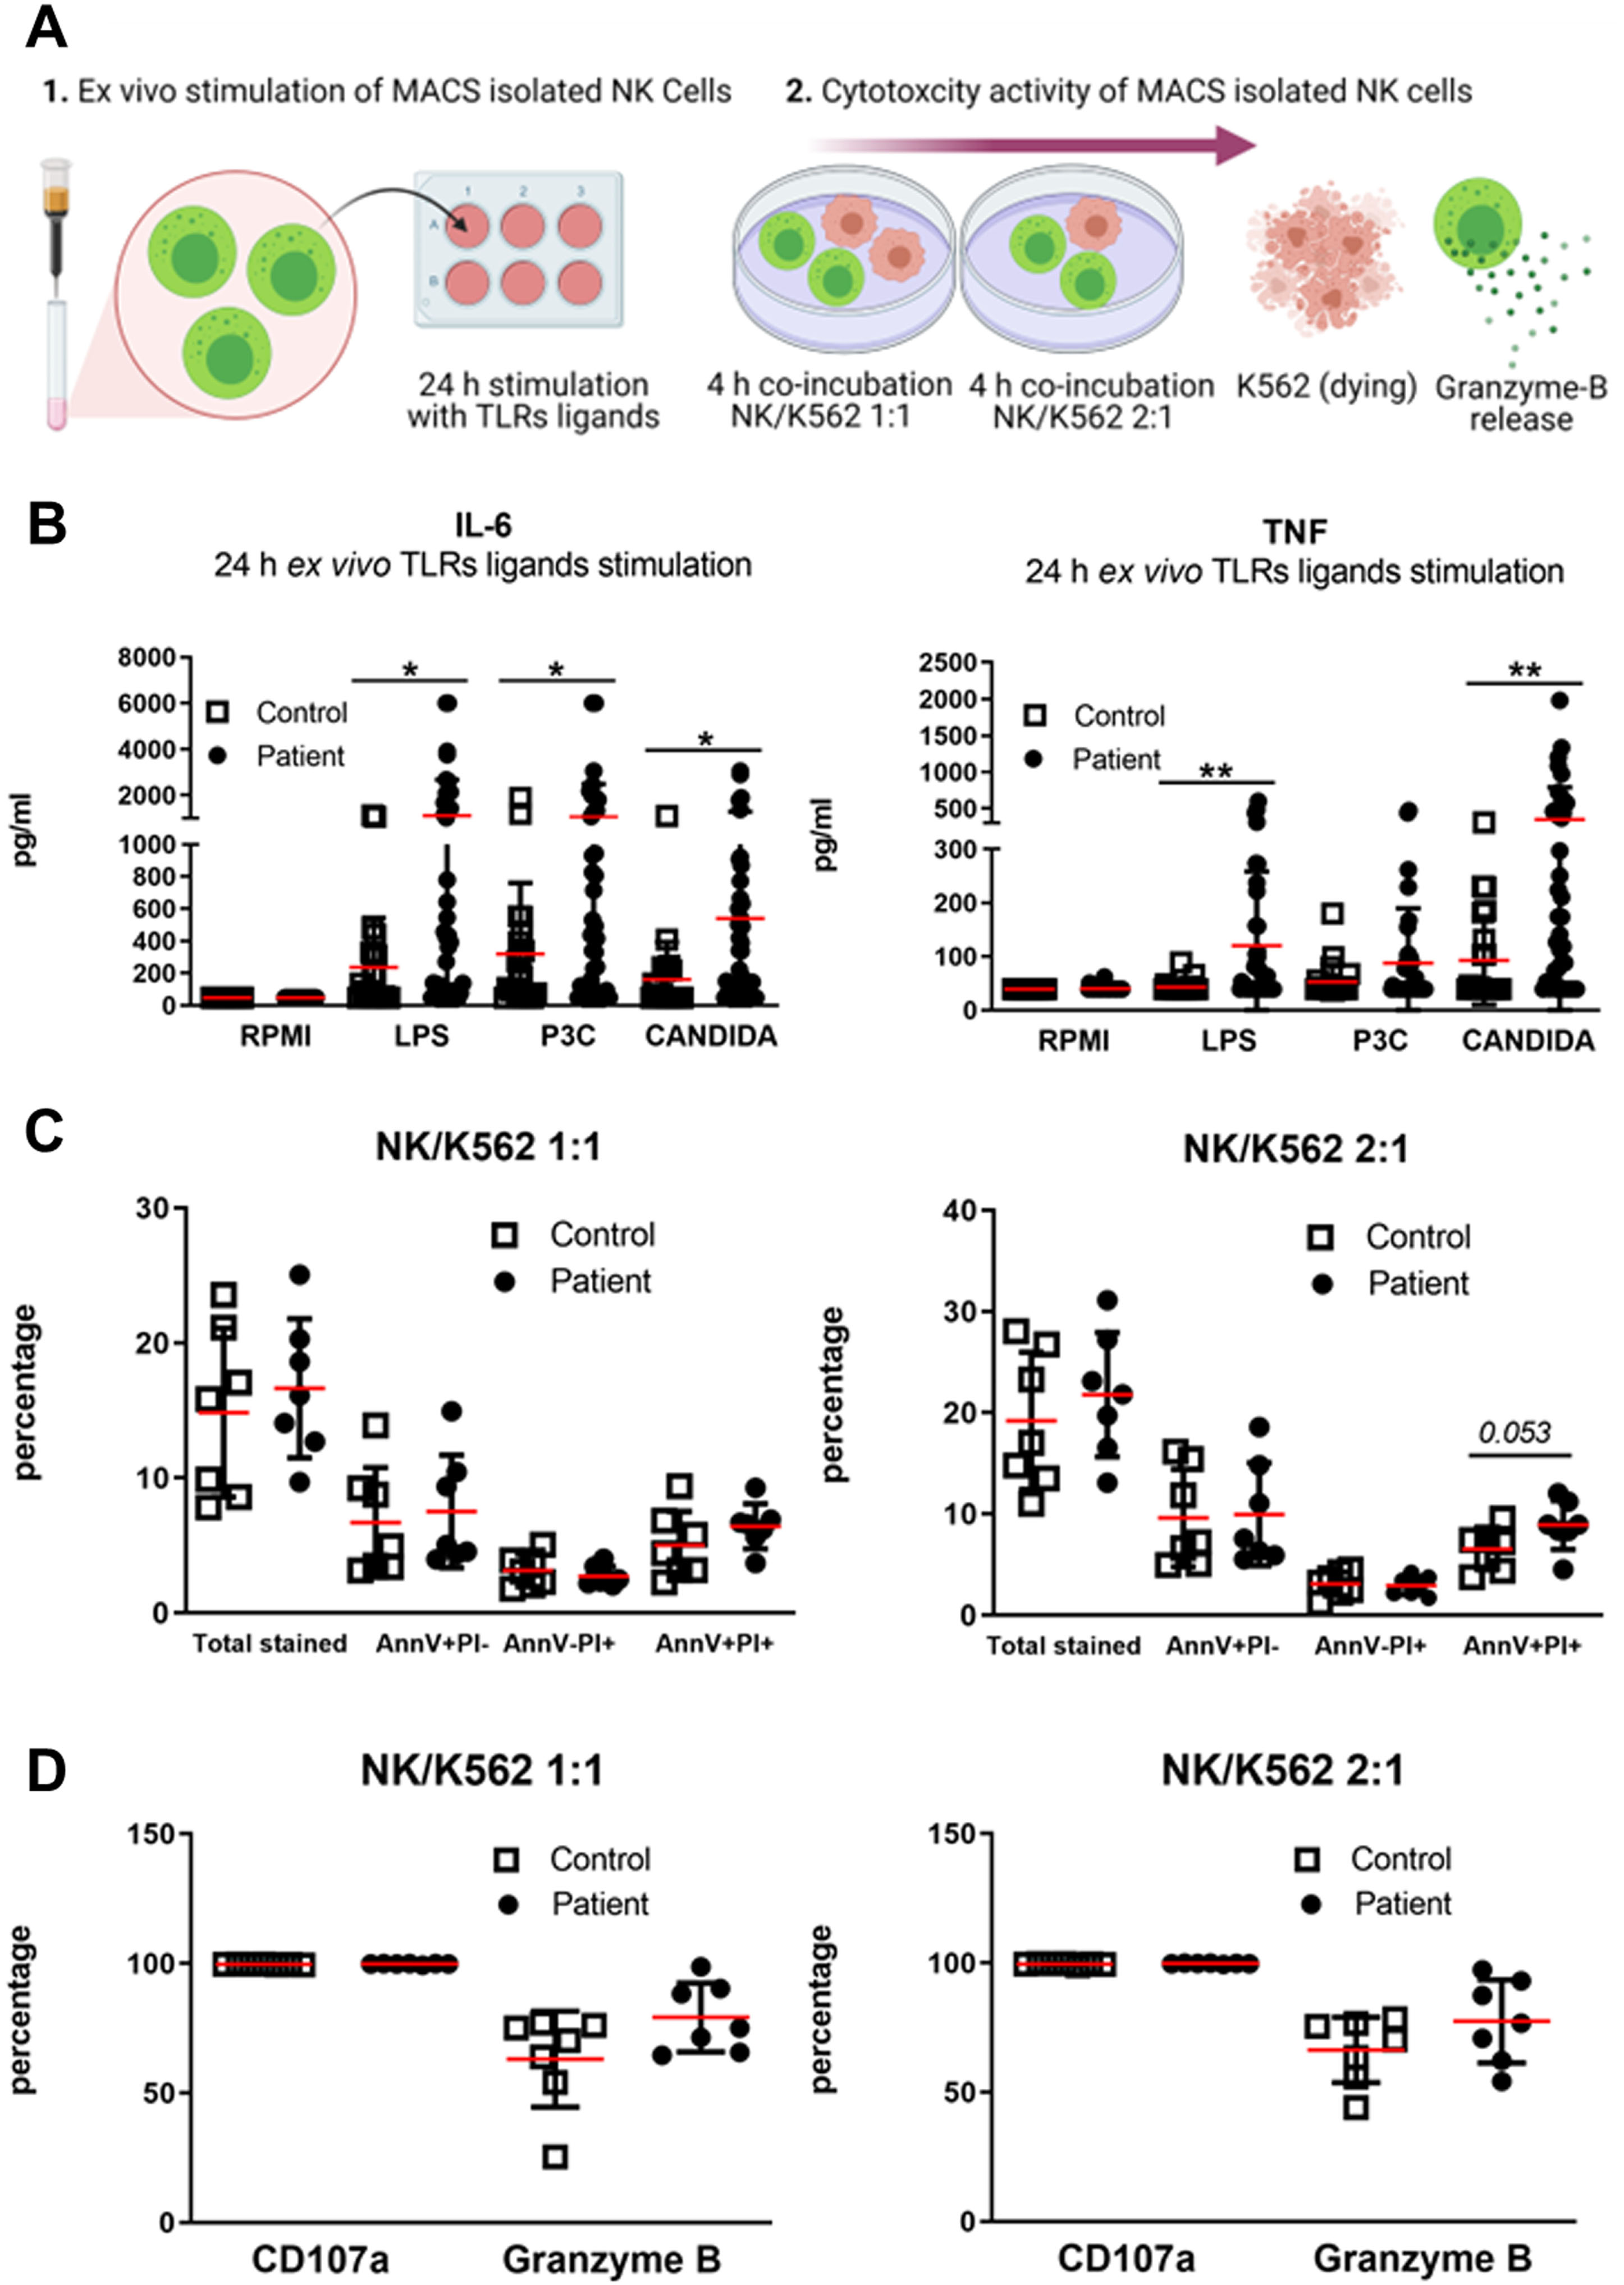
3.6NK cells cytotoxic activity of patients with FSHD
NK cells are cytokine secreting cells as well as cytotoxic cells. Therefore, we further explored the cytotoxicity of NK cells isolated from 7 FSHD patients and 7 healthy controls. We incubated NK cells of both patients and controls with K562 cells, tumor cells which are known to be sensitive to the killing capacity of NK cells (Fig. 5–2). The AnnexinV (AnnV) and Propidium Iodide (PI) staining (markers of early and late apoptosis respectively) (Fig. 5C) did not reveal any significant statistical difference between K562-targeted cells by FSHD NK cells and by HC NK cells. Moreover, there was no difference in release of granzyme-B from NK cells of FSHD patients and of healthy controls, (Fig. 5D).
TIRM-positive FSHD muscles produce higher IL-6 and TNF amounts compared to TIRM–negative FSHD muscles and healthy control muscle specimens
Finally, the higher concentrations of IL-6 and TNF in the circulation as well as upon ex vivo stimulation of monocytes and NK cells triggered us to investigate the production of IL-6 and TNF by skeletal muscle cells. Thus, pairs of FSHD TIRM-positive (Fig. 6A1) and FSHD TIRM-negative muscle specimens of 21 FSHD patients (Fig. 6A3) as well as muscle specimens from 8 healthy controls were ex vivo stimulated with either basal medium (DMEM) or stimuli (LPS and P3C respectively) (Fig. 6). FSHD TIRM-positive muscle samples produced higher amounts of IL-6 compared with the paired FSHD TIRM-negative muscle samples (Fig. 6B). Additionally, FSHD TIRM-positive muscle samples produced higher amounts of TNF compared to both FSHD TIRM-negative muscle samples and healthy control muscle samples in response to LPS stimulation. An overview of raw and adjusted p-values after Bonferroni correction is available in Supplementary Table 5. IL-6 concentrations measured from both stimulated TIRM-positive and TIRM-negative muscle samples showed a moderate correlation with disease severity and with muscle weakness (Table 3). Finally, we observed in a preliminary immuno-histological analysis the presence of inflammatory infiltrates predominantly comprising CD3+CD8+ positive cells and CD68+ positive cells in the FSHD TIRM-positive muscle cryosections. Conversely, the corresponding FSHD TIRM-negative muscle sample of the same patient show a profile comparable with a sex and age matched healthy control muscle sample (Fig. 7).
Fig. 6
Whole muscle ex vivo stimulation. (A) Representative TIRM and DIXON MRI of a 62-year-old patient with FSHD1. (A1) MRI cross section of the right upper leg showing TIRM hyperintensity of gastrocnemius medialis. (A2) Corresponding DIXON-MRI cross section showing degree of muscle fatty infiltration. (A3) MRI cross section of the right upper leg showing TIRM normointensity of vastus lateralis. (A4) Corresponding DIXON-MRI cross section showing normal appearing muscle. The black arrow indicates the site of the TIRM+ biopsy. The white arrow indicates the site of the TIRM- biopsy. (B) Mean±SD of IL-6 and TNF concentration (pg/ml) from supernatant of 21 stimulated matched pairs of TIRM+ and TIRM–whole muscle specimens. (C) Mean±SD of IL-6 and TNF concentration (pg/ml) from supernatant of 21 ex vivo stimulated TIRM+ whole muscle specimens and 8 healthy control whole muscle specimens. (D) Mean±SD of IL-6 and TNF concentration (pg/ml) from supernatant of 21 ex vivo stimulated TIRM–whole muscle specimens and 8 HC whole muscle specimens. Groups were compared with either the non-parametric Wilcoxon matched pairs test (B) or the non-parametric Mann Whitney test (C-D). The obtained raw p-values were adjusted after multiple correction with Bonferroni test. *p < 0,05. **p < 0,005.
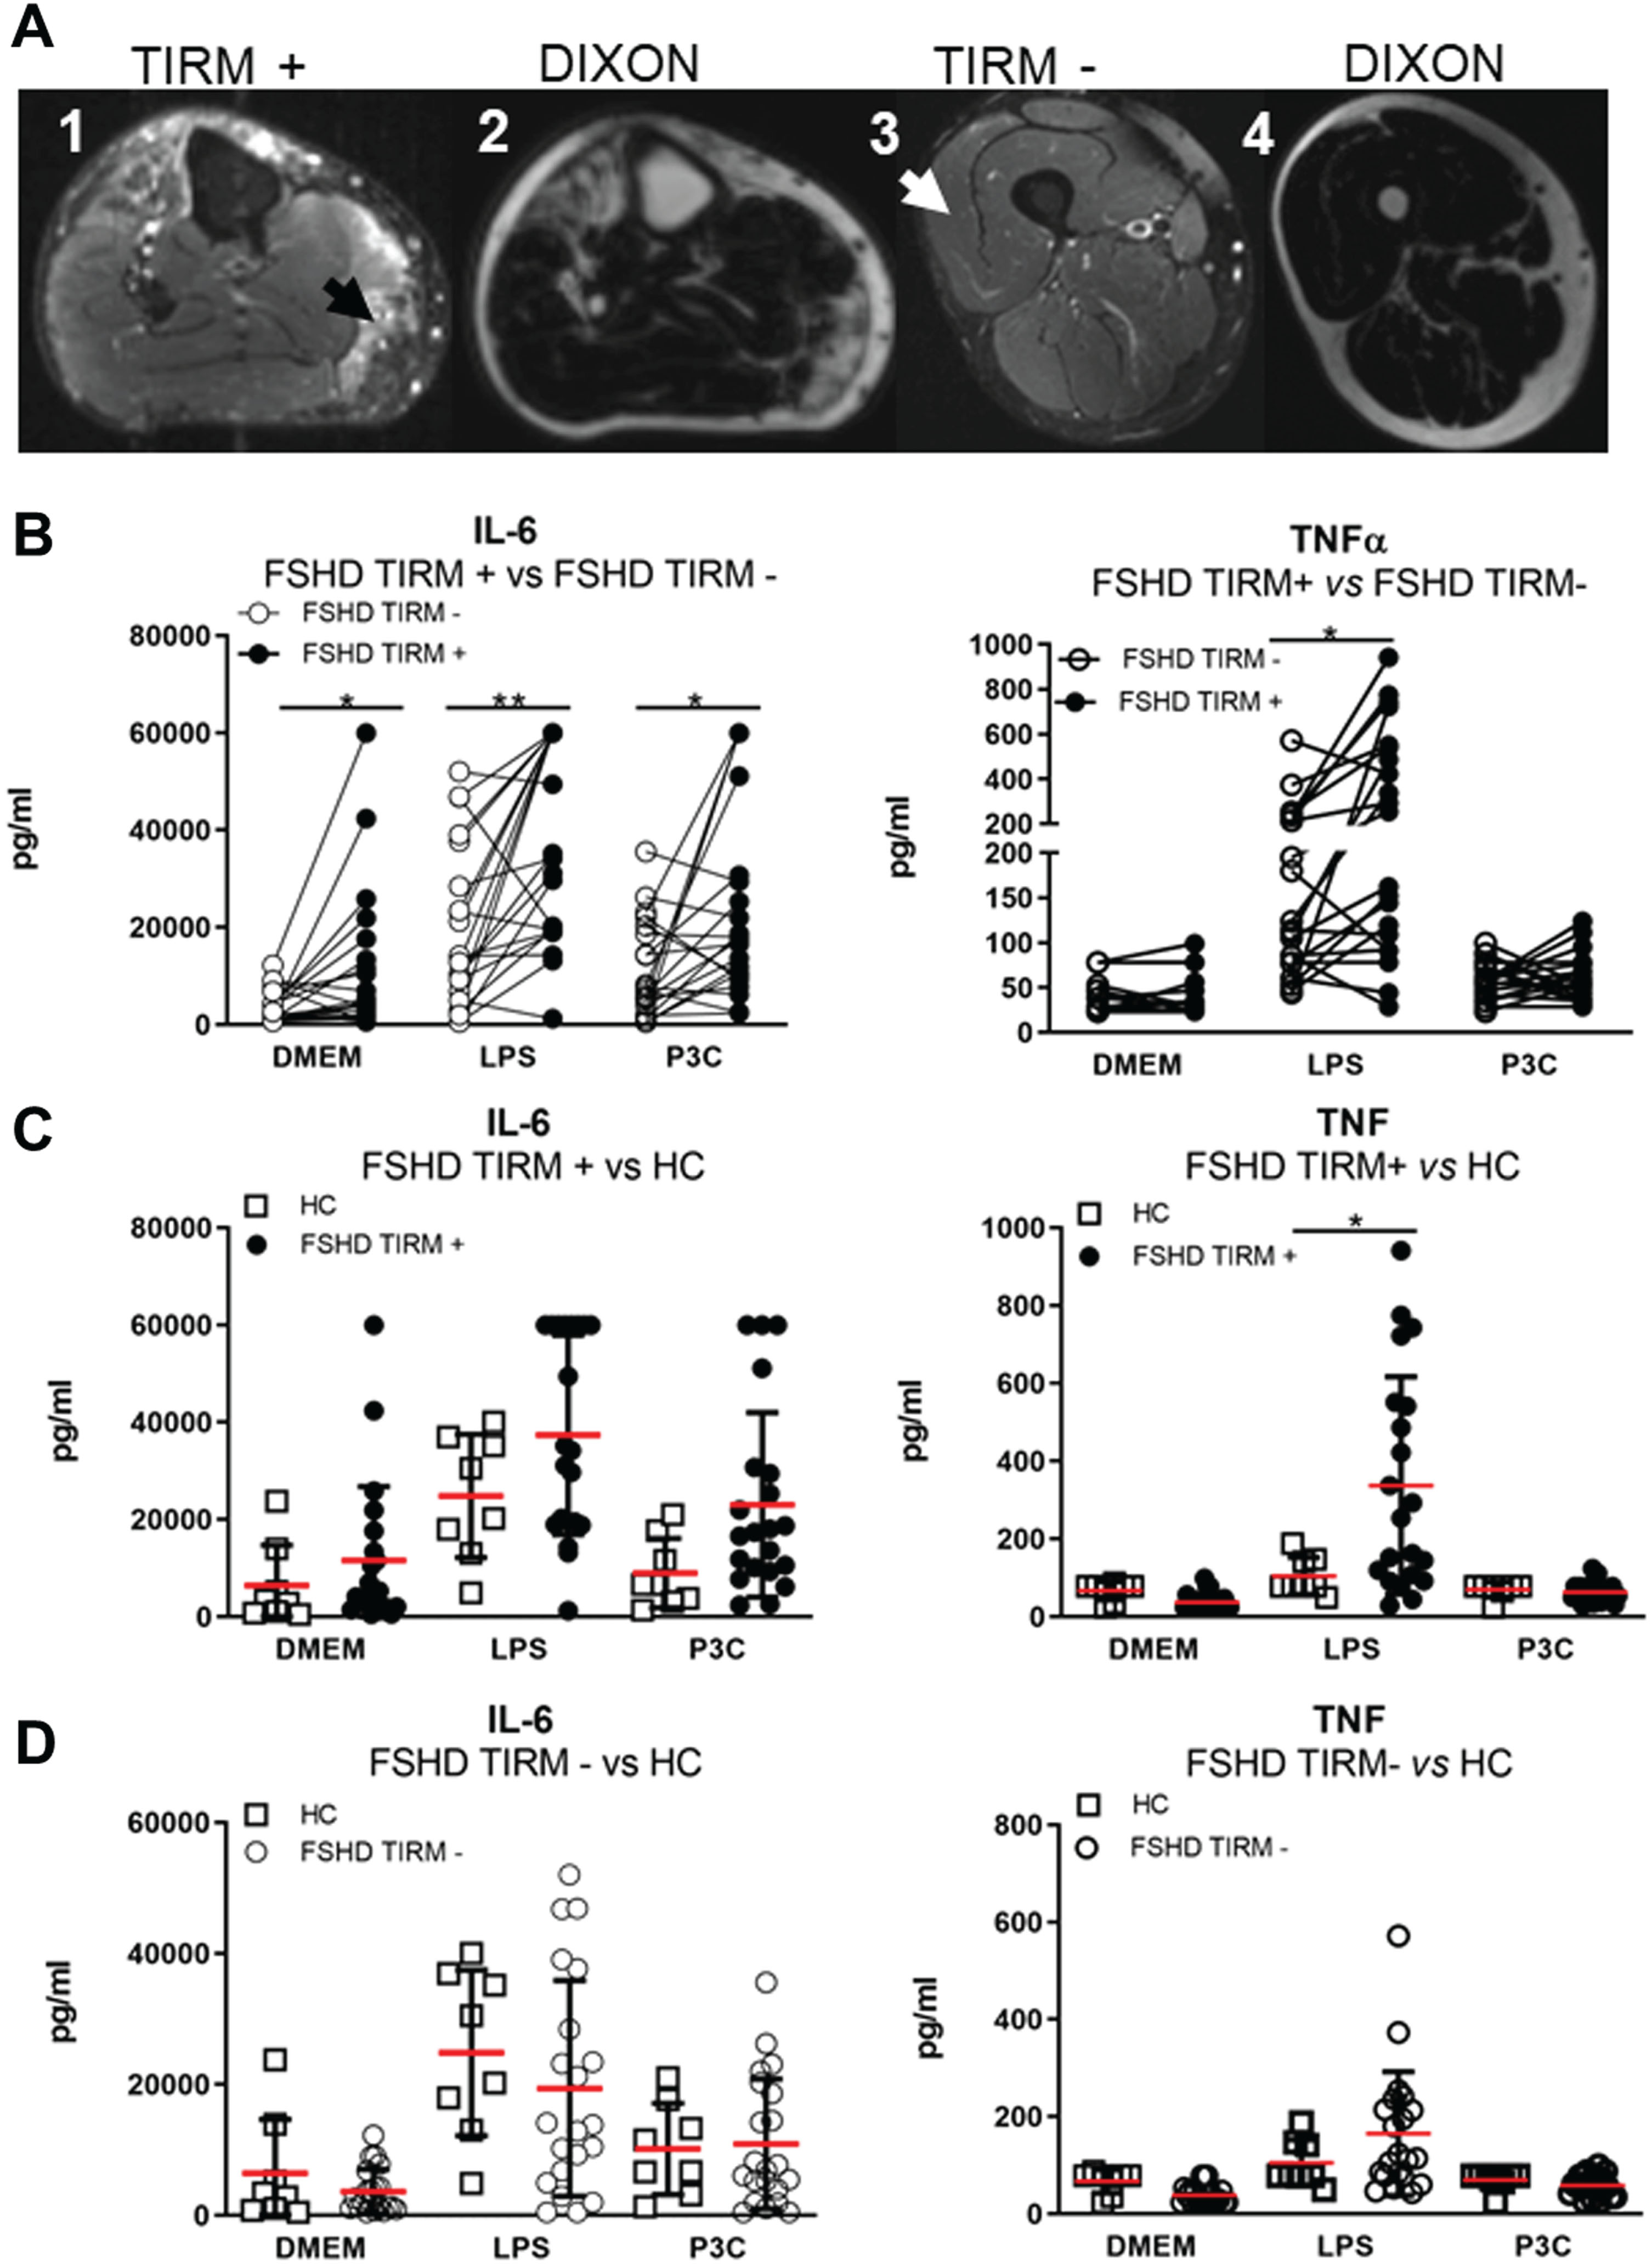
Table 3
Correlations among the cytokine capacity of FSHD patients muscle samples and demographic and clinical features
| FSHD TIRM+ | |||||||
| IL-6 | TNF | ||||||
| DMEM | LPS | P3C | DMEM | LPS | P3C | ||
| Age | rs | 0. 141 | 0.286 | 0.341 | –0.066 | 0.313 | 0.171 |
| Gender | rs | 0.032 | 0.033 | 0.112 | –0.300 | 0.110 | –0.379 |
| BMI | rs | 0.094 | –0.134 | –0.169 | –0.105 | 0.371 | –0.202 |
| Disease duration | rs | 0.216 | 0.192 | 0.150 | 0.038 | –0.059 | 0.207 |
| D4Z4 repeat units | rs | 0.079 | 0.046 | –0.031 | 0.198 | 0.055 | 0.176 |
| Ricci Score | rs | 0.195 | 0.247 | 0.278 | 0.044 | 0.124 | 0.195 |
| Lamperti Score | rs | 0.386 | 0.435* | 0.502* | –0.142 | 0.538* | –0.105 |
| MRC Sum Score | rs | –0.323 | –0.300 | –0.451* | –0.065 | –0.241 | –0.160 |
| FSHD TIRM- | |||||||
| IL-6 | TNF | ||||||
| DMEM | LPS | P3C | DMEM | LPS | P3C | ||
| Age | rs | 0.472* | 0.412 | 0.324 | 0.012 | 0.323 | 0.041 |
| Gender | rs | 0.461* | 0.103 | 0.215 | 0.025 | 0.315 | 0.103 |
| BMI | rs | 0.053 | 0.386 | 0.252 | 0.300 | 0.053 | 0.195 |
| Disease duration | rs | 0.013 | –0.079 | 0.134 | 0.202 | 0.012 | 0.203 |
| D4Z4 repeat units | rs | –0.104 | 0.008 | 0.079 | 0.476* | 0.945 | 0.028 |
| Ricci Score | rs | 0.273 | 0.320 | 0.742** | 0.173 | 0.103 | 0.212 |
| Lamperti Score | rs | 0.298 | 0.585** | 0.654** | –0.152 | 0.473* | 0.018 |
| MRC Sum Score | rs | –0.125 | –0.493* | –0.741** | –0.152 | –0.300 | –0.133 |
IL-6 and TNF production from TIRM+ and TIRM–muscle samples of FSHD patients ex vivo stimulated with DMEM (culture medium), LPS (lipopolysaccharides), and P3C (Pam3Cys) for 24 hours. rs = spearman’s rho correlation coefficient. *Correlation is significant at the 0.05 level (2-tailed). **Correlation is significant at the 0.01 level (2-tailed).
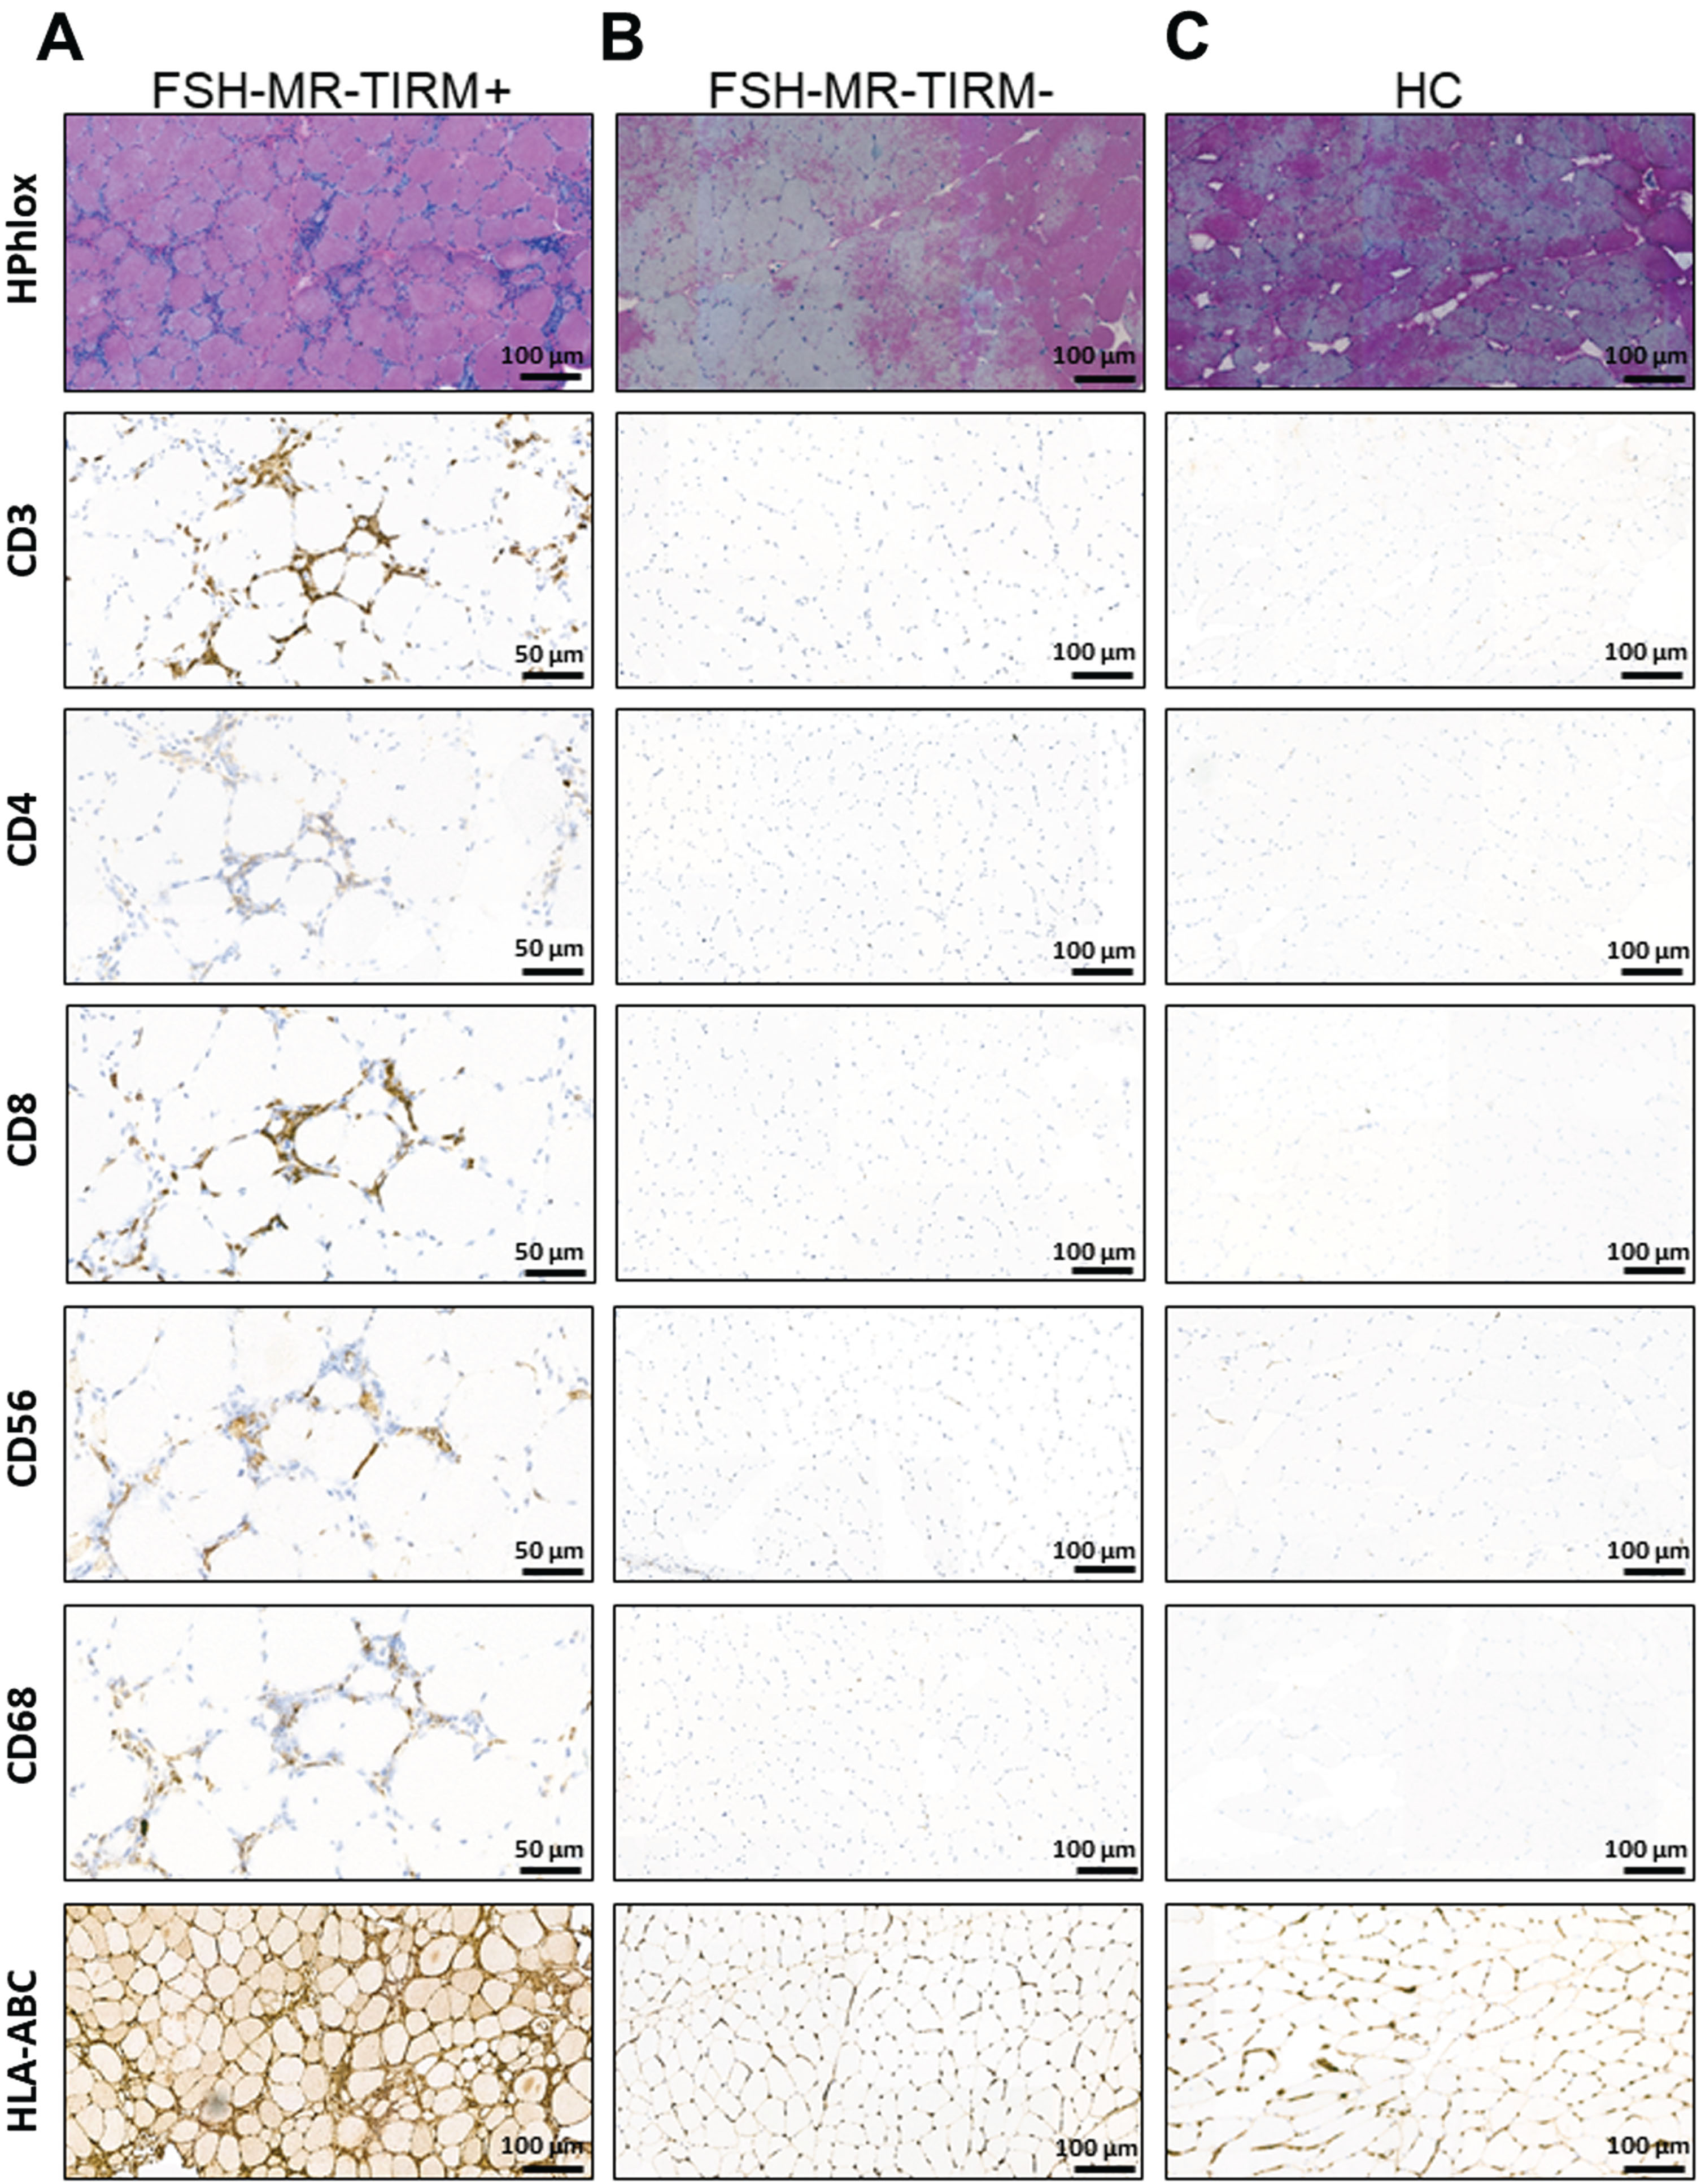
Fig. 7
Representative immuno-histological analysis of muscle biopsies. (A) HPhlox staining and immunostaining (CD3, CD4, CD8, CD56, CD68, and HLA-ABC respectively) of serial muscle cryo-sections from a TIRM+ MRI guided muscle biopsy of a 62-year-old patient with FSHD1. The HPhlox staining shows the variability of the fiber size along the section, increased central internal nuclei, the presence of few regenerating fibers, mild local fibrosis and perivascular inflammatory infiltrates. Immunostaining shows that inflammatory infiltrates comprised predominantly CD3, CD8, and CD68 positive cells. CD56 positive cells can be also appreciated at the same inflammatory sites. The staining for HLA-ABC shows evident upregulation. (B) Representative HPhlox and immunostaining (CD3, CD4, CD8, CD56, CD68, and HLA-ABC respectively) of serial muscle cryo-sections from the corresponding TIRM–MRI guided muscle biopsy of the same patient. The HPhlox staining shows normal findings and no muscular dystrophic changes. Along with a normal muscle histology, no inflammatory infiltrates were detected on additional immunostaining and no HLA-ABC upregulation was appreciated. (C) Representative HPhlox and immunostaining (CD3, CD4, CD8, CD56, CD, and HLA-ABC respectively) of serial muscle cryo-sections from a needle muscle biopsy of a sex and age matched healthy control showing normal findings and no inflammation.
DISCUSSION
In this study we show that: (a) circulating IL-6 concentrations is elevated in patients with FSHD, (b) NK cells are hyperactivated in patients with FSHD resulting in higher production of IL-6 and TNF, and (c) muscle MR-TIRM positive FSHD muscle specimens have an enhanced IL-6 and TNF production.
Our results support the evidence that inflammation is a driving feature in FSHD pathology and are in line with previous observations. Turki et al. [33] found a higher serum concentration of IL-6 and TNF in a group of 15 FSHD patients compared to 9 healthy controls. Frisullo et al. [9]. investigated the spontaneous production of inflammatory cytokines in PBMCs of 25 FSHD patients and 15 healthy controls and reported a higher production of inflammatory cytokines (IL-6, TNF, and others) in the patient group. A study conducted by Gros et al. [34] also pointed IL-6 as a relevant disease biomarker in FSHD. The authors found significantly higher IL-6 serum levels in FSHD patients than in controls and they also found an association between IL-6 levels and disease severity. IL-6 is a cytokine produced by a variety of cell types including monocytes, NK cells, muscle cells, adipocytes, and fibroblasts [35]. It has a plethora of functions crucial to host defence covering immune, hematopoietic, and inflammatory activities [35]. In addition, IL-6 acts as a myokine as well [36], being actively produced by contracting skeletal muscle cells [37]. However, persistent IL-6 production has been correlated with weakness and wasting of muscles [38–40]. Our results support the clinical relevance of IL-6 in FSHD patients since this cytokine was significantly associated with FSHD duration, FSHD severity, and muscle weakness (see Table 2). These results support the hypothesis of a clinically relevant association between FSHD pathology and the inflammatory cytokine IL-6, which might be proposed as a biomarker of FSHD progression and severity and as a possible druggable target.
We observed a slight increase of TNF serum concentration in the patient group, but after multiple correction with Bonferroni test we did not observe anymore a statistical difference. However, it is well known that TNF is a pro-inflammatory cytokine also found to be expressed in skeletal muscles as well [41]. Interestingly, Banerji et al. proposed that TNF may be increased in FSHD due to reactive oxygen species (ROS) accumulation and that TNF itself could trigger ROS production alimenting deleterious positive feedback ultimately leading to muscle cell death [42]. We found that circulating TNF concentrations negatively correlate with muscle strength in the patient group. This finding may be relevant and may provide further support to the relationship between muscle weakness and wasting and inflammatory cytokines in FSHD [43].
Importantly, our results show, and to our knowledge for the first time, that the FSHD-related IL-6 and TNF increase may derived from NK cells.
In contrast with Turki’s findings (27), we did not detect increased serum concentrations of IL-1α and IL-1β in FSHD patients (Fig. 2C–D) despite a larger sample size. IL-1α and IL-1β are two innate cytokines belonging to the IL-1 superfamily and with a critical role in sterile inflammation [44]. Several blocking IL-1 therapies are indeed successfully used in a variety of inflammatory conditions such as cardiovascular diseases [45]. However, both IL-1α and IL-1β are difficult to detect in serum or plasma of human, even in the earnest IL-1-driven inflammatory diseases [46]. To excludes a possible role of IL-1α and IL-1β to muscle inflammation in FSHD further investigation is required. MCP-1 and VEGF-A circulating concentrations appear to be decreased in serum of FHSD patients. Previous studies showed that MCP-1 deficient mice had abnormal inflammation and impaired muscle regeneration when exposed to muscular injury [47]. Therefore, we may speculate that MCP-1 downregulation may contribute to the observed perturbed muscle regeneration in FSHD. VEGF-A is important for blood vessel formation, and it is mainly produced by endothelial cells. In this regard, it is important to mention that there is indeed evidence of reduced capillary density in FSHD muscle biopsies compared with healthy muscle biopsies [48], as well as of retinal vessel abnormalities in FSHD patients [49]. Banerji et al. [42], importantly, provided for VEGF-A and Wnt signalling association with FSHD, which could explain the presence of vascular abnormalities in FSHD patients. Thus, the significantly lower VEGF-A levels observed in our patient sera cohort may further sustain the hypothesis of dysregulated VEGF-A mediated pathway in FSHD. However, further investigation is required.
The absence of differences in circulating markers between TIRM+ and TIRM–FSHD patients may be due to the fact that the MRI examination is limited to leg muscles only. Therefore, also the TIRM–patient group may in fact have muscles in active disease that were not examined on MRI or that may have just been active and missed out on the current examination. This may explain why the two groups show the same circulating cytokine profile. To accurately investigate differences in circulating cytokines between TIRM+ and TIRM–patients, a whole body MRI should be considered. This is a limitation of the study.
Long-term exposure of monocytes and NK cells to inflammatory triggers enables them to gain immune memory through a complex epigenetic and metabolic reprogramming [18, 21]. This process, also known as trained immunity, can lead to enhanced production of inflammatory cytokines and consequent tissue damage [19]. Trained immunity, for instance, has been hypothesized to contribute to the pathogenesis of atherosclerosis, a chronic low-grade inflammatory condition of the wall of arterial vessels [50]. Trained immunity was successfully ex vivo achieved in monocytes of both patients with FSHD and of healthy controls, but without substantial differences between the two groups Importantly, metabolic and epigenetic reprogramming are crucial features as well to evaluate a trained immunity phenotype. Since we did not study both transcriptome and epigenome, we cannot exclude epigenetic reprogramming of the monocytes in FSHD patients. This is a limitation of the study.
In addition to monocytes, NK cells are innate immune cells specialized in host defense against viral infection and cancer through two main functions: cytokine production (IL-6, TNF, and IFNγ for instance) and cytotoxic activity (trough Granzyme-B granules release) [20]. Several evidence indicate the involvement of circulating NK cells in different muscle events but their contribution to muscle pathology in FSHD has never been explored. Nieman et al. [51] reported that NK cells were the immune cell population most affected by physical exercise. Others also described that NK cells have a regulatory function during muscle regeneration [52]. Hohlfeld and Engel [53] showed that NK cells can lyse myoblasts inducing muscle injury. Previous studies have also investigated the relationship between circulating IL-6 and NK cell activation [54]. In fact, tumors from mice exposed to muscle training (cycles of running wheel) had increased IL-6 serum concentrations followed by a specific significant increase of tumor NK cells infiltration without concomitant increase of other immune cell types [55]. In the same study, administration of anti-IL-6 antibody to wheel running mice decreased NK cell infiltration in tumors [55]. This evidence suggest that circulating IL-6 may influence NK cell activation. Hence, we propose that serum IL-6 and NK activation may be two intertwined phenomena in patients with FSHD proposing a yet unexplored and uninvestigated FSHD pathophysiological aspect.
The observed activation of circulating NK cells in patients with FSHD may have consequences for muscle homeostasis as well. When muscle injury of any nature occurs, a classical inflammatory cascade begins with prompt muscle invasion by innate immune cells [56]. We may consider an affected FSHD muscle as under muscle injury, whose nature has been attempted to be linked to the myriads of downstream toxic DUX4 effects [57]. In this scenario, IL-6 activated NK cells may inappropriately respond with further IL-6 release, supporting an inflammatory loop. Importantly, exactly as observed for circulating IL-6, the FSHD NK cells produced IL-6 upon ex vivo stimulation (Fig. 5), and this positively correlated with disease severity and muscle weakness (Table 2). In addition, activated NK cells are an important source of TNF, which, in synergy with IL-6, may also contribute to muscle pathology in patients with FSHD. In fact, our results showed higher NK cell-derived TNF in the supernatant of ex vivo stimulated FSHD NK cells compared to NK cells of healthy subjects, as well as a significant positive correlation with disease severity.
Finally, we show that FSHD TIRM-positive skeletal muscle specimens also produce higher amounts of IL-6 and TNF. Also, as showed in our preliminary immuno-histological analysis, FSHD TIRM-positive muscle specimens have inflammatory infiltrates comprising both lymphocytes (predominantly CD8 cytotoxic T lymphocytes) as well as macrophages (CD68 positive cells). It is indeed well known that IL-6 is produced by a plethora of different cells, including activated T cells and macrophages [58]. These findings provide a validation of TIRM hyperintensity as sign of active disease in muscle of patients with FSHD [59]. Additionally, these results support the relationship between disease progression and the involvement of innate inflammatory cytokines such as IL-6 and TNF which, at local level, may sustain the dystrophic process to muscle fatty infiltration [60]. Also, the absence of differences in cytokine production between FSHD TIRM–muscle samples (thus non inflamed normal appearing muscle of FSHD patients) and HC muscle samples suggest that these muscles are not in active disease progression, validating TIRM hyperintensity as a radiological biomarker in FSHD.
In conclusion, we showed that (a) circulating IL-6 and TNF are higher in patients with FSHD (b) that NK cells are hyperactivated in patients with FSHD resulting in higher inflammatory cytokines production, (c) and that affected FSHD muscle specimens have as well an enhanced IL-6 and TNF secretion. The present findings may lead to novel insights into FSHD pathophysiology and potential treatment strategies.
ACKNOWLEDGMENTS
This work was supported by the charitable Dutch foundation Prinses Beatrix Spierfonds, Grant number W.OR15-23 awarded to BGMvE, LABJ, and GJMP.
Graphical abstract and Fig. 1 are original and created with BioRender.com upon have granted a publication license.
We would like to thank all patients and healthy volunteers for their precious participation and kind cooperation. We also would like to thank Bram van Cranenbroek, Esther Fasse, Esther van Rijssen, and Marina van Welie for their technical support in whole blood flow cytometry analysis, Lisa Kurver for providing K562 tumor cell line, Marieke Ploegmakers for advice during MRI screening exams and Jan Heidkamp for technical support during collection of muscle biopsies.
AUTHOR CONTRIBUTION
AG conceived the study, performed experiments, collected, and analysed data, drafted the manuscript and all figures. KM, JM, JCdS, HK, LdJ, RM, and JJF were involved in data acquisition and analysis. MGN and GJMP were involved in analysis of data and revised the manuscript. BGMvE and LABJ conceived the study and revised the manuscript. All authors contributed significantly to the final version of the manuscript.
CONFLICT OF INTEREST
A. Greco, K. Mul, M. Jaeger, J.C. dos Santos, H. Koenen, L. De Jong, R. Mann, J. Fütterer, M. Netea, G.J.M. Pruijn, and L.A.B Joosten declared that no conflict of interest exists. B.G.M van Engelen receives fees and non-financial support from Fulcrum, Facio, Avidity and Fondazione Telethon during the conduct of the study, and institutional support from the Radboud University Medical Centre and grant support from European Union’s Horizon 2020 research and innovation programme, European Union 7th Framework Programme (OPTIMISTIC), the Netherlands Organisation for Scientific Research (NWO), The Netherlands Organisation for Health Research and Development (ZonMw), Global FSH, Prinses Beatrix Spierfonds, Spieren voor Spieren, Association Francaise contre les Myopathies, and the Dutch FSHD Foundation.
SUPPLEMENTARY MATERIAL
[1] The supplementary material is available in the electronic version of this article: https://dx.doi.org/10.3233/JND-230063.
REFERENCES
[1] | Deenen JC , Arnts H , van der Maarel SM , Padberg GW , Verschuuren JJ , Bakker E , et al., Population-based incidence and prevalence of facioscapulohumeral dystrophy. Neurology. (2014) ;83: (12):1056–9. |
[2] | Tawil R , Van Der Maarel SM Facioscapulohumeral muscular dystrophy. Muscle Nerve. (2006) ;34: (1):1–15. |
[3] | Lemmers RJ , Wohlgemuth M , van der Gaag KJ , van der Vliet PJ , van Teijlingen CM , de Knijff P , et al., Specific sequence variations within the 4q35 region are associated with facioscapulohumeral muscular dystrophy. Am J Hum Genet. (2007) ;81: (5):884–94. |
[4] | Lassche S , Küsters B , Heerschap A , Schyns MVP , Ottenheijm CAC , Voermans NC , et al., Correlation between quantitative MRI and muscle histopathology in muscle biopsies from healthy controls and patients with IBM, FSHD and OPMD. Journal of Neuromuscular Diseases. (2020) ;7: (4):495–504. |
[5] | Zeng W , Chen YY , Newkirk DA , Wu B , Balog J , Kong X , et al., Genetic and epigenetic characteristics of FSHD-associated 4q and 10q D4Z4 that are distinct from non-4q/10q D4Z4 homologs. Hum Mutat. (2014) ;35: (8):998–1010. |
[6] | de Greef JC , Lemmers RJ , van Engelen BG , Sacconi S , Venance SL , Frants RR , et al., Common epigenetic changes of D4Z4 in contraction-dependent and contraction-independent FSHD. Hum Mutat. (2009) ;30: (10):1449–59. |
[7] | Lemmers RJ , van der Vliet PJ , Klooster R , Sacconi S , Camaño P , Dauwerse JG , et al., A unifying genetic model for facioscapulohumeral muscular dystrophy. Science. (2010) ;329: (5999):1650–3. |
[8] | Tasca G , Pescatori M , Monforte M , Mirabella M , Iannaccone E , Frusciante R , et al., Different molecular signatures in magnetic resonance imaging-staged facioscapulohumeral muscular dystrophy muscles. Plos One. (2012) ;7: (6). |
[9] | Frisullo G , Frusciante R , Nociti V , Tasca G , Renna R , Iorio R , et al., CD8(+) T cells in facioscapulohumeral muscular dystrophy patients with inflammatory features at muscle MRI. J Clin Immunol. (2011) ;31: (2):155–66. |
[10] | Frisullo G , Frusciante R , Nociti V , Tasca G , Renna R , Iorio R , et al., CD8(+) T cells in facioscapulohumeral muscular dystrophy patients with inflammatory features at muscle MRI. J Clin Immunol. (2011) ;31: (2):155–66. |
[11] | Tasca G , Pescatori M , Monforte M , Mirabella M , Iannaccone E , Frusciante R , et al., Different molecular signatures in magnetic resonance imaging-staged facioscapulohumeral muscular dystrophy muscles. PLoS One. (2012) ;7: (6):e38779. |
[12] | Arahata K , Ishihara T , Fukunaga H , Orimo S , Lee J , Goto K , et al., Inflammatory response in facioscapulohumeral muscular dystrophy (FSHD): Immunocytochemical and genetic analyses. Muscle & nerve Supplement.S. (1995) ;2: :56–66. |
[13] | Dalton HJ , Armaiz-Pena GN , Gonzalez-Villasana V , Lopez-Berestein G , Bar-Eli M , Sood AK Monocyte subpopulations in angiogenesis. Cancer Res. (2014) ;74: (5):1287–93. |
[14] | Chimen M , Yates C , McGettrick H , Ward L , Harrison M , Apta B , et al., Monocyte subsets coregulate inflammatory responses by integrated signaling through TNF and IL-6 at the endothelial cell interface. J Immunol. (2017) ;198: (7):2834–43. |
[15] | Netea MG , Quintin J , van der Meer JW Trained immunity: A memory for innate host defense. Cell Host Microbe. (2011) ;9: (5):355–61. |
[16] | Saeed S , Quintin J , Kerstens HH , Rao NA , Aghajanirefah A , Matarese F , et al., Epigenetic programming of monocyte-to-macrophage differentiation and trained innate immunity. Science (New York, NY). (2014) ;345: (6204):1251086. |
[17] | van der Heijden C , Noz MP , Joosten LAB , Netea MG , Riksen NP , Keating ST Epigenetics and trained immunity. Antioxid Redox Signal. (2018) ;29: (11):1023–40. |
[18] | van der Meer JW , Joosten LA , Riksen N , Netea MG Trained immunity: A smart way to enhance innate immune defence. Mol Immunol. (2015) ;68: (1):40–4. |
[19] | Netea MG , Joosten LA , Latz E , Mills KH , Natoli G , Stunnenberg HG , et al., Trained immunity: A program of innate immune memory in health and disease. Science (New York, NY). (2016) ;352: (6284):aaf1098. |
[20] | Reefman E , Kay JG , Wood SM , Offenhauser C , Brown DL , Roy S , et al., Cytokine secretion is distinct from secretion of cytotoxic granules in NK cells. J Immunol. (2010) ;184: (9):4852–62. |
[21] | Kleinnijenhuis J , Quintin J , Preijers F , Joosten LAB , Jacobs C , Xavier RJ , et al., BCG-induced trained immunity in NK cells: Role for non-specific protection to infection. Clinical Immunology. (2014) ;155: (2):213–9. |
[22] | Ricci E , Galluzzi G , Deidda G , Cacurri S , Colantoni L , Merico B , et al., Progress in the molecular diagnosis of facioscapulohumeral muscular dystrophy and correlation between the number of KpnI repeats at the 4q35 locus and clinical phenotype. Ann Neurol. (1999) ;45: (6):751–7. |
[23] | Lamperti C , Fabbri G , Vercelli L , D’Amico R , Frusciante R , Bonifazi E , et al., A standardized clinical evaluation of patients affected by facioscapulohumeral muscular dystrophy: The fshd clinical score. Muscle & Nerve. (2010) ;42: (2):213–7. |
[24] | Mul K , Vincenten SCC , Voermans NC , Lemmers RJLF , van der Vliet PJ , van der Maarel SM , et al., Adding quantitative muscle MRI to the FSHD clinical trial toolbox. Neurology. (2017) ;89: (20):2057–65. |
[25] | Steensberg A , Keller C , Starkie RL , Osada T , Febbraio MA , Pedersen BK IL-6 and TNF-alpha expression in, and release from, contracting human skeletal muscle. Am J Physiol Endocrinol Metab. (2002) ;283: (6):E1272–8. |
[26] | Teufel LU , Arts RJW , Netea MG , Dinarello CA , Joosten LAB IL-1 family cytokines as drivers and inhibitors of trained immunity. Cytokine. (2022) ;150: :155773. |
[27] | Jaipersad AS , Lip GYH , Silverman S , Shantsila E The role of monocytes in angiogenesis and atherosclerosis. Journal of the American College of Cardiology. (2014) ;63: (1):1–11. |
[28] | Aguirre-Gamboa R , Joosten I , Urbano PCM , van der Molen RG , van Rijssen E , van Cranenbroek B , et al., Differential effects of environmental and genetic factors on T and B cell immune traits. Cell Reports. (2016) ;17: (9):2474–87. |
[29] | Gresnigt MS , Becker KL , Smeekens SP , Jacobs CW , Joosten LA , van der Meer JW , et al., Aspergillus fumigatus-induced IL-22 is not restricted to a specific Th cell subset and is dependent on complement receptor 3. J Immunol. (2013) ;190: (11):5629–39. |
[30] | Bekkering S , Blok BA , Joosten LAB , Riksen NP , van Crevel R , Netea MG In vitro experimental model of trained innate immunity in human primary monocytes. Clinical and Vaccine Immunology. (2016) ;23: (12):926–33. |
[31] | Lassche S , Janssen BH , T IJ , Fütterer JJ , Voermans NC , Heerschap A , et al., MRI-guided biopsy as a tool for diagnosis and research of muscle disorders. J Neuromuscul Dis. (2018) ;5: (3):315–9. |
[32] | Tarnopolsky MA , Pearce E , Smith K , Lach B Suction-modified Bergström muscle biopsy technique: Experience with 13,500 procedures. Muscle & Nerve. (2011) ;43: (5):716–25. |
[33] | Turki A , Hayot M , Carnac G , Pillard F , Passerieux E , Bommart S , et al., Functional muscle impairment in facioscapulohumeral muscular dystrophy is correlated with oxidative stress and mitochondrial dysfunction. Free Radical Bio Med. (2012) ;53: (5):1068–79. |
[34] | Gros M , Nunes AM , Daoudlarian D , Pini J , Martinuzzi E , Barbosa S , et al., Identification of serum interleukin 6 levels as a disease severity biomarker in facioscapulohumeral muscular dystrophy. J Neuromuscul Dis. (2022) ;9: (1):83–93. |
[35] | Rose-John S , Winthrop K , Calabrese L The role of IL-6 in host defence against infections: Immunobiology and clinical implications. Nat Rev Rheumatol. (2017) ;13: (7):399–409. |
[36] | Pal M , Febbraio MA , Whitham M From cytokine to myokine: The emerging role of interleukin-6 in metabolic regulation. Immunol Cell Biol. (2014) ;92: (4):331–9. |
[37] | Keller P , Keller C , Carey AL , Jauffred S , Fischer CP , Steensberg A , et al., Interleukin-6 production by contracting human skeletal muscle: Autocrine regulation by IL-6. Biochem Biophys Res Commun. (2003) ;310: (2):550–4. |
[38] | Haddad F , Zaldivar F , Cooper DM , Adams GR IL-6-induced skeletal muscle atrophy. J Appl Physiol. (2005) ;98: (3):911–7. |
[39] | Muñoz-Cánoves P , Scheele C , Pedersen BK , Serrano AL Interleukin-6 myokine signaling in skeletal muscle:A double-edged sword? The Febs Journal. (2013) ;280: (17):4131–48. |
[40] | Yakabe M , Ogawa S , Ota H , Iijima K , Eto M , Ouchi Y , et al., Inhibition of interleukin-6 decreases atrogene expression and ameliorates tail suspension-induced skeletal muscle atrophy. PLOS ONE. (2018) ;13: (1):e0191318. |
[41] | Saghizadeh M , Ong JM , Garvey WT , Henry RR , Kern PA The expression of TNF alpha by human muscle. Relationship to insulin resistance. J Clin Invest. (1996) ;97: (4):1111–6. |
[42] | Banerji CR , Knopp P , Moyle LA , Severini S , Orrell RW , Teschendorff AE , et al., β-Catenin is central to DUX4-driven network rewiring in facioscapulohumeral muscular dystrophy. J R Soc Interface. (2015) ;12: (102):20140797. |
[43] | Turki A , Hayot M , Carnac G , Pillard F , Passerieux E , Bommart S , et al., Functional muscle impairment in facioscapulohumeral muscular dystrophy is correlated with oxidative stress and mitochondrial dysfunction. Free Radic Biol Med. (2012) ;53: (5):1068–79. |
[44] | Dinarello CA Overview of the IL-1 family in innate inflammation and acquired immunity. Immunological Reviews. (2018) ;281: (1):8–27. |
[45] | Dinarello CA , Simon A , van der Meer JW Treating inflammation by blocking interleukin-1 in a broad spectrum of diseases. Nat Rev Drug Discov. (2012) ;11: (8):633–52. |
[46] | Lachmann HJ , Lowe P , Felix SD , Rordorf C , Leslie K , Madhoo S , et al., In vivo regulation of interleukin 1beta in patients with cryopyrin-associated periodic syndromes. J Exp Med. (2009) ;206: (5):1029–36. |
[47] | Shireman PK , Contreras-Shannon V , Ochoa O , Karia BP , Michalek JE , McManus LM MCP-1 deficiency causes altered inflammation with impaired skeletal muscle regeneration. J Leukoc Biol. (2007) ;81: (3):775–85. |
[48] | Statland JM , Odrzywolski KJ , Shah B , Henderson D , Fricke AF , van der Maarel SM , et al., Immunohistochemical characterization of facioscapulohumeral muscular dystrophy muscle biopsies. J Neuromuscul Dis. (2015) ;2: (3):291–9. |
[49] | Osborne RJ , Welle S , Venance SL , Thornton CA , Tawil R Expression profile of FSHD supports a link between retinal vasculopathy and muscular dystrophy. Neurology. (2007) ;68: (8):569–77. |
[50] | Bekkering S , Joosten LA , van der Meer JW , Netea MG , Riksen NP Trained innate immunity and atherosclerosis. Curr Opin Lipidol. (2013) ;24: (6):487–92. |
[51] | Nieman DC , Johanssen LM , Lee JW Infectious episodes in runners before and after a roadrace. J Sports Med Phys Fitness. (1989) ;29: (3):289–96. |
[52] | Robertson TA , Grounds MD , Papadimitriou JM Elucidation of aspects of murine skeletal muscle regeneration using local and whole body irradiation. J Anat. (1992) ;181: (Pt 2):265–76. |
[53] | Hohlfeld R , Engel AG The immunobiology of muscle. Immunol Today. (1994) ;15: (6):269–74. |
[54] | Idorn M , Hojman P Exercise-dependent regulation of NK cells in cancer protection. Trends Mol Med. (2016) ;22: (7):565–77. |
[55] | Pedersen L , Idorn M , Olofsson G , Lauenborg B , Nookaew I , Hansen R , et al., Voluntary running suppresses tumor growth through epinephrine- and IL-6-dependent NK cell mobilization and redistribution. Cell Metabolism. (2016) ;23: :554–62. |
[56] | Tidball J Inflammatory processes in muscle injury and repair. Am J Physiol Regul Integr Comp Physiol. (2005) ;288: :345–53. |
[57] | Greco A , Goossens R , van Engelen B , van der Maarel SM Consequences of epigenetic derepression in facioscapulohumeral muscular dystrophy. Clinical Genetics. 2020. |
[58] | Choy E , Rose-John S Interleukin-6 as a multifunctional regulator: Inflammation, immune response, and fibrosis. Journal of Scleroderma and Related Disorders.S. (2017) ;2: (2_suppl):1–5. |
[59] | Wang LH , Friedman SD , Shaw D , Snider L , Wong CJ , Budech CB , et al., MRI-informed muscle biopsies correlate MRI with pathology and DUX4 target gene expression in FSHD. Human Molecular Genetics. (2019) ;28: (3):476–86. |
[60] | Dahlqvist JR , Poulsen NS , Ostergaard ST , Fornander F , Borch JD , Danielsen ER , et al., Evaluation of inflammatory lesions over 2 years in facioscapulohumeral muscular dystrophy. Neurology. (2020) ;95: (9):E1211–E21. |


