
Nerve Conduction Differences in a Large Clinical Population: The Role of Age and Sex
Abstract
Background:
The normal limits of nerve conduction studies are commonly determined by testing healthy subjects. However, in comprehensive real-life nerve conduction electrodiagnostic (EDX) evaluations, multiple nerves are tested, including normal nerves, for purposes of comparison with abnormal ones.
Objective:
This study aims to evaluate the average values of normal nerve conduction studies in a large population and examined the influence of age and sex.
Methods:
EDX parameters were extracted from an electronic database of studies performed from May 2016 to February 2022. Established normal values were used to determine the classification of a nerve study as normal.
Results:
We identified 10,648 EDX reports with 5077 normally interpreted nerve conduction studies (47.6%) of which 57% (n = 2890) were for females. The median age of studies with no abnormalities was 45.1 years (range < 1 to 92) overall and 42.5 years (range: 0.16 –89.5 years) for males and 47.5 years (range:<1 –91.7) for females. Correlations between age and amplitude, latency, and velocity (p < 0.001) were observed in most nerves. Amplitude correlated negatively with age in adults in all nerves with a mean of –0.44 (range: –0.24 to –0.62). However, in the pediatric population (age < 18 years), amplitude as well as velocity increased significantly with age. In the adult cohort, sex differences were noted, where females had higher mean sensory nerve action potentials in ulnar, median, and radial evaluations (p < 0.001). In older patients (aged > 70 years) with normally interpreted EDX studies (845 records of 528 patients), sural responses were present in 97%.
Conclusions:
This real-life study confirms that advanced aging is associated with decreased nerve conduction amplitudes, increased latency, and the slowing of conduction velocity. The findings also indicate higher sensory amplitudes and conduction velocities in females. Sural nerve responses were identified in most adults over age 70.
INTRODUCTION
There is an increasing trend worldwide, including in the United States, Canada, Ireland, and Germany, to implement policies and practices that require the incorporation of sex-based analyses in competitive research grants and publications in academic journals [1, 2]. The same is true of neuromuscular research. Previous studies have reported sex differences in certain nerve conduction parameters, including faster conduction velocities in females than males and longer distal latencies in males (p < 0.05) [3, 4]. The sensory nerve action potential amplitudes of the sural and superficial peroneal nerves in the lower limbs were shown to be greater in adult Korean females than males (p < 0.05) [5]. Some findings indicate that males have higher amplitudes [6] whereas others have failed to identify significant sex differences [7, 8]. These conduction velocity differences have been attributed to limb length in proximal stimulation sites, or body mass index and weight [3]. However, certain studies [9] have shown that arm length does not affect upper limb conduction.
In electromyographic laboratories, nerve conduction parameters are reported to be normal or abnormal based on particular or multiple levels of abnormality. This approach has a number of shortcomings, including physiological and technical factors, which often result in the misinterpretation of the findings [10, 11]. Knowing the effects of sex and age is thus important for the accurate interpretation of EDX tests and for effective diagnosis and treatment since these differences have been related to the prevalence and manifestations of many neurological and psychiatric diseases [12, 13]. For example, females are more likely to be diagnosed with multiple sclerosis and small fiber neuropathy and have a greater lifetime risk of Alzheimer’s Disease than males, whereas males are more likely to be diagnosed with autism spectrum disorder (ASD), attention and hyperactivity disorder and Parkinson’s Disease [11–14]. By extension, there are notable physiological differences in laboratory parameters related to age and sex. Some of the most common examples include hemoglobin, creatine kinase, and creatinine clearance. In addition, differences have also been noted in disease severity, time to diagnosis [15], disease progression [13, 14], and treatment efficacy/drug response [16].
Apart from sex, aging is another important factor to consider. It is known to affect conduction and reflects axonal health, in that age-related physiological changes [17] are likely to be related to the loss of large nerve fibers [6]. In addition, multiple neurological changes have been reported, such as a slowing of muscle contractility, alteration in muscle metabolism and neuromuscular junctions. Recent work found that HbA1c and age consistently made the most substantial contribution to velocity and amplitude [4, 18, 19]. Several studies have indicated that nerve conduction velocity (NCV) decreases with age [20–24]. However, the relationship between age and NCV or which nerves are the most involved remain unclear.
There is little consensus on equations to correct for age, and data from older studies are contradictory. In one study of patients ranging in age from 3.5 to 82 years, the maximum NCV was seen at age 4 years and thereafter varied little until after age 60 years, when NCV declined [24]. Studies have noted an inverse linear relationship between age and ulnar NCV [23] or a clinically insignificant reduction in ulnar NCV with age [21]. Recent studies have tried to clarify this issue [25].
Most studies dealing with differences in sex or differences in age have not taken both factors into consideration concurrently and have analyzed small samples. To find significant differences related to both sex and age, a large cohort of diverse age groups is needed. The current study focused on differences in measures of nerve conduction studies in terms of sex in different age groups for different nerve types in a large cohort from a large referral center in Israel.
MATERIALS AND METHODS
Case Collection and Case Ascertainment
This project was reviewed and approved by the Sheba Medical Center (SMC) institutional review board. Electronic medical records at SMC were used to identify patients who had comprehensive EMG/NCS studies between May 2016 and February 2022.
The retrieved data included records acquired during hospitalization and outpatient clinic visits. The variables covered anthropomorphic data including patient age, sex, height and visit date. Electrophysiological measurements included data on the recorded site, distal latency, amplitude, and velocity. Textual medical notes were also collected, which detailed the reason for referral, a summary of the findings and the diagnostic conclusion of the study. The diagnostic interpretation was classified as normal or abnormal.
Inclusion criteria
We included patients seen in our EMG laboratory by neuromuscular specialists who had a full electrophysiological evaluation. Missing data and outliers were deleted. Supplementary Table 1 outlines the exclusion criteria and the number of records and patients remaining after each filtering phase. In case multiple studies (visits) were recorded for the same patient, only the last one was included.
Normal study classification and nerve types
The criteria to determine the normalcy of NCS values were based on normative data as previously published [26–28]. The neuromuscular specialists’ diagnosis of a study as normal was based on the finding of normal nerve conduction for all parameters tested except for the lower limb distal sensory responses in older adults (age > 70 years), since no response tends to be considered normal for individuals over 70. Needle electromyography (EMG) was performed in most of patients. If any nerve, regardless of type, showed abnormal results during the nerve conduction examinations, the entire visit or assessment for that participant was excluded from the analysis. The dataset consisted of nerves from the upper and lower extremities. We focused on the 9 most clinically relevant nerves in the dataset which constituted 93% of all the records.
Electrophysiological testing protocol
EMG examinations were performed with a disposable concentric 25 or 37 mm needle using standard stimulation and recording techniques (Nicolet Viking). EMG reports were reviewed for the presence of any conduction or needle EMG abnormalities as described elsewhere [29].
Motor nerve conduction values were recorded for the following nerves (and recording sites): ulnar (abductor digiti minimi), median (abductor pollicis brevis), radial (extensor digitorum communis), peroneal/fibular (extensor digitorum brevis), peroneal (anterior tibialis), tibial (abductor hallucis), femoral (rectus femoris) and spinal accessory (upper trapezius) nerves. For all motor nerves, the amplitude considered for analysis was the amplitude for the response from the proximal and distal stimulation sites (if distal and proximal sites were both tested), expressed in millivolts (mV), and the considered latency was from the distal stimulation sites alone (wrist, ankle, calf, lat leg, forearm). The distal latency of motor nerves was measured from the onset of the compound muscle action potential (CMAP) in the distal standard muscles, as expressed in milliseconds (ms). In the upper limbs, the stimulation sites were the elbow and wrist, and the knee and ankle for the lower limbs.
Sensory nerve conduction values were recorded for the following nerves (with the method and recording sites):median (antidromic: digit II), median (orthodromic: palmar), ulnar (antidromic: digit V), ulnar (orthodromic: palmar), superficial radial (antidromic: wrist), medial antebrachial cutaneous (antidromic: forearm), lateral antebrachial cutaneous (antidromic: forearm), sural (antidromic: ankle), medial plantar (orthodromic: ankle), lateral plantar (orthodromic: ankle), superficial peroneal (antidromic: ankle), and saphenous (antidromic: ankle) nerves. For all sensory nerves, the amplitude recorded was the baseline-to-peak amplitude at the distal stimulation site, expressed in microvolts (μV). Sensory peak latencies were recorded according to the peak of the amplitude at the distal site, expressed in milliseconds. Conduction velocity was determined in the same manner as described for the motor NCS, using the onset latencies when calculating the sensory conduction velocity. Prior to the electrodiagnostic evaluation, mid palm temperatures were measured. If necessary, in cases where the hand or feet were cold, the patients were requested to place the cold limb in warm bath water for 5 min. The median sensory and ulnar sensory conduction studies involved recording with standard ring recording electrodes at digits II and V, respectively, with an interelectrode distance of 3 cm. Antidromic stimulation was applied at the wrist 13 cm proximal to the active recording electrode. The latency to both the initial deflection (onset latency) and negative peak (peak latency) as well as the baseline-to-peak amplitude were recorded in accordance with the guidelines outlined by the American Association of Electrodiagnostic Medicine [27].
Data Quality
All nerve conduction measurements were recorded automatically and uploaded to the database. Subjects’ age was extracted from the electronic health records. The patients’ room temperature was monitored as well as the standard distances for the electrode positions in each nerve.
Statistical Analysis
Univariate analyses of covariance (ANCOVA) were calculated to test for differences between males and females, including age as a covariate. For the hemi-decade level analysis, the age variable was categorized to hemi-decades, except for children (age 0 –10) who were grouped together due to the small sample size. Group differences were established using a Wilcoxon rank sum test between the means of continuous variables. The effect size (partial η2) was calculated with the lsr package [30–32]. A Spearman rank correlation was performed to characterize the relationship between two continuous variables. A Chi-square test was performed to examine the difference between sexes and normal study results. All statistical analyses were performed using R software (version 4.1.2). The statistical significance (p) accepted for all tests was established at p = 0.05. Consistent with conventional classifications, effect sizes of η2 0.01–<0.06 were considered to indicate a small effect, 0.06–<0.14 a moderate effect, and > = 0.14 a large effect [33]. To uphold the assumption of independence, the repeated measurements obtained for the same nerve during a single visit wereaveraged.
Availability of data
Data will be shared upon reasonable request and approval of our review board.
RESULTS
Cohort characteristics demographics and electrophysiological testing
We identified 10,648 patients, of whom 5,402 (51%) were males and 5,246 (49%) were females, yielding 149,881 nerve conductions. The mean body height was 168.8 cm (range: 60–210). The above data are summarized in Table 1. Males were significantly taller (p < 0.001) than females. We identified 5077 patients with examinations within the normal reference ranges that were interpreted as normal by the electromyographer. This represented 48% of the total cohort, and comprised 57,617 nerve conduction attributes, which are detailed in Table 1.
Table 1
Baseline demographics for the cohort*
| Variable | Male | Female | Total | P-value |
| Number of patients | 5402 (50.7%) | 5246 (49.3%) | 10648 | 0.13 |
| Mean Age | 51.8±20.5 | 52.1±19.3 | 51.9±19.9 | 0.97 |
| Mean Height | 174.4±8.7 | 163±8.3 | 168.8±10.3 | <0.001 |
| Interpreted as abnormal | 3171 (57.7%) | 2318 (42.2%) | 5489 | <0.001 |
| Interpreted as normal | 2187 (43.1%) | 2890 (56.9%) | 5077 | <0.001 |
| Number of NCS Reports by Nerve for Normal Studies** | ||||
| Ulnar –ADM | 3516 | 4987 | 8503 | <0.001 |
| Peroneal –EDB | 5396 | 6664 | 12060 | <0.001 |
| Median –APB | 2762 | 4167 | 6929 | <0.001 |
| Tibial –AH | 3440 | 4231 | 7671 | <0.001 |
| Sural –Ankle (Calf) | 2584 | 3206 | 5790 | <0.001 |
| Median –Digit II (Antidromic) | 1804 | 2675 | 4479 | <0.001 |
| Superficial peroneal –Ankle | 2386 | 2866 | 5252 | <0.001 |
| Ulnar –Digit V (Antidromic) | 1583 | 2280 | 3863 | <0.001 |
| Radial –Anatomical snuff box (Forearm) | 1329 | 1741 | 3070 | <0.001 |
*After exclusion of extreme cases as depicted in Supplementary Table 1, abbreviations; ADM = adductor digiti minimi, AH = adductor hallucis, APB = adductor pollicis brevis, EDB-extensor digitorum brevis. **A nerve could appear multiple times in a single visit in cases where several sites were examined (this was more common in motor nerves). For example, in the case of peroneal EDB, three sites were examined: Ankle, Fib head, and pop fossa. In addition, in some cases, both sides (right/ left) were tested during the same visit. For the statistical analysis, the mean value was calculated to maintain one record per nerve for each visit.
Visit frequency and nerve attributes by age
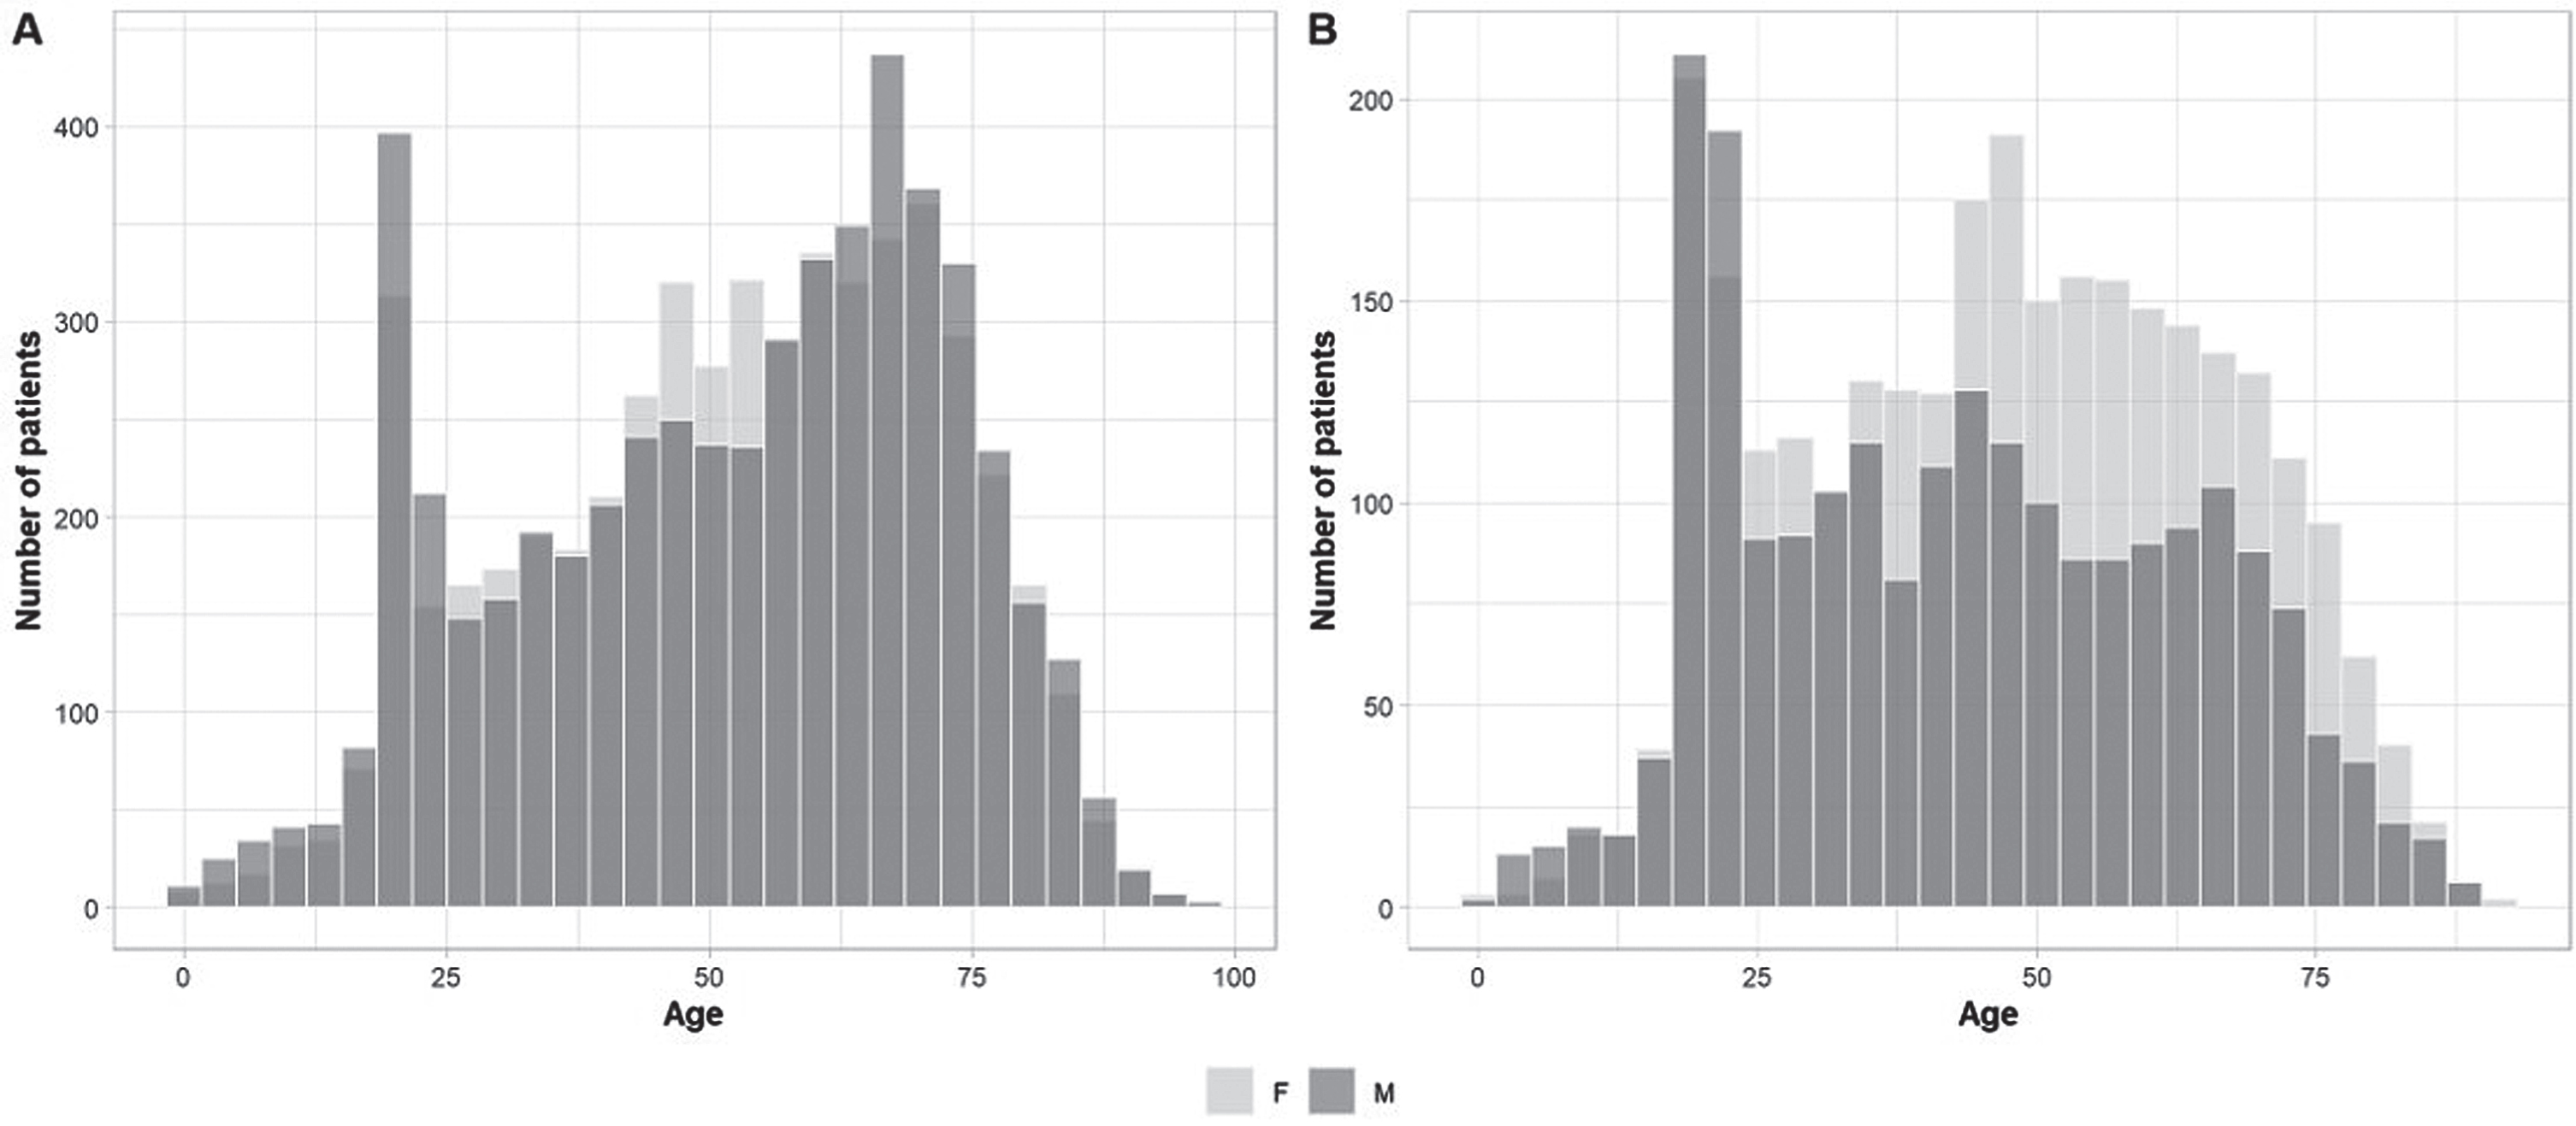
Age distribution by visit was analyzed in the entire cohort (Fig. 1A) as well as in the cohort with normal EDX reports (Fig. 1B). Two age groups, aged 20–25 years, followed by a group aged 65–70 years accounted for the most frequent visits. Analysis by sex showed no statistical differences between mean age and sex (p = 0.97). When comparing sexes for EDX with normal results (Fig. 1B), the most frequent age group was the 20–25 year-olds, whereas the peak of the bell curve was for the 45–50 age group. Females were more likely to have a normal EDX than males (p < 0.001) and there was a significant difference in age between the sexes (p < 0.001), where males were younger.
Fig. 1
Age and sex referral histograms. Age distribution by sex for the entire referral cohort (A) versus the normal EDX cohort (B). Histogram presenting similar age distribution by sex in all tested patients (A), with however a higher percentage of females than males in the middle-aged groups (B).
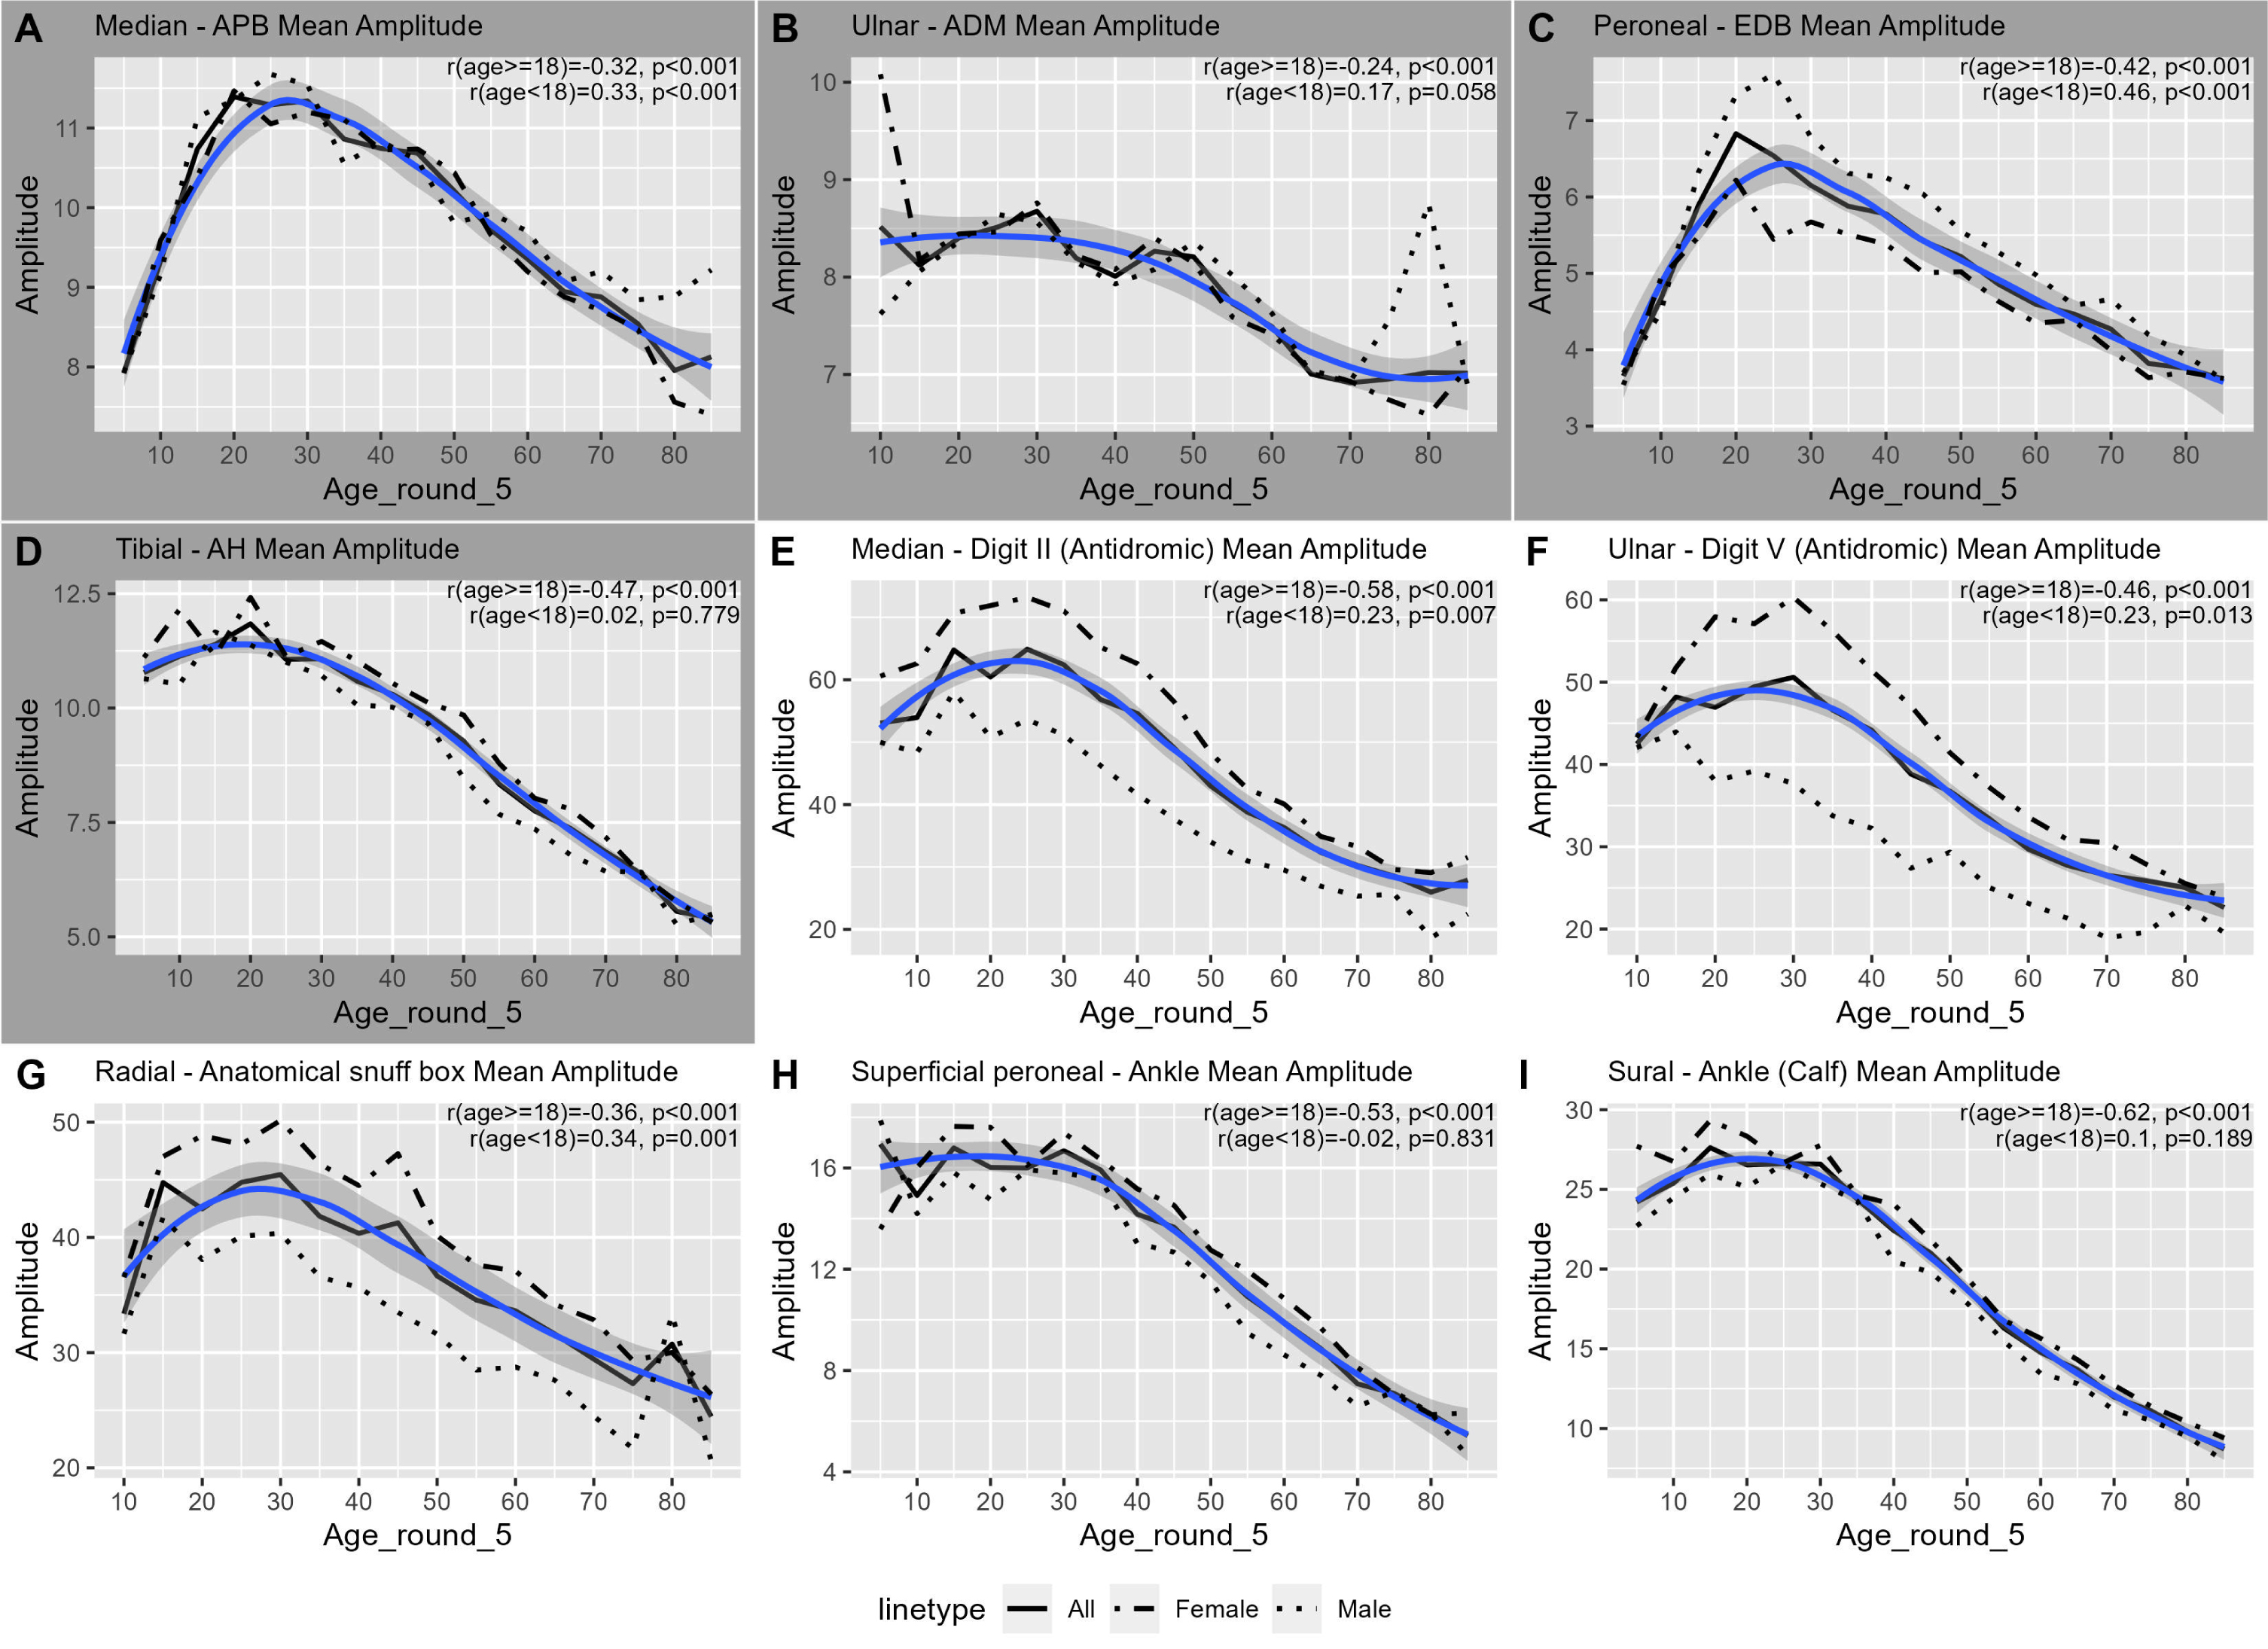
Analysis of age showed that in the younger age groups, amplitudes increased to reach a maximum at an age range of 20–25 years and thereafter gradually decreased in all the nerves tested (Fig. 2). We calculated the Spearman’s rank correlation separately for the pediatric (age < 18) and adult (age> = 18) groups for each nerve. The R-value for age and amplitude correlated negatively for all nerves with a mean of –0.44 (range: –0.24 to –0.62) in adults, but not in the pediatric population (Fig. 2). In patients above 70 with a normal EDX (845 records of 528 patients), sural responses were in the normal range in 83% (n = 705 records) of > 6, and had an amplitude of 1 to 6 in 16% (n = 138); 2 patients had no sural responses (<1) for technical reasons.
Fig. 2
Changes in amplitude with age for common nerves with R correlation values. The graph highlights the significant negative correlation between amplitude and age for individual nerves in both adult males and females. The mean amplitude was calculated for each age group. The age group was created by rounding age to the nearest 5 years. The blue line is a Loess-smoothed curve far the trimmed mean (1%). The gray area around the smooth line represents the 95% confidence interval. The dashed line represents the females’ trimmed mean values, and the dotted line represents the males’ trimmed mean values. Age groups with fewer than five records were omitted (age groups 0, 90, and 5 in some cases). Supplementary Table 2 lists the number of records in each age group.
Changes in amplitude with age for common with R correlation values. The graph highlights the significant negative correlation between amplitude and age for individual nerves in both
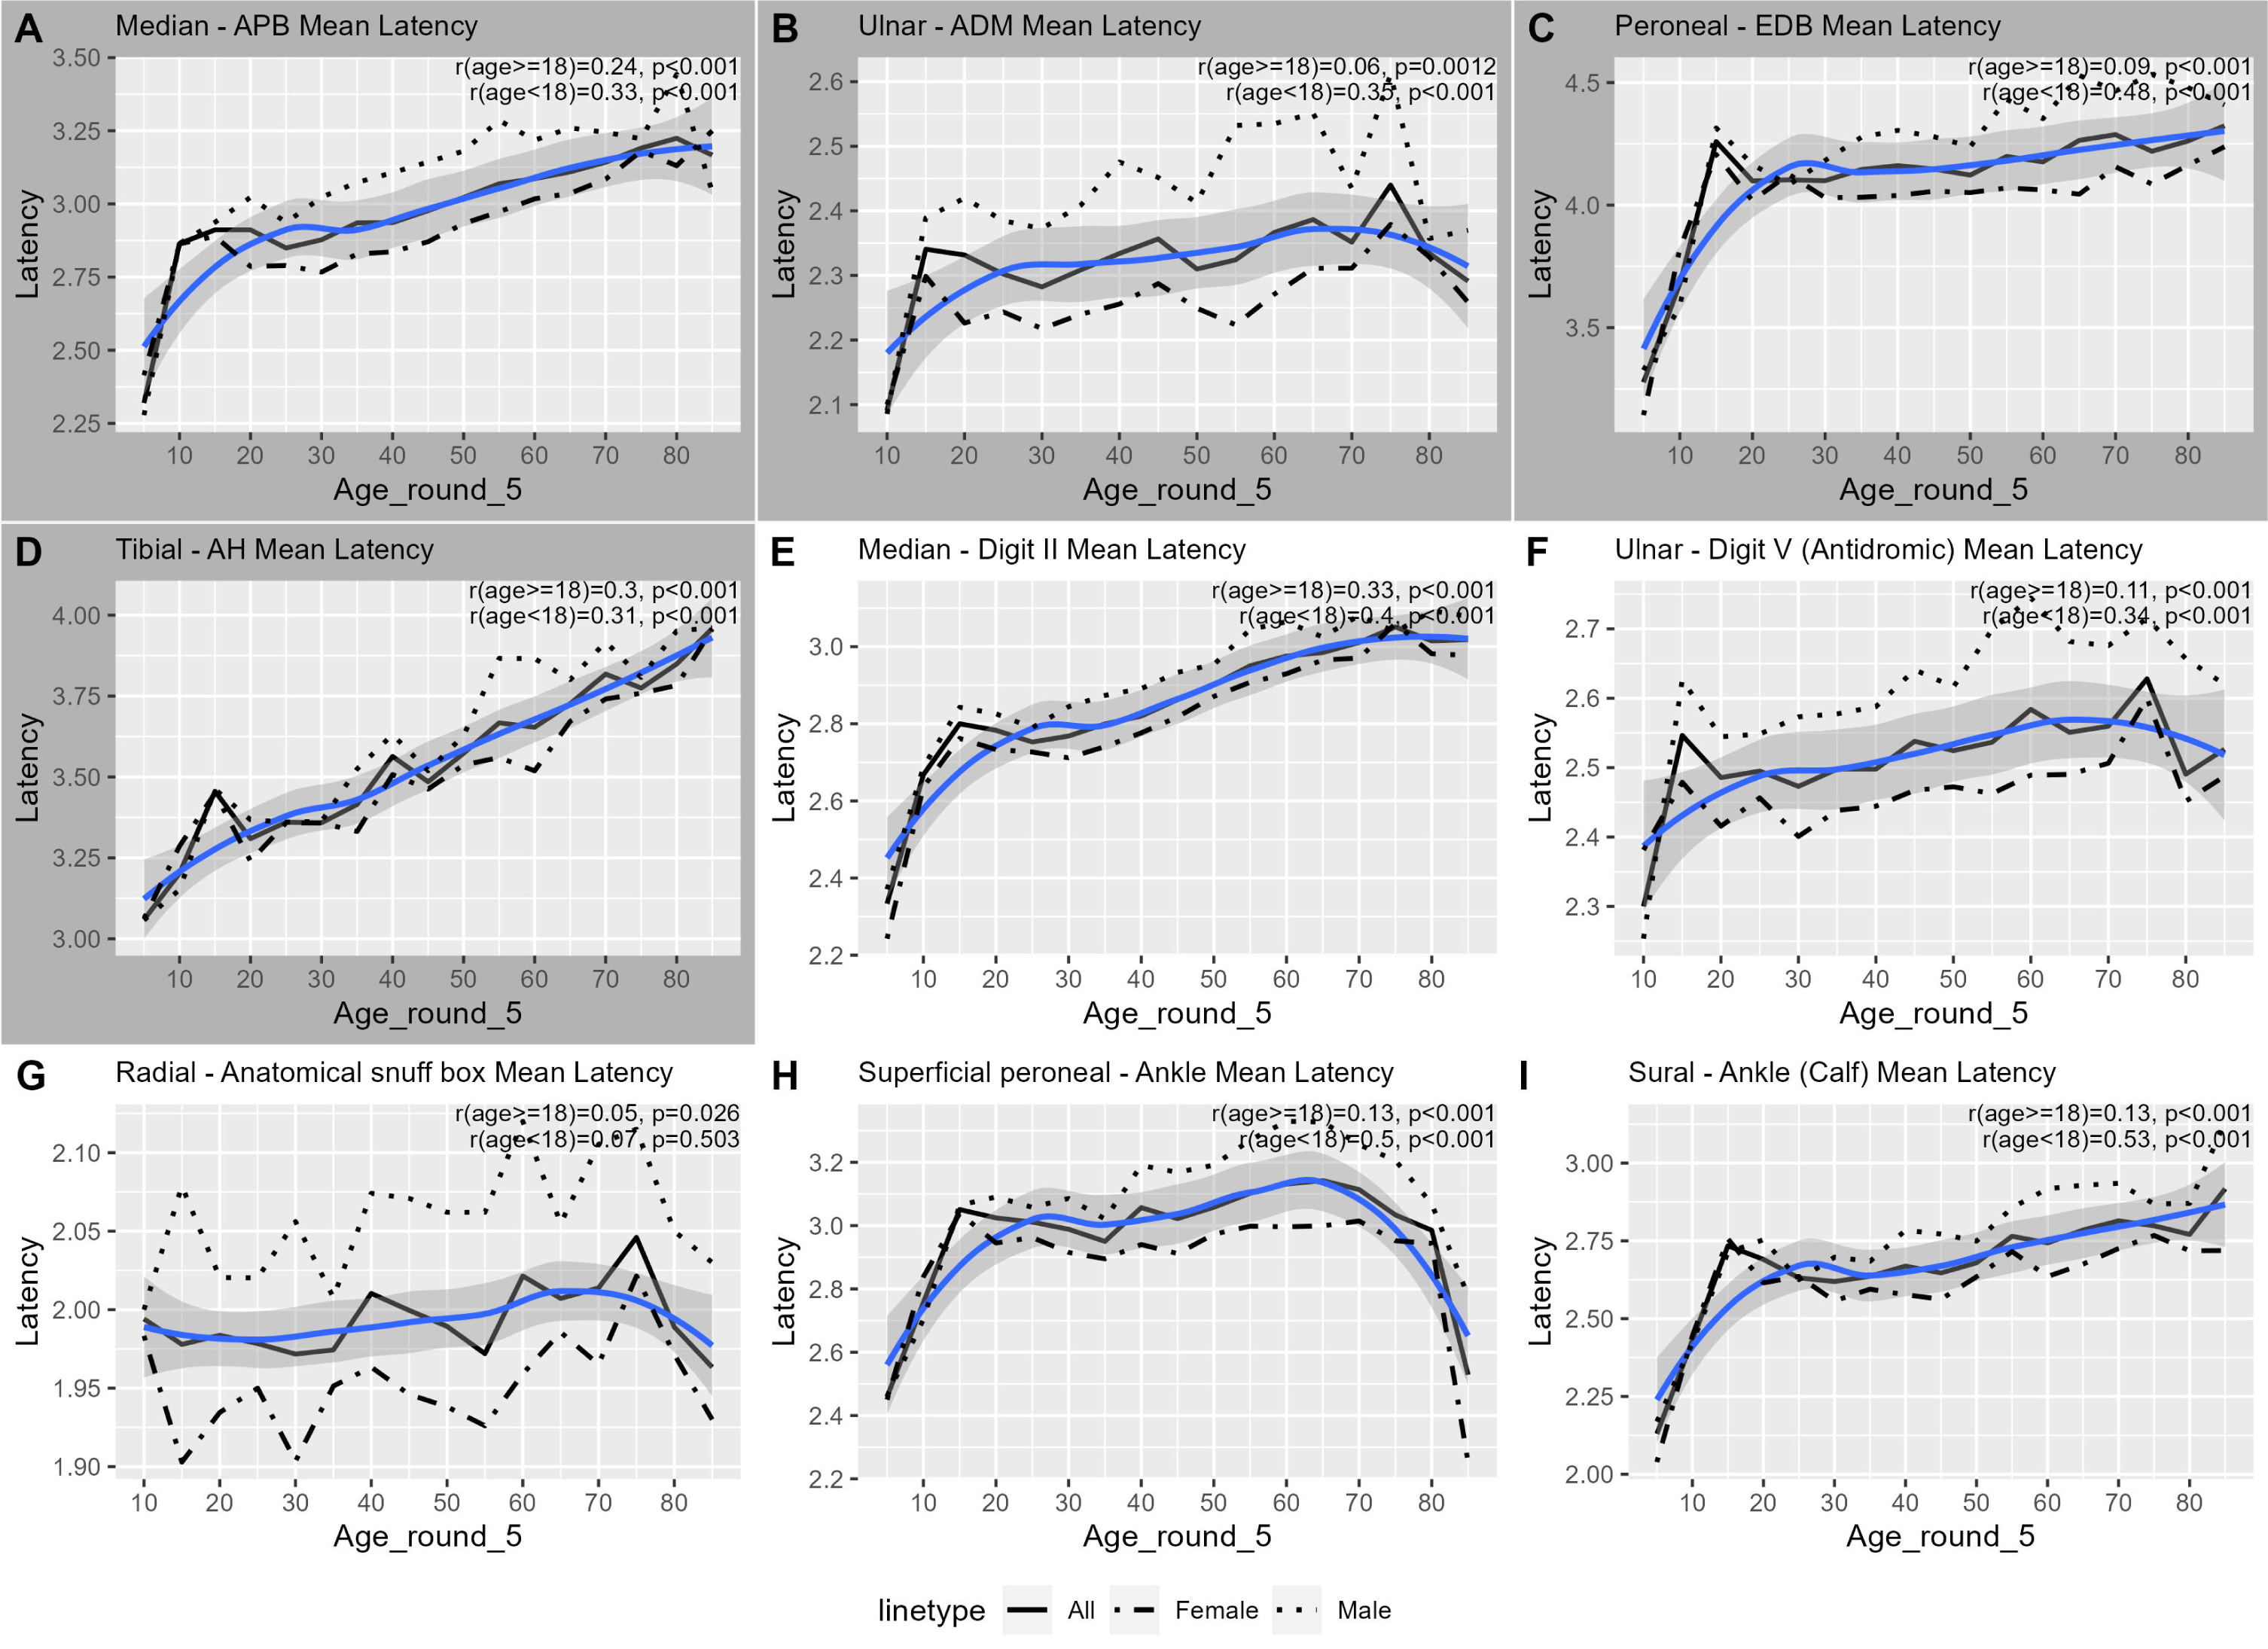
The comparison of nerve velocity in adults vs. the pediatric population indicated that velocity decreased with age in adults for all nerves (p < 0.05) except for the radial and ulnar sensory nerves. In the pediatric population there was an increase in velocity in the median nerve (motor and sensory, p < 0.05) responses (Fig. 3). Latencies increased in adults with age for all nerves (p < 0.05), although in some this was only moderate. In the pediatric group, there was a significant increase in latency in all nerves except for the radial sensory nerve (Fig. 4).
Fig. 3
Changes in velocity with age for common nerves with correlation values. The graph highlights the velocity dynamics for individual nerves in both adult males and females. The mean velocity was calculated for each age group. The age group was created by rounding age to the nearest 5 years. The blue line is a Loess-smoothed curve for the trimmed mean (1%). The gray area around the smooth line represents the 95% confidence interval. The dashed line represents the females’ trimmed mean values, and the dotted line represents the mates’ trimmed mean values. Age groups with fewer than five records were omitted (age groups 0, 90, and 5 in some cases). Supplementary Table 3 lists the number of records in each age group.
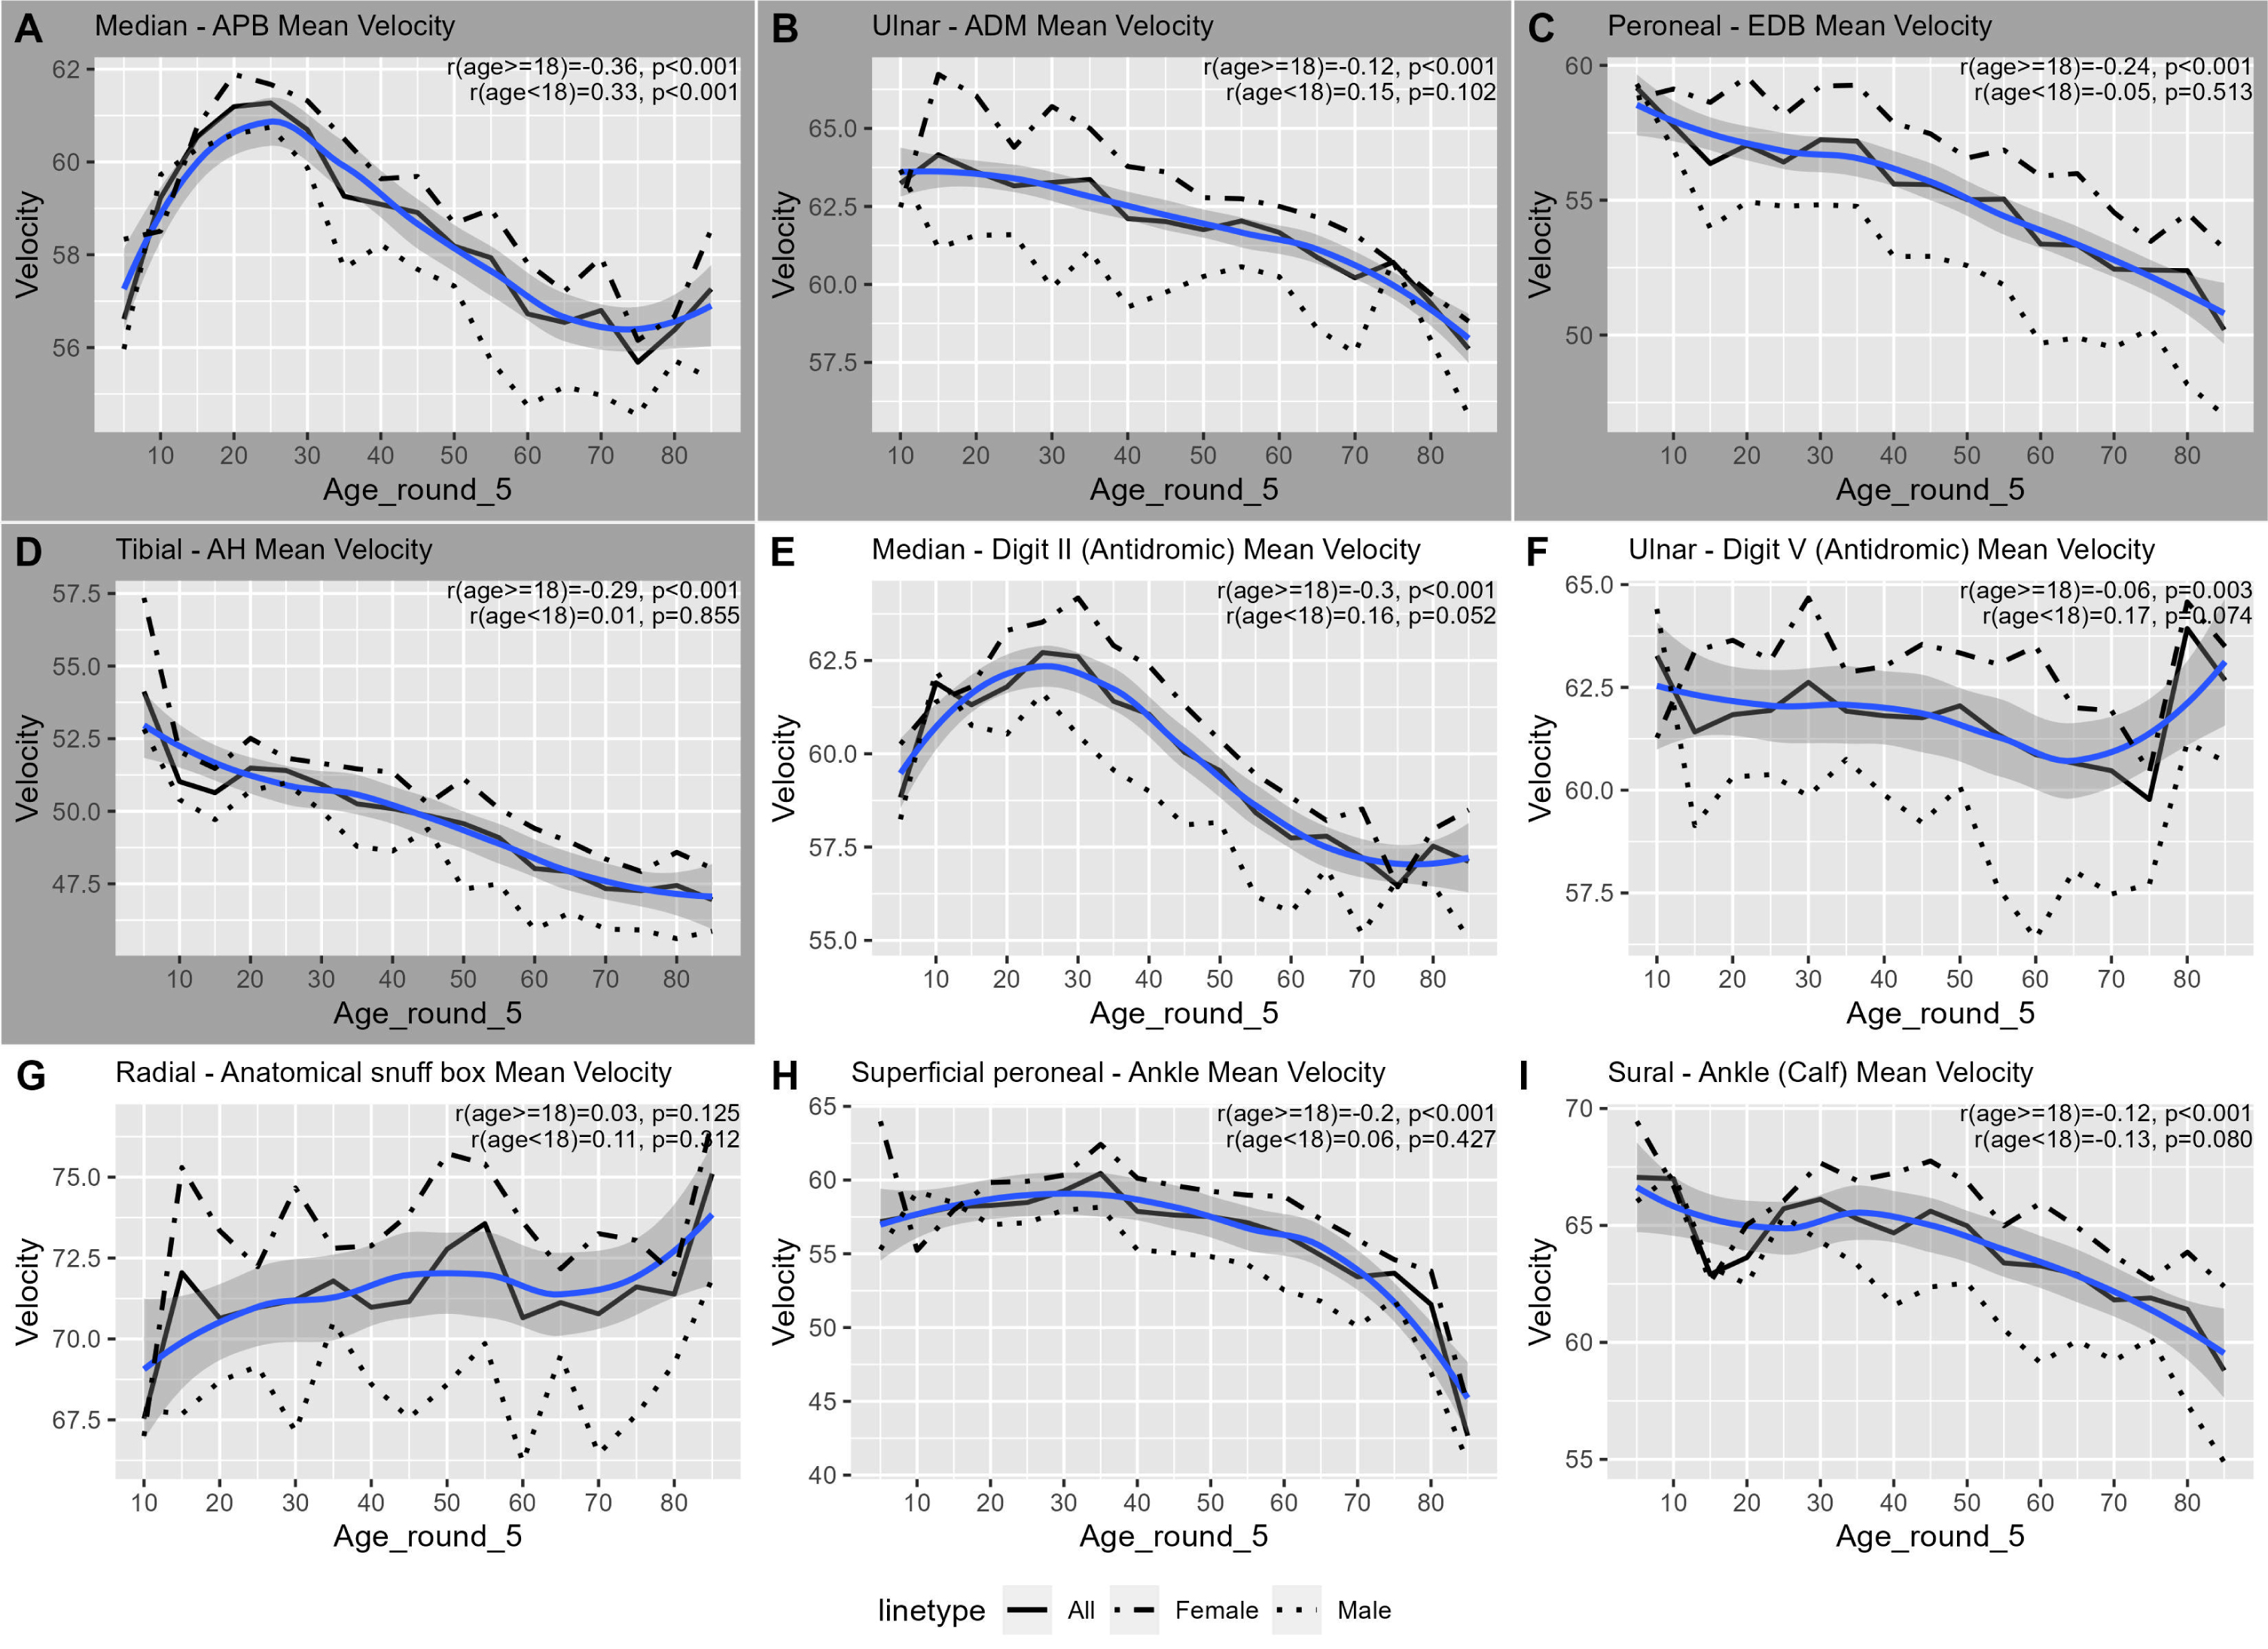
Fig. 4
Changes in latency with age for common nerves with R correlation values. The graph highlights the latency changes for individual nerves in both adult males and females. Only distal motor neve sites were included. The mean latency was calculated for each age group. The age group was created by rounding age to the nearest 5 years. The blue line is a Loess-smoothed cuve for the trimmed mean (1%). The gray area around the smooth line represents the 95% confidence inteval. The dashed line represents the females’ trimmed mean values, and the dotted iine represents the males’ trimmed mean values. Age groups with fewer than five records were omitted (age groups 0, 90, and 5 in some cases). Supplementary Table 4 lists the number of records in each age group.
Sex differences in amplitude, latency, and velocities across different age groups
The motor and sensory CMAP (compound motor action potentials) and SNAP (sensory nerve action potential) in males and females were compared for the motor median, ulnar, peroneal, and tibial nerves and the median, ulnar, radial and sural sensory nerves. Table 2 provides a statistical summary of these differences (mean and SD).
Table 2
Nerve tested by sex of normal study cohort in adults (age range 18–69)
| Nerve name | Type | N | Mean (±SD) Amplitude | ||||||
| Males | Females | Males | Females | Estimate Males | P-value | Partial η2 | Effect size magnitude | ||
| Median –APB (mV) | Motor | 1095 | 1646 | 10.68 (±3.12) | 10.46 (±3.12) | 0.02 | 0.873 | <0.01 | negligible |
| Peroneal –EDB (mV) | Motor | 1296 | 1646 | 6.11 (±2.01) | 5.09 (±2.01) | 0.89 | <0.001 | 0.041 | small |
| Tibial –AH (mV) | Motor | 1265 | 1617 | 9.37 (±4.55) | 9.97 (±4.55) | –0.88 | <0.001 | 0.011 | small |
| Ulnar –ADM (mV) | Motor | 949 | 1369 | 8.17 (±2.21) | 8.11 (±2.21) | –0.04 | 0.668 | <0.01 | negligible |
| Median –Digit II (Antidromic, μV) | Sensory | 1094 | 1640 | 42.04 (±23.01) | 56.27 (±23.01) | –17.19 | <0.001 | 0.192 | large |
| Radial –Anatomical snuff box (Forearm, μV) | Sensory | 846 | 1092 | 34.81 (±16.02) | 43.71 (±16.02) | –9.98 | <0.001 | 0.112 | moderate |
| Superficial peroneal –Ankle ( μV) | Sensory | 1202 | 1489 | 12.37 (±7.18) | 13.89 (±7.18) | –1.97 | <0.001 | 0.023 | small |
| Sural –Ankle (Calf, μV) | Sensory | 1334 | 1745 | 20.06 (±10.27) | 21.06 (±10.27) | –1.97 | <0.001 | 0.013 | small |
| Ulnar –Digit V (Antidromic, μV) | Sensory | 949 | 1369 | 32.22 (±19.62) | 47.86 (±19.62) | –17.69 | <0.001 | 0.247 | large |
Abbreviations: AH = Abductor Hallucis, APB = Abductor Pollicis Brevis, EDB = Extensor Digitorum Brevis, ADM = Abductor Digiti Minimi. The table presents the results of the ANCOVA analysis when controlling for age. All nerves except Ulnar –ADM and Median –APB showed significant differences in mean amplitude between genders. The most significant, with a large or moderate effect size (partial η2) were found for the sensory Ulnar, Median and Radial nerves. The same comparison for the pediatric and the older population can be found in Supplementary Tables 6 and 7.
Figures 3, 4. Distal latencies for motor studies and peak latencies for sensory revealed differences (p < 0.001) in multiple age groups. Sensory ulnar latencies had a moderate effect size in most age groups. Females above 20 years of age had higher velocities for all nerves, as shown in Fig. 3. The differences were statistically significant for almost all age groups from age 20 to 80, but with several exceptions. The effect size was small in most cases but was moderate for the Peroneal –EDB between the ages of 30 to 80 and Ulnar digit V between the ages of 55 to 80. Adult males showed higher latencies in all nerves.
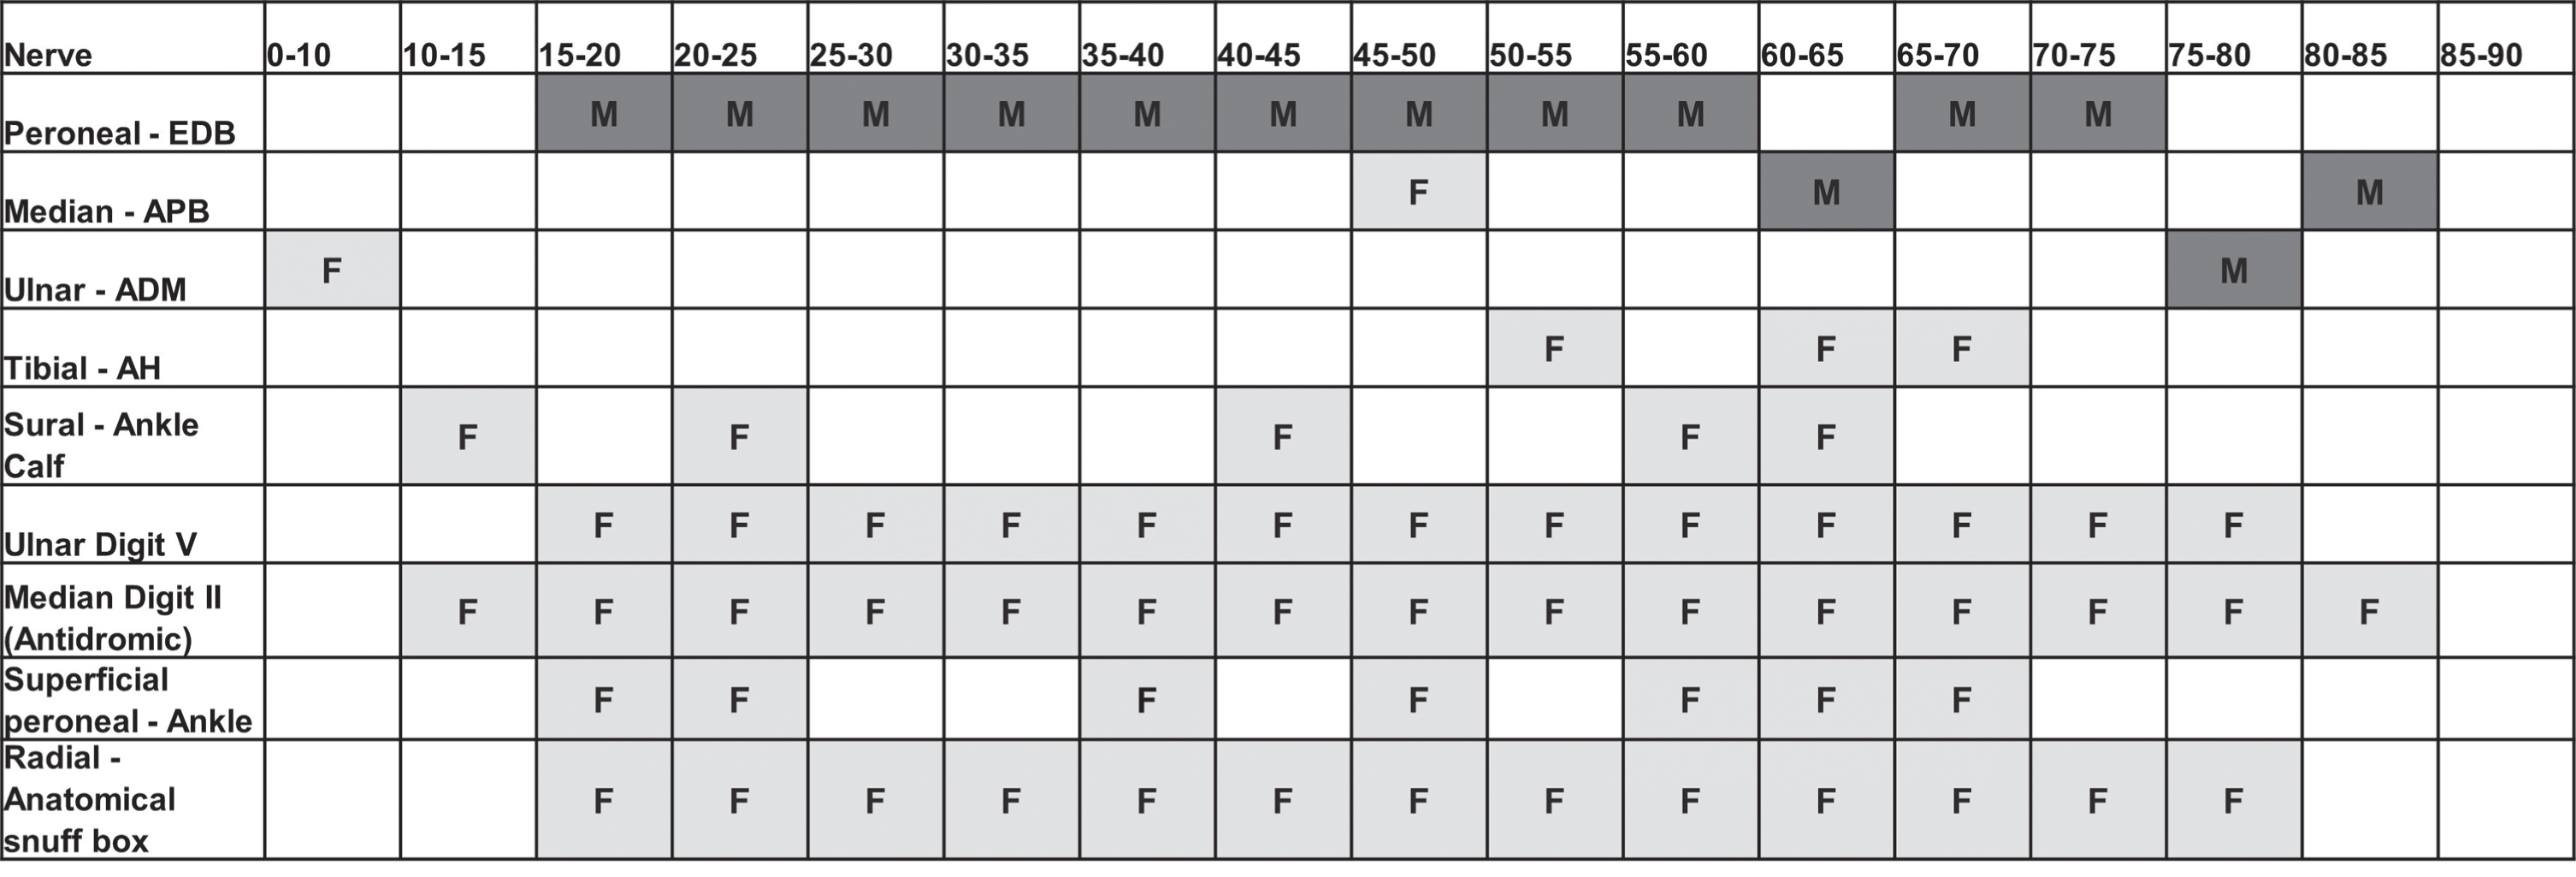
A comprehensive comparison of sex differences at all ages showed differences in terms of sex primarily in 4 nerves for amplitudes Fig. 5. Peroneal motor conduction was persistently higher in adult males across all age groups (p < 0.001). The most significant notable sex difference was in sensory ulnar testing, with a higher SNAP in adult females. Median motor nerve conduction recorded at the abductor pollicis brevis (APB) and ulnar recorded at the adductor digiti minimi (ADM) were not statistically different between sexes across most age groups. A comparison of sensory conductions of the upper and lower limbs showed significant differences for the ulnar sensory (p < 0.001), median sensory recorded at digit 2 (p < 0.001,) and radial sensory (p < 0.001) conductions. This is consistent with Table 2 where moderate or large effect sizes were seen in the sensory ulnar digit 5 (η2 = 0.25, p < 0.001), median (η2 = 0.19, p < 0.001), and radial nerves (η2 = 0.11, p< = 0.001).
Fig. 5
Pictorial representation of the statistical differences in amplitudes between males and females in various age categories in normal EDX patients. *Empty cells indicate the difference was not significant while F/M indicates a significant difference. M indicates higher values for males whiie F indicates higher values for females. Supplementary Table 4 lists the number of records in each age category.
DISCUSSION
This study investigated nerve conduction attributes in a large cohort for all routinely tested nerves, as depicted in Table 2 by age and sex. The data also included young children (0–10) and the older population above age 80, both of whom are rarely examined. In the current study, all but two patients in the extreme age groups (aged > 70 years) had obtainable sural sensory responses. Previous research has indicated an absence of sural sensory responses in the older population above the age of 75 [28], highlighting need for age-stratified normative data [26].
These findings suggest that obtaining nerve conduction (NCS) results from a single measure is not sufficient. Rather, this calculation should consider factors such as age, sex and BMI [26]. Anthropometric characteristics, such as estimated surface area and finger circumference [34] should further be examined. The large amount of data available in the current study allowed us to test for differences between males and females in different age groups at the hemi-decade levels.
Sex differences were primarily related to NCS sensory amplitudes, as shown in Fig. 5. This is consistent with previously reported sex differences for metabolic responses, medications, and difference in manifestations of disease [15, 26, 35–37]. We believe that a better interpretation of sex differences would contribute to a better assessment of minor neuropathic injuries and serve as an indication for further investigation in cases of radiculopathies and compressive neuropathies of the upper limbs. Overall, the results have implications for diagnosis and treatment.
One plausible explanation for these differences has to do with physiology, given that the age of fusion of epiphysis differs between the sexes [38]. Several forensic studies have shown that the index and ring finger ratio is higher in females than in males [39]. Much more is known today about sex-linked cutaneous biophysical differences, and several studies have pointed to female versus male differences. It has been suggested that males have thicker, oilier skin, and that the skin ages differently [18, 40]. These changes may attenuate recorded amplitudes especially for superficial sensory nerves, due to the high amount of subcutaneous tissue in the vicinity of the recording site [41]. We also examined whether change in amplitude correlated with chronological age, to find a direct effect on nerve amplitudes, latency, and velocity. In patients below the age of 20 there was a general increase in these parameters, as shown in Figs. 2–4 which was also supported by a recent publication in the pediatric population [29]. The decrease in amplitude began between the ages 20–30 depending on the nerve and sex. For the ulnar recorded at digit-V, males started the decrease earlier, prior to age 20 whereas the decrease in females started at age 30.
There was no significant difference in the frequency of visits between males and females, as shown in Fig. 1A (for all referrals) but there were differences in patients with normally interpreted tests, with a higher prevalence in females, Fig. 1B. This could be indicative of small fiber neuropathy [42] and fibromyalgia which have been reported to be more common in females and more prevalent among middle-aged women [43, 44].
Although our cohort cannot be used to define reference values, the analyses revealed notable differences in age and sex that may guide the design of future prospective studies to determine reference values in an age- and sex- dependent manner.
Limitations
This study has several limitations, although the sample size was robust. The first is that this was a single-center retrospective study. Second, the patients included in the analysis were interpreted as normal but were not recruited as asymptomatic normal individuals. Rather, the classification of “normal” was based on the finding of normal nerve conduction examinations for all parameters tested except for lower limb distal sensory responses in older adults (aged > 70 years). Thus, the entire examination was classified as normal if all the parameters were normal. However, these patients may have had a subclinical disease, although the interpretation of their examination was based on a single normal/abnormal threshold. F waves (late responses) have also been found to be impacted by aging and sex in other studies but were not assessed fully in the current study [3, 45]. The infant population in this study was small (ages 0 to 5), so that ages 0 to 10 were pooled into one category. All the NCS measurements were performed in a controlled environment at a standardized room temperature. We maintained the temperature within a narrow range throughout the data collection period to minimize the influence of temperature variations on the results. However, individual variations in body temperature, such as peripheral temperature changes, could still have occurred and may have influenced the findings.
CONCLUSION
Overall, sex differences were only found in a few NCS attributes and were age-dependent. Females were more likely to have a normally interpreted EDX than males (p < 0.001) especially in mid-life. Since females have a higher normal threshold, an abnormal result might be misinterpreted as normal if standard values are used. Differences between males and females should thus be taken into account when developing individualized sex-based medicine for EDX reference values. Finally, older (aged > 70) patients with absent sensory responses should be evaluated for neuropathy in selected cases.
ABBREVIATIONS
EDX | Electrodiagnosis |
EMG | Electromyography |
NCS | Nerve conduction study |
FUNDING
No funding was received for the preparation of this manuscript.
CONFLICT OF INTEREST
The authors have no conflict of interest to report.
DATA AVAILABILITY STATEMENT
The data supporting the findings of this study are available on request from the corresponding author. The data are not publicly available due to privacy or ethical restrictions.
ETHICAL STANDARDS
This project was reviewed and approved by the Sheba Medical Center (SMC) institutional review board (9127-22-SMC).
SUPPLEMENTARY MATERIAL
[1] The supplementary material is available in the electronic version of this article: https://dx.doi.org/10.3233/JND-230052.
REFERENCES
[1] | Schiebinger L , Leopold SS , Miller VM Editorial policies for sex and gender analysis. Lancet. (2016) ;388: (10062):2841–2. |
[2] | Clayton JA , Collins FS Policy: NIH to balance sex in cell and animal studies. Nature. (2014) ;509: (7500):282–3. |
[3] | Huang CR , Chang WN , Chang HW , Tsai NW , Lu CH Effects of age, gender, height, and weight on late responses and nerve conduction study parameters. Acta Neurol Taiwan. (2009) ;18: (4):242–9. |
[4] | Robinson LR , Rubner DE , Wahl PW , Fujimoto WY , Stolov WC Influences of height and gender on normal nerve conduction studies. Arch Phys Med Rehabil. (1993) ;74: (11):1134–8. |
[5] | Kim JY , Kim E , Shim HS , Lee JH , Lee GJ , Kim K , et al. Reference Standards for Nerve Conduction Studies of Individual Nerves of Lower Extremity With Expanded Uncertainty in Healthy Korean Adults. Ann Rehabil Med. (2022) ;46: (1):9–23. |
[6] | Stetson DS , Albers JW , Silverstein BA , Wolfe RA Effects of age, sex, and anthropometric factors on nerve conduction measures. Muscle Nerve. (1992) ;15: (10):1095–104. |
[7] | Owolabi LF , Jibo AM , Ibrahim A , Owolabi SD , Gwaram BA , Onwuegbuzie G Normative data for ulnar nerve conduction and the influence of gender and height on ulnar nerve conduction velocity in healthy Nigerians. Ann Afr Med. (2022) ;21: (1):43–8. |
[8] | Greathouse DG , Currier DP , Joseph BS , Shippee RL , Matulionis DH Electrophysiologic responses of human sural nerve to temperature. Phys Ther. (1989) ;69: (11):914–22. |
[9] | Hennessey WJ , Falco FJ , Goldberg G , Braddom RL Gender and arm length: influence on nerve conduction parameters in the upper limb. Arch Phys Med Rehabil. (1994) ;75: (3):265–9. |
[10] | Rechlin RK , Splinter TFL , Hodges TE , Albert AY , Galea LAM An analysis of neuroscience and psychiatry papers published from and outlines opportunities for increasing discovery of sex differences. Nat Commun. (2022) ;13: (1):2137. |
[11] | Mauvais-Jarvis F , Bairey Merz N , Barnes PJ , Brinton RD , Carrero JJ , DeMeo DL , et al. Sex and gender: modifiers of health, disease, and medicine. Lancet. (2020) ;396: (10250):565–82. |
[12] | Eid RS , Gobinath AR , Galea LAM Sex differences in depression: Insights from clinical and preclinical studies. Prog Neurobiol. (2019) ;176: :86–102. |
[13] | Irvine K , Laws KR , Gale TM , Kondel TK Greater cognitive deterioration in women than men with Alzheimer’s disease: a meta analysis. J Clin Exp Neuropsychol. (2012) ;34: (9):989–98. |
[14] | Golden LC , Voskuhl R The importance of studying sex differences in disease: The example of multiple sclerosis. J Neurosci Res. (2017) ;95: (1-2):633–43. |
[15] | Westergaard D , Moseley P , Sorup FKH , Baldi P , Brunak S Population-wide analysis of differences in disease progression patterns in men and women. Nat Commun. (2019) ;10: (1):666. |
[16] | Zucker I , Prendergast BJ Sex differences in pharmacokinetics predict adverse drug reactions in women. Biol Sex Differ. (2020) ;11: (1):32. |
[17] | Boss GR , Seegmiller JE Age-related physiological changes and their clinical significance. West J Med. (1981) ;135: (6):434–40. |
[18] | Mencel J , Jaskolska A , Marusiak J , Kisiel-Sajewicz K , Siemiatycka M , Kaminski L , et al. Effect of gender, muscle type and skinfold thickness on myometric parameters in young people. PeerJ. (2021) ;9: :e12367. |
[19] | Rivner MH , Swift TR , Malik K Influence of age and height on nerve conduction. Muscle Nerve. (2001) ;24: (9):1134–41. |
[20] | LaFratta CW , Canestrari R A comparison of sensory and motor nerve conduction velocities as related to age. Arch Phys Med Rehabil. (1966) ;47: (5):286–90. |
[21] | Lafratta CW , Smith OH A Study of the Relationship of Motor Nerve Conduction Velocity in the Adult to Age, Sex, and Handedness. Arch Phys Med Rehabil. (1964) ;45: :407–12. |
[22] | Mayer RF Nerve Conduction Studies in Man. Neurology. (1963) ;13: :1021–30. |
[23] | Norris AH , Shock NW , Wagman IH Age changes in the maximum conduction velocity of motor fibers of human ulnar nerves. J Appl Physiol. (1953) ;5: (10):589–93. |
[24] | Wagman IH , Lesse H Maximum conduction velocities of motor fibers of ulnar nerve in human subjects of various ages and sizes. J Neurophysiol. (1952) ;15: (3):235–44. |
[25] | Dyck PJ , O’Brien PC , Litchy WJ , Harper CM , Daube JR , Dyck PJ Use of percentiles and normal deviates to express nerve conduction and other test abnormalities. Muscle Nerve. (2001) ;24: (3):307–10. |
[26] | Chen S , Andary M , Buschbacher R , Del Toro D , Smith B , So Y , et al. Electrodiagnostic reference values for upper and lower limb nerve conduction studies in adult populations. Muscle Nerve. (2016) ;54: (3):371–7. |
[27] | Practice parameter for electrodiagnostic studies in carpal tunnel syndrome: summary statement. American Association of Electrodiagnostic Medicine, American Academy of Neurology, American Academy of Physical Medicine and Rehabilitation. Muscle Nerve. (1993) ;16: (12):1390–1. |
[28] | Tavee JO , Polston D , Zhou L , Shields RW , Butler RS , Levin KH Sural sensory nerve action potential, epidermal nerve fiber density, and quantitative sudomotor axon reflex in the healthy elderly. Muscle Nerve. (2014) ;49: (4):564–9. |
[29] | Ryan CS , Conlee EM , Sharma R , Sorenson EJ , Boon AJ , Laughlin RS Nerve conduction normal values for electrodiagnosis in pediatric patients. Muscle Nerve. (2019) ;60: (2):155–60. |
[30] | Ma X , Huang R , Wu X , Zhang P Dualmarker: a flexible toolset for exploratory analysis of combinatorial dual biomarkers for clinical efficacy. BMC Bioinformatics. (2021) ;22: (1):127. |
[31] | Ialongo C Understanding the effect size and its measures. Biochem Med (Zagreb). (2016) ;26: (2):150–63. |
[32] | Richardson JT Eta squared and partial eta squared as measures of effect size in educational research. Educational Research Review. (2011) ;6: (2):135–47. |
[33] | Lakens D Calculating and reporting effect sizes to facilitate cumulative science: a practical primer for t-tests and ANOVAs. Frontiers in Psychology. (2013) ;4: :863. |
[34] | Alemdar M Effects of gender and age on median and ulnar nerve sensory responses over ring finger. J Electromyogr Kinesiol. (2014) ;24: (1):52–7. |
[35] | Vlassoff C Gender differences in determinants and consequences of health and illness. J Health Popul Nutr. (2007) ;25: (1):47–61. |
[36] | Soldin OP , Mattison DR Sex differences in pharmacokinetics and pharmacodynamics. Clin Pharmacokinet. (2009) ;48: (3):143–57. |
[37] | Shivji Z , Jabeen A , Awan S , Khan S Developing Normative Reference Values for Nerve Conduction Studies of Commonly Tested Nerves among a Sample Pakistani Population. J Neurosci Rural Pract. (2019) ;10: (2):178–84. |
[38] | Crowder C , Austin D Age ranges of epiphyseal fusion in the distal tibia and fibula of contemporary males and females. J Forensic Sci. (2005) ;50: (5):1001–7. |
[39] | Abdel-Malek AK , Ahmed AM , el-Sharkawi SA , el-Hamid NA Prediction of stature from hand measurements. Forensic Sci Int. (1990) ;46: (3):181–7. |
[40] | Firooz A , Sadr B , Babakoohi S , Sarraf-Yazdy M , Fanian F , Kazerouni-Timsar A , et al. Variation of biophysical parameters of the skin with age, gender, and body region. ScientificWorldJournal. (2012) )386936. |
[41] | Bolton CF , Carter KM Human sensory nerve compound action potential amplitude: variation with sex and finger circumference. J Neurol Neurosurg Psychiatry. (1980) ;43: (10):925–8. |
[42] | Johnson SA , Shouman K , Shelly S , Sandroni P , Berini SE , Dyck PJB , et al. Small Fiber Neuropathy Incidence, Prevalence, Longitudinal Impairments, and Disability. Neurology. (2021) ;97: (22):e2236–e47. |
[43] | Wolfe F , Hassett AL , Walitt B , Michaud K Mortality in fibromyalgia: a study of 8,186 patients over thirty-five years. Arthritis Care Res (Hoboken). (2011) ;63: (1):94–101. |
[44] | Bennett RM , Jones J , Turk DC , Russell IJ , Matallana L An internet survey of 2,596 people with fibromyalgia. BMC Musculoskelet Disord. (2007) ;8: :27. |
[45] | Palve SS , Palve SB Impact of Aging on Nerve Conduction Velocities and Late Responses in Healthy Individuals. J Neurosci Rural Pract. (2018) ;9: (1):112–6. |


