
The neurocognitive profile of adults with Becker muscular dystrophy in the Netherlands
Abstract
Background:
In Becker muscular dystrophy evidence for neurocognitive and behavioral comorbidity is evolving. More insight into the extend of these problems is of great importance for early detection and remediation in clinical practice.
Objective:
In this study we aimed to describe the neurocognitive and behavioral features of a Dutch adult cohort of BMD patients, and to evaluate correlations to motor function outcomes.
Methods:
28 adult BMD patients were included. Intelligence, executive functioning, verbal memory and reaction times were assessed cross-sectionally. Additionally, patients completed questionnaires on behavioral and emotional symptoms, psychosocial and executive functions. Results were compared to normative data and correlated with disease severity as measured by the 10-meter run/walk test and Performance of the Upper Limb version 1.2.
Results:
15 patients (53.6%) had a high educational level despite frequent grade repeating (48.3%) during primary or secondary school. Neuropsychological testing revealed that intellectual abilities, verbal memory, processing speed and executive functioning were statistically significant below average, but still within normal range. Regarding outcomes of the behavioral questionnaires, no significant differences were reported compared to the norm population. No relevant correlations with disease severity were found.
Conclusions:
This cohort of adult BMD patients exhibits minor cognitive impairments and no significant behavioral problems. The lower outcomes on processing speed and verbal memory, combined with the relatively high prevalence of grade repeating during primary and secondary school, implies that these minor impairments played a role in childhood. However, the on average high educational levels suggests that they grow out of their cognitive impairments with ageing.
INTRODUCTION
Becker muscular dystrophy (BMD) is an X-linked genetic disorder caused by mutations in the DMD gene leading to the production of variable levels of partially functioning dystrophin. The disease course is heterogenous, ranging from adult onset muscle cramps with normal life expectancy, to severe muscle weakness by the age of twenty and cardiomyopathy [1–3]. In the more severe allelic disorder Duchenne muscular dystrophy (DMD), learning and behavioral problems have been well established and linked to the absence of one or more dystrophin isoforms in the brain [4–8]. Full-scale intelligence quotient score (FSIQ) is approximately one standard deviation (SD) below the mean and <70 in 30% [9]. High prevalence rates of behavioral disorders include attention-deficit hyperactivity disorder (ADHD) [4, 10, 11], anxiety disorder [11], autism spectrum disorders (ASD) [5, 10–12] and obsessive-compulsive disorder (OCD) [10, 11].
It is unclear if a similar neuropsychological profile is part of the BMD disease spectrum. Earlier studies report a within normal range FSIQ (87.8–95.6) [13–18]. Several studies described attention problems, language/speech delays and difficulties in academics skills (reading, math and spelling) [13, 14]. Behavioral disorders reported include ADHD, ASD, aggressive behavior, OCD, anxiety and depression. Nevertheless, studies were limited in the number of neurocognitive tests administered, performed in relatively young patients likely to be more severely affected, or based on retrospective case series. In this prospective study we aimed to describe the neurocognitive and behavioral features of a Dutch adult cohort of BMD patients, and to evaluate correlations to motor function outcomes.
METHODS
Study participants and design
In 2014, a 4-year BMD natural history study started at the Leiden University Medical Center (LUMC). Study participants were recruited from the nationwide registry, the Dutch Dystrophinopathy Database (DDD) [19]. In order to be eligible, participants had to be 18 years or older and diagnosed with BMD according to the following criteria: [1] in-frame mutation in the DMD gene, or [2] any other mutation in the DMD gene with a mild disease course defined by wheelchair dependence after the age of 16 without the use of corticosteroids, or [3] no known mutation in the DMD gene, but reduced dystrophin levels in a previous muscle biopsy. All participants’ mutations in the DMD gene were reviewed and confirmed by a laboratory clinical geneticist (HAvD).
The BMD natural history study protocol consisted of a yearly one-day visit to the LUMC, during which several tests were performed. Neuropsychological testing was conducted during the 3rd or 4th study visit. BMD patients were eligible for neuropsychological testing when having an adequate proficiency in Dutch, both written and oral, and no visual or hearing impairments that could interfere with cognitive testing. To reduce the burden for study participants neuropsychological testing was maximized at two hours.
This study was approved by the LUMC medical ethical committee (METC). Written informed consent was obtained from all study participants.
Neuropsychological evaluation
Neuropsychological assessment was performed by a qualified psychologist (DH) and a trained neurologist (ZK). Prior to testing, all participants completed a questionnaire on demographic and disease-related parameters. In addition, information was gathered on neurodevelopmental and behavioral diagnoses, learning disabilities and educational levels. Educational levels were scored using the Dutch Verhage scale consisting of three ordinal categories: [1] Low: less than six years of primary education or finished primary education, less than two years of low-level secondary education or finished low-level secondary education, [2] Middle: finished average-level secondary education and [3] High: finished high level secondary education or university degree [20]. At last, we asked participants about difficulties with automatization during primary education (i.e. troubles with learning digits, letters, colors, math, left/right differences, days of the week, time perception, rhymes and songs) or repeating a year during primary or high school.
Neurocognitive assessments
Intellectual functioning was assessed with the Dutch version of the Wechsler Adult Intelligence Scale-IV (WAIS-IV) [21]. Due to time restrictions requested by the ethical committee we decided to administer eight out of ten subtests of the WAIS-IV to estimate the four indexes: Verbal Comprehension Index (VCI), Perceptual Reasoning Index (PRI), Working Memory Index (WMI) and Processing Speed Index (PSI) [21]. The VCI was assessed using two out of three subtests, the PRI was assessed using two out of four subtests and the WMI and PSI were assessed using all subtests. The estimated FSIQ was defined by the mean score of the 8 subtest multiplied by 10 [22].
Reaction times were quantified via the computerized task (FePsy) yielding simple visual and auditory reaction times of the dominant hand [23]. Executive functions were assessed with two trials of the Zoo Map subtest of the Behavioral Assessment of the Dysexecutive Syndrome (BADS) battery to evaluate planning skills [24]. Furthermore, a subtest of the Groninger Intelligence test-2 (GIT-2) was used to assess word fluency [25]. Verbal immediate recall, delayed memory recall, and memory recognition were assessed by the Rey auditory verbal learning test (RAVLT) [26]. Full description of the applied tests and data interpretation can be found in the supplementary Table 1.
2.4Behavioral self-report questionnaires
The following questionnaires were used: [1] Behavior Rating Inventory of Executive Function for Adults (BRIEF-A), a 75-item questionnaire capturing self-reported everyday executive functioning [2, 27] Strengths and Difficulties Questionnaire (SDQ) [28], screening for mental health (behavioral and emotional) problems and validated in patients with DMD [3, 12]. The Hospital Anxiety and Depression Scale (HADS), described as reliable and valid for assessing anxiety and depression in somatic and psychiatric patients [4, 29] the Dutch Symptom CheckList-90-Revised (SCL-90-R) [30], consisting of 90 items covering eight domains of psychological symptoms: anxiety, depression, agoraphobia, somatization, cognitive performance deficits, interpersonal sensitivity, hostility and sleep difficulties.
Disease characteristics and functional assessments
At study baseline the following clinical data were collected: [1] age at diagnosis, [2] age at loss of ambulation, [3] medical history (specifically occurrence of cardiomyopathy and use of respiratory support) and [4] medication use. At time of neuropsychological testing wheelchair dependence was classified into three categories: [1] permanent wheelchair use, [2] intermittent use (defined as still being able to walk at least 10 meters, use of a walking aid was allowed) and [3] no wheelchair use.
Functional assessments included the 10-MRWT and the PUL version 1.2 and were performed as described before [31, 32]. For the 10-MWRT the velocity was calculated as this results in a linear pattern of decline that more adequately represents the zero velocities of patients that are unable to perform the test. The PUL 1.2 total score and PUL 1.2 distal-wrist function were used to evaluate whether the cognitive tasks that require motor abilities were influenced by impaired functions of upper extremities.
Statistical analysis
Participant characteristics were represented as mean (SD), median (range) or absolute number (proportion). The age-related norm scores of the neuropsychological tests: the WAIS-IV, FePsy reaction times, GIT-2 Fluency and RAVLT test were transformed into z-scores to compare the outcomes of the BMD population to normative data. Differences between the BMD participants and normative data were tested using one sample t-tests or sign tests. Effect sizes were calculated to indicate the strength of the significant effects observed and effect sizes were defined as: 0.20–0.50 = small, 0.50–0.80 = medium, and ≥0.80 = large. The BADS Zoo map scores of trials 1 and 2 were evaluated using raw scores as no norm-values were available for the trials. Differences between the outcomes of the trials were tested using a paired t-test. Scores of behavioral questionnaires were represented as mean (SD; range) and number and proportion of abnormal clinical scores according to the manual of the four behavioral questionnaires. The means (SD) of the HADS, SCL-90-R and BRIEF-A of the BMD participants were compared to age matched normative data [27, 30, 33]. No normative data were available of the SDQ. Spearman correlation analyses were used to investigate possible associations between motor function scores (i.e. 10-MRWT velocity) and intellectual functioning (i.e. the four indexes of the WAIS-IV and the estimated FSIQ). Spearman correlations were also used to evaluate whether the upper extremity functional scores (i.e. the PUL 1.2 total score and PUL 1.2 distal-wrist function score) correlated with cognitive tasks that required the use of the dominant hand (i.e. PSI of the WAIS-IV, and BADS trial 1 and trial 2). At last correlations were used to assess the relation between motor function and reported behavioral problems. All statistical analyses were performed using SPSS version 24.0 for MAC OS X.
Data availability
The data underlying this article will be shared on reasonable request by the corresponding author.
RESULTS
Participant characteristics
Thirty genetically confirmed BMD adults were approached for neuropsychological testing. One participant was excluded because he could not speak or understand the Dutch language and another participant refused to participate for personal reasons, leaving a total of 28 participants. None of them had ever been treated with corticosteroids. Two participants did not complete cognitive subtests requiring motor abilities (FePsy tests, the Block Design test, Symbol Search, and Coding) due to severe arm and hand weakness with minimal function and contractures. One participant did not perform the RAVLT recognition trial and in the same patient the Symbol Search test was not reliable due to miscomprehension of instructions. Finally, one participant did not complete the self-report behavioral questionnaires despite repeated requests during follow-up. Demographic and disease-related characteristics are displayed in Table 1. Genetic mutations are listed in supplementary Table 2.
Table 1
Participant characteristics
| Total cohort (N = 28) | |
| Age in years: mean (SD; range) | 44.3 (11.6; 22–70.3) |
| Age first symptoms: mean (SD; range) | 8.8 (5.7; 3–23) |
| Age at diagnosis: mean (SD; range) | 20.7 (13.2; 3–53) |
| Handedness, right: n (%) | 20 (71.5) |
| Wheelchair dependence | |
| Never: n (%) | 14 (50) |
| Intermittent: n (%) | 6 (21.4) |
| Permanent: n (%) | 8 (28.6) |
| Mean age permanent wheelchair use (SD; range) | 34.3 (14.4; 13–57) |
| Functional measures | |
| 10-MRWT performed: n (%) | 19 (67.9) |
| Velocity (m/s) 10-MRWT non-wheelchair users: median (range) | 0.54 (0.27 –1.19) |
| Velocity (m/s)10-MRWT intermittent wheelchair users: median (range) | 1.33 (1.05 –1.62) |
| PUL 1.2 performed: n (%) | 28 (100) |
| PUL 1.2 total score: median (range) | 74 (24–74) |
| PUL 1.2 distal hand-wrist function score: median (range) | 24 (17–24) |
| Educational levels according to the Dutch Verhage scale* | |
| Low: n (%) | 2 (7.1) |
| Middle: n (%) | 11 (39.3) |
| High: n (%) | 15 (53.6) |
Results are mean (SD; range) or median (range) for continuous variables, and frequencies (%) for categorical variables. 10-MRWT = 10-meter run walk test. PUL = Performance of the Upper Limb (with a maximum total score of 74 and for hand-wrist function 24). *Verhage classifies educational levels into three ordinal categories: [1] Low: less than 6 years of primary education OR finished primary education OR finished primary education and less than 2 years of low-level secondary education OR finished low-level secondary education [2] Middle: finished average-level secondary education [3] High: finished high level secondary education OR university degree.
Table 2
Wechsler Intelligence Scale IV for Adult index scores for males with Becker muscular dystrophy
| WAIS-IV scores | n | Mean (SD) | Min | Max | Test statistic value | p | 95% CI | |
| Lower | Upper | |||||||
| FSIQ | 25 | 91.4 (13.4) | 72 | 119 | –3.19 | 0.004* | –14.1 | –3.0 |
| VCI | 28 | 98.5 (14.4) | 70 | 129 | –0.55 | 0.587 | –7.1 | 4.1 |
| PRI | 26 | 94.0 (17.4) | 68 | 129 | –1.77 | 0.090 | –13.1 | 1.0 |
| WMI | 27 | 95.8 (14.0) | 74 | 125 | –1.56 | 0.131 | –9.7 | 1.3 |
| PSI | 25 | 86.7 (12.4) | 66 | 114 | –5.38 | 0.000** | –18.4 | –8.2 |
Total group compared to normative mean value of 100 and SD of 15. FSIQ = Full Scale IQ, VCI = Verbal Comprehension Index, PRI = Perceptual Reasoning Index, WMI = Working Memory Index, PSI = Processing Speed Index. Min = Minimum, Max = Maximum. WAIS-IV = Wechsler Adult Intelligence Scale fourth edition. Test statistic value = t-values of one-sample t-test, CI = Confidence Intervals. *p-value is considered statistically significant at.05 (two sided), **p-value is considered statistically significant at.01 (two sided).
Neurocognitive assessment
Intellectual abilities
WAIS-IV outcomes of total estimated FSIQ and indexes for VCI (estimated) and PRI (estimated), WMI, and PSI are shown in Table 2. The mean estimated FSIQ was significantly lower compared to the normative data (91.4, SD = 13.4, p < 0.004, d = 0.60), but still within normal range. The distribution of the FSIQ outcomes showed that none of the BMD patients had an estimated IQ score <70. Ten had a borderline score (IQ 70 –85), fourteen performed on average (85 –115), and only one participant had an estimated IQ score of >115. Of the four indices, only the mean PSI was significantly lower in BMD compared to normative data (86.7, SD = 12.4, p < 0.001, d = 0.97).
Reaction times
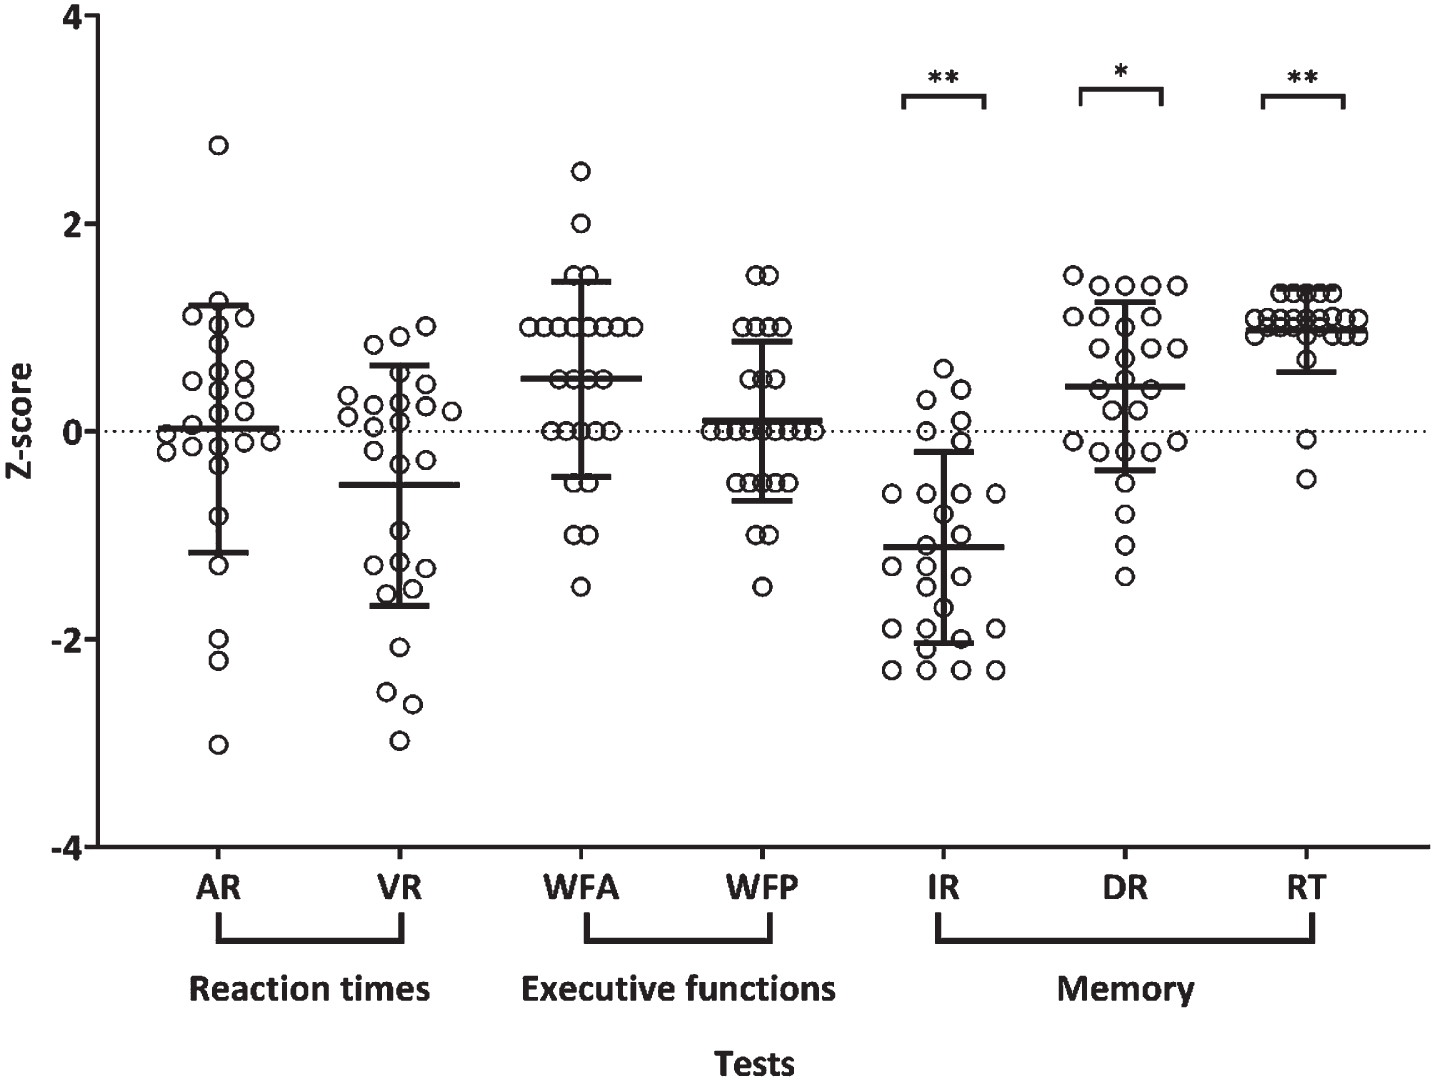
Figure 1 displays the outcomes of BMD participants on auditory and visual reaction times and executive functioning. The mean z-scores for auditory (0.02, SD = 1.19) and visual (–0.52, SD = 1.16) reaction times of the BMD participants did not differ significantly from the norm population; auditory simple reaction, z [25] = 0.67, p = 0.501 and visual simple reaction, z [25] = –1.58, p = 0.115.
Fig. 1
Scatter plot representing BMD participants’ performances on reaction times, executive functions and memory. The graph plots the individual data points per test and superimposes a horizontal line at the arithmetic mean, and error bars showing the±SD. N = 28 adult male participants with BMD. AR = Auditory Reaction time, VR = Visual Reaction time, WFA = Word Fluency Animals, WFP = Word Fluency Professions, IR = Immediate recall, DR = Delayed recall and RT = Recognition trial. AR and VR required motor abilities. For visualization of outcomes one participant was excluded from the figure as he had a z-score of –7 (outlier) on VR, but his outcome was included in the statistical analyses. p-values represent the comparison with normative data. *is considered statistically significant at 0.05 (two sided), **p-value is statistically significant at 0.01 (two-sided).
Executive functions
BMD participants performances on GIT-2 word fluency of animals (WFA) and professions (WFP) fell within the normal range (WFA mean z-score = 0.50, SD = 0.94; WFP mean z-score = 0.10, SD = 0.76), but outcomes of the BMD participants were significantly higher compared to the norm population for reproducing WFA, t = 2.72, p = 0.012, d = 0.66) but not for WFP (t [24] = 0.64, p = 0.526). Planning skills of the BMD participants were lower on the BADS for spontaneous planning (trial 1 mean = 4.0, SD = 3.30) than for structured pre-formulated planning (trial 2 mean = 7.4, SD = 1.70), the difference between trial 1 and 2 was statistically significant (t [25] = –5.545, p < 0.001).
Verbal memory
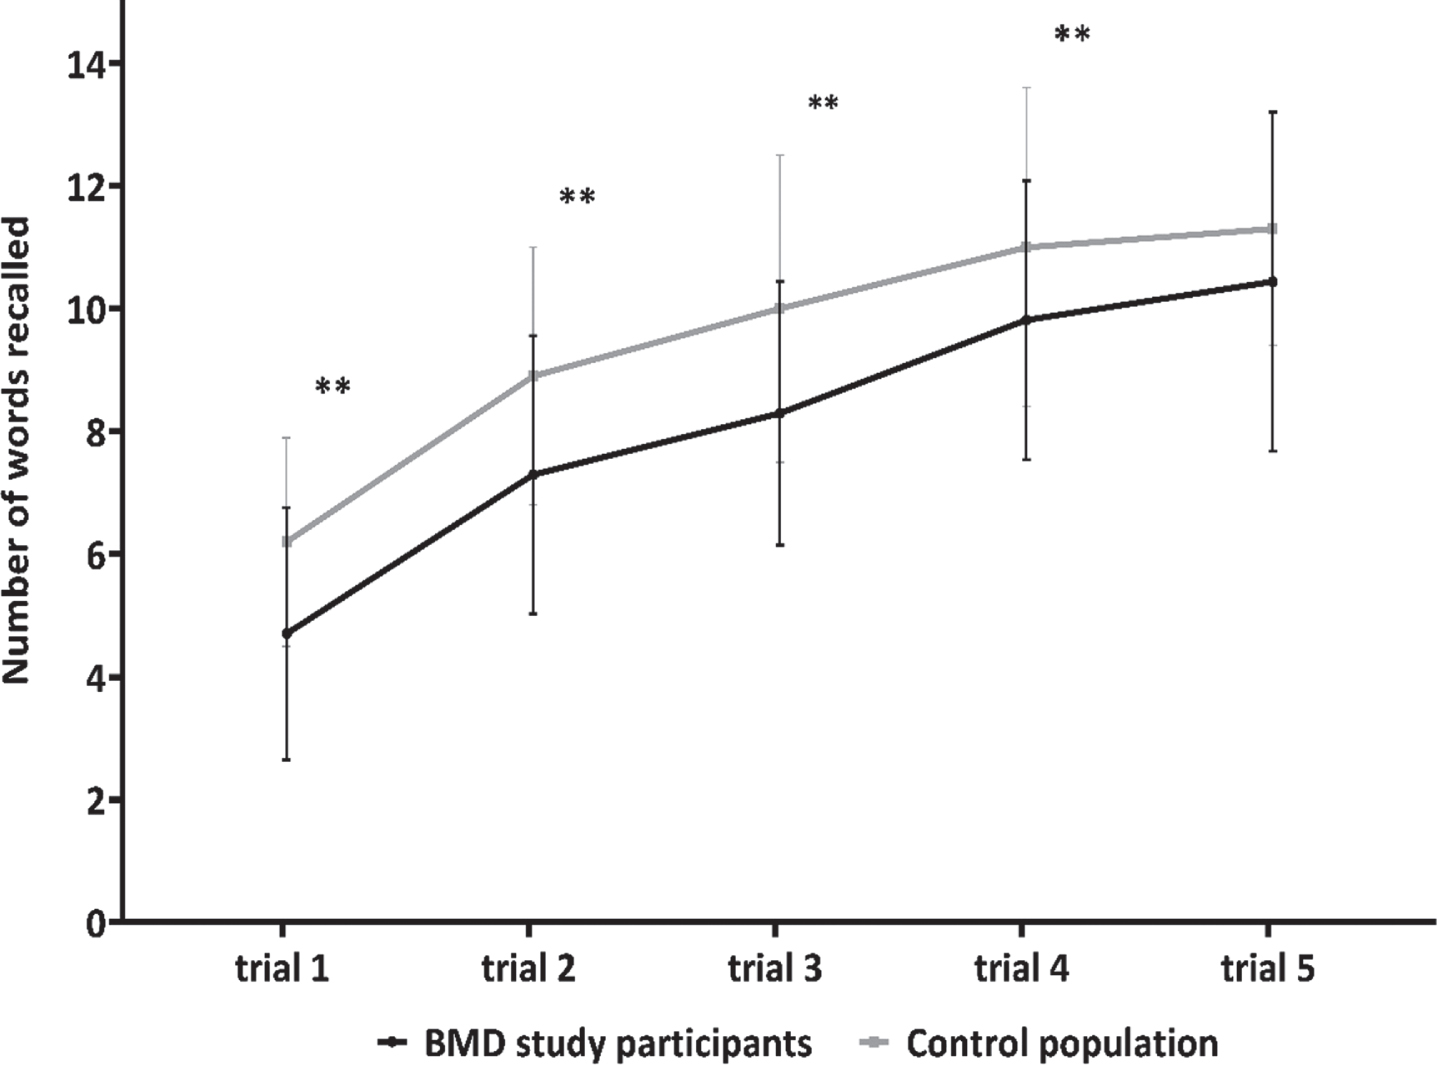
Z-scores of total immediate recall, delayed recall, and recognition trial on the Rey auditory verbal learning task are also depicted in Fig. 1. BMD participants had a significantly lower total immediate recall score (mean z-score = –1.12, SD = 0.92) compared to the normative data (t [26] = –6.315, p < .001, d = 0.50). The mean z-score for delayed recall (mean = 0.43, SD = 0.81) of the BMD study participants fell within normal range and were significantly higher compared to the normative data (t [26] = 2.761, p = 0.010, d = 0.47). A significant higher score was also found for the recognition trial (mean z-score = 0.97, SD = 0.40) compared to the normative data (z [25] = 4.400, p < 0.001). No indication for malingering was found in our patient population. The mean outcome on each of the five immediate recall trials of the BMD participants was analyzed separately and compared to normative data. To visualize the learning curve of both groups results are depicted in Fig. 2. The BMD patients had significantly lower outcomes on trial 1 (t [26] = –4.174, p < 0.000, d = 0.88), trial 2 (t [26] = –3.969, p = 0.001, d = 0.77), trial 3 (t [26] = –4.428, p < 0.000, d = 0.84) and trial 4 (t [26] = –2.799, p = 0.010, d = 0.53). A non-significant difference was found between BMD participants and the norm values for trial 5 (t [26] = –1.549, p = 0.134).
Fig. 2
Verbal memory: immediate recall learning curve. The black line represents the mean amount of words (with error bars) recalled per trial of BMD study participants (N = 28). The grey line represents the mean amount of words (with error bars) recalled per trial for a norm population (N = 41).
Behavioral self-report questionnaires
Prevalence rates of self-reported behavioral problems are displayed in Table 3. Outcomes on the SDQ, BRIEF-A and HADS fell within normal range compared to the normative data. The mean score of the SCL-90-R anxiety subscale was statistically significantly lower and the mean insufficiency subscale was statistically significantly higher than the (mean) norm values, but all individual outcomes fell within normal range. Compared to the clinical ranges, none performed above the cut-off value of the SDQ total score and only one above the HADS cut-off for anxiety. Three participants (11.1%) had clinically abnormal scores on BRIEF-A total score and nine (33.3%) on the SCL-90-R total score. Prevalence rates of the SCL-90-R subscale were also high for experiencing cognitive difficulties, not being satisfied with relationships with other people, sleep difficulties, having somatic complaints, depression, and hostility (Table 3).
Table 3
Outcomes of behavioral self-report questionnaires of males with Becker muscular dystrophy
| Behavioral | Mean (SD) of | Min | Max | Abnormal clinical range (%) | Definition of abnormal clinical range |
| questionnaires | n = 27 | ||||
| SDQ | |||||
| Emotional symptoms | 1.6 (1.7) | 0 | 6 | 1 (3.7) | 6 |
| Conduct problems | 1.0 (1.0) | 0 | 3 | 0 | 4 |
| Hyperactivity | 2.4 (1.9) | 0 | 8 | 1 (3.7) | 7 |
| Peer problems | 1.5 (1.2) | 0 | 4 | 0 | 5 |
| Prosocial behavior | 8.6 (1.7) | 4 | 10 | 2 (7.4) | 4 |
| Total score | 6.5 (3.1) | 1 | 13 | 0 | 16 |
| BRIEF-A | |||||
| Inhibition | 45.9 (8.0) | 36 | 63 | 0 | 65 |
| Shifting | 46.3 (8.6) | 37 | 66 | 1 (3.7) | 65 |
| Emotional control | 43.6 (6.4) | 38 | 61 | 0 | 65 |
| Self-monitoring | 46.3 (8.9) | 38 | 74 | 2 (7.4) | 65 |
| Initiative | 47.8 (9.1) | 38 | 73 | 2 (7.4) | 65 |
| Working memory | 48.8 (10.5) | 39 | 79 | 3 (11.1) | 65 |
| Planning | 48.4 (8.1) | 38 | 71 | 2 (7.4) | 65 |
| Task monitoring | 47.3 (6.4) | 35 | 63 | 0 | 65 |
| Organization materials | 46.9 (8.6) | 37 | 66 | 1 (3.7) | 65 |
| Behavior index | 44.2 (6.2) | 35 | 61 | 0 | 65 |
| Metacognitive index | 48.3 (8.4) | 36 | 71 | 1 (3.7) | 65 |
| Total scale score | 48.1 (11.1) | 35 | 82 | 3 (11.1) | 65 |
| SCL-90-R | |||||
| Anxiety | 11.6 (1.8) | 10 | 16 | 3 (11.1) | 15 |
| Agoraphobia | 7.7 (1.1) | 7 | 11 | 5 (18.5) | 9 |
| Depression | 20.3 (4.4) | 16 | 31 | 5 (18.5) | 24 |
| Somatic complaints | 17.9 (4.5) | 13 | 27 | 7 (25.9) | 19 |
| Insufficiency | 14.1 (3.6) | 9 | 21 | 11 (40.7) | 15 |
| Sensitivity | 23.1 (4.6) | 18 | 32 | 8 (29.6) | 27 |
| Hostility | 7.0 (1.4) | 6 | 12 | 4 (14.8) | 9 |
| Sleep problems | 4.8 (2.0) | 3 | 11 | 9 (33.3) | 6 |
| Total scale score | 117.4 (18.5) | 91 | 163 | 9 (33.3) | 124 |
| HADS | |||||
| Anxiety | 3.2 (2.1) | 0 | 8 | 1 (3.7) | >8 |
| Depression | 2.6 (1.9) | 1 | 7 | 0 | >8 |
NOTE: SDQ = Strengths and Difficulties questionnaire, BRIEF = Behavior Rating Inventory of Executive Functions, SCL-90 = Symptom Checklist- 90 items, HADS = Hospital Anxiety and Depression Scale. Min = Minimum, Max = Maximum.
Correlations between motor function, neurocognitive, and behavioral outcomes
Results showed a significant correlation between the 10-MWRT velocity and the estimated FSIQ of the WAIS-IV (rs= 0.42, p = 0.04). There was also a significant correlation between the 10-MWRT and the PRI (rs= 0.40, p = 0.04) of the WAIS-IV. However, no correlation was found between the 10-MWRT and the VCI (rs= 0.15, p = 0.46), PSI (rs= 0.34, p = 0.10), and the WMI (rs= 0.27, p = 0.17) of the WAIS-IV.
When correlating the cognitive tests that required an intact function of the dominant arm and hand (i.e. the PSI of the WAIS-IV and the BADS Zoo Map trial 1 and 2) with results of the upper limb motor function test (i.e. PUL 1.2), no significant correlations were found: PSI of the WAIS-IV and the PUL 1.2 total score (rs= 0.10, p = 0.65), PSI and the PUL 1.2 distal hand-wrist function score (rs= –0.02, p = 0.93), BADS Zoo Map trial 1 and PUL 1.2 total score (rs= 0.24, p = 0.25), BADS Zoo MAP trial 1 and PUL 1.2 distal hand wrist score (rs= 0.34, p = 0.09), BADS Zoo Map trial 2 and PUL 1.2 total score (rs= 0.02, p = 0.93), BADS Zoo Map trial 2 and PUL 1.2 distal hand-wrist score (rs= 0.17, p = 0.42).
Correlations between the 10-MRWT velocity and the most frequently reported behavioral problems showed no significant correlation for insufficiency in thinking (rs= 0.36, p = 0.15), sensitivity (rs= 0.01, p = 0.98), sleep difficulties (rs= 0.27, p = 0.28), depression (rs= 0.04, p = 0.89), and hostility (rs= –0.07, p = 0.80). A significant correlation was found with somatic complaints (rs= 0.48, p = 0.05).
DISCUSSION
In this study we described the neurocognitive functioning and behavioral features of a sample of 28 unselected Dutch adult BMD patients. Neurocognitive outcomes displayed that BMD participants had a significantly lower estimated FSIQ (mean 91.4) compared to normative data. This lower FSIQ score was caused by the significantly lower performance on processing speed. However, scores still fell within normal range. Outcomes on short term verbal memory were also significantly lower compared to normative data, but again within normal range. Concerning executive functioning, BMD adults had significantly more problems in spontaneous planning compared to structured planning. With respect to behavioral features, self-reported data showed that BMD patients did not report significantly more behavioral, emotional or psychosocial problems compared to the norm population.
The findings in intelligence are consistent with previous studies in pediatric and adult BMD patients that systematically evaluated the FSIQ. First, one study performed the Wechsler Adult Intelligence Scale for Children-III (WISC-III) in 16 pediatric and the Wechsler Adult Intelligence Scale-Revised (WAIS-R) in 7 adult BMD patients. The mean FSIQ score of the total group was 95.6, of whom three participants had a FSIQ <70 and two had a FSIQ of >130 [14]. In our study none of the participants had a FSIQ score of below 70 or above 130. Another study performed the Wechsler Adult Intelligence Scale-III (WAIS-III) in 76 adult BMD patients, resulting in a mean FSIQ score of 94.2, of whom three participants had scores within the abnormal range (<70) [16]. At last, a recent study performed the Weschler Intelligence Scale for Children-IV (WISC-IV) in four paediatric BMD patients (median age 12.6 years) and the FSIQ score was 102.2 (range 95–110) [18].
The lower outcomes on processing speed (i.e. mental slowness) are consistent with results in a pediatric population [14], but have not been reported in adult BMD patients before. Processing speed shows a strong relationship with the development of reading and math. In elementary school children first develop automaticity and speed in these skills. Automaticity is integrated into more complex tasks such as problem-solving and complex reading in the following school years. Fifty-five percent of the BMD patients in this study reported automatization problems on the questionnaire. In addition to the difficulties in processing speed, BMD patients also exhibited problems in learning new verbal information, as reflected by the significant lower outcomes on the first four out of five immediate recall trials of the RAVLT. Difficulties in acquiring and storing immediate information are important hallmarks of learning disabilities e.g. dyslexia or dyscalculia [26]. Previous BMD reports showed that these learning disabilities are prevalent features in pediatric and adult BMD patients [14, 15]. In our cohort however, only two patients had been diagnosed with dyslexia and one with dyscalculia. We hypothesize that in our adult BMD study population these learning disabilities may have been underdiagnosed in early childhood due to a lack of awareness for screening of BMD neurocognitive and learning problems in that time period (seventies-eighties). Despite this low prevalence of specific learning disabilities reported, 48.3% of the BMD study participants had repeated a class during primary or secondary school which is clearly above the Dutch national average of 26.7% [34]. This higher percentage of grade repeating during primary or secondary school might be reflected by the difficulties in processing speed and learning of new verbal information in our BMD patients. Despite the problems in the initial learning of new verbal information, BMD patients did show a positive learning curve and an above normal performance on delayed recall and recognition. In addition, the minor neurocognitive impairments found in this study do not seem to affect educational performances into adulthood, as a high percentage of middle- to high educational level was reported by the BMD study participants (92.9%). This suggests that our BMD patients seem to learn to cope with or grow out of their cognitive deficits.
The behavioral self-report questionnaires did not reveal a specific behavioral profile in the adult BMD study population. Scores on all standardized tests were within normal range and not indicative of mental health problems. The most frequently reported problems were hostility (14.8%), depressive mood symptoms (18.5%), social/relational problems (29.6%), and somatic complaints (25.9%). Furthermore, BMD patients had frequent sleeping difficulties (33.3%) and feelings of having problems with cognition (40.7%). These problems have been described previously in BMD patients and were related to environmental factors in daily life (e.g. bullying when attending school, stress at work).
Only one patient in our study had documented an ADHD diagnosis. This is in contrast with previous studies in pediatric and adult BMD patients with prevalence rates ranging between 11–36%. None of our BMD patients reported to have been diagnosed with ASD, which is again in contrast to previous studies reporting a prevalence of 11.4 to 17.6% [13, 16]. The lower prevalence rates of behavioral disorders in the current study might be the result of underdiagnosis of behavioral disorders in the past. Additionally, this study used self-report questionnaires for the reporting of behavioral diagnosis instead of the clinical assessments of all study participants.
Lower estimated FSIQ and PRI scores of the WAIS-IV were weakly associated with lower scores on the 10-MWRT. Although, the clinical relevance of this association remains unclear, it is important to stress that only the PSI of the WAIS-IV contained tests requiring an adequate upper limb motor function. No correlations were found between the PSI and the PUL 1.2 total or distal hand-wrist function scores. When comparing our results to the more severe disorder, DMD, there are some differences and overlapping features. In the DMD population the full scale IQ is on average one standard deviation below the mean of 100 [9, 33]. Furthermore, executive problems in verbal working memory (i.e. immediate recall of verbal information), processing speed and planning have also been proven in DMD, although more severe than in BMD [35–40]. In addition, despite the variability in ranges reported by previous DMD studies, overall higher incidences of behavioural disorders including ADHD, ASD, OCD, and anxiety have been described in DMD compared to BMD [4, 5, 10–12]. Recent DMD studies linked the neurocognitive and behavioral dysfunctions to the absence of one or multiple brain dystrophin isoforms, especially the shorter Dp140 and Dp71 [4, 6, 10–12, 41]. This relation has been limitedly assessed in BMD. In our study population most mutations are located between the promotor and the Dp140 translation start site in exon 51 of the DMD gene (NM_004006.2), making it difficult to predict whether Dp140 is being expressed or its function affected. No patients with distal mutations affecting the Dp71 isoform were included. Detailed information on the expression of Dp140 of our BMD study population was lacking, therefore we looked at the effect of mutation location on the estimated FSIQ and executive functions. Participants were divided based on their mutation into two structural groups: group 1. mutations of exon 44 and downstream (Dp140 expression/function potentially affected) and group 2. mutations localized upstream of (and not including) exon 44 (Dp140 expression/function not affected). No significant difference in the mean outcomes of the estimated FSIQ and executive functions were found between the two groups. However, further studies with detailed information on dystrophin isoform expression in BMD patients and the effect on neurocognitive and behavioral functioning are needed.
This study has some limitations. First, a complete full-scale IQ could not be calculated because we collected data of eight out of ten subtests of the WAIS-IV. The FSIQ outcomes should therefore be interpreted with care. Secondly, our cognitive and behavioural results were compared to normative data in testmanuals. Thirdly, to assess the presence of behavioural, emotional and psychosocial problems we used self-report instruments. A clinical interview might shed more light on the presence of neuropsychiatric comorbidity. Fourthly, our sample size was limited to 28 BMD participants making results less generalizable to the overall adult BMD population.
Finally, although 59% of the eligible BMD patients in the national registry consented to participate, it is possible that cognitive and behavioral characteristics played a role in the decision to deny participation in the overall BMD natural history study protocol that required 4 yearly visits including extensive motor assessments.
CONCLUSIONS
This study in a Dutch adult sample of BMD males reveals minor neurocognitive impairments involving processing speed, initial verbal learning and automatization, but no indicators of specific behavioral and mental health problems. A relatively high prevalence of grade repeating during primary and secondary school, was followed by on average high educational levels. Further research is needed in a larger population of BMD adults using multiple cognitive and behavioral assessments to improve understanding of the phenotypical variation. Additionally, it would be interesting to explore the role of aberrant brain dystrophin isoforms expression on neurocognition and behavioral functioning in pediatric and adult BMD patients.
ACKNOWLEDGMENTS
The authors are members of the European Reference Network for Rare Neuromuscular Diseases [ERN EURO-NMD]. The authors would like to thank all study participants of the BMD natural history study of the Leiden University Medical Center (LUMC), Leiden the Netherlands. The authors would also like to thank the neuromuscular study coordinator M.J. van Heur-Neuman for her help with the planning of study participants.
AUTHOR CONTRIBUTIONS
The study was set-up by Z.K., D.M.J.H., J.J.G.M.V., E.H.N, and J.G.M.H. Neuropsychological testing was performed by Z.K. and D.M.J.H. Functional tests were performed by Z.K., I.A. and N.M.V. Data analysis was performed by Z.K. and D.M.J.H. Genetic data were reviewed and confirmed by HAvD and P.S. Data discussion, interpretation of results and writing of the manuscript was performed by Z.K., D.M.J.H., E.H.N and J.G.M.H. The manuscript was reviewed by all authors.
CONFLICT OF INTEREST
None of the authors has any conflict of interest to report. All authors declare that the research was conducted in the absence of any commercial or financial relationships that could be a potential conflict of interest.
FUNDING
This work was supported by the Spieren voor Spieren Foundation (SVS-15).
SUPPLEMENTARY MATERIAL
[1] The supplementary material is available in the electronic version of this article: https://dx.doi.org/10.3233/JND-210770.
REFERENCES
[1] | Hoffman EP , Brown Jr RH , Kunkel LM . Dystrophin: The protein product of the Duchenne muscular dystrophy locus.Cell. (1987) ;51: (6): 919–28. |
[2] | Emery AE . The muscular dystrophies. Lancet. (2002) ;359: (9307): 687–95. |
[3] | Bushby KM , Gardner-Medwin D . The clinical, genetic and dystrophin characteristics of Becker muscular dystrophy. I. Natural history. Journal of Neurology. (1993) ;240: (2): 98–104. |
[4] | Pane M , Lombardo ME , Alfieri P , D’Amico A , Bianco F , Vasco G , et al. Attention deficit hyperactivity disorder and cognitive function in Duchenne muscular dystrophy: Phenotype-genotype correlation. J Pediatr. (2012) ; 161: (4): 705–9.e1. |
[5] | Ricotti V , Mandy WP , Scoto M , Pane M , Deconinck N , Messina S , et al. Neurodevelopmental, emotional, and behavioural problems in Duchenne muscular dystrophy in relation to underlying dystrophin gene mutations. Dev Med Child Neurol. (2016) ; 58: (1): 77–84. |
[6] | Bardoni A , Felisari G , Sironi M , Comi G , Lai M , Robotti M , et al. Loss of Dp140 regulatory sequences is associated with cognitive impairment in dystrophinopathies. Neuromuscul Disord. (2000) ; 10: (3): 194–9. |
[7] | Doorenweerd N , Straathof CS , Dumas EM , Spitali P , Ginjaar IB , Wokke BH , et al. Reduced cerebral gray matter and altered white matter in boys with Duchenne muscular dystrophy. Ann Neurol. (2014) ; 76: (3): 403–11. |
[8] | Chamova T , Guergueltcheva V , Raycheva M , Todorov T , Genova J , Bichev S , et al. Association between loss of dp140 and cognitive impairment in duchenne and becker dystrophies. Balkan J Med Genet. (2013) ; 16: (1): 21–30. |
[9] | Cotton S , Voudouris NJ , Greenwood KM . Intelligence and Duchenne muscular dystrophy: Full-scale, verbal, and performance intelligence quotients. Dev Med Child Neurol. (2001) ; 43: (7): 497–501. |
[10] | Hendriksen JG , Vles JS Neuropsychiatric disorders in males with duchenne muscular dystrophy: Frequency rate of attention-deficit hyperactivity disorder (ADHD), autism spectrum disorder, and obsessive–compulsive disorder. J Child Neurol. (2008) ; 23: (5): 477–81. |
[11] | Banihani R , Smile S , Yoon G , Dupuis A , Mosleh M , Snider A , et al. Cognitive and neurobehavioral profile in boys with duchenne muscular dystrophy. J Child Neurol. (2015) ; 30: (11): 1472–82. |
[12] | Colombo P , Nobile M , Tesei A , Civati F , Gandossini S , Mani E , et al. Assessing mental health in boys with Duchenne muscular dystrophy: Emotional, behavioural and neurodevelopmental profile in an Italian clinical sample. Eur J Paediatr Neurol. (2017) ; 21: (4): 639–47. |
[13] | Lambert JT , Darmahkasih AJ , Horn PS , Rybalsky I , Shellenbarger KC , Tian C , et al. Neurodevelopmental, behavioral, and emotional symptoms in becker muscular dystrophy, Muscle & Nerve. 2019. |
[14] | Young HK , Barton BA , Waisbren S , Portales Dale L , Ryan MM , Webster RI , et al. Cognitive and psychological profile of males with Becker muscular dystrophy. Journal of Child Neurology. (2008) ; 23: (2): 155–62. |
[15] | Bardoni A , Felisari G , Sironi M , Comi G , Lai M , Robotti M , et al. Loss of Dp140 regulatory sequences is associated with cognitive impairment in dystrophinopathies. Neuromuscular Disorders. (2000) ;10: (3): 194–9. |
[16] | Mori-Yoshimura M , Mizuno Y , Yoshida S , Ishihara N , Minami N , Morimoto E , et al. Psychiatric and neurodevelopmental aspects of Becker muscular dystrophy. Neuromuscular Disorders. 2019. |
[17] | North K , Miller G , Iannaccone S , Clemens P , Chad D , Bella I , et al. Cognitive dysfunction as the major presenting feature of Becker’s muscular dystrophy. Neurology. (1996) ;46: (2): 461–4. |
[18] | Alessandro Assessing cognitive function in neuromuscular diseases. Journal of Clinical Medicine. 2021. |
[19] | van den Bergen JC , Ginjaar HB , van Essen AJ , Pangalila R , de Groot IJ , Wijkstra PJ , et al. Forty-five years of duchenne muscular dystrophy in The Netherlands. J Neuromuscul Dis. (2014) ;1: (1):99–109. |
[20] | Verhage F . Intelligence and age: Research among the Dutch between 12 and 77 years of age. Assen: Van Gorcum; 1964. |
[21] | Wechsler D WAIS-IV technical and interpretive manual: Pearson; 2008. |
[22] | DW WAIS-IV technical and interpretive manual: Pearson; 2008. |
[23] | Alpherts WA A.P. FePsy: The Iron Psyche, Manual. Heemstede: Instituut voor Epilepsiebestrijding1995. |
[24] | Wilson BE , Evans H , Alderman JJ , Burgess PW . Behavioural Assessment of the Dysexecutive Syndrome (BADS). St Edmunds, United Kingdom: Thames Valley Test Company; 1996. |
[25] | Luteijn FBD Groninger Intelligentie Test 2 (GIT-2): Manual. Amsterdam, The Netherlands: Harcourt Assessment BV; 2004. |
[26] | Vakil E , Blachstein H , Wertman-Elad R , Greenstein Y . Verbal learning and memory as measured by the Rey-Auditory Verbal Learning Test: ADHD with and without learning disabilities. Child Neuropsychol. (2012) ;18: (5):449–66. |
[27] | Huizinga MSD . BRIEF Executieve Functies Gedragsvragenlijst: Handleiding [Dutch Manual BRIEF Behavior Rating Inventory of Executive Function]. Amsterdam: Hogrefe Uitgevers; 2009. |
[28] | Muris P , Meesters C , van den Berg F . The Strengths and Difficulties Questionnaire (SDQ)–further evidence for its reliability and validity in a community sample of Dutch children and adolescents. Eur Child Adolesc Psychiatry. (2003) ;12: (1): 1–8. |
[29] | Hinz A , Brähler E . Normative values for the hospital anxiety and depression scale (HADS) in the general German population. J Psychosom Res. (2011) ;71: (2): 74–8. |
[30] | Ruis C , van den Berg E , van Stralen HE , Huenges Wajer IM , Biessels GJ , Kappelle LJ , et al. Symptom Checklist 90-Revised in neurological outpatients. J Clin Exp Neuropsychol. (2014) ;36: (2): 170–7. |
[31] | Mazzone E , Martinelli D , Berardinelli A , Messina S , D’Amico A , Vasco G , et al. North Star Ambulatory Assessment, 6-minute walk test and timed items in ambulant boys with Duchenne muscular dystrophy. Neuromuscul Disord. (2010) ;20: (11): 712–6. |
[32] | Gandolla M , Antonietti A , Longatelli V , Biffi E , Diella E , Delle Fave M , et al. Test-retest reliability of the Performance of Upper Limb (PUL) module for muscular dystrophy patients. PLoS One. (2020) ;15: (9): e0239064. |
[33] | Cotton SM , Voudouris NJ , Greenwood KM . Association between intellectual functioning and age in children and young adults with Duchenne muscular dystrophy: Further results from a meta-analysis. Dev Med Child Neurol. (2005) ;47: (4): 257–65. |
[34] | (OECD) OfEC-oaD PISA 2009 Results: What Makes a School Successful? Resources, Policies and Practices: OECD Publishing; 2010. |
[35] | Battini R , Chieffo D , Bulgheroni S , Piccini G , Pecini C , Lucibello S , et al. Cognitive profile in Duchenne muscular dystrophy boys without intellectual disability: The role of executive functions. Neuromuscular Disorders. (2018) ;28: (2):122–8. |
[36] | Wingeier K , Giger E , Strozzi S , Kreis R , Joncourt F , Conrad B , et al. Neuropsychological impairments and the impact of dystrophin mutations on general cognitive functioning of patients with Duchenne muscular dystrophy. Journal of clinical neuroscience. (2011) ;18: (1):90–5. |
[37] | Hinton V , Fee R , Goldstein E , De Vivo D . Verbal and memory skills in males with Duchenne muscular dystrophy. Developmental Medicine & Child Neurology. (2007) ;49: (2):123–8. |
[38] | Hinton VJ , De Vivo DC , Nereo NE , Goldstein E , Stern Y . Selective deficits in verbal working memory associated with a known genetic etiology: The neuropsychological profile of Duchenne muscular dystrophy. Journal of the International Neuropsychological Society: JINS. (2001) ;7: (1):45. |
[39] | Leaffer EB , Fee RJ , Hinton VJ . Digit span performance in children with dystrophinopathy: A verbal span or working memory contribution? Journal of the International Neuropsychological Society: JINS. (2016) ;22: (7):777. |
[40] | Mento G , Tarantino V , Bisiacchi PS . The neuropsychological profile of infantile Duchenne muscular dystrophy. The Clinical Neuropsychologist. (2011) ;25: (8):1359–77. |
[41] | Doorenweerd N , Mahfouz A , van Putten M , Kaliyaperumal R , PAC TH , Hendriksen JGM , et al. Timing and localization of human dystrophin isoform expression provide insights into the cognitive phenotype of Duchenne muscular dystrophy. Sci Rep. (2017) ;7: (1): 12575. |


