
Blood-derived biomarkers correlate with clinical progression in Duchenne muscular dystrophy
Abstract
Background:
Duchenne Muscular Dystrophy is a severe, incurable disorder caused by mutations in the dystrophin gene. The disease is characterized by decreased muscle function, impaired muscle regeneration and increased inflammation. In a clinical context, muscle deterioration, is evaluated using physical tests and analysis of muscle biopsies, which fail to accurately monitor the disease progression.
Objectives:
This study aims to confirm and asses the value of blood protein biomarkers as disease progression markers using one of the largest longitudinal collection of samples.
Methods:
A total of 560 samples, both serum and plasma, collected at three clinical sites are analyzed using a suspension bead array platform to assess 118 proteins targeted by 250 antibodies in microliter amount of samples.
Results:
Nine proteins are confirmed as disease progression biomarkers in both plasma and serum. Abundance of these biomarkers decreases as the disease progresses but follows different trajectories. While carbonic anhydrase 3, microtubule associated protein 4 and collagen type I alpha 1 chain decline rather constantly over time, myosin light chain 3, electron transfer flavoprotein A, troponin T, malate dehydrogenase 2, lactate dehydrogenase B and nestin plateaus in early teens. Electron transfer flavoprotein A, correlates with the outcome of 6-minutes-walking-test whereas malate dehydrogenase 2 together with myosin light chain 3, carbonic anhydrase 3 and nestin correlate with respiratory capacity.
Conclusions:
Nine biomarkers have been identified that correlate with disease milestones, functional tests and respiratory capacity. Together these biomarkers recapitulate different stages of the disorder that, if validated can improve disease progression monitoring.
INTRODUCTION
Protein profiling of blood derived samples is utilized to identify and define suitable diagnostic, prognostic, predictive, and/or pharmacodynamic biomarkers. Technological development of mass spectrometry (MS) and affinity-based platforms enables high-throughput analysis of proteins in complex biological samples such as blood, resulting in an accelerated biomarker discovery rate [1]. However, only few protein biomarkers are approved by the Food and Drug Administration (FDA) and the European Medicine Agency (EMA) each year, predominantly for cancer and viral monitoring indications [2–4]. Protein biomarker verification and validation remains essential for development of tests that can aid clinical management of the disease [5, 6]. Validation of biomarkers for clinical use requires confirmation of clinical benefit as well as development of well-designed assays with high sensitivity, selectivity and reproducibility including multicenter testing. Validated biomarkers are required not only for diagnostic purposes but also for monitoring disease progression and treatment outcome. In particular, biomarkers that monitor effect of treatment can facilitate approval of novel therapies for fatal disorders currently lacking effective drugs [7].
Duchenne muscular dystrophy (DMD) is one of the many rare disorders with fatal outcome that lacks sensitive and accurate clinical tests to monitor disease progression and treatment efficacy. DMD is an X-linked recessively inherited disease, caused by mutations in the DMD gene [8]. The disease has an early childhood onset with well-defined symptoms such as difficulties with climbing stairs, raising up from floor and frequent falls caused by overall skeletal muscle weakness. Disease progression is rapid, with loss of ambulation (LoA) in early teens followed by respiratory and cardiac dysfunction, which escalates with development of cardiac or respiratory failure in the early twenties, resulting in premature death [9–11]. Currently there is no cure for DMD and treatment is symptomatic for most patients. Mutation specific treatments have been approved by the EMA (e.g. ataluren for nonsense mutations) and the FDA (eteplirsen and golodirsen for patients with specific deletion mutations) mainly to slow down the disease progression [12]. Regulatory agencies have requested additional functional studies for these drugs to confirm clinical benefit in patients. Development and approval of novel treatments is currently costly and mostly dependent on clinical functional tests [12]. Muscle function tests used to assess disease progression in natural history studies and clinical trials, such as the 6-minute walk test (6MWT) and North-Star ambulatory assessment (NSAA), have limited selectivity and sensitivity and rely on patients’ motivation and capability to collaborate with clinicians. The tests require qualified personnel for patient instruction, evaluation of patient performance and interpretation of the results. Quantification of the physical strain is also often inconclusive [13–17], in particular with respect to non-ambulant patients. Functional tests are also challenging, especially for young patients with associated intellectual disability or neurobehavioral comorbidities, which represent between 30% and 50% of the patient population [18]. Recent advances show that the measurement of fat infiltration in muscles using Magnetic Resonance Spectroscopy (MRS) and Magnetic Resonance Imaging (MRI) offers an alternative approach to monitor disease progression, in particular in non-ambulant patients, and to monitor effect of treatment [19–21]. These quantitative imaging techniques developed are able to monitor effect of treatment and consequently qualifies muscle-fat as a potential surrogate endpoint in clinical trials. Numerous imaging methods have been developed but there are no standardized procedures developed so far. Furthermore, imaging is costly and requires immobilization of the patients which limits routine usage of such methods.
Creatine kinase (CK) is a diagnostic protein biomarker for DMD, since elevated blood levels indicate muscle damage, which occurs, among other conditions, in muscular dystrophies. Once elevated CK levels are found in plasma, genetic testing needs to be done to confirm or exclude DMD. CK is rather unspecific since plasma levels are also elevated in other forms of muscular dystrophy [22, 23] and levels are influenced also by other factors such as muscle mass and muscle activity. In recent years, several promising blood-derived biomarker candidates related to muscular dystrophy pathology, were identified and revealed to correlate with DMD, as well as disease severity and disease progression. These proteins can be divided into three groups: a) muscle function proteins: such as carbonic anhydrase 3 (CA3) [24–27], malate dehydrogenase 2 (MDH2) [24], myosin light chain 3 (MYL3) [24, 28], troponin T type 3 (TNNT3) [24], microtubule-associated protein 4 (MAP4) [24] and collagen alpha-1(I) chain (COL1A1) [29, 30], b) metabolic function proteins: such as lactate dehydrogenase B (LDHB) [31, 32] and electron transfer flavoprotein A (ETFA) [24], and c) neuron function proteins: such as nestin (NES) [33]. If validated, these easily accessible blood biomarkers could be used for monitoring of disease progression, regardless of age and extraneous health status of patients. The availability of specific and sensitive biomarkers, easily accessible and measurable in body fluids, would facilitate design of clinical trials, as well as empower evaluation and approval of novel treatments through early detection of response to treatment and clinical benefit regardless the patient’s age and ambulation status or other individual characteristics related to the phenotype.
The aim of this study is to explore biomarker abundance variation over time and confirm association with functional tests in large, longitudinal and multicenter patient cohorts. In total, five sample collections, comprising between 1–5 plasma and/or serum samples per patient, collected approximately once per year are used in the analysis. Altogether, 118 proteins, targeted by 250 antibodies, are addressed by using a suspension bead array (SBA) platform. The ambulation status is used as a disease progression milestone to explore abundance variation of the biomarkers before and after LoA. Result of physical tests such as North Star Ambulatory Assessment (NSAA), 10 Meter Walking Test (10MWT) and 6 Minute Walk Distance (6MWD) are also used to analyze correlation of biomarkers with muscle function.
METHODS
Study and experimental design
A longitudinal sample collection was created as a follow up study by retrieval of samples from patients at three different locations, Leiden University Medical Center (LUMC), University College London (UCL) and University of Newcastle (UNEW). Both serum and plasma were collected from UCL and UNEW from each patient while serum alone was collected from LUMC (Table 1) using standardized sample collection and handling protocols. After consent from recruited individuals, 496 samples from 285 patients, 37 from healthy individuals and 30 from asymptomatic female carriers were collected together with information about diagnosis, ambulation state (Supplementary Table 1) and age at the time of samples retrieval. Collection of samples from patients for research has been ethically approved by Hammersmith Research Ethics committee, NRES Committee North East—Newcastle & North Tyneside 1 and LUMC Commissie Medische Ethiek and was performed according to the principles set out in the WMA Declaration of Helsinki. Prior to the analysis information about the patients and the samples was anonymized. Samples from healthy controls were collected at LUMC (age range 6,4 to 11) and UCL (age range 19–48), while the samples from UNEW included asymptomatic female carriers of dystrophin mutation (age range 12 to 76). All samples were transferred to KTH, The Royal Institute of Technology for proteomics analysis. The target selection was made based on previously analyzed targets, literature research and availability of validated antibodies. See Supplementary Table 2 for full lists of targets and antibodies.
Table 1
Patients and samples included in the analysis of the five longitudinal cohorts
| Sample origin | Sample type | Number of individuals | Number of samples per patient | Number of samples | ||||||
| Patients | Controls | 1 | 2 | 3 | 4 | 5 | Patients | Controls | ||
| UNEW | Serum | 41 | 15 | 6 | 20 | 8 | 6 | 1 | 93 | 15 |
| Plasma | 41 | 15 | 4 | 34 | 3 | 0 | 0 | 90 | 15 | |
| UCL | Serum | 71 | 9 | 66 | 4 | 1 | 0 | 0 | 77 | 9 |
| Plasma | 87 | 9 | 71 | 11 | 4 | 1 | 0 | 109 | 9 | |
| LUMC | Serum | 45 | 19 | 7 | 13 | 12 | 7 | 6 | 127 | 19 |
| Total | 285 | 67 | 154 | 82 | 28 | 14 | 7 | 496 | 67 | |
The table summarizes the sample type and clinical site where the samples were collected, the number of patients with samples collected at 1. 2. 3. 4 or 5 different time points and the total number of samples.
Antibody suspension bead array analysis
Generation of the SBA was performed according to the method described in [34]. Only antibodies validated by protein arrays and Western Blot were used for the immunoassays. The antibodies were coupled to individual carboxylated color-coded magnetic beads (Luminex corp.), listed in Supplementary Table 2. Samples were labeled with biotin, diluted 1:50, heat-treated (56°C for 30 min, R-T for 10 min) and incubated with the SBA over-night at RT. Before analysis on the FlexMap platform (Luminex Corp.) unbound proteins were removed and fluorophore (R-phycoerythrin conjugated streptavidin, Invitrogen) was added for assay read-out. The median florescence intensity (MFI) per individual bead ID was reported as assay read-out.
Data analysis
The raw MFI values obtained from the analysis of the samples were processed and analyzed in R [35]. Before analysis of the data, MFI values were normalized according to probabilistic quotient normalization (PQN) method [36, 37], separately for plasma and serum samples. Principal component analysis (PCA) was performed to confirm that there was no systematic variation in the dataset driven by sample origin or assay plate and that there were no outlier samples. Data obtained from all 560 samples was used to confirm biomarkers associated with DMD. The statistical significance between stratified groups was reported by p-values, calculated by non-parametric Wilcoxon-test or Kruskal-Wallis-test applied to PQN-normalized and log2-transformed data. Differences in protein profiles between compared groups were denoted statistically significant if they concordantly revealed P-values < 0.05 in different cohorts and blood preparation types, without multiple testing correction. To compare biomarker panels, generalized estimating equation (GEE) was used [38]. A multivariate binary logistic regression was applied using the R-package ‘geepack’ version 1.2-0 [39]. The package ‘epicalc’ version 2.14.1.6 was used to create the ROC-curves [40]. Biomarker abundance correlation with functional tests was performed using Spearman correlation whereas correlation of protein abundance with respiratory capacity was performed using Pearson correlation coefficients. The significance was estimated as P–value using Kruskal-Wallis test.
RNA-seq analysis
Raw data from RNA-sequencing analysis of muscle biopsies, quadriceps and tibialis, were downloaded from the Gene Expression Omnibus accession GSE86356, GSE70389, and aligned to the human_g1k_v37 reference genome using the 2-pass method of the STAR (v2.5.1b) aligner [41]. Gene expression measured in fragments per kilobase of exon model per million reads mapped (FPKM) was calculated using Cufflinks (v2.2.1) [42].
RESULTS
Study design
Selection of appropriate research strategies and methodology has to be carefully considered, when analyzing biological samples that are limited not only with respect to the number of cases, but also in regards of sample volume since affected individuals are often children or young adults. To confirm association of previously identified blood biomarkers with DMD and their correlation with disease progression, we choose a multi-cohort strategy and analyzed samples from three different collection sites (LUMC, UNEW and UCL) using only microliter amounts of sample. Both plasma and serum blood preparations were used to ensure confirmation of the results and robustness of the findings, since sample preparation and handling affect protein levels in samples [6, 43]. The sample collection comprised 346 serum and 214 plasma samples, collected from enrolled patients at 1–5 different time points, (as summarized in Table 1), age and mobility (Supplementary Table 1). The controls from LUMC included older individuals, with ages between 19–48 years, compared to the patients.
For the analysis, only well-characterized and validated antibodies, by protein arrays, Western Blot and Immunohistochemistry [44], from the Human Protein Atlas (HPA) repository [45, 46] and commercial vendors were used. The antibodies were used in combination with the SBA platform which allows high-throughput, multi-analyte immunoassays to be performed using minimal amount of sample, thus providing an efficient usage of rare biological samples. In total, 250 antibodies targeting 118 protein-biomarker candidates were used in the analysis (Supplementary Table 2). In addition, 15 antibodies targeting established and abundant proteins in serum and plasma were included in the array design.
Biomarker verification
In this analysis five proteins revealed significantly concordant profiles in all five sample collections, both serum and plasma: CA3, MYL3, ETFA, MDH2, NES (Supplementary Figure 1) with P-values < 0.001 compared to our previous report [24]. In addition, four biomarker candidates were validated with the same significance in four out of five sample collections, TNNT3, LDHB, COL1A1 and MAP4. As expected, the levels of these proteins were elevated in DMD patients compared to controls in both plasma and serum, as illustrated in boxplots in Supplementary Figure 1.
We used several antibodies against each target to confirm the results according to the International Working Group for Antibody Validation (IWGAV) guidelines [44, 47]. Independent antibodies recognizing different epitopes on the same target, so called sibling-antibodies, were used in the analysis if available (the plots for the sibling antibodies are shown in Supplementary Figure 2 and the significance of their association with the disease in Supplementary Table 3). CA3 was detected by four antibodies. Three of them (CA3, CA3_Ab2 and CA3_Ab.3) followed the same trend in all five cohorts and had a P-value < 0.01 in three of the samples collections (both serum and plasma). Detection of CA3 with the fourth antibody (CA3_Ab.4) was inconclusive, since it did not separate the patients and controls, and the overall MFI read-out was lower indicating a lower sensitivity. MDH2 was detected with four antibodies, of which one was significantly associated with DMD, whereas three (MDH2_Ab.2, MDH2_Ab.3 and MDH2_Ab.4) demonstrated low sensitivity and detection capacity. One antibody against ETFA showed significant discrimination power between patients and controls P-value < 0.001 whereas ETFA_Ab4 showed P-value < 0.001 in serum samples from LUMC and P-value < 0.05 in serum and plasma samples from UCL. NES abundance pattern was assessed by three antibodies (NES, NES_Ab.2 and NES_Ab.3). NES and NES_Ab.2 showed similar protein profiles in all cohorts, with a P-value < 0.001 in four cohorts whereas NES_Ab.3 followed the protein trend in only two cohorts. TNNT3, COL1A1 and MAP4 were analyzed with two antibodies each. TNNT3_Ab.2 in comparison to the TNNT3 antibody showed higher level of detection and MFI but no significant separation between patients and controls. COL1A1_Ab2 showed low MFI and sensitivity in comparison to COL1A1. The antibodies against MAP4 showed similar protein profiles in four out of five cohorts, although with different significance. MAP4 had lower significance than MAP_Ab.2. However, MAP_Ab.2 abundance measurements in both serum and plasma from UCL and UNEW showed distinct discrimination between patients and controls with P-value < 0.01. In summary, CA3, MDH2, NES and MAP4 had sibling antibodies verifying the detected protein profiles with P-values < 0.001.
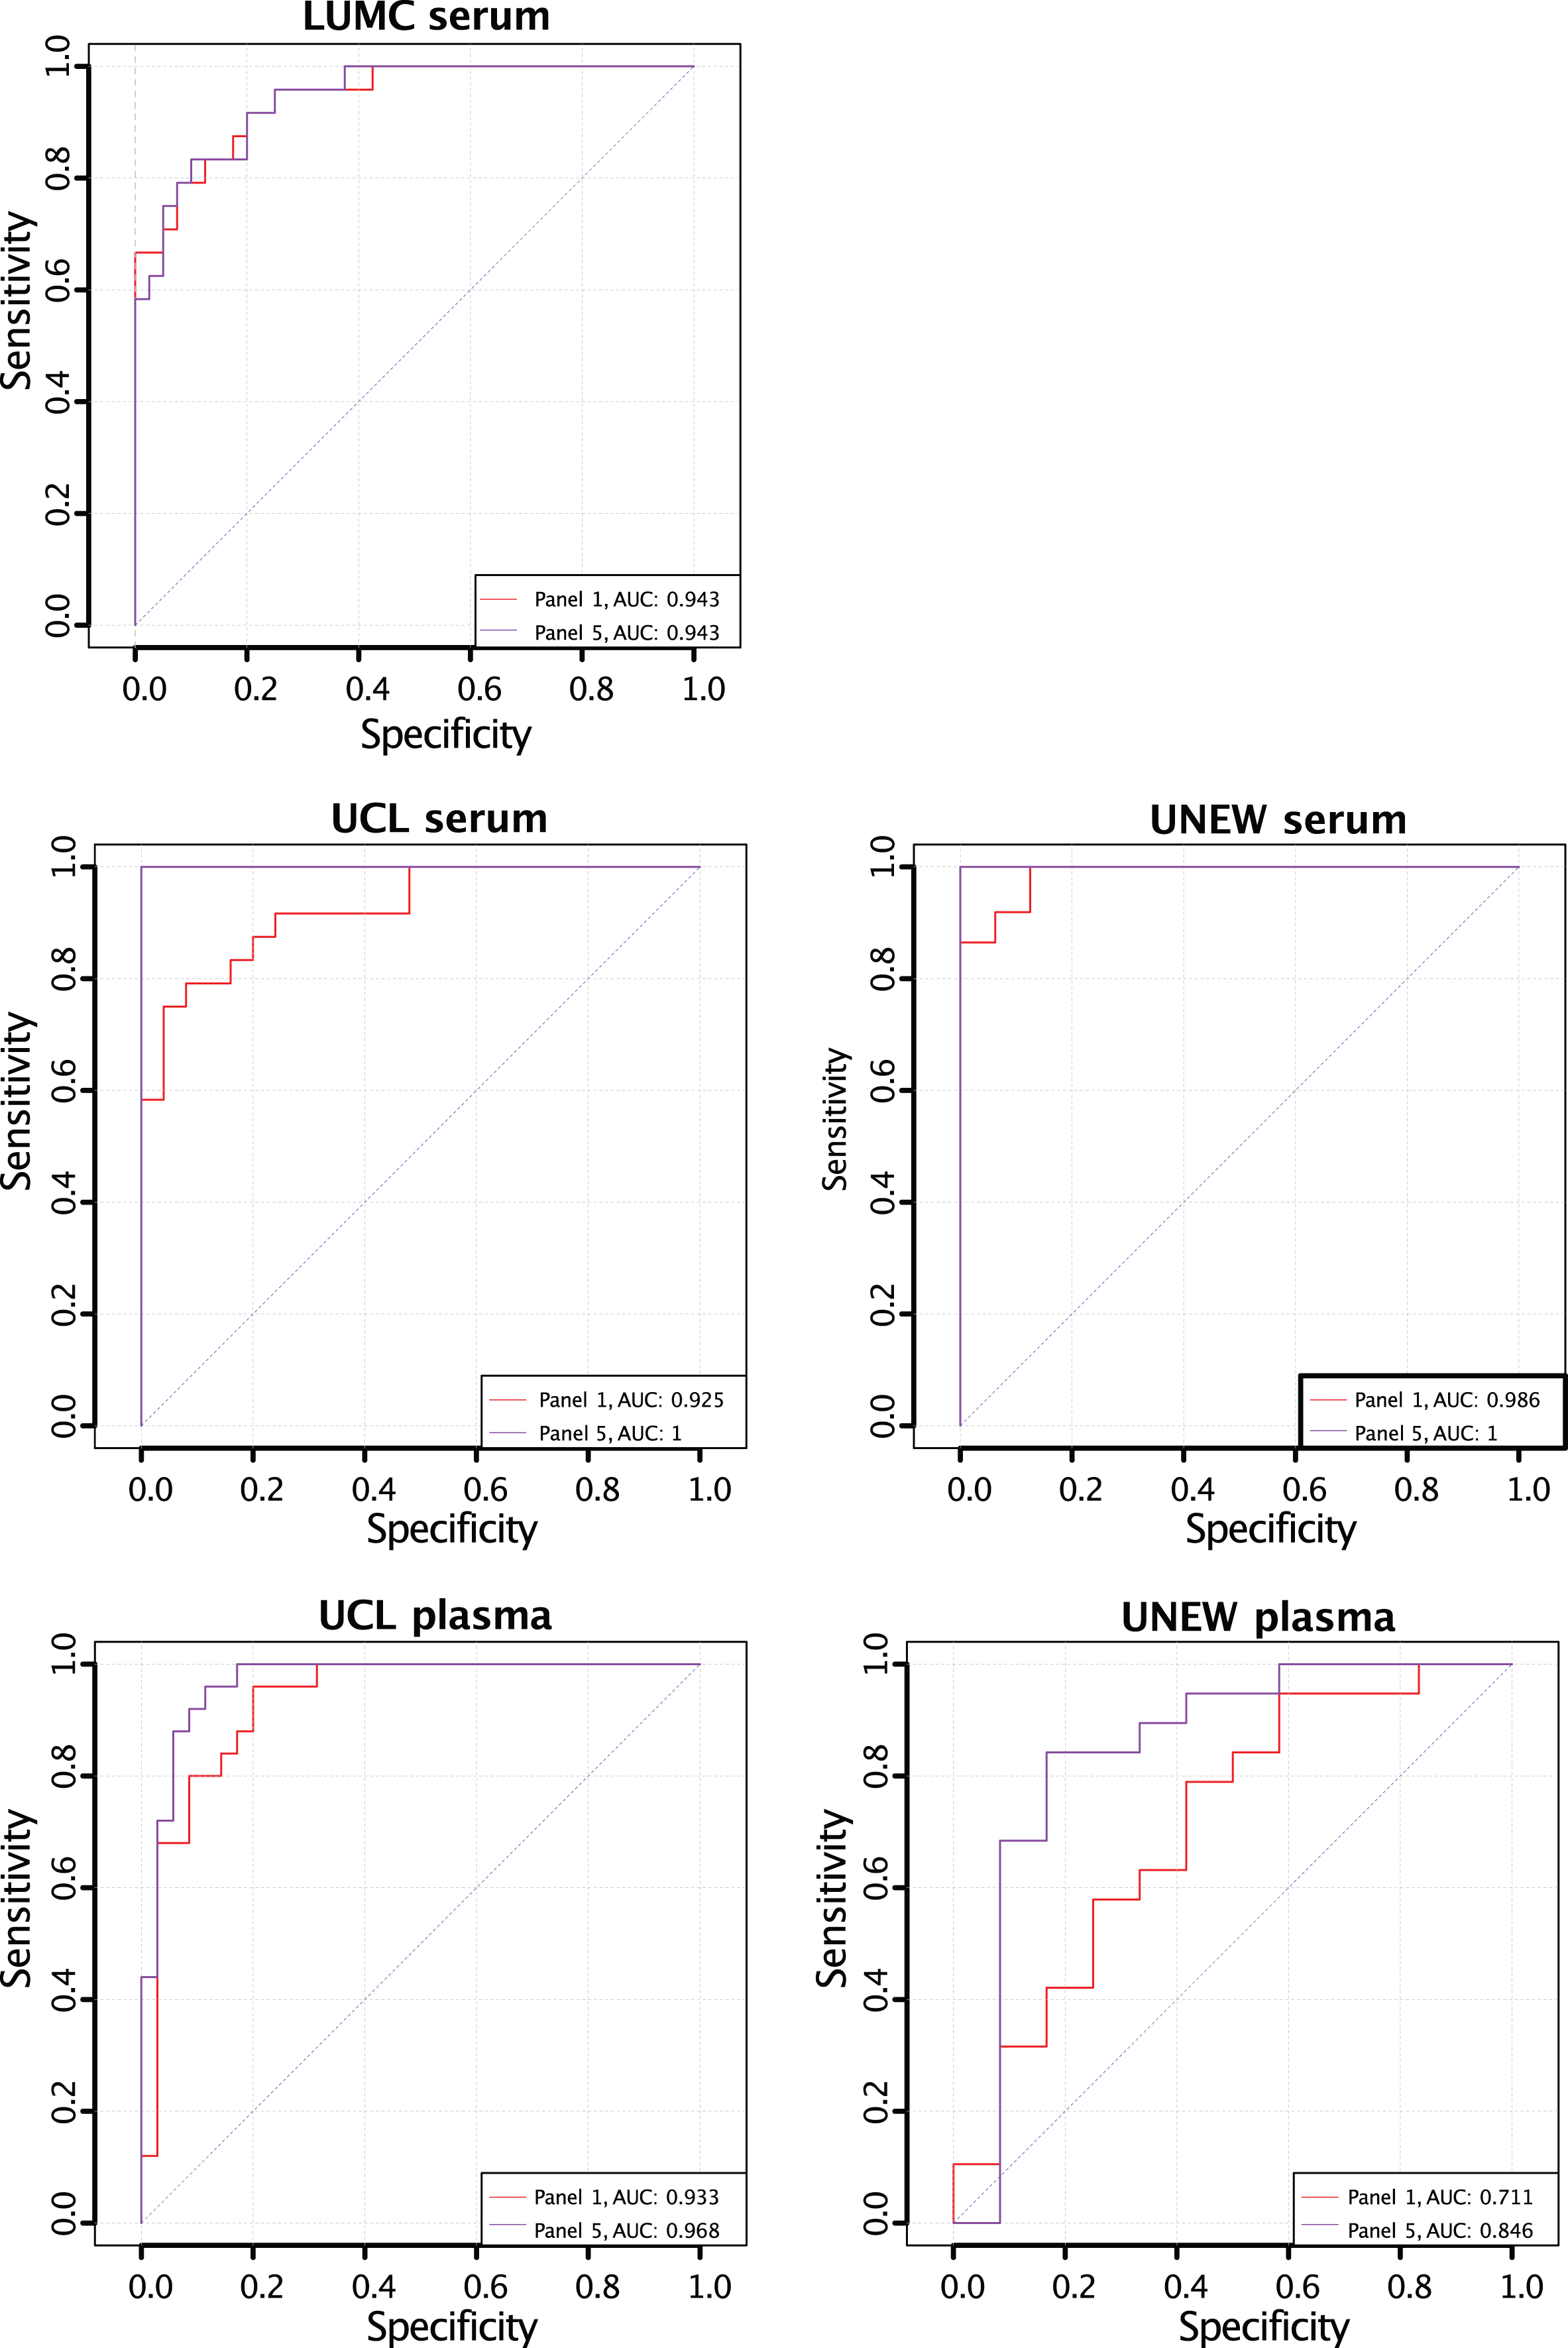
Previously, a biomarker panel comprising CA3, MDH2, MYL3, TNNT3, and ETFA (Panel 1) was suggested to discriminate between severe and mild forms of DMD [24]. To evaluate if NES, LDHB, MAP4 or COL1A1 can improve the power of discrimination of Panel 1, different panels were created consisting of targets in Panel 1 and different variations of the additional four protein biomarkers. A multivariate binary regression was applied and visualized in receiver operator characteristic curves (ROC curves). AUC for Panel 5 (Supplementary Figure 3) was higher than the AUC for Panel 1 (Supplementary Figure 3) in all five cohorts. Panel 5 consists of Panel 1 and all four additional proteins. CK has been used in clinical trials as an exploratory biomarkers to test efficacy of treatment [48]. We analyzed the contribution of CK measurements to both panel 1 and 5 Fig. 1. The AUC increased in serum samples from LUMC and UCL (from 0,904 to 0,943 and 0,977 to 1 respectively) whereas decreased in plasma collected at UCL (from 0,968 to 0,953). Although the improvement is not observed in all cohorts analysed the panel comprising CK, CA3, MDH2, MYL3, TNNT3, ETFA, NES, LDHB, MAP4 and COL1A1 is superior to other panels.
Fig. 1
Receiver Operating Characteristic curves for the classification power of biomarker panels including CK for classification of age-matched ambulant and non-ambulant patients. The AUC for Panel 5 (CA3, MDH2, MYL3, TNNT3, ETFA, NES, LDHB, COL1A1, MAP4) (purple) and Panel 1 (CA3, MDH2, MYL3, TNNT3 and ETFA) (red) in all five cohorts.
The improved panel most likely comprises protein biomarkers involved in different biological processes and originating from different tissues. We hypothesize that these biomarkers do not originate from the same tissue. To investigate the possible origin of these biomarkers we re-analyzed public RNA-seq data, downloaded from the Gene Expression Omnibus (GEO), accession GSE86356 [49] and GSE70389 [50], comprising (1) analysis of unique muscle samples, biceps, quadriceps and tibialis and (2) human myoblasts and myotubes originated from a DMD patient with a remarkable BMD-like phenotype. Analysis of gene expression shows muscle specific variation not only between DMD patients and healthy individuals but also between muscles groups. CA3, MYL3, NES, TNNT3 and MAP4 (in accordance with CK) were most abundant in tibialis, whereas MDH2, ETFA, LDHB and COL1A1 had higher expression in biceps (Table 2). MYL3 is extremely low expressed in biceps and quadriceps but highly expressed in the tibialis muscle of the DMD patient (Table 2). The RNA-seq data also shows that the analyzed targets have different expression patterns in primary muscle myoblasts and differentiated muscle myoblasts. All analysed proteins are expressed in myoblasts and differentiated myoblast except for CA3 and MYL3 which are close to zero.
Table 2
Expression of the protein biomarkers and their corresponding transcripts
| Gene | Biceps Duchenne | Quadriceps Duchenne | Quadriceps control | Tibialis Duchenne | Tibialis control | Primary myoblasts | Differentiated myoblasts |
| CK | 39,9 | 35,4 | 4298,4 | 616,2 | 3679,5 | 15,8 | 53,3 |
| CA3 | 43,2 | 33,8 | 1078,9 | 1091,9 | 854,3 | 0,4 | 43,2 |
| MYL3 | 1,7 | 0,8 | 431,6 | 114,9 | 629,0 | 0,4 | 0,2 |
| MDH2 | 21,6 | 12,1 | 62,9 | 18,7 | 44,8 | 13,8 | 16,4 |
| ETFA | 85,1 | 53,0 | 55,8 | 38,0 | 42,4 | 21,3 | 35,2 |
| NES | 10,4 | 14,4 | 4,3 | 28,7 | 7,1 | 43,5 | 113,9 |
| TNNT3 | 94,2 | 91,7 | 1032,3 | 396,5 | 573,6 | 31,5 | 111,3 |
| LDHB | 168,9 | 59,1 | 39,7 | 61,9 | 46,1 | 225 | 191,4 |
| COL1A1 | 145,7 | 72,1 | 12,5 | 92,8 | 6,0 | 325,6 | 116,4 |
| MAP4 | 106,7 | 70,9 | 158,3 | 143,2 | 142,3 | 30,9 | 35,1 |
Tissue transcript expression levels estimated as FPKM (fragments per kilobase of exon model per million reads mapped) of the studied proteins in Biceps, Quadriceps and Tibialis anterior from a DMD patient (GSE86356) [49] and primary muscle myoblast and differentiated muscle myoblast for a DMD patient with a mild disease form (GSE70389) [50].
Biomarker abundance variation over time
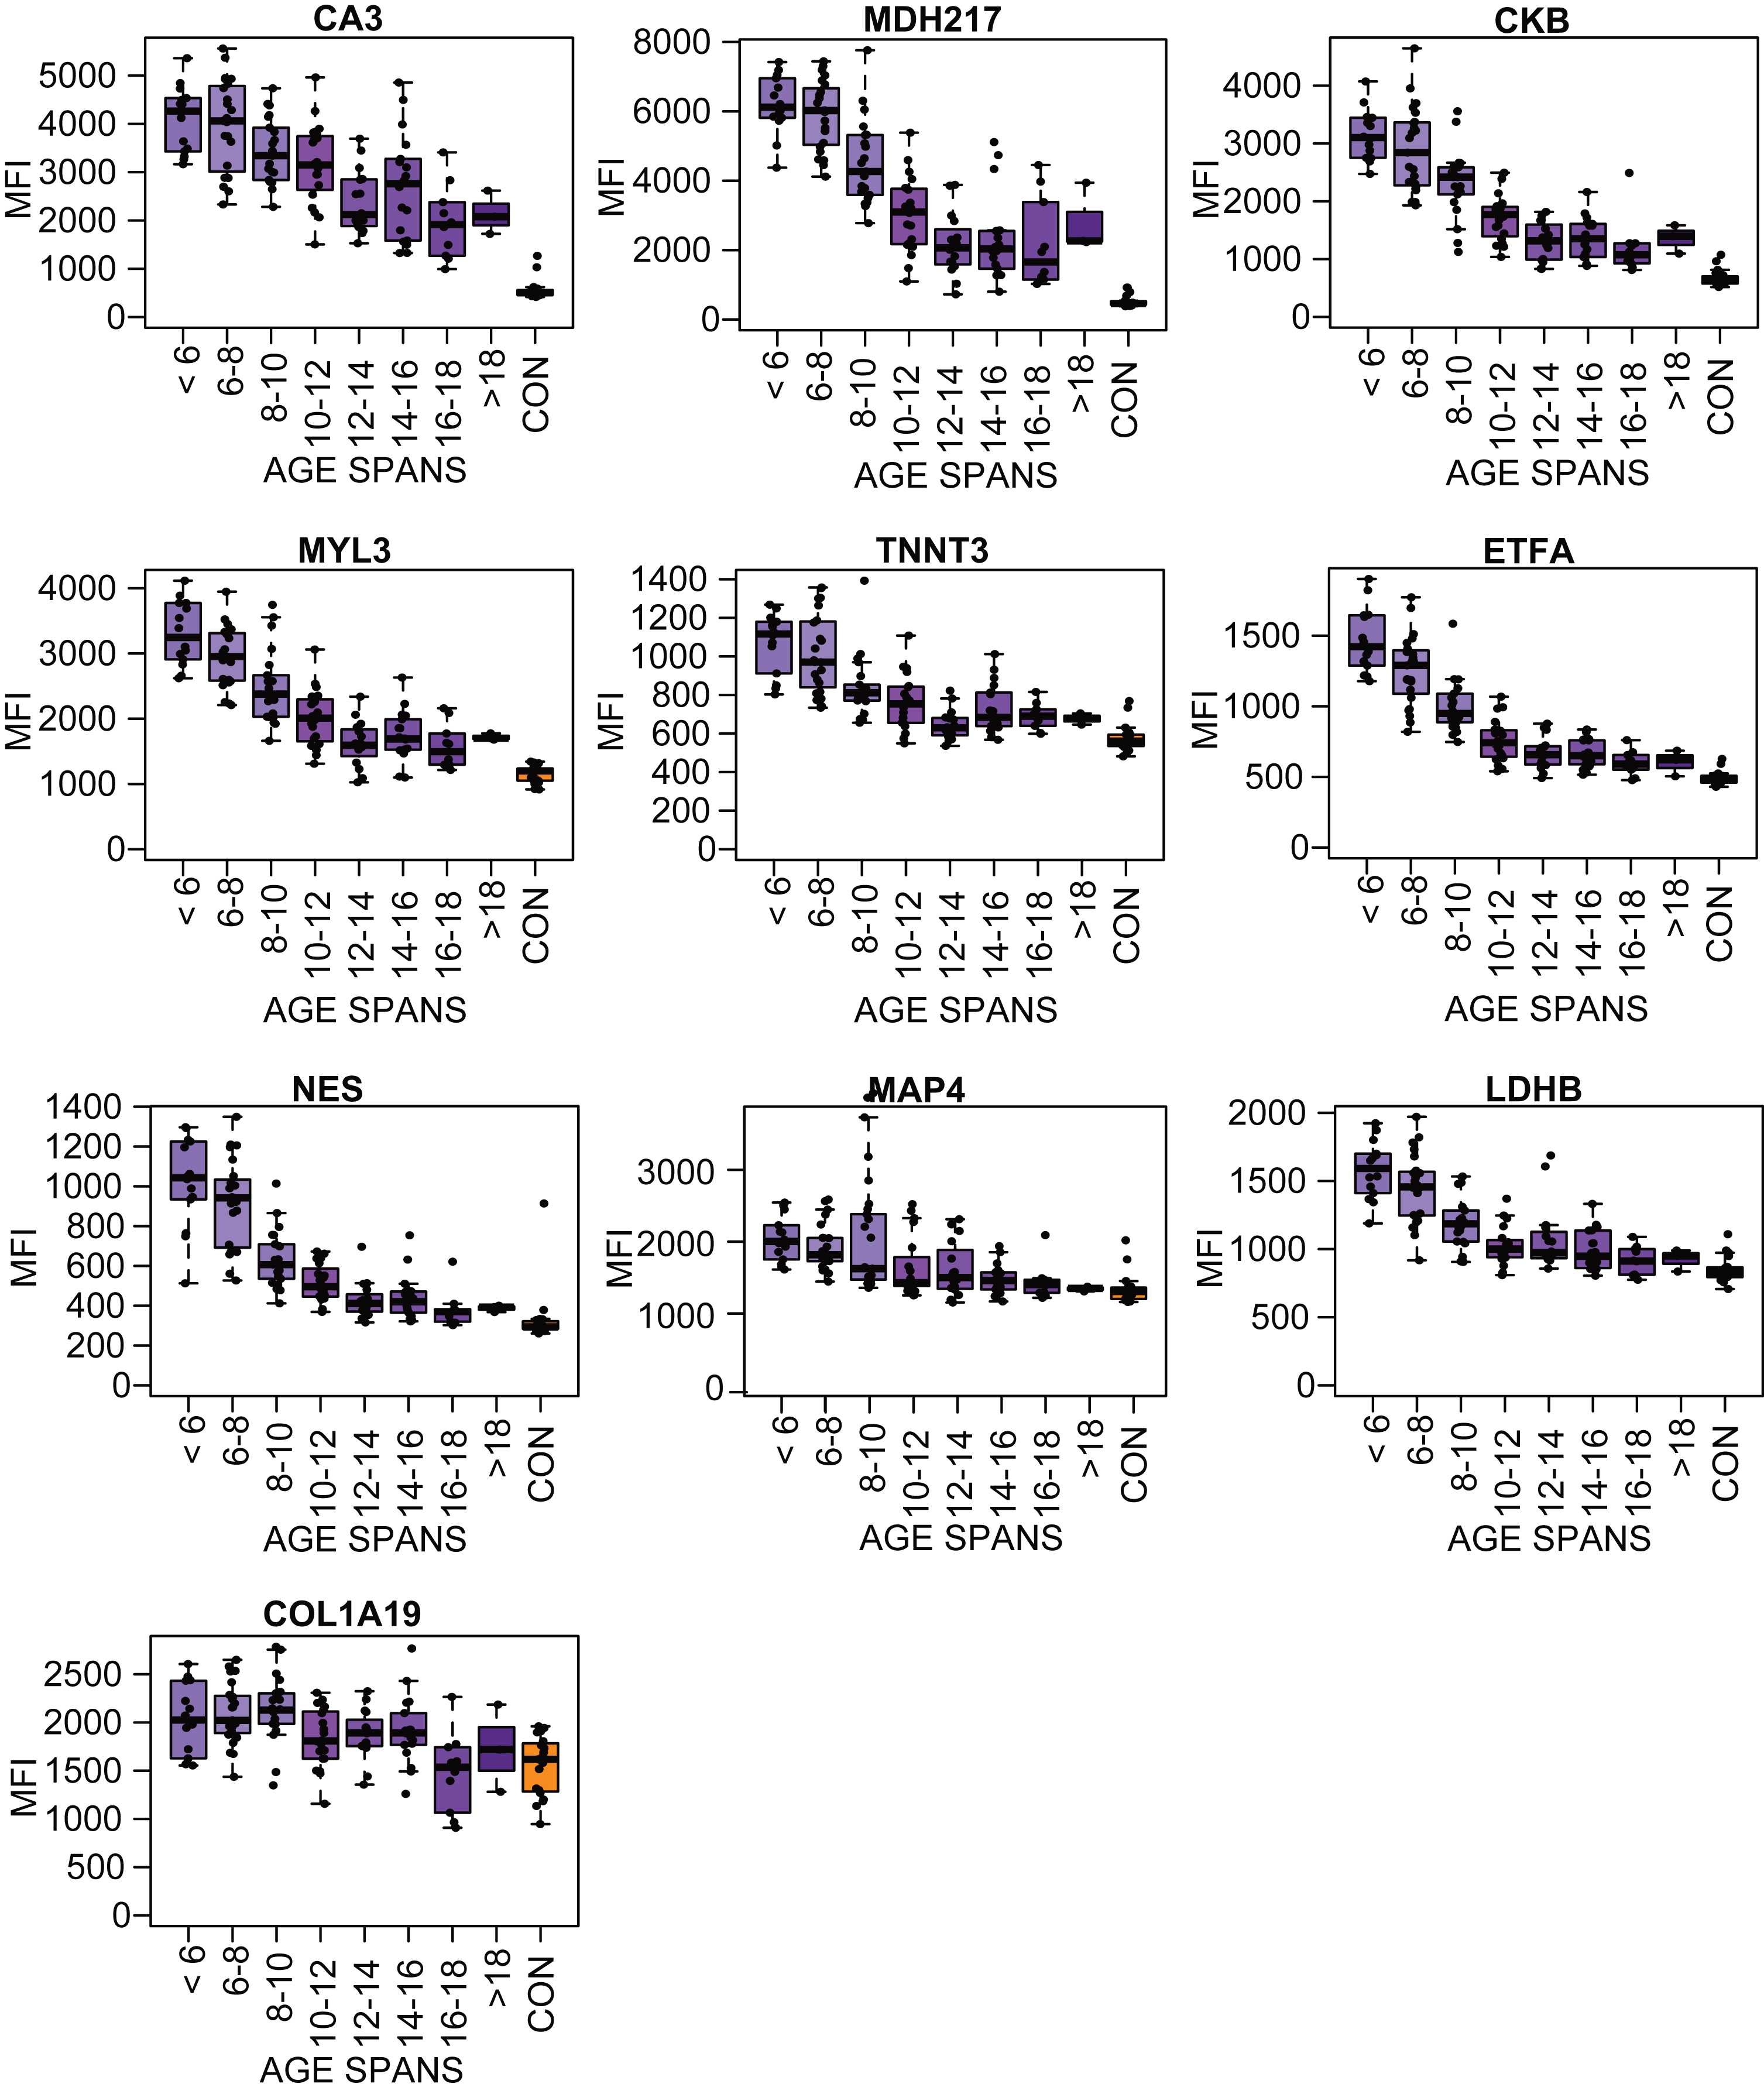
To investigate variation of the measured protein abundance, longitudinal follow up plots for each biomarker candidate were separately generated (Supplementary Figure 4). The variation of the biomarker was highest at young age and varied less at older age. To further explore this variation the cohorts were divided into seven age categories: <6 years, 6–8 years, 8–10 years, 10–12 year, 12–14 years, 14–16 years and >16 years. The number of samples within each age category varied between 13–23. Protein levels for the age categories and the controls were visualized in boxplots Fig.2.2 (LUMC serum cohort) and Supplementary Figure 5 (UCL and UNEW serum and plasma cohorts). The profiles for MYL3, MDH2, ETFA, NES, TNNT3 and MAP4 confirmed the overall trend of a fast decrease of protein abundance in early childhood until approximately 12 years. From 12 years on the decrease stagnated partially. The protein profiles for CA3, MDH2 and COL1A1 were decreasing more constant with increasing age (Fig. 2). Majority of the targets analyzed CK, MYL3, ETFA, NES, TNNT3 and MAP4 had a higher protein abundance variation within the patient groups at young age 6–10 than at 14 and above. The patient groups 6–10 years included patients with very different degree of muscle function loss whereas patient groups at age of 14 and above include mostly non-ambulant individuals. Majority of the biomarkers reached abundance levels that plateau after the age of 14.
Fig. 2
Boxplots of the protein profile for eight different age subgroups (purple boxes, N: 13–23) and the control samples (orange boxes) in the LUMC serum cohort.
Protein abundance association with ambulation status
One of the main clinical milestones related to disease progression is the change in mobility from ambulant to non-ambulant as well as the decreased ability to perform any physical activity. Patients between the age of 8 and 12 constitute a heterogeneous population with varying degree of mobility due to disease phenotype. To evaluate protein abundance variation in patients with different mobility, age-equivalent patient cohorts were divided into ambulant and non-ambulant subsets, comprising 458 patient samples. The subsets were age-balanced by including the samples with the age at sample collection higher than the age of the youngest non-ambulant patient and below the age of the oldest ambulant patient of the cohort (Supplementary Table 1). Samples without information regarding age at sample collection were excluded. The association of the protein abundance with ambulation state is illustrated in Table 3. The reliability of MYL3, ETFA, MDH2 and TNNT3 to differentiate ambulant and non-ambulant patients was high, with a P-value < 0.001 in all serum cohorts and the UCL plasma cohort. CA3, NES, LDHB and MAP4 revealed statistically less significant differences and larger variation across cohorts. COL1A1 did not reveal statistically significant difference between the ambulant and non-ambulant patient subsets.
Table 3
Protein abundance difference in ambulant vs. non-ambulant DMD patients
| Protein | LUMC serum | UCL serum | UNEW serum | UCL serum | UNEW serum |
| MYL3 | 5.0e-6 | 5.9e-7 | 3.5e-6 | 6.4e-8 | 6.8e-1 |
| ETFA | 2.6e-7 | 4.6e-6 | 6.7e-8 | 9.4e-6 | 9.5e-1 |
| MDH2 | 8.6e-8 | 2.5e-7 | 3.5e-7 | 2.6e-7 | 8.9e-1 |
| TNNT3 | 5.2e-4 | 3.1e-5 | 2.4e-4 | 5.6e-5 | 8.6e-1 |
| CA3 | 9.8e-3 | 7.7e-3 | 9.9e-5 | 3.1e-3 | 7.3e-1 |
| NES | 5.1e-5 | 3.8e-2 | 1.3e-8 | 1.1e-3 | 1.0e+0 |
| LDHB | 3.8e-5 | 2.8e-1 | 7.6e-3 | 1.5e-1 | 5.1e-1 |
| MAP4 | 8.7e-3 | 2.4e-2 | 1.8e-3 | 6.1e-1 | 6.8e-1 |
| COL1A1 | 1.1e-1 | 7.9e-1 | 4.8e-1 | 9.1e-1 | 3.3e-1 |
Statistical significance of p-value < 0.001 is indicated in white boxes. <0.01 is highlighted in light grey boxes and p-value > 0.01 is highlighted in dark grey boxes.
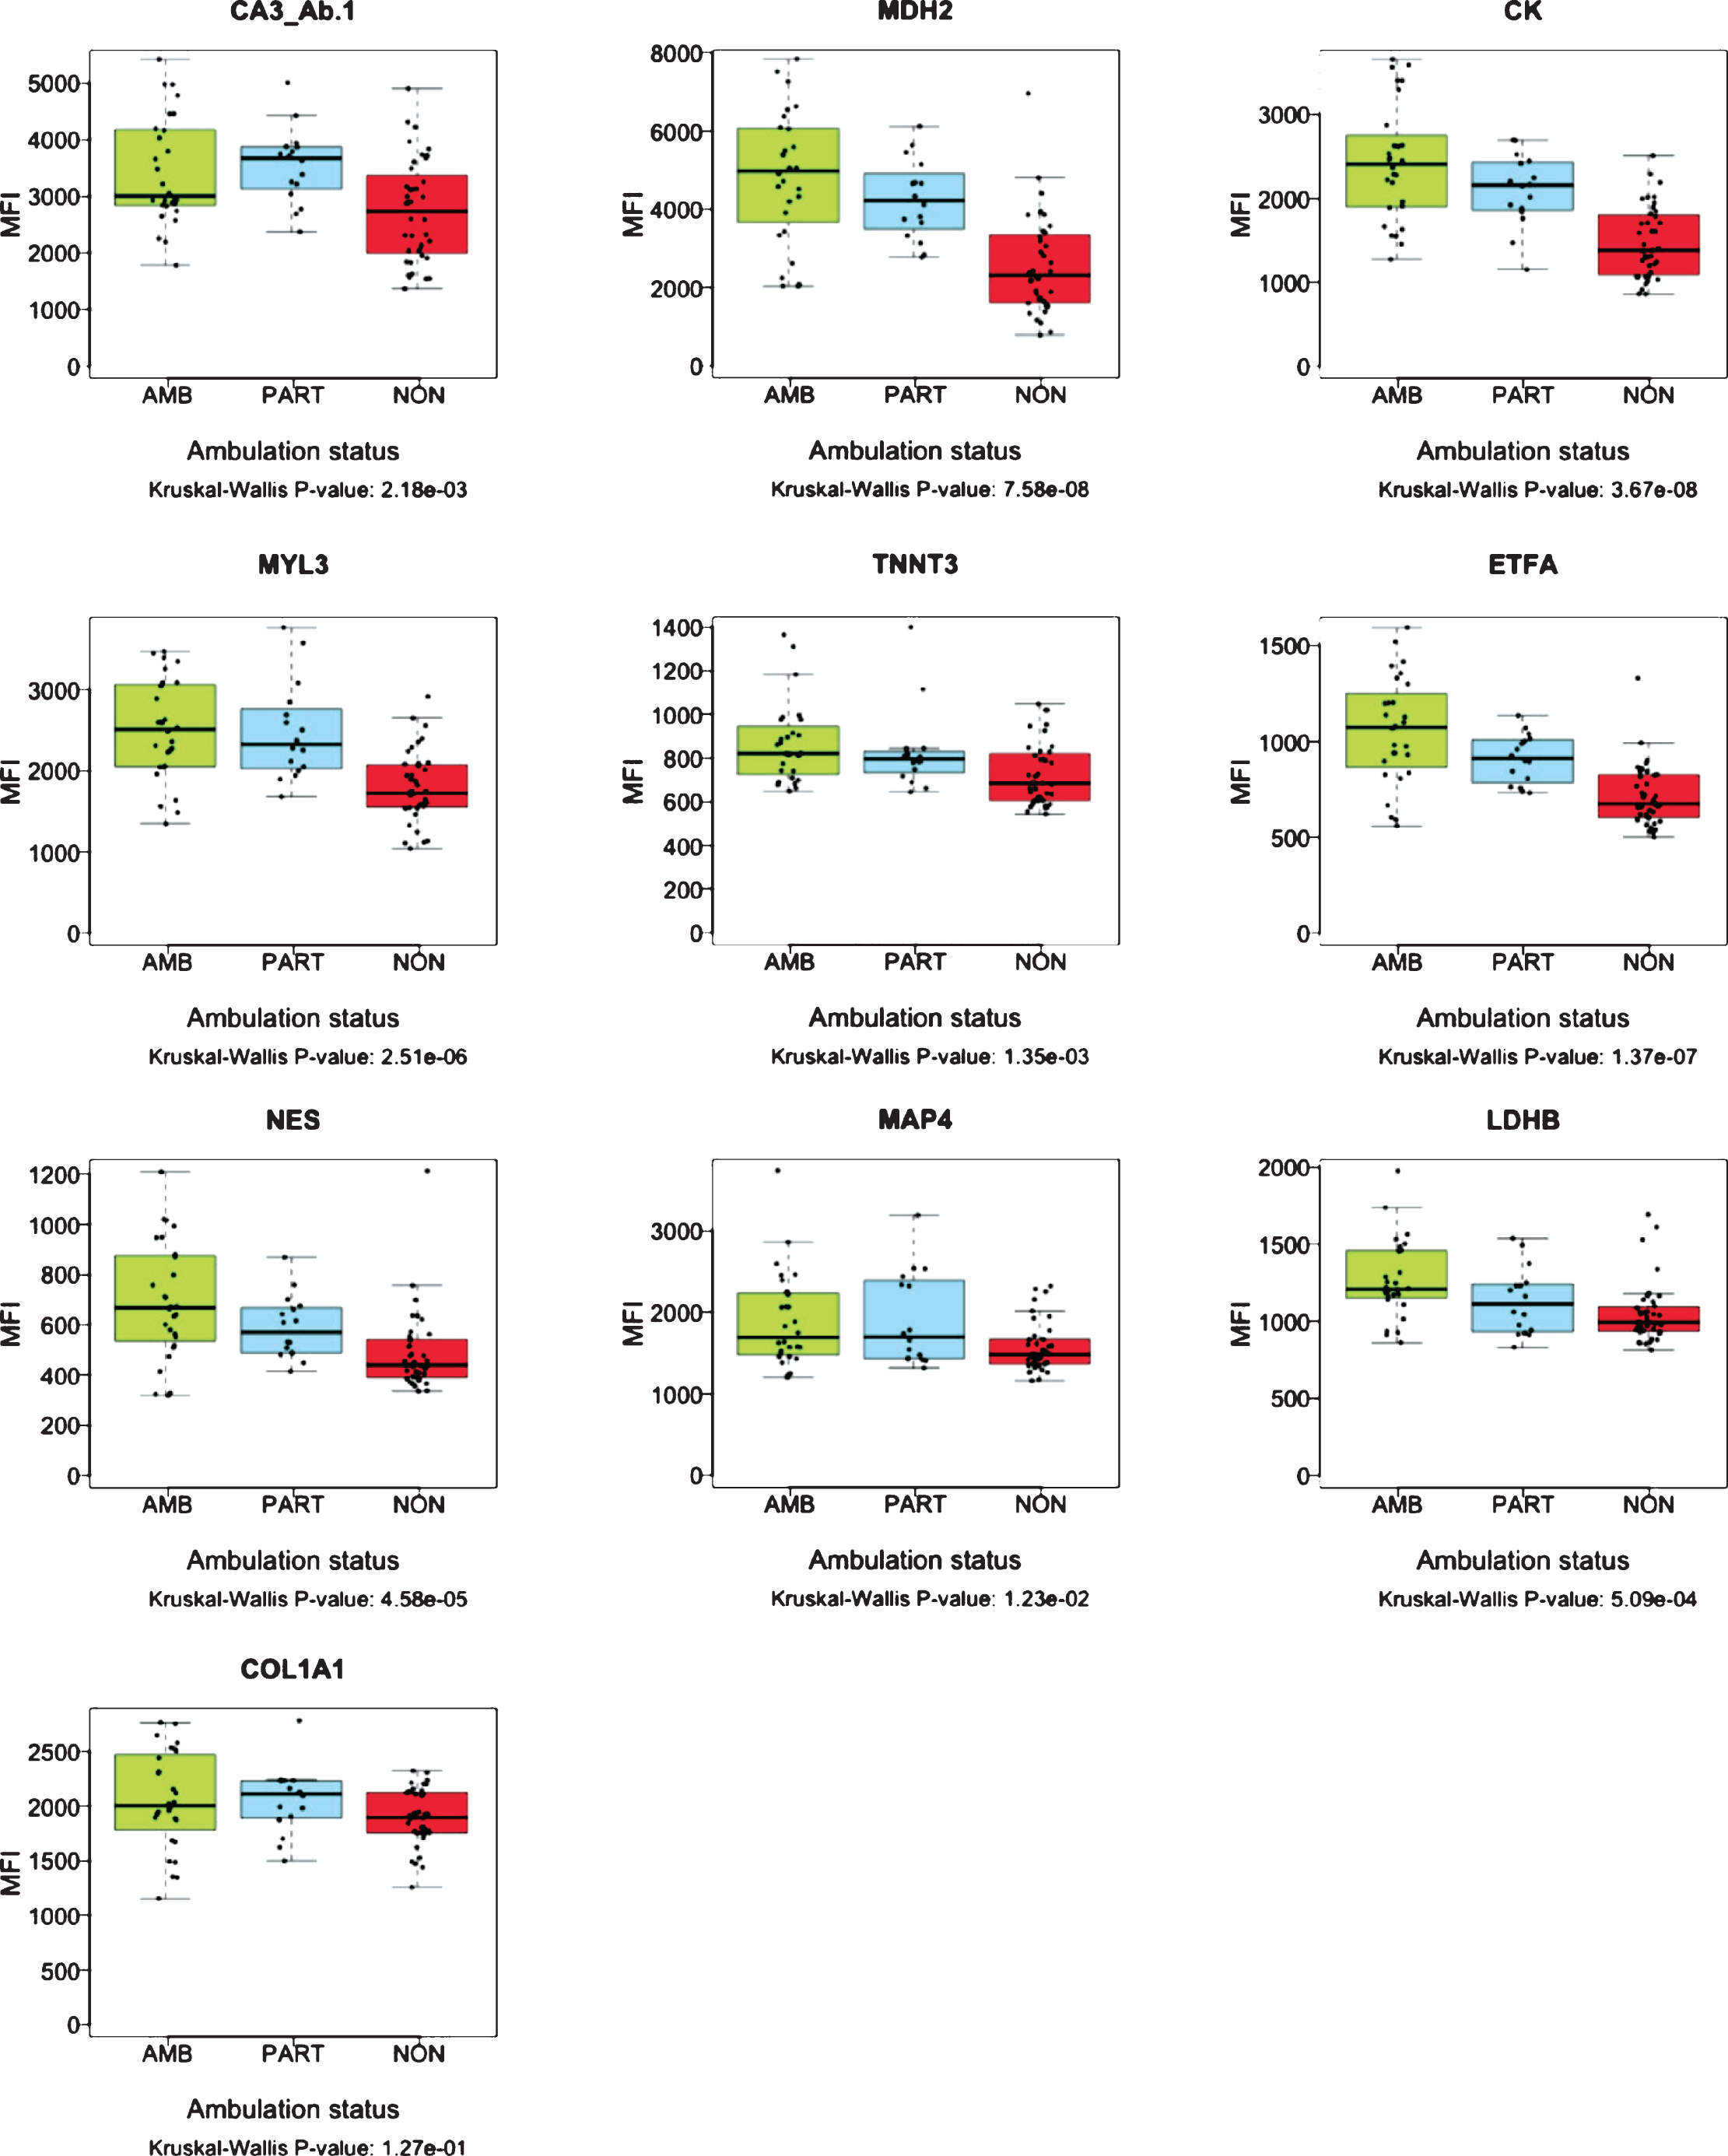
The collection of samples from LUMC cohort included “partially ambulant” patients, able to walk short distances indoors, but dependent on wheelchair use for outdoor transportation. To further investigate correlation of protein abundance with patient ambulatory capacity, serum biomarker profiles were analyzed over these three subsets of samples; ambulant (N: 28), partially-ambulant (N: 16) and non-ambulant patients (N: 40) (Fig. 3). The mean age of patients included in the analysis was 9.26 years for the ambulant subset, 9.70 years for the partially ambulant subset and 12.35 years for the non-ambulant subset. The protein abundance of MYL3, ETFA, MDH2, NES, TNNT3, LDHB and the diagnostic marker CK, decreased with decreasing ability to walk (Fig. 3). However, for CA3 and COL1A1, partially ambulant patients had the highest protein abundance. The abundance pattern was confirmed by detection of CA3 with two antibodies, CA3_Ab.1 and CA3_Ab.2 respectively (Fig. 3). Nevertheless, the COL1A1 level in ambulant, and non-ambulant did not differ significantly (P-value 1.27e-01). For MAP4 the protein level did not discriminate between partially ambulant patients and ambulant patients. In summary, the protein profiles of MYL3, ETFA, MDH2, NES, TNNT3 and LDHB correlated significantly (P-value < 0.001) with ambulation status of age-balanced patients, i.e. disease progression.
Fig. 3
Boxplots representing abundance of serum proteins in patients with different ambulation status. The green boxes represent ambulant patients (AMB. N: 28) the blue boxes represent partially ambulant patients (PART. N: 16) and the red boxes represent nonambulant patients (NON. N: 40) from LUMC. The p-values were calculated using Kruskal-Wallis test.
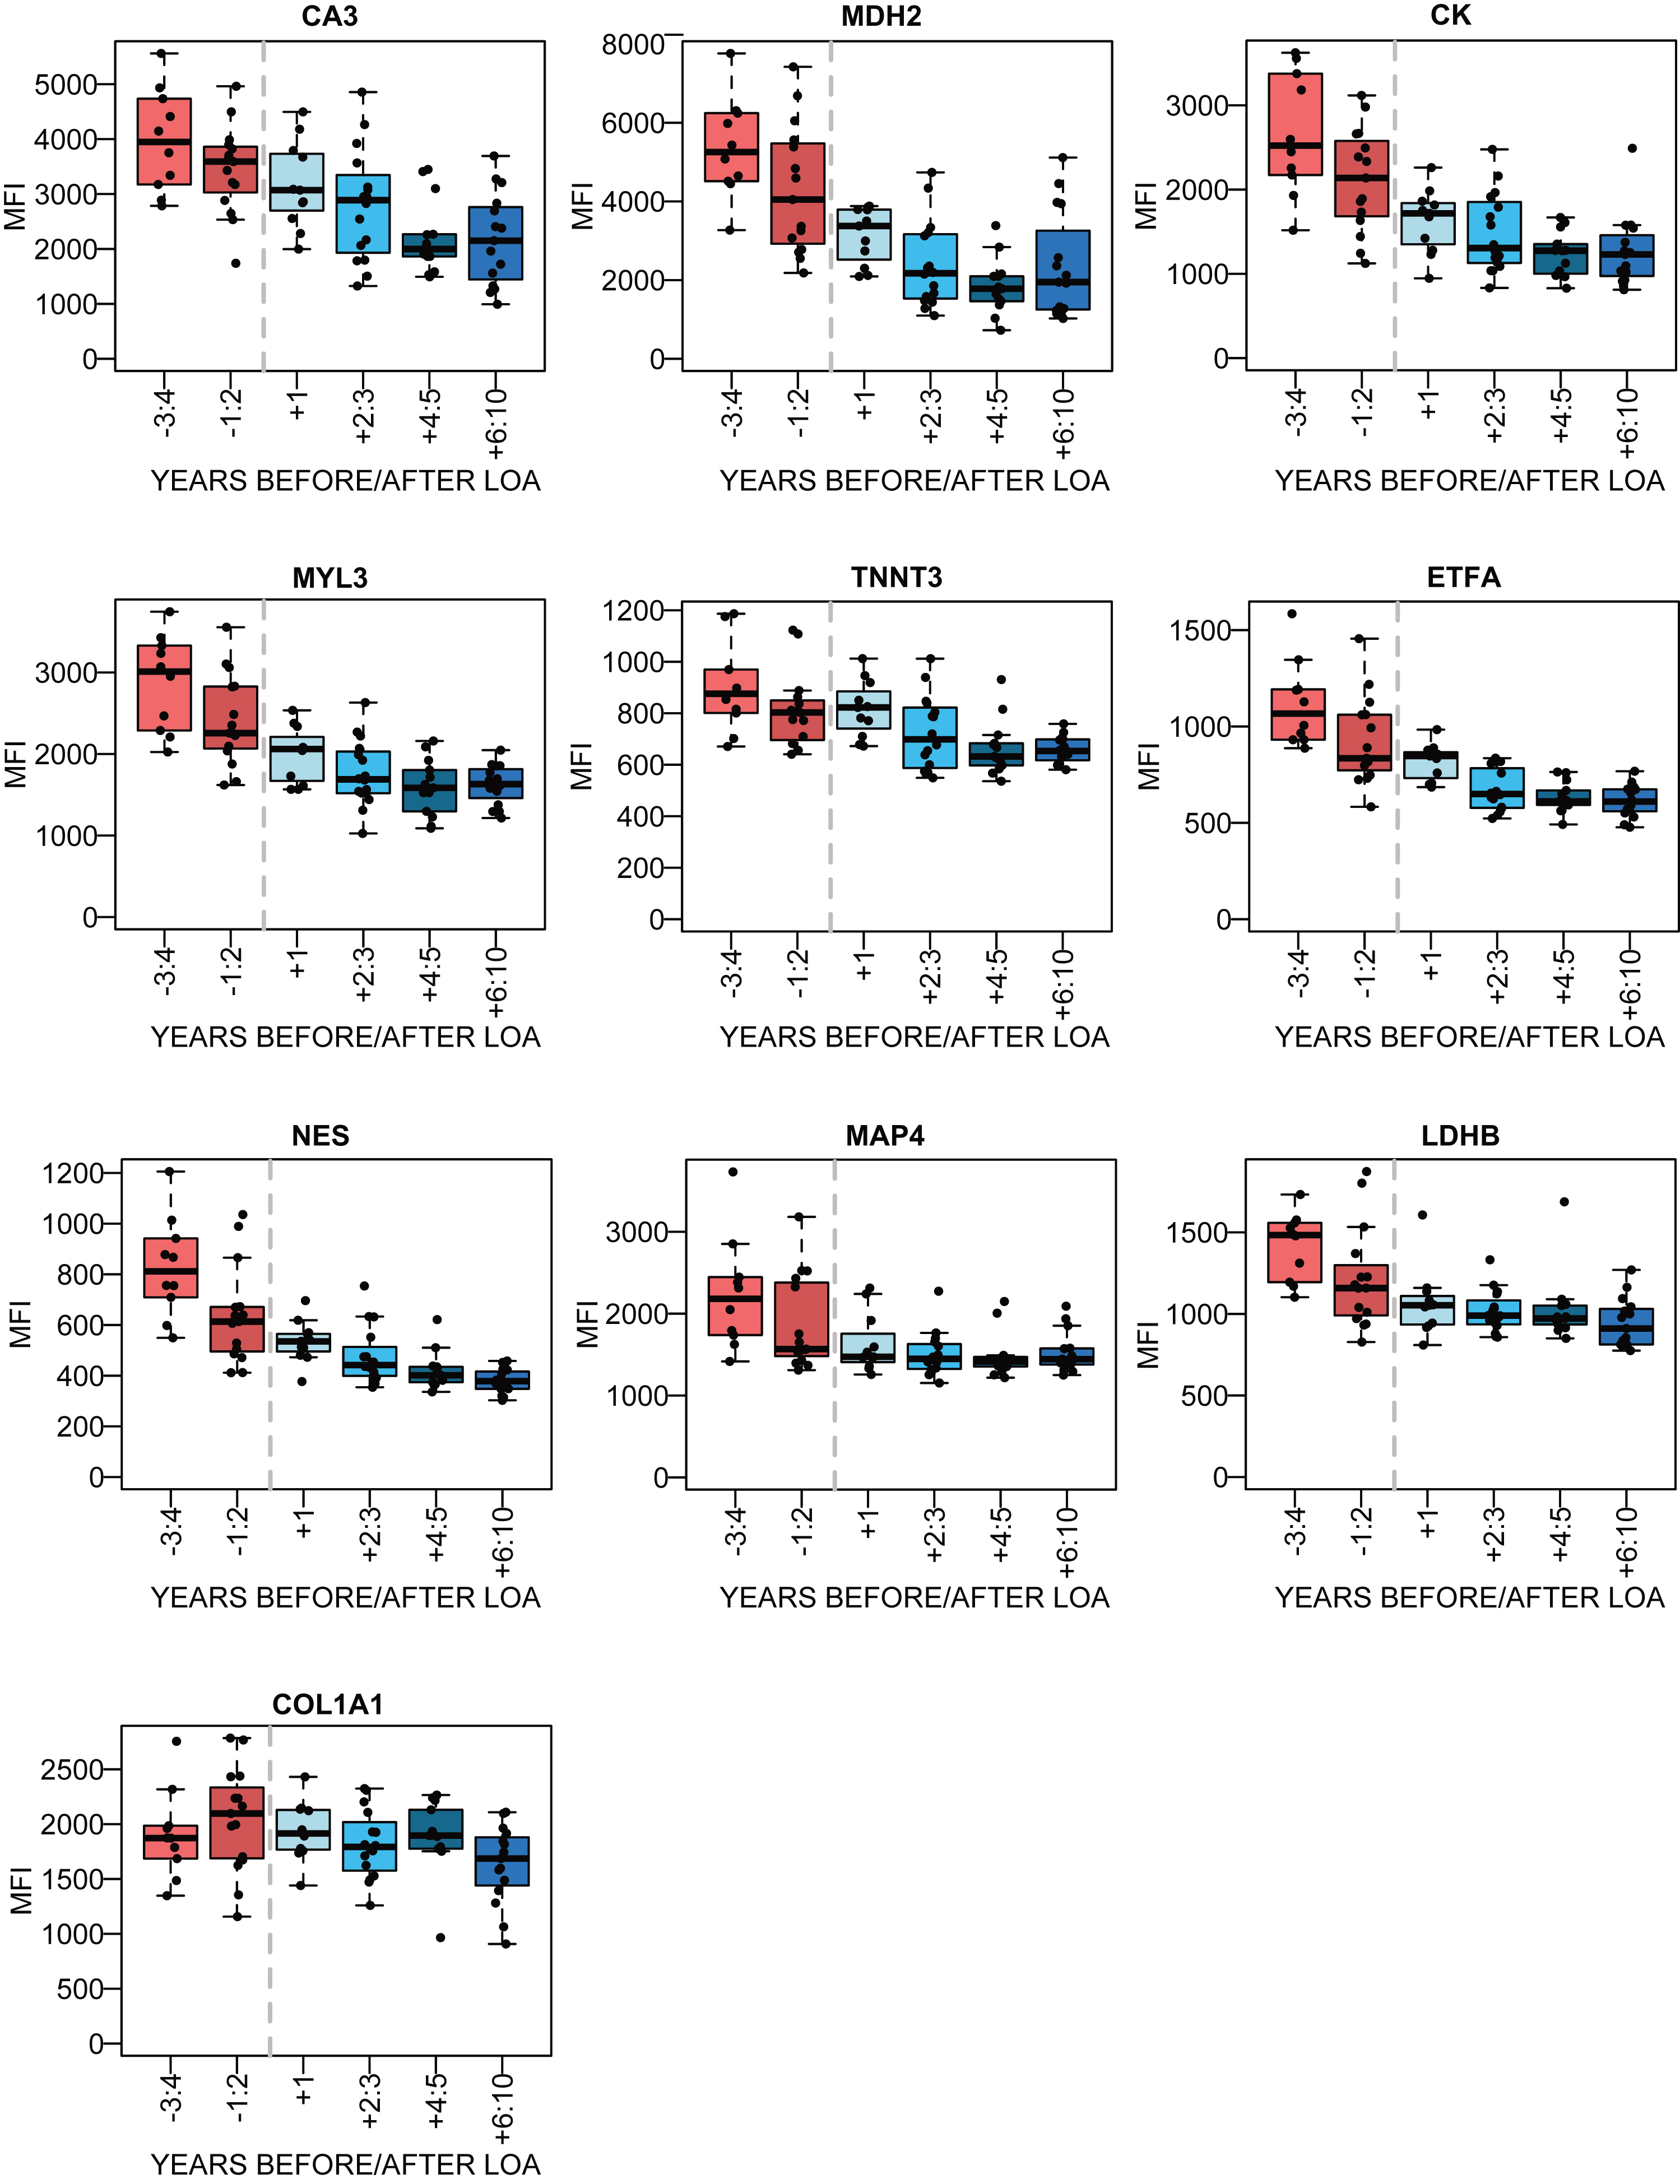
To further evaluate how biomarker abundance varies over time as the disease progresses, the patient samples with information regarding age at LoA were studied. The samples were stratified in accordance to the number of years before and after LoA and protein abundance was plotted for samples taken within 3-4 and 1-2 years before LoA and 1 year, 2-3, 4-5 and 6 years and more after LoA. The LUMC serum cohort had the highest number of patient samples with information about LoA, with 10–16 samples for each subset (Fig. 4). The LoA analysis for the plasma samples from UCL and UNEW and serum from UNEW can be seen in Supplementary Figure 6. COL1A1 abundance with respect to LoA had an inconclusive profile. Interestingly, NES had different abundance patterns in serum and plasma. Regression coefficients were calculated for the trajectories before and after the time point of loss of ambulation and the significance using Wald test (Supplementary Table 5). MYL3, MDH2, ETFA, NES decreased significantly before loss of ambulation in both serum and plasma whereas CK, MDH2 and TNNT3 decreased significantly after loss of ambulation.
Fig. 4
Association between the protein abundance and time before/after the loss of ambulation (LoA) for DMD patients. in the LUMC serum cohort. The red boxes represent the patient samples collected before LoA and the blue boxes represent patient samples collected after LoA. The dotted grey line represents the time of LoA.
Protein abundance correlation with clinical parameters
Biomarker suitability in a clinical set up is dependent on correlation with measurable pathological changes, distinct symptoms, quantitative parameters or treatment outcome. To assess the correlation between outcome of physical tests performed at the time the samples were collected, Spearman rank correlation coefficient was calculated and corresponding significance estimated as P–values since the measurements are not considered to be linearly distributed. North Star Ambulatory Assessment (NSAA), 6 Minutes Walking Distance (6MWD) and 10 Meters Walk-Test (10MWT) were included in the analysis (Table 4). MDH2 abundance in serum had a negative correlation with 10MWT in serum samples from two clinical sites. In addition MDH2 and ETFA levels had a positive correlation with 6MWD in serum and plasma samples from UCL. Correlation of the biomarkers with NSAA was ambiguous since positive correlation was observed in LUMC serum samples for ETFA, MDH2 and CK but negative in the UCL cohort.
Table 4
Correlation between protein biomarker abundances in blood samples and physical tests
| Target | Clinical parameter | LUMC serum | UCL serum | UNEW serum | UCL plasma | ||||||||
| Samples | ρ | P-value | Samples | ρ | P-value | Samples | ρ | P-value | Samples | ρ | P-value | ||
| CK | NSAA score | 25 | 0.56 | 0.004 | 22 | –0.54 | 0.009 | 45 | 0.31 | 0.037 | 24 | –0.65 | 6.0e-04 |
| ETFA | NSAA score | 25 | 0.71 | 7.1e-05 | 22 | –0.53 | 0.012 | 45 | 0.50 | 5.0e-04 | 30 | –0.40 | 0.05 |
| 6MWD | 34 | 0.49 | 0.003 | 26 | 0.66 | 3.0e-04 | ND | ND | ND | 24 | 0.64 | 1.4e-04 | |
| MDH2 | NSAA score | 25 | 0.70 | 9.5e-05 | 22 | –0.50 | 0.017 | 45 | 0.56 | 6.3e-05 | 24 | –0.40 | 0.06 |
| 10MWT | 45 | –0.52 | 3.0e-04 | 16 | –0.54 | 0.032 | ND | ND | ND | 18 | –0.41 | 0.09 | |
| 6MWD | 34 | 0.47 | 0.005 | 26 | 0.62 | 8.0e-04 | ND | ND | ND | 30 | 0.50 | 0.005 | |
Spearman rank correlation coefficient ρ was calculated for each protein biomarker per sample collection. Biomarkers correlating with outcome of physical tests as NSAA score, 6MWD and 10MWT with ρ > 0.50 or ρ<–0.50 in at least 2 sample collections and P-values < 0.05 were included.
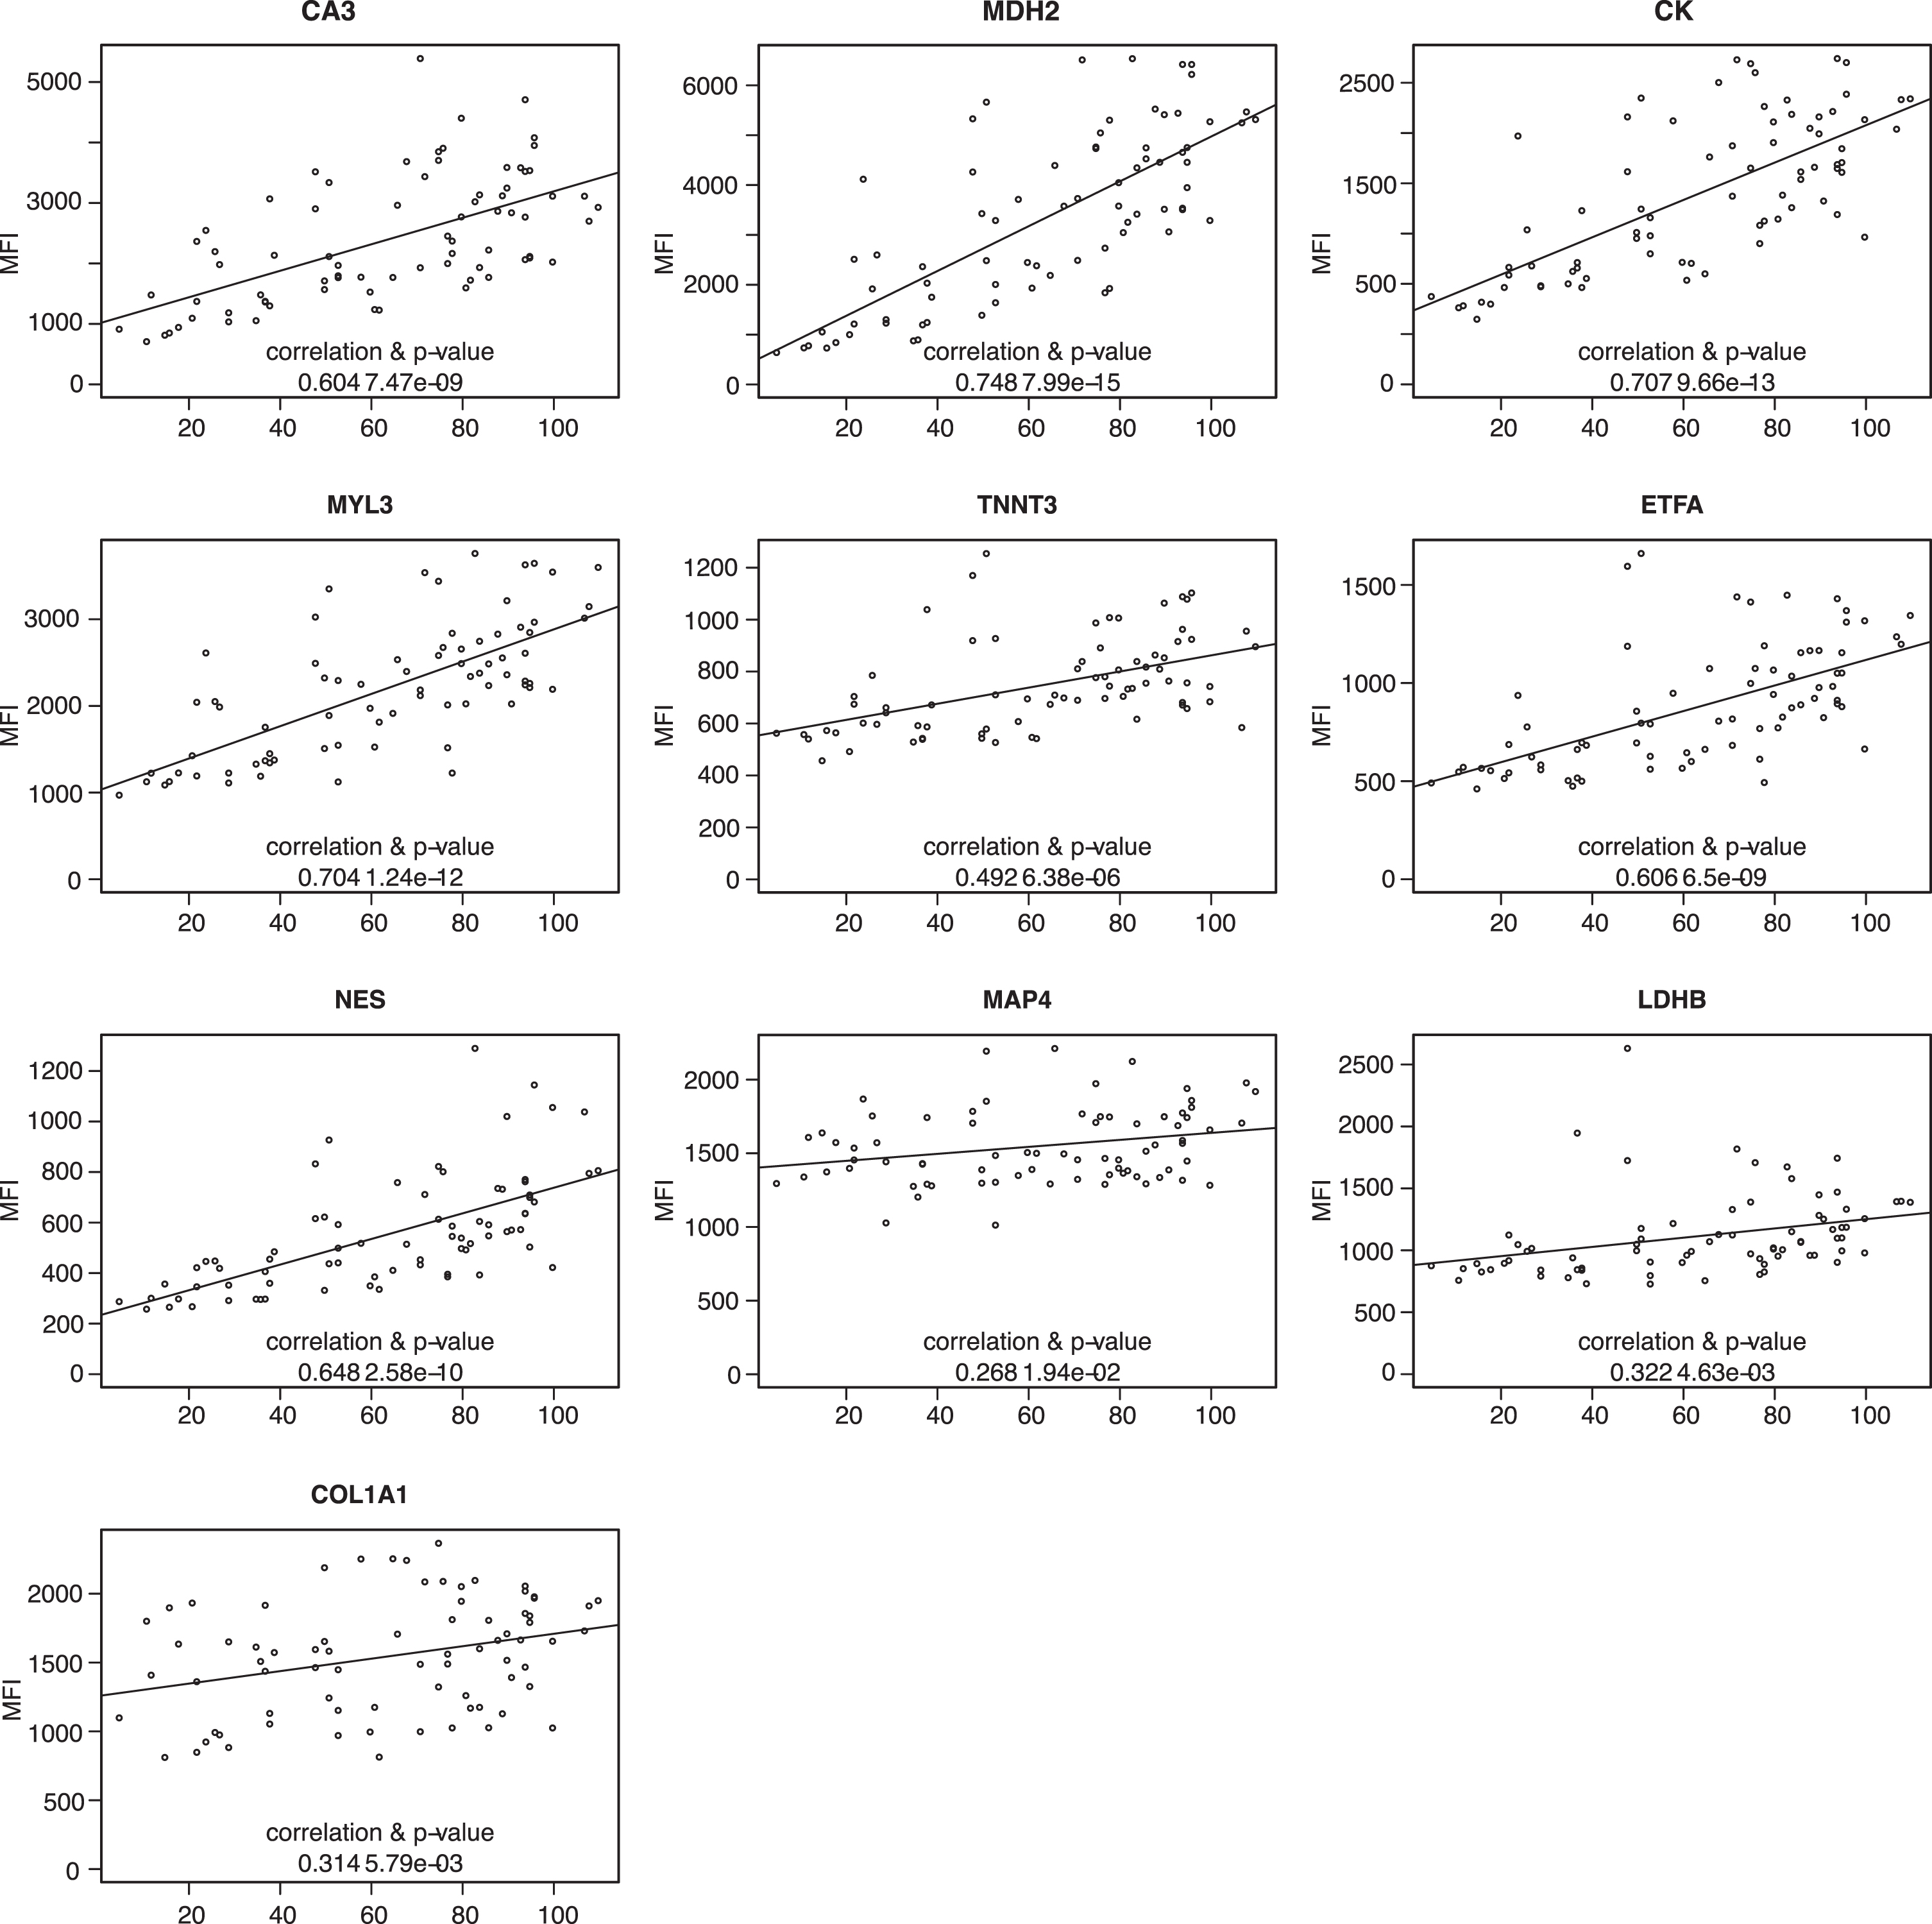
Patient information regarding LUMC serum, UNEW plasma and serum contained information about Forced Vital Capacity (FVC) as an estimation of the patient respiratory capacity. The protein profiles based on the analysis of 64 plasma samples from UNEW and 125 serum samples from LUMC and UNEW, were plotted against the FVC to evaluate any correlation and significance. Abundance of CA3, CK, MYL3, MDH2, ETFA and NES showed a Pearson correlation to FVC in serum samples and plasma samples from different clinical sites (Fig. 5 and Supplementary Figure 7). However, the abundance of these biomarkers correlated to FVC in serum samples from UNEW (Fig. 5). TNNT3, LDHB and COL1A1 showed weak positive correlation with FVC. In the analysis of the LUMC serum samples and UNEW plasma samples both the positive correlation and the significance is lower (Supplementary Figure 7). The protein level CA3, CK, MYL3, MDH2, ETFA, NES and TNNT3 in both serum cohorts showed correlation with highest significance. No significant correlation to fractional shortening or treatment with corticosteroids (prednisone and/or deflazacort) was detected (data not shown).
Fig. 5
Correlation of protein abundance patternwith respiratory capacity FVC. Plots representing analysis of the correlation between FVC and protein abundance in UNEW serum samples. Pearson correlation coefficients were calculated and significance estimated based on the analysis of 36 serum samples.
DISCUSSION
The number of biomarkers discovered is increasing rapidly, but one main challenge today is to validate the biomarkers and translate accumulated knowledge from research to clinical practice [5, 51]. The lack of validated biomarkers has consequences beyond their utilization in a clinical setup for predicting, diagnosing and monitoring disease progression. The delayed translation of biomarker research results into clinical tests also hinders drug development within rare diseases such as DMD. We created, in the context of DMD, a large collection of 560 samples to confirm and extend previous findings by exploring the utility of the analyzed biomarkers over time. Within rare diseases, this is a unique set-up comprising a large number of samples, with 339 samples longitudinally collected. A multicenter, multianalyte and high-throughput approach was used to profile biomarkers in both plasma and serum samples from DMD patients and controls.
Nine proteins, CA3, MYL3, ETFA, MDH2, NES, TNNT3, LDHB, COL1A1 and MAP4, previously reported as biomarker candidates using different approaches (aptamer-based [31, 32, 52], MS-based [28, 43, 53] and immunoassay-based [24]), [27] were verified as biomarkers by analyzing protein profiles in longitudinal samples and their association with clinical parameters indicative of disease progression. Five proteins (MYL3, ETFA, MDH2, CA3 and NES) were validated with high significance in all five cohorts and two proteins (COL1A1 and MAP4) in four cohorts, both in plasma and serum. The actual P-value for each biomarker is considerably lower and the improved significance was most likely due to the increased number of patient samples analyzed, 496 in comparison to 190 previously analyzed and therefore increased statistical power. Given that, the majority of the biomarkers are muscle specific proteins, their abundance level could mirror the deterioration of specific muscle groups. Each biomarker contributes with information regarding the health status of the tissues they originate from eg. MYL3 is highly expressed in tibialis anterior and most likely mirrors deterioration of this muscle. This indicates that biomarkers originate from different tissues, cell types. In the context of DMD, patients experience degeneration of first proximal muscles and later distal muscles. Consequently, biomarkers that are more abundant in proximal muscles would be suitable for monitoring disease progression during early rather than late stage of the disease. Thus, a comprehensive analysis of gene expression in different dystrophic tissues could increase our understanding of which tissues release the biomarkers and what information they provide.
The protein profiles of CA3, MDH2, NES and MAP4 were verified by several antibodies. Abundance of CA3 estimated using both commercial antibodies and HPA antibodies showed a significant correlation. Evaluating the results obtained with different antibodies against the same target shows that antibodies displaying low MFI or varying protein profiles over cohorts (e.g. ETFA_Ab.4) and not in conformity with the protein profile of the antibody within the analysis cut-off, were either recognizing different splice variants of the target proteins or had low sensitivity as estimated by Western Blot (data not shown). The low sensitivity of the immunoassays can also be influenced by the availability of different epitopes on the target e.g. CA3_Ab.4, which is influenced by conformation of the native protein during the analysis and accessibility to the epitope.
In this longitudinal and age-dependent analysis, protein abundance profile in serum and plasma was confirmed to correlate with disease progression. The majority of the biomarkers analyzed decrease over time but the slope of decline is almost abolished after the age of 14. These biomarkers would most likely require quantification assays of high sensitivity to accurately monitor disease related changes in older patients. Only CA3 and MAP4 decreased more continuously in older patients.
By evaluating the protein profiles in the LoA-plots from both plasma and serum sample collections, the biomarkers could be stratified into three main groups. The biomarkers belonging to the first group have a protein profile with a prominent decrease in protein level before LoA, and a slower decrease after LoA. This is the largest group and consists of MYL3, MDH2, ETFA, LDHB and MAP4, similar to the profile of CK. CA3 and COL1A1 have a faster decrease of protein level after than prior LoA. In contrast, NES showed varying protein profiles prior and after LoA over cohorts whereas LDHB had very small abundance changes after LoA. CA3, MDH2, NES, TNNT3 variation over time makes them suitable as biomarkers up to 5 years after LoA. Due to the small changes of ETFA, LDHB and MAP4, levels after LoA, these biomarkers are not suitable as disease progression biomarkers at older age.
Correlation between protein abundance and outcome of physical tests shows that ETFA and MDH2 have positive correlation with 6MWD and that MDH2 has negative correlation with 10MWT [54]. The correlation of MDH2 abundance with physical tests can be related to deterioration of muscles and consequent increase time to perform the 10MWT and decreasing distance covered in the 6MWD as the disease progresses. Correlation of ETFA abundance with 6MWD, a test largely dependent on muscle fibers type 1 (slow twitch muscle fibers) can be explained by the higher expression of ETFA in this muscle fibers (Table 2) [55]. The correlation between biomarker abundances and NSAA score exhibits low significance. Similarly, CK blood levels also have different correlation with NSAA score across sample cohorts. This could be influenced by the heterogeneity of the patients donating samples as the LUMC cohort, which comprised 59% non-ambulant patients whereas the UNEW cohort comprised 39% non-ambulant patients. The correlation with the NSAA score might be biased since the tests are performed by ambulant patients and only reflect damage of lower limb muscles rather than upper limbs. Comparison of biomarker abundance in blood with fat infiltration in muscle quantified by MRI would indicate how well the biomarkers mirror muscle deterioration. However, the limited number of longitudinal studies performed so far and the lack of a standardized protocol for qMRI still remains a challenge. Interestingly CA3, MYL3, MDH2, ETFA, NES and TNNT3 showed a significant positive correlation with lung capacity (FVC) in the serum samples from UNEW. This positive correlation was poor when analyzing serum sample from LUMC and UCL. The heterogeneity of the cohorts in term of patient age can explain the discrepancy observed. The UNEW serum samples were collected from older patients, with a median age of 12,2 years in comparison to the ones from LUMC and UCL (10.3 and 10.1 years respectively). In DMD patients, FVC increases in young individuals reaching a peak around the age of 13-14 followed by subsequent decline [56]. The biomarkers abundance most likely do not correlate with the increase in FVC at young age but with the decrease caused by the loss of respiratory muscle function. However, this remains to be confirmed by studies in larger sample collections. Fractional Shortening which estimates cardiac function heart capacity did not generate conclusive results (data not shown).
In this study, nine proteins (CA3, MDH2, MYL3, TNNT3, ETFA, NES, LDHB, COL1A1 and MAP4) are confirmed as protein biomarkers in longitudinal samples from DMD patients and together with CK constitute a panel of biomarkers associated with disease progression. This improved panel most likely comprises proteins that originate from different tissues, are involved in different ongoing processes and most likely indicate alterations in different tissues. The biomarkers follow different abundance pattern over time and can monitor disease progression. Many of these biomarkers follow different trajectories reflecting varying levels over time. Our results suggest that not all biomarkers are equally informative at all stages of the disorder and most likely several biomarkers will be required to monitor disease progression over time. The abundance changes of the biomarkers is higher at early stage of the disease but decrease as the disease progresses. One of the limitations of our study is the small number of patients within each age group, in particular non-ambulant patients which restricts the possibility to evaluate the value of the biomarkers at late disease stages when abundance changes are small. To tackle this aspect, new biomarker quantification assays with lower detection limit and increased accuracy have to be developed. These biomarkers together, if validated, could be used to estimate disease states. To generate specific measurement tools for clinical use, not only sample collections suitable to address specific questions are required (e.g. longitudinal samples and samples from patients involved in clinical trials), but also consistent information regarding time of loss of ambulation and functional tests.
CONFLICT OF INTEREST
The authors declare that they have no conflict of interest relevant for this manuscript.
ACKNOWLEDGMENTS
We thank all members of the Affinity Proteomics group at SciLifeLab for technical assistance as well as Mathias Uhlén and the entire staff of the Human Protein Atlas for their efforts. This work was supported by Association Française contre les Myopathies (AFM) [grant number 17724]. HL received funding by the Medical Research Council (MRC) Centre for Neuromuscular Diseases UK (reference G1002274, grant ID 98482) and by the European Commission through the projects Neuromics (No. 305121) and RD-Connect (No. 305444). PS received funding by the AFM (grant ID 19118), Prinses Beatrix Spierfonds (grant ID W.OR14-13) and the Dutch Duchenne Parent Project. The authors thank the MRC Centre for Neuromuscular Diseases for its support through the Neuromuscular Disease BioBank, and the Muscular Dystrophy UK for its support to the Neuromuscular Centre at UCL. FM is supported by the NIHR Great Ormond Street Hospital Biomedical Research Centre; the views expressed in this paper are those of the authors and not necessarily those of the NHS, the NIHR, or the Department of Health.
SUPPLEMENTARY MATERIAL
[1] The supplementary material is available in the electronic version of this article: https://dx.doi.org/10.3233/JND-190454.
REFERENCES
[1] | Huang S , Chaudhary K , Garmire LX . More Is Better: Recent Progress in Multi-Omics Data Integration Methods. Front Genet. (2017) ;8: :84. doi:10.3389/fgene.2017.00084 |
[2] | Malottki K , Billingham L , Riley R , Deeks J . Reviewing the evidence supporting predictive biomarkers in European medicines agency indications and contraindications using visual plots. Trials. 2015 16:2 (2015) ;16: :P157. doi:10.1186/1745-6215-16-S2-P157 |
[3] | Malottki K , Biswas M , Deeks JJ , Riley RD , Craddock C , Johnson P , et al. Stratified medicine in European Medicines Agency licensing: a systematic review of predictive biomarkers. BMJ Open. (2014) ;4: :e004188. doi:10.1136/bmjopen-2013-004188 |
[4] | Kearney P , Boniface JJ , Price ND , Hood L . The building blocks of successful translation of proteomics to the clinic. Curr Opin Biotechnol. (2018) ;51: :123–9. doi:10.1016/j.copbio.2017.12.011 |
[5] | Füzéry AK , Levin J , Chan MM , Chan DW . Translation of proteomic biomarkers into FDA approved cancer diagnostics: issues and challenges. Clin Proteomics. (2013) ;10: :13. doi:10.1186/1559-0275-10-13 |
[6] | Qundos U , Hong M-G , Tybring G , Divers M , Odeberg J , Uhlén M , et al. Profiling post-centrifugation delay of serum and plasma with antibody bead arrays. J Proteomics. (2013) ;95: :46–54. doi:10.1016/j.jprot.2013.04.020 |
[7] | Sun W , Zheng W , Simeonov A . Drug discovery and development for rare genetic disorders. Am J Med Genet A. (2017) ;173: :2307–22. doi:10.1002/ajmg.a.38326 |
[8] | Fuller HR , Graham LC , Llavero Hurtado M , Wishart TM . Understanding the molecular consequences of inherited muscular dystrophies: advancements through proteomic experimentation. Expert Rev Proteomics. (2016) ;13: :659–71. doi:10.1080/14789450.2016.1202768 |
[9] | Wu B , Cloer C , Lu P , Milazi S , Shaban M , Shah SN , et al. Exon skipping restores dystrophin expression, but fails to prevent disease progression in later stage dystrophic dko mice. Gene Ther. (2014) ;21: :785–93. doi:10.1038/gt.2014.53 |
[10] | Bushby K , Finkel R , Birnkrant DJ , Case LE , Clemens PR , Cripe L , et al. Diagnosis and management of Duchenne muscular dystrophy, part implementation of multidisciplinary care. Lancet Neurol. (2010) ;9: :177–89. doi:10.1016/S1474-4422(09)70272-8 |
[11] | Emery AE . The muscular dystrophies. The Lancet. (2002) ;359: :687–95. doi:10.1016/S0140-6736(02)07815-7 |
[12] | Mah JK . An Overview of Recent Therapeutics Advances for Duchenne Muscular Dystrophy. Methods Mol Biol. (2018) ;1687: :3–17. doi:10.1007/978-1-4939-7374-3_1 |
[13] | Kempen JCE , Harlaar J , van der Kooi AJ , de Groot IJM , van den Bergen JC , Niks EH , et al. Reliability of the walking energy cost test and the six-minute walk test in boys with Duchenne muscular dystrophy. Neuromuscul Disord. (2014) ;24: :216–21. doi:10.1016/j.nmd.2013.11.015 |
[14] | McDonald CM , Henricson EK , Abresch RT , Florence J , Eagle M , Gappmaier E , et al. The 6-minute walk test and other clinical endpoints in duchenne muscular dystrophy: reliability, concurrent validity, and minimal clinically important differences from a multicenter study. Muscle & Nerve. (2013) ;48: :357–68. doi:10.1002/mus.23905 |
[15] | Mazzone E , Martinelli D , Berardinelli A , Messina S , D’Amico A , Vasco G , et al. North Star Ambulatory Assessment, 6-minute walk test and timed items in ambulant boys with Duchenne muscular dystrophy. Neuromuscul Disord. (2010) ;20: :712–6. doi:10.1016/j.nmd.2010.06.014 |
[16] | De Sanctis R , Pane M , Sivo S , Ricotti V , Baranello G , Frosini S , et al. Suitability of North Star Ambulatory Assessment in young boys with Duchenne muscular dystrophy. Neuromuscul Disord. (2015) ;25: :14–8. doi:10.1016/j.nmd.2014.09.015 |
[17] | Ricotti V , Ridout DA , Pane M , Main M , Mayhew A , Mercuri E , et al. The NorthStar Ambulatory Assessment in Duchenne muscular dystrophy: considerations for the design of clinical trials. J Neurol Neurosurg Psychiatr. (2016) ;87: :149–55. doi:10.1136/jnnp-2014-309405. |
[18] | Ricotti V , Mandy WPL , Scoto M , Pane M , Deconinck N , Messina S , et al. Neurodevelopmental, emotional, and behavioural problems in Duchenne muscular dystrophy in relation to underlying dystrophin gene mutations. Dev Med Child Neurol. (2016) ;58: :77–84. doi:10.1111/dmcn.12922 |
[19] | Wren TAL , Bluml S , Tseng-Ong L , Gilsanz V . Three-Point Technique of Fat Quantification of Muscle Tissue as a Marker of Disease Progression in Duchenne Muscular Dystrophy: Preliminary Study. American Journal of Roentgenology.W. (2012) ;190: :8–12. doi:10.2214/AJR.07.2732 |
[20] | Arpan I , Willcocks RJ , Forbes SC , Finkel RS , Lott DJ , Rooney WD , et al. Examination of effects of corticosteroids on skeletal muscles of boys with DMD using MRI and MRS. Neurology. (2014) ;83: :974–80. doi:10.1212/WNL.0000000000000775 |
[21] | Lott DJ , Forbes SC , Mathur S , Germain SA , Senesac CR , Lee Sweeney H , et al. Assessment of intramuscular lipid and metabolites of the lower leg using magnetic resonance spectroscopy in boys with Duchenne muscular dystrophy. Neuromuscul Disord. (2014) ;24: :574–82. doi:10.1016/j.nmd.2014.03.013 |
[22] | Govoni A , Magri F , Brajkovic S , Zanetta C , Faravelli I , Corti S , et al. Ongoing therapeutic trials and outcome measures for Duchenne muscular dystrophy. Cell Mol Life Sci. (2013) ;70: :4585–602. doi:10.1007/s00018-013-1396-z |
[23] | Ozawa E , Hagiwara Y , Yoshida M . Creatine kinase, cell membrane and Duchenne muscular dystrophy. Mol Cell Biochem. (1999) ;190: :143–51. |
[24] | Ayoglu B , Chaouch A , Lochmüller H , Politano L , Bertini E , Spitali P , et al. Affinity proteomics within rare diseases: a BIO-NMD study for blood biomarkers of muscular dystrophies. EMBO Mol Med. (2014) ;6: :918–36. doi:10.15252/emmm.201303724 |
[25] | Ohta M , Itagaki Y , Itoh N , Hayashi K , Nishitani H , Ohta K . Carbonic anhydrase III in serum in muscular dystrophy and other neurological disorders: relationship with creatine kinase. Clinical Chemistry. (1991) ;37: :36–9. |
[26] | Nishita T , Yorifuji D , Orito K , Ichihara N , Arishima K . Muscle carbonic anhydrase III levels in normal and muscular dystrophia afflicted chickens. Acta Vet Scand. 2012;54. doi:10.1186/1751-0147-54-34 |
[27] | Szigyarto CA-K , Spitali Pietro . Biomarkers of Duchenne muscular dystrophy: current findings. Dnnd. (2018) ;8: :1–13. doi:10.2147/DNND.S121099 |
[28] | Burch PM , Pogoryelova O , Goldstein R , Bennett D , Guglieri M , Straub V , et al. Muscle-Derived Proteins as Serum Biomarkers for Monitoring Disease Progression in Three Forms of Muscular Dystrophy. J Neuromuscul Dis. (2015) ;2: :241–55. doi:10.3233/JND-140066 |
[29] | Carberry S , Zweyer M , Swandulla D , Ohlendieck K . Proteomics reveals drastic increase of extracellular matrix proteins collagen and dermatopontin in the aged mdx diaphragm model of Duchenne muscular dystrophy. Int J Mol Med. (2012) ;30: :229–34. doi:10.3892/ijmm.2012.1006 |
[30] | Pescatori M , Broccolini A , Minetti C , Bertini E , Bruno C , D’Amico A , et al. Gene expression profiling in the early phases of DMD: a constant molecular signature characterizes DMD muscle from early postnatal life throughout disease progression. Faseb J. (2007) ;21: :1210–26. doi:10.1096/fj.06-7285com |
[31] | Hathout Y , Brody E , Clemens PR , Cripe L , DeLisle RK , Furlong P , et al. Large-scale serum protein biomarker discovery in Duchenne muscular dystrophy. Proc Natl Acad Sci USA. (2015) ;112: :7153–8. doi:10.1073/pnas.1507719112 |
[32] | Coenen-Stass A , McClorey G , Manzano R , Betts C , Blain A , Saleh A , et al. Identification of novel therapy-responsive protein biomarkers for Duchenne muscular dystrophy by aptamer-based serum proteomics. Neuromuscul Disord. (2015) ;25: :S251–2. doi:10.1016/j.nmd.2015.06.242 |
[33] | Salam EA , Abdel-Meguid IE , Shatla R , Korraa S . Evaluation of neural damage in Duchenne muscular dystrophy patients. Acta Myol. (2014) ;33: :13–8. |
[34] | Schwenk JM , Gry M , Rimini R , Uhlén M , Nilsson P . Antibody suspension bead arrays within serum proteomics. J Proteome Res. (2008) ;7: :3168–79. doi:10.1021/pr700890b |
[35] | Ihaka R , Gentleman R . R: A Language for Data Analysis and Graphics. Journal of Computational and Graphical Statistics. (1996) ;5: :299–314. doi:10.1080/10618600.1996.10474713 |
[36] | Kohl SM , Klein MS , Hochrein J , Oefner PJ , Spang R , Gronwald W . State-of-the art data normalization methods improve NMR-based metabolomic analysis. Metabolomics. (2012) ;8: :146–60. doi:10.1007/s11306-011-0350-z |
[37] | Dieterle Frank , Ross Alfred , Götz Schlotterbeck A , Senn H . Probabilistic Quotient Normalization as Robust Method to Account for Dilution of Complex Biological Mixtures. Application in 1H NMR Metabonomics. Anal Chem. (2006) ;78: :4281–90. doi:10.1021/ac051632c |
[38] | Liang K-Y , Zeger SL . Longitudinal Data Analysis Using Generalized Linear Models. Biometrika. (1986) ;73: :13. doi:10.2307/2336267 |
[39] | Halekoh U , Højsgaard S , Yan J . The R Package geepack for Generalized Estimating Equations. J Stat Softw. (2006) ;15: :1–11. |
[40] | Chongsuvivatwong V . Analysis of Epidemiological Data Using R and Epicalc. Songkla, Thailand: 2008. |
[41] | Dobin A , Davis CA , Schlesinger F , Drenkow J , Zaleski C , Jha S , et al. STAR: ultrafast universal RNA-seq aligner. Bioinformatics. (2013) ;29: :15–21. doi:10.1093/bioinformatics/bts635 |
[42] | Trapnell C , Roberts A , Goff L , Pertea G , Kim D , Kelley DR , et al. Differential gene and transcript expression analysis of RNA-seq experiments with TopHat and Cufflinks. Nat Protoc. (2012) ;7: :562–78. doi:10.1038/nprot.2012.016 |
[43] | Cynthia Martin F , Hiller M , Spitali P , Oonk S , Dalebout H , Palmblad M , et al. Fibronectin is a serum biomarker for Duchenne muscular dystrophy. Proteomics Clin Appl. (2014) ;8: :269–78. doi:10.1002/prca.201300072 |
[44] | Edfors F , Hober A , Linderbäck K , Maddalo G , Azimi A , Sivertsson Å , et al. Enhanced validation of antibodies for research applications. Nat Commun. (2018) ;9: :4130. doi:10.1038/s41467-018-06642-y |
[45] | Uhlén M , Oksvold P , Fagerberg L , Lundberg E , Jonasson K , Forsberg M , et al. Towards a knowledge-based Human Protein Atlas. Nat Biotech. (2010) ;28: :1248–50. doi:10.1038/nbt1210-1248 |
[46] | Fagerberg L , Hallström BM , Oksvold P , Kampf C , Djureinovic D , Odeberg J , et al. Analysis of the human tissue-specific expression by genome-wide integration of transcriptomics and antibody-based proteomics. Mol Cell Proteomics. (2014) ;13: :397–406. doi:10.1074/mcp.M113.035600 |
[47] | Uhlén M , Bandrowski A , Carr S , Edwards A , Ellenberg J , Lundberg E , et al. A proposal for validation of antibodies. Nat Methods. (2016) ;13: :823–7. doi:10.1038/nmeth.3995 |
[48] | Conklin LS , Damsker JM , Hoffman EP , Jusko WJ , Mavroudis PD , Schwartz BD , et al. Phase IIa trial in Duchenne muscular dystrophy shows vamorolone is a first-in-class dissociative steroidal anti-inflammatory drug. Pharmacological Research. (2018) ;136: :140–50. doi:10.1016/j.phrs.2018.09.007 |
[49] | Wang ET , Treacy D , Eichinger K , molecular ASH, 2019. Transcriptome alterations in myotonic dystrophy skeletal muscle and heart. Human Molecular Genetics. (2019) ;28: :1312–21. doi:10.1093/hmg/ddy432 |
[50] | Martone J , Briganti F , Legnini I , Morlando M , Picillo E , Sthandier O , et al. The lack of the Celf2a splicing factor converts a Duchenne genotype into a Becker phenotype. Nat Commun. (2016) ;7: :10488. doi:10.1038/ncomms10488 |
[51] | de Gramont A , Watson S , Ellis LM , Rodón J , Tabernero J , de Gramont A , et al. Pragmatic issues in biomarker evaluation for targeted therapies in cancer. Nat Rev Clin Oncol. (2015) ;12: :197–212. doi:10.1038/nrclinonc.2014.202 |
[52] | Spitali Pietro , Hettne K , Tsonaka R , Charrout M , van den Bergen J , Koeks Z , et al. Tracking disease progression non-invasively in Duchenne and Becker muscular dystrophies. J Cachexia, Sarcopenia Muscle. (2018) ;80: :706–26. doi:10.1002/jcsm.12304 |
[53] | Dowling P , Holland A , Ohlendieck K . Mass Spectrometry-Based Identification of Muscle-Associated and Muscle-Derived Proteomic Biomarkers of Dystrophinopathies. J Neuromuscul Dis. (2014) ;1: :15–40. doi:10.3233/JND-140011 |
[54] | Guiraud S , Edwards B , Squire SE , Babbs A , Shah N , Berg A , et al. Identification of serum protein biomarkers for utrophin based DMD therapy. Sci Rep. (2017) ;7: :43697. doi:10.1038/srep43697 |
[55] | Okumura N , Hashida-Okumura A , Kita K , Matsubae M , Matsubara T , Takao T , et al. Proteomic analysis of slow- and fast-twitch skeletal muscles. Proteomics. (2005) ;5: :2896–906. doi:10.1002/pmic.200401181 |
[56] | Khirani S , Ramirez A , Aubertin G , Boule M , Chemouny C , Forin V , et al. Respiratory Muscle Decline in Duchenne Muscular Dystrophy. Pediatr Pulmonol. (2014) ;49: :473–81. doi:10.1002/ppul.22847 |


