
Mammography Adherence among High-Risk Women with Breast Cancer and Either a Non-Pathogenic Mutation Identified or Untested BRCA1/2 Genetic Status
Abstract
Background:
Little is known about the illness perceptions of women with a previous breast cancer diagnosis and either no access to a personal BRCA1/2 test or tested and a no pathogenic mutation identified result and how this might impact their mammography adherence.
Objective:
The aim of this study was to assess the impact of illness beliefs, specifically those relating to emotional representations and cure and control beliefs about breast cancer, and socio-economic status (SES) on mammography adherence of these women. The traditional health belief model (HBM) was compared to a modified model which allowed for the contribution of emotions in health surveillance decision-making.
Method:
Mailed self-report questionnaires were completed by 193 women recruited from an Australian Familial Cancer Centre. Step-wise logistic regression analyses were conducted on n=150 [aged 27-89 years (M=56.9)] for whom complete data were available.
Results:
The questionnaire response rate was 36%. Higher levels of emotional representations of breast cancer were associated with greater mammography adherence (OR = 1.18, 95% CI = 1.03-1.36, p =.019). Middle income was six times more likely to predict mammography adherence than lower income (OR = 6.39, 95% CI = 1.03 – 39.63, p =.047). The modified HBM was superior to the traditional HBM in predicting mammography adherence (X2 [15, N = 118] = 26.03, p =.038).
Conclusions:
Despite a modest response rate, our data show that emotional illness representations about breast cancer and middle income status were found to significantly predict mammography adherence. Therefore, providing surveillance services and delivering information considerate of financial status and constructed around emotional motivators may facilitate mammography adherence among women like those described in this study.
INTRODUCTION
Breast cancer is the most common cancer diagnosed in women in Australia [1] with rates similar to those reported in the US of one in eight women affected in their lifetime [2]. The five year survival rate for breast cancer in developed countries is approximately 90% [3]. Women with a previous breast cancer diagnosis are however, at higher risk of a second primary breast cancer [4], so ongoing surveillance programs, including annual mammograms, are currently recommended for these women [5].
The risks of a new breast cancer diagnosis are also increased for women who carry mutations in either the BRCA1 or BRCA2 gene. A positive BRCA1/2 result is associated with an estimated 27-87% lifetime risk of developing breast cancer for unaffected women [6]. For BRCA1/2 mutation carriers with a previous diagnosis of breast cancer, the risk of developing a second primary breast cancer has been estimated between 8-68% [6]. Genetic testing for BRCA1/2 mutations provides three types of results (i) a positive result (a family-specific pathogenic BRCA1/2 mutation is identified), (ii) no mutation is detected (result that does not reveal a pathogenic BRCA1/2 mutation), and (iii) a variant of unknown clinical significance (VUCS: a variant is identified in BRCA1/2, however, it is not known whether it is pathogenic). For present purposes, both results (ii) and (iii) are referred to here as no pathogenic mutation identified (NPM).
While there are specific guidelines for screening and risk management for women who test positive for a BRCA1/2 mutation [7], formal guidelines have yet to be established for women with NPM [8]. Breast cancer screening advice given by genetic counsellors to such women is usually based on the patient’s personal family history of cancer.
There is also some evidence that, despite the presence of a family history suggesting a high risk for a second primary breast cancer, a NPM result may give some women a false sense of reassurance, potentially affecting their risk management practices [9]. As many women with a previous breast cancer diagnosis undergo BRCA1/2 testing and among these women, approximately 70% will receive a NPM result [10], it is important to investigate how these women understand and interpret this result. In addition, there are women with a previous breast cancer diagnosis who do not qualify for publicly funded genetic testing in Australia because the probability of detecting a BRCA1/2 mutation is deemed to be less than 10% [7]. These women can also be considered to have an inconclusive genetic status and understanding their interpretation of cancer risk and surveillance practice is of similar importance.
Studies of mammography adherence in women previously diagnosed with breast cancer, while limited, have repeatedly concluded that breast cancer survivors underutilize surveillance mammography [11]. Key factors found to be associated with reduced mammography surveillance amongst breast cancer survivors include greater time since completion of initial treatment [12] and older age [13, 14]. Other factors that have been implicated include regional geographic location [13, 14] and lower socio-economic status (SES) [15]. Little has been reported, however, about the mammography surveillance routines of affected BRCA1/2 carriers and among affected women with a NPM result, although it has been reported that mammography surveillance in the latter group may decline over time following testing [16]. In Australia, surveillance practices can be individually managed by the woman’s medical specialist (e.g., surgeon, oncologist), or as part of a multidisciplinary, hospital-specific gene carrier surveillance program. Regardless of whether annual surveillance mammography is arranged via hospital outpatient clinics or by private specialist, it is part of routine care. Surveillance mammograms are available at no cost to the patient when being followed up in a hospital outpatient clinic, or at a modest cost, heavily subsidised by a national health insurance program, for others. All Australians are entitled to care in the public health system. Once patients reach 5 years from diagnosis, they are selectively discharged to the care of their Primary Care Practitioner who then becomes responsible for organising surveillance imaging.
To date, no studies have examined factors associated with mammography adherence in women affected by breast cancer with either an NPM BRCA1/2 result or with an unknown (i.e., not tested) BRCA1/2 status (henceforth collectively referred to as ’inconclusive genetic cancer status’). Given that these women remain at a higher risk of a second primary breast cancer, a better understanding of the factors influencing the utilization of mammography as a health surveillance strategy is of substantial clinical importance.
Health beliefs model
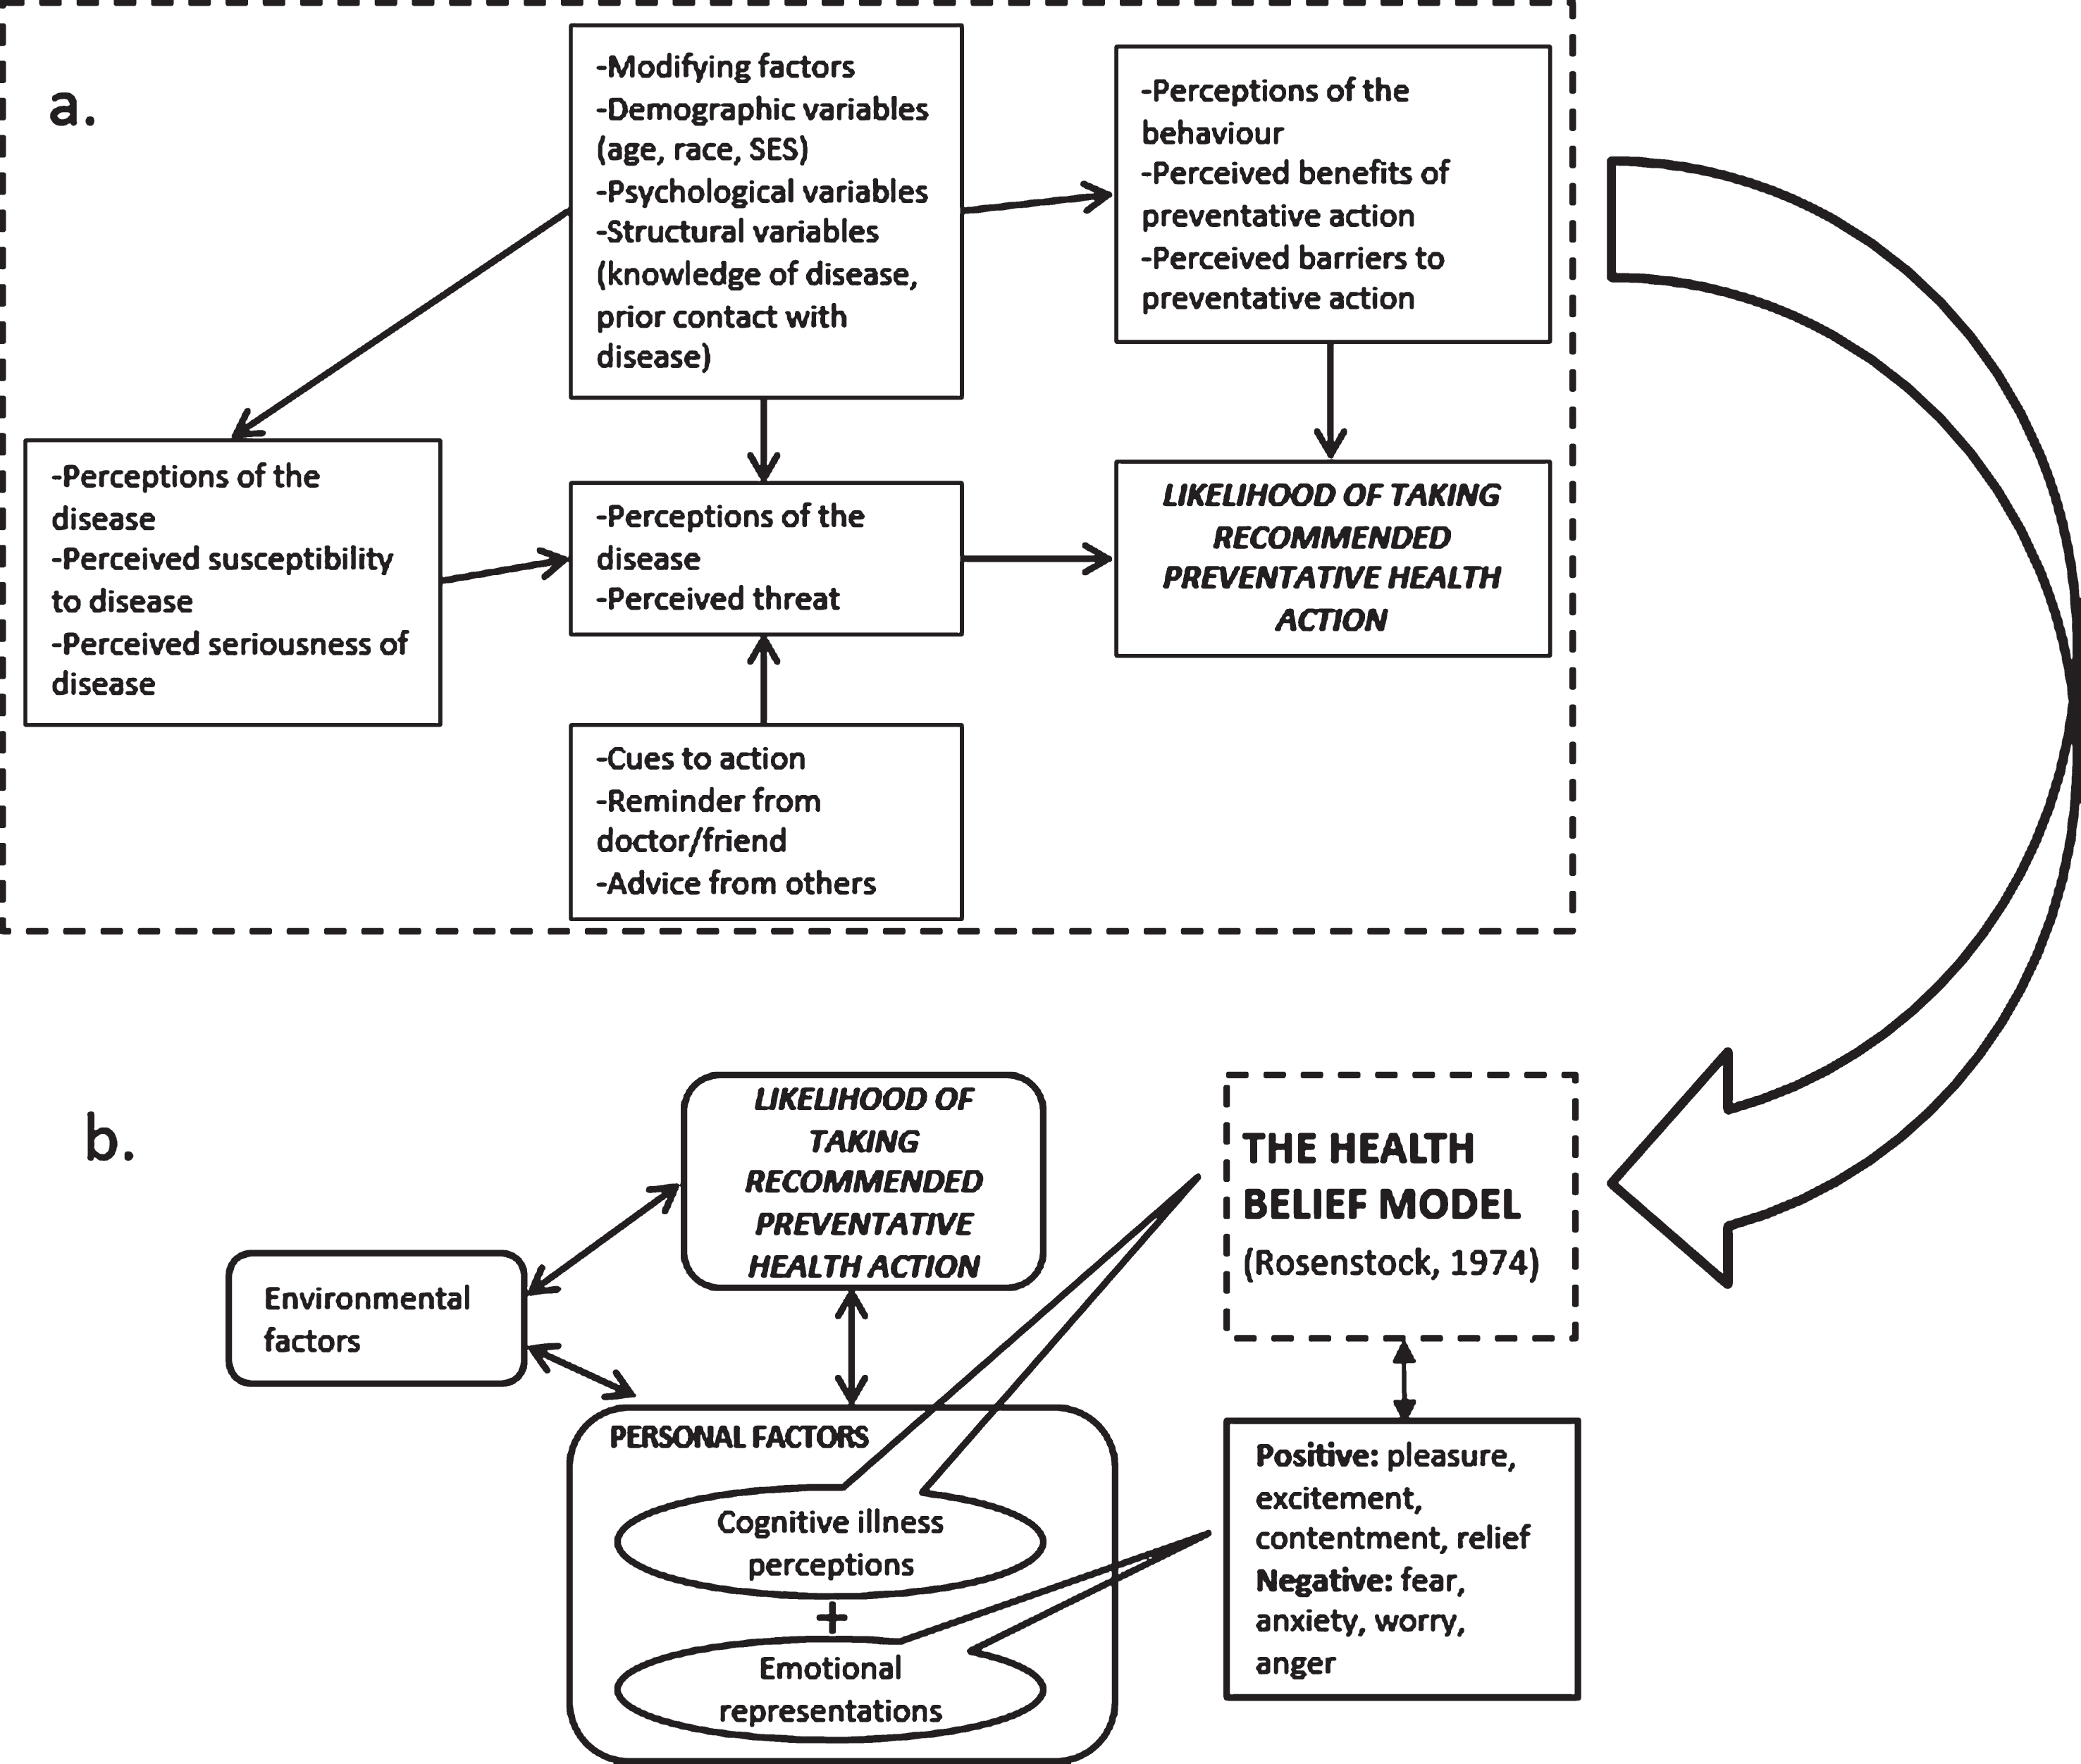
It is well established that attitudes and beliefs about health and illnesses inform health behaviours [17, 18]. Psychological models such as the Health Beliefs Model (HBM), [19] provide a framework for understanding the interactions between health beliefs and preventative behaviours. This model (Fig. 1) describes how perceptions of disease (susceptibility to disease, seriousness of disease); perceptions of behaviour (benefits of taking preventative action, and/or barriers to taking action); and cues to action (recommendations and guidelines) can interact to inform health behaviour [20]. Modifying variables in the HBM include demographics (e.g., age, SES), psychological status, and knowledge of, and previous contact with the disease. The HBM is a useful framework in which to investigate health surveillance behaviours such as mammography adherence of women affected by cancer with inconclusive genetic status.
Fig.1
a. The Health Belief Model (Adapted from Rosenstock (1974, p. 7). b. Modified Health Belief Model (cognitive illness perceptions and emotional representation) and environmental factors (Adapted from Vedanthan et al., 2014).
Previous research utilising the HBM to predict mammography screening behaviours has yielded inconsistent results. A critical review of 39 studies examining mammographic and/or pap screening reported strong support for the perceived benefits of and perceived barriers in predicting women’s preventative health behaviours [20]. However, the majority of the included studies excluded women with increased breast cancer risk. A systematic review of 10 studies investigating health-protective behaviour in women with an increased breast cancer risk within the framework of the HBM reported a clear relationship between heightened breast cancer risk perception and increased mammography screening rates [21]. Importantly, though, none of these previous studies have investigated mammography adherence within the HBM framework in affected women with NPM BRCA1/2 results or with an untested BRCA1/2 status.
Some studies examining illness beliefs have explored particular aspects of these perceptions such as: consequences, timeline, personal control, treatment cure-control and identity [22]. Given that these beliefs are clinically modifiable, perceptions of the perceived level of personal control over an illness and how well the illness can be controlled by treatments are of particular interest in the context of mammography adherence [23]. Positive beliefs about perceived personal control of breast cancer have been associated with adherence to mammography screening [24]. In the context of women with an inconclusive BRCA1/2 result, who often experience uncertainty and difficulties with decision-making about health management and negative beliefs about cancer treatment efficacy [8], the relationship between beliefs about breast cancer cure-control and adherence to mammography recommendations is not known.
Modified health beliefs model
An important criticism of the original HBM is that it is primarily a cognitive model, and therefore neglects the potential contribution of emotions in decision making [25]. Consequently, a modified HBM has been proposed (Fig. 1.) [26] in an attempt to account for the influence of emotions on behaviour [27]. These emotional illness representations include perceived level of concern about the illness and extent to which the illness affects one emotionally [28]. Emotional characteristics (self-regulation and cancer worry, for example) have been found to be positively associated with mammography screening [29]; however, it is not known whether the uncertainty that accompanies an inconclusive genetic status in women with a previous cancer diagnosis might impact such an association.
There is also a well-established association between SES, considered a modifying factor within the HBM framework, and poor health outcomes [30]. Low SES can limit access to appropriate medical treatment and engagement with recommended surveillance behaviours [31], leaving women with a personal history of breast cancer particularly vulnerable to a delayed, and more advanced, second breast cancer diagnosis [32]. Furthermore, sociocultural factors have been implicated in the disparity in engagement with genetic testing including medical mistrust and emotional representations about insurance discrimination and associated costs [33].
The aims of the present study were, therefore, to investigate among women with a previous breast cancer diagnosis who either received a NPM BRCA 1/2 test result, or were not able to undergo BRCA1/2 testing; (1) whether there was an association between cure-control illness beliefs and mammography adherence as interpreted within the HBM; (2) whether including emotional representation of illness as per the modified HBM better explained mammography adherence behaviour than the traditional HBM; and (3) if measures of SES influence the relationship between beliefs of cure-control and emotional representations and mammography adherence. It was hypothesized that (1) more negative cure-control beliefs would be associated with lower mammography adherence rates; (2) increased breast cancer concern and related emotional affect levels would be associated with increased mammography adherence; and (3) lower SES would negatively influence the relationship between cure-control beliefs and emotional representations and mammography adherence.
Method
Participants
Data were obtained as a part of a broader study into psychological and behavioural outcomes of women at high pedigree-based risk of breast and/or ovarian cancer. Participants in the current study had previously been diagnosed with breast cancer and were eligible if they had received a NPM BRCA1/2 test result (subsample A), or if they did not qualify for publically funded genetic testing due to a less than 10% probability of detecting a BRCA1/2 mutation (subsample B). As noted above, these subsamples are being collectively referred to as an ’inconclusive genetic cancer’ status. All study participants had attended a Familial Cancer Centre (FCC) and had undergone full pre-and post-test genetic counselling. The FCC process involved gathering a full 3 generation family history, verification of reported cancers relevant to hereditary cancer, and a risk assessment calculation based on statistical tool to calculate the likelihood of a BRCA1/2 mutation in a patient (BRCAPRO).
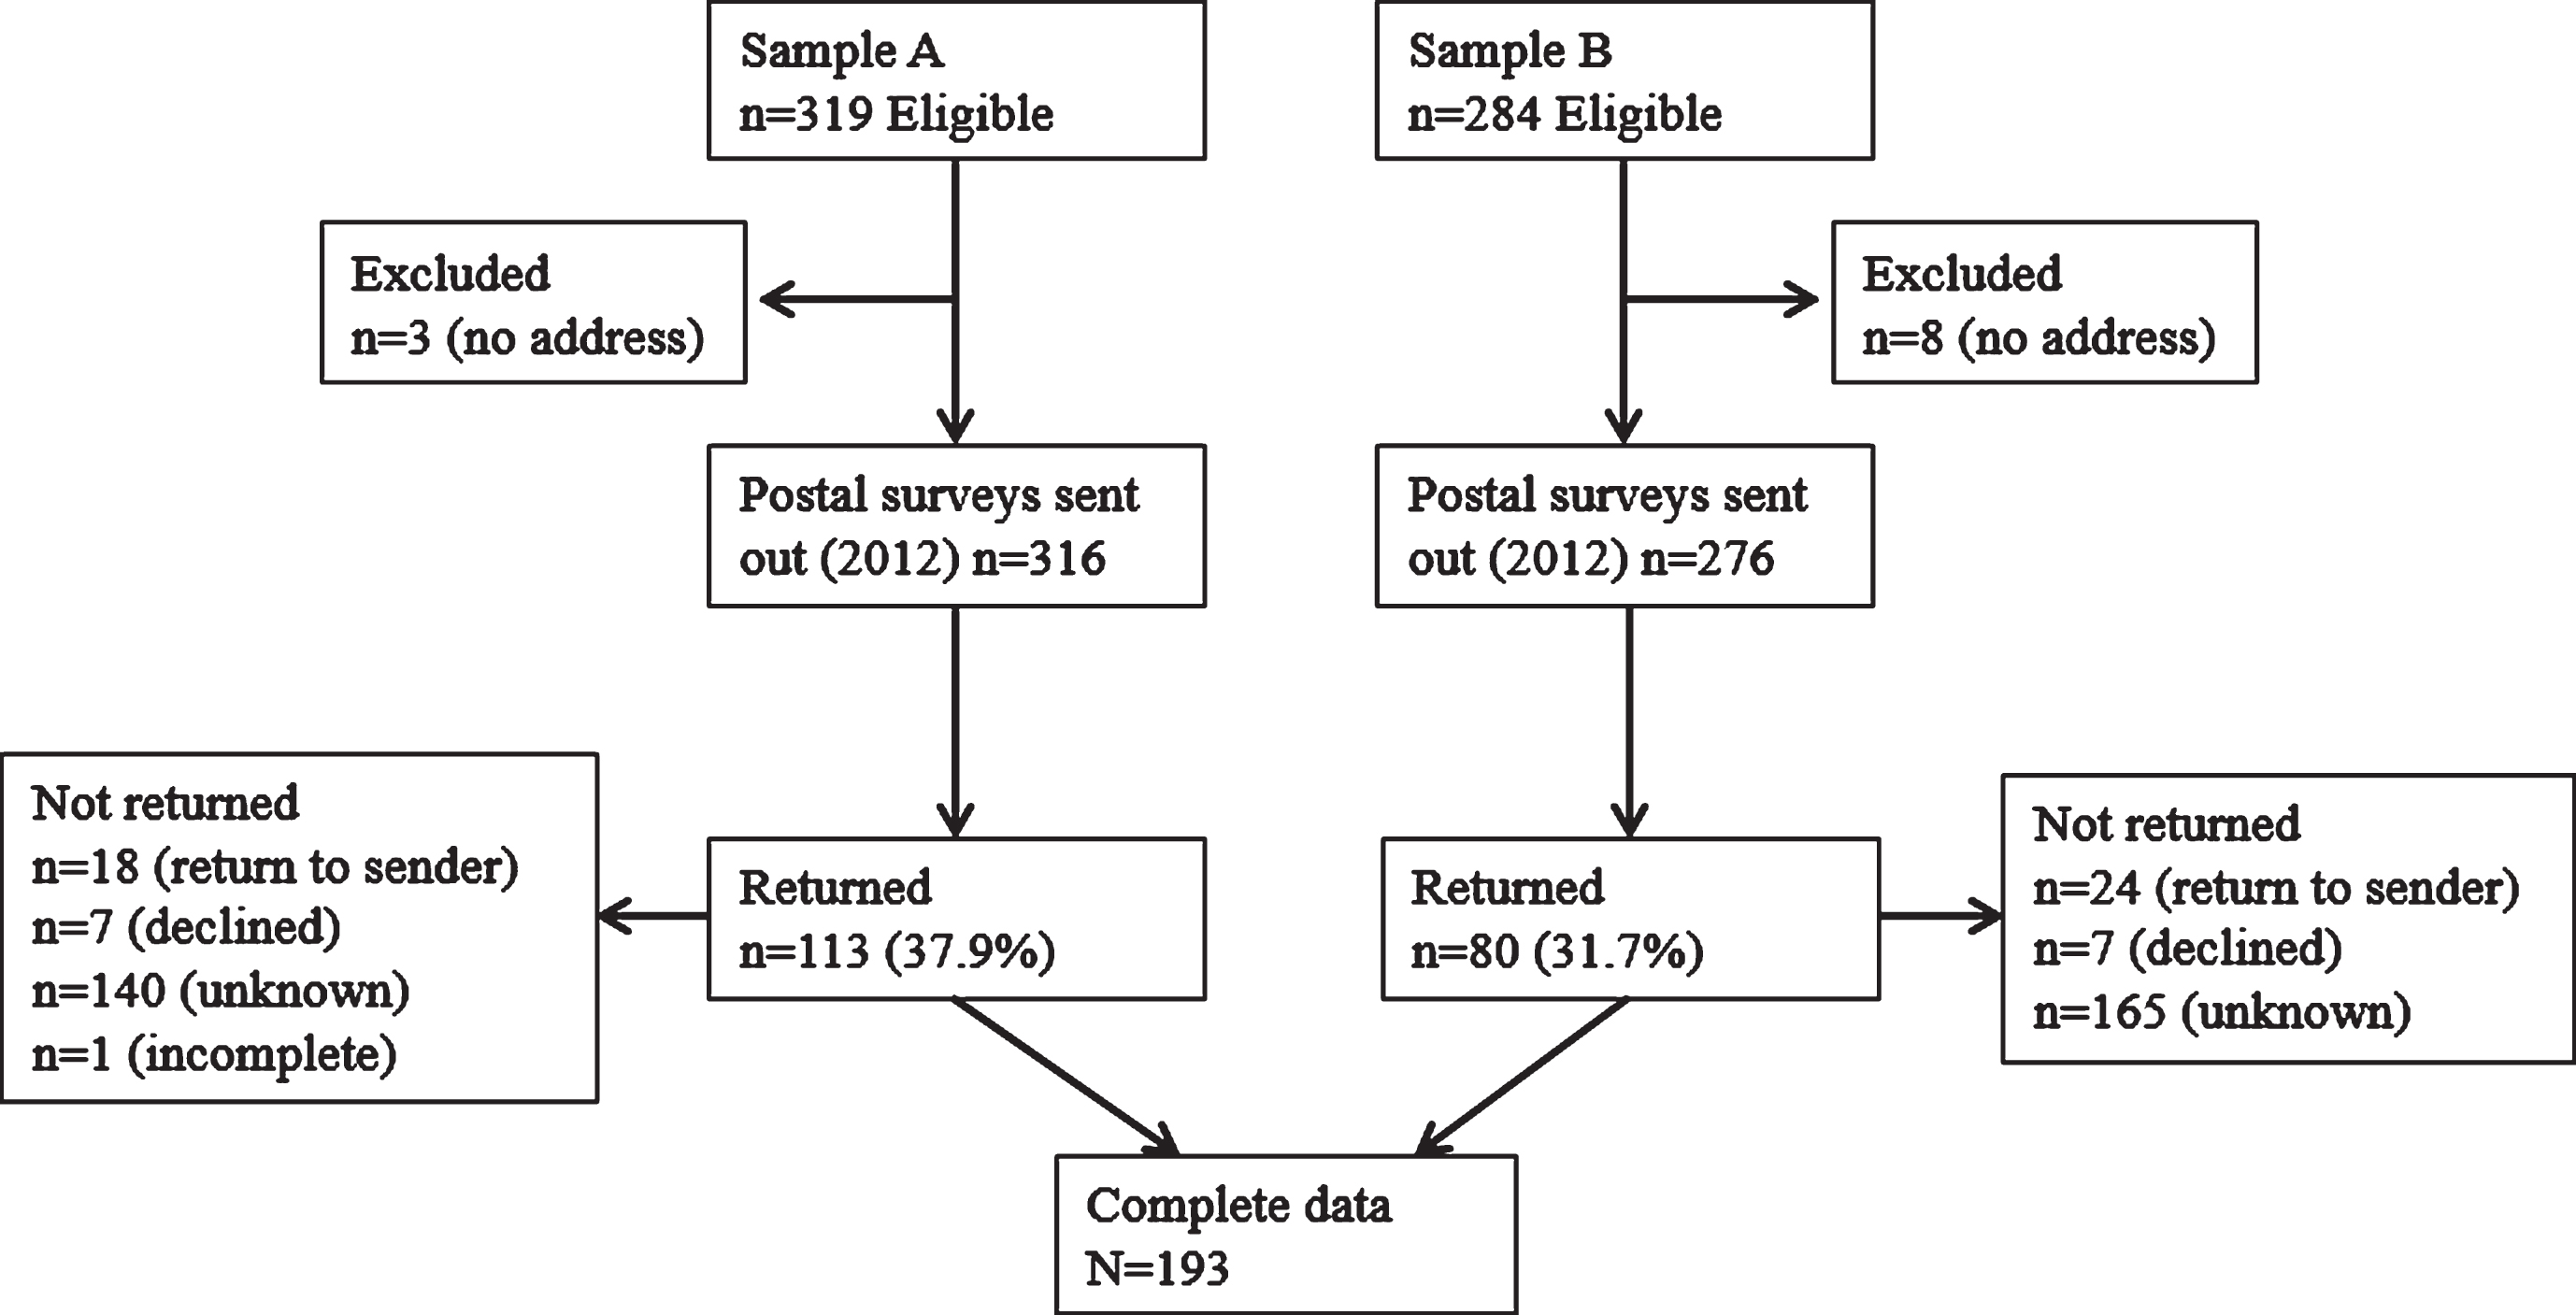
A record search was conducted of women who had attended the (FCC) of the Royal Melbourne Hospital, a large tertiary hospital institution in metropolitan Melbourne, Australia. For subsample A, FCC records from 2005 to 2010 were searched and 319 eligible women were identified; and for subsample B, FCC records from 2000 to 2010 were searched and 284 eligible women were identified (Fig. 2.). Other inclusion criteria were: being over the age of 18 years, English fluency and not suffering from a known intellectual disability or cognitive impairment that would preclude informed consent or meaningful participation.
Fig.2
Participant Recruitment Flow Diagram.
Procedure
Following initial identification via FCC records, potential participants’ details were checked with the state-wide cancer registry to determine if any of the women had since died. Study information, consent forms and self-report questionnaires were mailed to eligible women. Study information described the nature and the purpose of the study and invited women to participate by providing written informed consent, completing the questionnaire and returning it to the researchers using a reply-paid envelope. The study received institutional ethics approval (HREC No: 2010.285).
Measures
Socio-demographics
Participants completed a self-report questionnaire that included clinical and demographic information and psychological measures. Participants’ age, time since last diagnosis, residential location, education level, annual household income, and occupational status were collected. Measures of residential location, education level, annual household income, and occupational status were grouped together to represent SES in line with Shavers [34]. Residential location was differentiated between metropolitan and non-metropolitan; highest education level: up to some secondary or completed secondary school/trade certificate/vocational diploma or tertiary; Income: $0 to $41,548 or $41,549 to $83,148 or ≥$83,149; and occupational status: not in paid employment, in paid employment, or retired.
Depression
Depressive symptoms were measured using the Centre for Epidemiological Studies Depression Scale (CES-D) [35]. The CES-D has high internal consistency with Cronbach’s alpha coefficients ranging from.85 to.90 and has been recommended for use in cancer populations [36]. Higher scores represent more severe depressive symptomology with scores ≥16 considered to indicate significant symptoms of depression.
Anxiety. Anxiety symptoms were measured with the 7-item anxiety subscale (HADS-A) of the Hospital Anxiety and Depression Scale (HADS) [37]. The HADS has well established psychometric properties [38] and is recommended for use in oncology populations [39]. Higher scores represent greater symptom severity. Scores range from 0-21, with scores ≥8 indicating possible, and scores ≥11 indicating probable anxiety [38, 39].
Neuroticism. Neuroticism was measured with the 10-item Neuroticism scale of the International Personality Item Pool Five Factor Personality Inventory (IPIP) [40]. The IPIP is a public-domain alternative to major commercial inventories assessing domain constructs of the Five Factor Model of personality [41]. Responses on the Neuroticism scale are scored on a 5-point Likert-type scale with higher scores representing greater neuroticism. The IPIP-N has been shown to have strong internal consistency (Cronbach’s alpha= 0.775) and acceptable discriminate, concurrent and predictive validity [42]. Neuroticism was included as a control measure because there is a well-established association between high levels of neuroticism, subjective perceptions of mental and physical quality of life and experience of health care [43].
Risk perception. Breast cancer risk perception was measured by asking women “on a scale of 0 (no chance at all) to 100 (absolutely certain) “What do you believe your risk is of developing breast cancer (again) in your lifetime?”
Illness beliefs. Illness beliefs were measured using the Brief Illness Perception Questionnaire (B-IPQ) [28], a nine-item scale that assesses cognitive perceptions and emotional representations associated with illness. Previous research has shown the B-IPQ scale demonstrates good test-retest reliability and good predictive validity at 3 month follow up [28]. Higher scores reflect more negative beliefs. The IPQ assesses cognitive beliefs on five dimensions: consequences, timeline, personal control, treatment control, and identity; and emotional representations on two dimensions: concern and emotional affect. The present study utilized the cure and control dimensions operationalized as “How much control do you think you have over breast cancer?” and “How much do you think treatment can help breast cancer?” using a Likert scale of 0 (extreme amount of control/extremely helpful) to 10 (absolutely no control/ not at all). These single-item questions for personal control and treatment control were first reversed scored, then collapsed into a single measure, ’cure-control’ in line with previous research [23]. Emotional representations (concern and affect) were operationalized by asking participants for ratings on a scale of 0 to 10 “How concerned are you about breast cancer?” and “How much does your illness affect you emotionally? (e.g. does it make you angry, scared, upset, or depressed?)”. Scores from these two items were collapsed into a single ’emotional representations’ measure. Reliability testing showed that Cronbach’s alpha for the B-IPQ was.63.
Mammography adherence. Mammography screening adherence was measured with a single self-report question: “When was the last time you had a mammogram?” (response options were: within the last 12 months/12 to 24 months ago/more than 24 months ago). For analysis, responses were collapsed into women who reported having a mammogram within the last 12 months, and women who reported that their most recent mammogram was more than 12 months ago. This categorization is based on the Australian national breast-screening guidelines which recommend annual mammography for women with a previous breast cancer diagnosis [5]. The accuracy and validity of mammography adherence self-reporting has been described as generally high [44].
Data analysis
Data were analysed using SPSS version 23.0. Descriptive and frequency statistics were calculated for all clinical, demographic and psychological measures. Logistic regression analysis was performed to address the first aim, that is, to assess the relationship between beliefs of cure-control and health behaviour (having had a mammogram within the last 12 months) using the HBM framework (Fig. 1). Odds ratios (OR) were calculated while controlling for other modifying factors implicated in the HBM (i.e., age, time since last cancer diagnosis, depression, anxiety, neuroticism, perception of personal breast cancer risk). The second aim was to assess whether the modified HBM (Fig. 1) was a better predictor of health behaviour (having had a mammogram within the last 12 months) by including the emotional representations dimension into the previous logistic regression model. The final aim was to assess whether SES impacted the relationship between cure-control beliefs and emotional representations and mammography adherence. To evaluate their collective and individual contributions to the respective models, SES components (education, annual household income, employment status, and residential location) were added together in a single step to the previous two logistic regression models using hierarchical logistic regression.
All regression assumptions (sample size, multi-collinearity, outliers, and independence of errors) were assessed and were deemed to be satisfied [45]. The majority of missing data for the predictive and outcome variables were due to 21 participants who ’preferred not to answer’ the income question and 15 who did not complete the breast cancer risk perception question. Those who preferred not to answer the income question were excluded from the statistical analysis and missing data for breast cancer risk perception variable were replaced by the sample mean.
Human Studies and Informed Consent All procedures followed were in accordance with the ethical standards of the responsible committee on human experimentation (institutional and national) and with the Helsinki Declaration of 1975, as revised in 2000. Informed consent was obtained from all participants included in the study.
Animal Studies No animal studies were carried out by the authors for this article.
RESULTS
Study participation.
In total, 603 women met the original eligibility criteria of the larger study in which the current study is nested. These women were contacted by mail and invited to participate. Of these 603 women, 11 were excluded due to lack of recorded postal address, and consequently 316 postal packs were mailed to subsample A (women with a previous breast or ovarian cancer diagnosis and a NPM BRCA1/2 test result) and 284 were sent to subsample B (women with a previous breast cancer diagnosis but not BRCA1/2 tested as not publicly available to them) (Fig 3). A total of 193 responded (37.9% and 31.7% response rate, respectively). Of these, 10 women who indicated a primary ovarian cancer diagnosis were excluded from the present analysis and a further 33 women were excluded as they reported having undergone bilateral mastectomy. Analyses were conducted on the questionnaire data of the remaining 150 participants. Demographic and clinical characteristics are presented in Table 1.
Table 1
Socio-demographic, psychological and clinical variables of participants (N=150)
| Subsample A (n=84) | Subsample B (n= 66) | Total Sample (n=150) | Total sample range | |
| Age, M (SD) [n] | 54.8 (13.2) [84] | 59.6 (10.6) [66] | 56.9 (12.3) [150] | 27.4 - 88.5 |
| CES-D, M (SD) [n] | 8.1 (7.6) [83] | 11.4 (10.6) [66] | 9.6 (9.2) [149] | 0 - 46 |
| HADS-A, M (SD) [n] | 12.9 (1.8) [83] | 13.2 (1.9) [66] | 13.1 (1.9) [149] | 9.8 - 16 |
| IPIP-N, M (SD) [n] | 21.8 (7.6) [82] | 22.6 (8.5) [66] | 22.2 (8.0) [148] | 10 - 50 |
| B-IPQ Cure-control1, M (SD) [n] | 8.2 (3.3) [79] | 8.8 (3.7) [65] | 5.7 (3.1) [149] | 0 - 20 |
| B-IPQ Emotional representations2, M (SD) [n] | 10.2 (5.5) [81] | 10.1 (5.4) [65] | 8.5 (3.5) 144] | 0 - 20 |
| Breast cancer risk perception3, M (SD) [n] | 44.6 (28.6) [84] | 45.4 (25.6) [66] | 45.2 (28.7) [135] | 0 - 100 |
| Time since diagnosis (years), M (SD) [n] | 7.5 (7.5) [81] | 6.7 (6.3) [66] | 7.1 (7.0) [147] | 0 - 32 |
| Mammography adherence4 | ||||
| Within the last 12 mths, n (%) | 69 (46.0) | 52 (34.7) | 121 (80.7) | |
| 12 to 24 mths ago, n (%) | 6 (7.1) | 5 (7.6) | 11 (7.3) | |
| Greater than 24 mths ago, n (%) | 8 (9.5) | 8 (12.1) | 16 (10.7) | |
| Missing, n (%) | 1 (1.2) | 1 (1.5) | 2 (1.3) | |
| Residential location | ||||
| Non-metropolitan, n (%) | 35 (23.3) | 34 (22.7) | 69 (46.0) | |
| Metropolitan, n (%) | 49 (32.7) | 31 (20.7) | 80 (53.3) | |
| Missing, n (%) | 1 (1.5) | 1 (0.7) | ||
| Highest level of education | ||||
| Up to some secondary, n (%) | 27 (18.0) | 20 (13.3) | 47 (31.3) | |
| Completed secondary / Trade Cert/ Vocational Diploma, n (%) | 30 (15.3) | 25 (16.7) | 55 (36.7) | |
| Tertiary, n (%) | 27 (18.0) | 20 (13.3) | 47 (31.3) | |
| Missing, n (%) | 1 (1.5) | 1 (0.7) | ||
| Annual household income (AU $) | ||||
| $0 to $41,548, n (%) | 23 (15.3) | 28 (18.7) | 51 (34.0) | |
| $41,549 to $83,418, n (%) | 21 (14.0) | 19 (12.7) | 40 (26.7) | |
| $83,149+, n (%) | 22 (14.7) | 13 (8.7) | 35 (23.3) | |
| Preferred not to answer5, n (%) | 16 (10.7) | 5 (3.3) | 21 (14.0) | |
| Missing, n (%) | 2 (2.4) | 1 (1.5) | 3 (2.0) | |
| Employment status | ||||
| Not in paid employment, n (%) | 20 (13.3) | 24 (16.0) | 44 (29.3) | |
| In paid employment, n (%) | 43 (28.7) | 31 (20.7) | 74 (49.3) | |
| Retired, n (%) | 18 (12.0) | 10 (6.7) | 28 (18.7) | |
| Missing, n (%) | 3 (3.6) | 1 (1.5) | 4 (2.7) |
Sample A: Women with a previous breast and/or ovarian cancer diagnosis and an inconclusive BRCA1/2 test result. Sample B: Women with a previous breast and/or ovarian cancer diagnosis of an unknown BRCA1/2 status. 1B-IPQ personal control and treatment control items combined. 2B-IPQ concern and emotional items combined. 3Missing data replaced by the sample mean. 4For analysis, mammography adherence was dichotomised into less than 12 months since last mammogram and greater than 12 months since last mammogram to simplify interpretation. 5Preferred not to answer on the income question was treated as missing data from all analyses. Abbreviations: CESD: Centre for Epidemiologic Study Depression Scale, HADS-A: Hospital anxiety and Depression Scale-Anxiety, IPIP-N: International Item Pool Five Factor Inventory-Neuroticism, B-IPQ: Brief Illness Perception Questionnaire, Cert: Certificate, Mths: Months.
Characteristics of the sample
The mean age of the women in subsample A was 54.82 years (SD = 12.34) and subsample B, 59.55 (SD = 10.63), and the average time since their most recent cancer diagnosis was 7.51 years (SD = 7.53) and 6.67 (SD = 6.25), respectively. The average depression (CES-D) scores in subsamples A and B were 8.10 (SD = 7.62) and 11.38 (SD = 10.55), respectively, both well below the clinical threshold of 16. The average anxiety (HADS-A) score in subsamples A and B were 12.94 (SD = 1.83) and 13.18 (SD = 1.90), respectively, both above the clinical threshold of 11 for identifying probable cases. The average level of neuroticism (IPIP-N) in subsamples A was found to be 21.79 (SD = 7.55), and 22.58 (SD = 8.47) for subsample B, and the average score for perceived risk of developing breast cancer again (range 0 to 100) was 44.55 (SD = 28.61) and 45.39 (SD = 25.55) respectively. In relation to illness beliefs: of a possible total score of 20, on average the women in subsample A scored 8.23 (SD = 3.34) on the cure-control dimension and 10.17 (SD = 5.52) on the emotional representations dimension; and the women in subsample B scored 8.75 (SD = 3.67) and 10.05 (SD = 5.41) in these scales, respectively. Lastly, the majority of the women reported having a mammogram within the last 12 months (subsample A: 82.1%, n = 69 [out of 84], subsample B: 78.8%, n = 52 [out of 66]), leaving 16.6% (n = 14) of subsample A, and 19.7% (n = 13) of subsample B indicating their last mammogram was more than 12 months ago. There were no significant difference between subsample A and B on any of the above characteristics.
Logistic regression analysis
Traditional HBM framework (Table 2.). To assess the relationship between beliefs of cure-control and health behaviour (having had a mammogram within the last 12 months) using the traditional HBM framework, the variables of cure-control beliefs and SES were entered into Block 1, Step 1 of a logistic regression analysis. The potential confounding variables of demographic (age), psychological (depression, anxiety, neuroticism, perceived risk of developing breast cancer again) and clinical (time since last diagnosis) factors were entered simultaneously in the same block. The Block 1 model was not statistically significant, X2 (7, N =118) = 12.39, p =.088. The SES component variables of residential location, education, income, and employment status were then entered in Step 2 as Block 2. The SES block did not make a statistically significant contribution to the model, X2 (7, N = 118) = 7.48, p =.381. The overall model (Blocks 1 & 2) was not non-significant, X2 (14, N =118) = 19.87, p =.134.
Table 2
Summary of hierarchical logistic regression analyses for predictors in relation to having had a mammogram within the last 12 months as per the HBM framework (N=118)
| Traditional HBM Framework | Block 1 | Block 2 | |||||
| Step | Predictor | OR | 95% C.I. | p | OR | 95% C.I. | p |
| 1 | Age | 1.00 | 0.96 - 1.04 | 0.983 | 1.03 | 0.97 - 1.10 | 0.295 |
| CEDS | 0.94 | 0.88 - 1.00 | 0.053 | 0.96 | 0.89 - 1.04 | 0.293 | |
| HADS-A | 1.20 | 0.85 - 1.69 | 0.293 | 1.09 | 0.75 - 1.57 | 0.668 | |
| IPIP-N | 0.96 | 0.89 - 1.03 | 0.269 | 0.95 | 0.88 - 1.03 | 0.246 | |
| Personal breast cancer risk perception | 1.01 | 0.99 - 1.03 | 0.260 | 1.01 | 0.99 - 1.03 | 0.408 | |
| B-IPQ Cure-control1 | 1.14 | 0.97 - 1.34 | 0.119 | 1.18 | 0.99 - 1.40 | 0.059 | |
| Time since last diagnosis (yrs) | 1.03 | 0.96 - 1.12 | 0.384 | 1.03 | 0.95 - 1.12 | 0.464 | |
| 2 | Socioeconomic status | ||||||
| Residential location | |||||||
| Metro | 1.95 | 0.65 - 5.85 | 0.235 | ||||
| Highest level of education | |||||||
| Completed secondary/Trade Cert/Vocational Diploma | 0.94 | 0.24 - 3.66 | 0.927 | ||||
| Tertiary | 2.71 | 0.49 - 14.94 | 0.253 | ||||
| Income (AU $) | |||||||
| $41,549 to $83,418 | 4.45 | 0.80 - 24.85 | 0.089 | ||||
| $83,149+ | 1.11 | 0.20 - 6.09 | 0.908 | ||||
| Occupation | |||||||
| In paid employment | 1.40 | 0.32 - 6.21 | 0.655 | ||||
| Retired | 1.65 | 0.29 - 9.28 | 0.573 | ||||
*P<.05; 1 B-IPQ personal control and treatment control items combined; Abbreviations: CESD: Centre for Epidemiologic Study Depression Scale, HADS-A: Hospital anxiety and Depression Scale-Anxiety, IPIP-N: International Item Pool Five Factor Inventory-Neuroticism, B-IPQ: Brief Illness Perception Questionnaire, yrs: years; Reference category for residential location is Non-metro; for level of education is Up to some secondary; for household income is Up to $41,548 AU, and for employments status is Not in paid employment.
Modified HBM framework (Table 3.). To determine if emotional representation of illness better explained health behaviour using the modified HBM framework, the variables of emotional illness representations, cure-control beliefs age, depression, anxiety, neuroticism, time since last diagnosis, and perceived risk of developing breast cancer again were entered in Step 1 as Block 1. The Block 1 model was found to be statistically significant, X2 (8, N = 118) = 16.80, p =.032 and explained between 13.4% (Cox & Snell R Square) and 21.3% (Nagelkerke R Square) of the variance in mammography adherence, correctly classifying 82.9% of cases. The SES component variables of residential location, education, income, and employment status were entered in Step 2 as Block 2. The overall model (Blocks 1 & 2) was significant, X2 (15, N = 118) = 26.03, p =.038, explaining between 19.9% (Cox & Snell R Square) and 31.7% (Nagelkerke R Square) of the variance in mammography behaviour, and correctly classified 82.1% of cases. However the SES block did not make a statistically significant contribution to the overall model, X2 (7, N = 118) = 9.23, p =.236. Table 2 shows the results of the logistic regression analyses assessing the performance of the traditional HBM and the modified HBM in predicting woman having had a mammography in the previous 12 months.
Table 3
Summary of hierarchical logistic regression analyses for predictors in relation to having had a mammogram within the last 12 months as per the modified HBM framework (N=117)
| Modified HBM Framework | Block 1 | Block 2 | |||||
| Step | Predictor | OR | 95% C.I. | p | OR | 95% C.I. | p |
| 1 | Age | 1.01 | 0.97 - 1.05 | 0.760 | 1.05 | 0.98 - 1.13 | 0.142 |
| CEDS | 0.93 | 0.87 - 0.99 | 0.033 | 0.96 | 0.88 - 1.04 | 0.320 | |
| HADS-A | 1.16 | 0.81 - 1.65 | 0.426 | 1.01 | 0.68 - 1.50 | 0.971 | |
| IPIP-N | 0.93 | 0.86 - 1.01 | 0.102 | 0.91 | 0.82 - 1.00 | 0.057 | |
| Personal breast cancer risk perception | 1.01 | 0.99 - 1.03 | 0.471 | 1.00 | 0.98 - 1.03 | 0.745 | |
| B-IPQ Cure-control1 | 1.09 | 0.92 - 1.28 | 0.343 | 1.13 | 0.95 - 1.34 | 0.175 | |
| B-IPQ Emotional representations2 | 1.14 | 1.00 - 1.29 | 0.043* | 1.18 | 1.03 - 1.36 | 0.019* | |
| Time since last diagnosis (yrs) | 1.04 | 0.96 – 1.13 | 0.292 | 1.05 | 0.96 – 1.15 | 0.283 | |
| 2 | Socioeconomic status | ||||||
| Residential location | |||||||
| Metropolitan | 2.05 | 0.65 - 6.47 | 0.219 | ||||
| Highest level of education | |||||||
| Completed secondary/Trade Cert/Vocational Diploma | 0.71 | 0.16 - 3.12 | 0.652 | ||||
| Tertiary | 1.96 | 0.34 - 11.36 | 0.454 | ||||
| Income (AU $) | |||||||
| $41,549 to $83,418 | 6.39 | 1.03 – 39.63 | 0.047* | ||||
| $83,149+ | 1.74 | 0.29 – 10.62 | 0.549 | ||||
| Occupation | |||||||
| In paid employment | 2.10 | 0.43 – 10.35 | 0.363 | ||||
| Retired | 2.56 | 0.41 – 16.06 | 0.316 | ||||
*P<0.05; 2B-IPQ concern and emotional items combined; 1B-IPQ personal control and treatment control items combined; Abbreviations: CESD: Centre for Epidemiologic Study Depression Scale, HADS-A: Hospital anxiety and Depression Scale-Anxiety, IPIP-N: International Item Pool Five Factor Inventory-Neuroticism, B-IPQ: Brief Illness Perception Questionnaire, yrs: years; Reference category for residential location is Non-metropolitan; for level of education is Up to some secondary; for household income is Up to $41,548 AU, and for employments status is Not in paid employment.
In the final model, two independent variables, emotional representations (OR = 1.18; 95% CI = 1.03 – 1.36, p =.019) and income (OR = 6.39; 95% CI = 1.03 – 39.63, p =.047), were found to significantly predict women having had a mammogram within the last 12 months. Specifically, a single unit increase in breast cancer related emotional representation score resulted in an 18% increase in mammography adherence likelihood and women with an annual household income in the AU$41,549 - $83,418 bracket were over six times more likely to have had a mammogram within the last 12 months compared to women with an annual household income of less than AU$41, 548 (the reference category). While middle income (AU$41,549 - $83,418) significantly predicted having had a mammogram within the last 12 months when compared to low income, SES on the whole was not significantly associated with mammography behaviour.
Discussion
The primary aim of the present study was to assess the impact of illness beliefs, specifically those relating to cure-control and emotional representations of breast cancer, and SES on mammography behaviour in women with a previous breast cancer diagnosis and an inconclusive genetic cancer status (women with either a NMP BRCA1/2 result or not BRCA1/2 tested). The results indicated that higher levels of emotional representations about breast cancer (i.e. more emotional affect and more concern about the diagnosis) resulted in women being more likely to have had a mammogram within the last 12 months. In addition, middle income level over lower income was also found to predict women having had a mammogram within the last 12 months, however, SES measures on the whole were not found to significantly impact mammography behaviour. The modified HBM which allows for the contribution of emotions in decision making was superior to the traditional HBM in predicting mammography within the last 12 months. Unlike previous research, psychological factors such as depression, and anxiety, time since diagnosis and self-perceived breast cancer risk were not found to predict mammography behaviour [20]. These results provide insight into which cognitive and emotional illness representations might be most influential in motivating adherence to breast cancer screening recommendations and highlights the barrier of low income in adhering to a recommended preventative health action, in this case, an annual mammogram.
The finding that emotional representations of illness predicted mammography behaviour over cure-control beliefs is consistent with other reports [46]. For example, among studies that included women at an increased risk of developing cancer due to family history of breast cancer, worry about cancer facilitated mammography adherence [47], and increased concern about breast cancer increased mammography screening intentions and behaviour [48]. However, with regard to women with a breast cancer diagnosis, it has been reported that denial facilitated symptomatic women to delay breast cancer screening [49]. Consequently, it seems that not all emotional representations result in more positive health actions and it is important to identify and target those emotions that will improve mammography adherence. Distinguishing between different types of emotional illness representations seems particularly relevant in women with an inconclusive genetic cancer status, as uncertainty might heighten the risk of denial about personal risk, which may in turn negatively impact mammography adherence.
It is of interest that SES collectively, did not significantly influence mammography behaviour in this study sample. This is inconsistent with previous research that has reported that low SES is a barrier to mammography screening [50]. The predictive value of middle income over lower income in determining mammography adherence is consistent with other work showing significant reductions in mammography rates in relation to low-income status [51]. It is notable that the majority of this research was conducted in the general population rather than in high-risk women like those in the present study. It appears, then, that high risk women may face the same obstacles of access to mammography despite being identified as being at a greater risk.
Other studies have implicated other components of SES in relation to reduced mammography screening behaviours, for example, being unemployed or not in paid employment [52], and education level [53]. One review concluded that, overall, lower levels of education were most strongly associated with mammography screening behaviour [31]. Another study, which examined stage of breast cancer at diagnosis in New Zealand women [32], also reported significant differences in relation to SES. However, their SES measure was a combined socio-economic deprivation scale based on nine socio-economic variables making it impossible to discern which of the nine SES variables might be major contributing factors. Such findings highlight the lack of consistency in SES measurement in the literature [54] which limits the generalizability of research outcomes. Still, the current study is unique in examining the impact of SES on mammography adherence in women with a previous breast cancer diagnosis and an inconclusive genetic cancer status. Further, by entering the SES measures as a single block representing overall SES, individual interactions between the four domains of SES included in this study could be examined. This is a novel contribution to the literature as previous studies have often relied on a single indicator of SES which does not provide for any insight into the complexity and multifaceted nature of SES.
We acknowledge a number of limitations. From a clinical perspective, the severity of the original breast cancer may have affected women’s subsequent mammography behaviour, based on their subjective perception of extent of disease, however, such information was not available for the present analysis. We note though that clinical features such as nodal status would not alter recommendations for surveillance, which are a routine part of care in the Australian system. It is also possible that some women had subsequently developed systemic disease at which time screening for a second breast cancer becomes less important. These data are not available but given that the average time between diagnosis and completion of the survey was 7.5 years, it is unlikely that a substantial proportion of women in our study were affected by metastatic disease. It is also possible that some women may have relaxed the frequency of mammography given this time lapse since diagnosis. While it cannot be confirmed that mammography costs were entirely covered by the public health system, financial barriers are unlikely to contribute to our findings because in Australia, surveillance mammograms are free or heavily subsidised by national health insurance programs. In addition, there may be other individual factors influencing mammography behaviour that were not captured in these data. We also did not include the data from women who ’preferred not to answer’ the annual household income question and there is a possibility that those who chose not to answer were the most disadvantaged. It is well-established that lower SES is associated with less participation in research [55] and this has implications for the generalizability of our data. We acknowledge other limitations on the generalizability of the data based on the response rate. Subsample A had a response rate of 39.9% and subsample B 31.7% and a number of identified eligible participants could not be successfully contacted as either no address could be found or their postal packs were returned to sender. Responses were not received from 62.1% of women from subsample A and 68.3% from subsample B for unknown reasons. Non-response rates to survey research continue to rise [56] affecting the accuracy of estimates drawn from these data [57]. In our centre, a major tertiary facility in metropolitan Australia, a response rate of 30% is standard for mailed surveys of a psychosocial nature. Clearly, it is important to identify methods to increase response to survey research of this type and some have suggested monetary incentives [58]. Other strategies to improve survey response rates in the future might include use of shorter questionnaires, posting a second questionnaire or making follow-up telephone calls, if possible. In the current study, the questionnaire was very lengthy (40 pages) and follow-up questionnaires and phone calls were not approved by the local institutional review board. Given the retrospective, cross-sectional nature of the study, causality cannot be inferred from these results. Lastly, mammography adherence was determined by self-report which may be susceptible to over-reporting or under-reporting.
CONCLUSION
Understanding the psychosocial aspects of women at high risk of breast cancer but without a definitive genetic cancer diagnosis is an understudied area deserving of greater scrutiny. Despite its limitations, this study provides important insights into the predictive power of emotional appraisals of breast cancer, over and above beliefs about the extent to which the disease can be cured or controlled, in relation to mammography behaviour. To assist women at higher risk of a future breast cancer diagnosis who are of an inconclusive genetic cancer status (NPM BRCA1/2 test outcome or not BRCA1/2 tested) adhere to mammography guidelines, delivery of information and provision of services could be constructed around appropriate emotional motivators, concern about and emotional impact of cancer. The findings can also be used to inform public health advertising and information to better engage lower income women in mammography adherence.
ACKNOWLEDGMENTS
The authors confirm that this manuscript has been submitted solely to this journal and has not been published elsewhere. The authors thank the Collier Charitable Trust for their generous contribution towards funding this work.
CONFLICT OF INTEREST
The authors declare that they have no conflicts of interest.
REFERENCES
[1] | Cancer.org.au [Internet]. Cancer Council Australia [cited 2018 Apr 26]. Available from: https://www.cancer.org.au/about-cancer/types-of-cancer/breast-cancer/ |
[2] | Tao Z , Shi A , Lu C , Song T , Zhang Z , Zhao J. Breast cancer: epidemiology and etiology. Cell Biochem Biophys. (2015) ;72: (2):333–8. |
[3] | Miller KD , Siegel RL , Lin CC , Mariotto AB , Kramer JL , Rowland JH , et al. Cancer treatment and survivorship statistics, 2016. CA Cancer J Clin. (2016) ;66: (4):271–89. |
[4] | Bcna.org.au [Internet]. Risk factors | Breast Cancer Network Australia [Accessed 26 Apr. 2018]. Available at: https://www.bcna.org.au/breast-health-awareness/risk-factors/ [cited 2018 Apr 26]. |
[5] | Breastscreen.org.au [Internet]. Women with a previous diagnosis of breast cancer | BreastScreen Victoria [updated 2015 Jul; cited 2018 Apr 26]. Available at: https://www.breastscreen.org.au/PDFs/BSV_Past_History_A4_Fact_Sheet_July_2015_V4_WEB.aspx |
[6] | Kuchenbaecker KB , Hopper JL , Barnes DR , Phillips K-A , Mooij TM , Roos-Blom M-J , et al. Risks of breast, ovarian, and contralateral breast cancer for BRCA1 and BRCA2 mutation carriers. JAMA. (2017) ;317: (23):2402–16. |
[7] | Eviq.org.au [Internet]. Referral guidelines | eviQ [cited 2018 Apr 26]. Available at: https://www.eviq.org.au/cancer-genetics/referral-guidelines [Accessed 26 Apr. 2018]. |
[8] | Ardern-Jones A , Kenen R , Lynch E , Doherty R , Eeles R. Is no news good news? Inconclusive genetic test results in BRCA1 and BRCA2 from patients and professionals' perspectives. Hered Cancer Clin Pract. (2010) ;8: (1):1. |
[9] | Dorval M , Gauthier G , Maunsell E , Simard J , editors. Are women with an inconclusive BRCA1/2 genetic test result falsely reassured? Psychooncology; (2003) :124: (4 Suppl). |
[10] | Hanoch Y , Miron Shatz T , Rolison JJ , Ozanne E. Understanding of BRCA1/2 genetic tests results: the importance of objective and subjective numeracy. Psychooncology. (2014) ;23: (10):1142–8. |
[11] | Geller BM , Kerlikowske K , Carney PA , Abraham LA , Yankaskas BC , Taplin SH , et al. Mammography surveillance following breast cancer. Breast Cancer Res Treat. (2003) ;81: (2):107–15. |
[12] | Doubeni CA , Field TS , Ulcickas Yood M , Rolnick SJ , Quessenberry CP , Fouayzi H , et al. Patterns and predictors of mammography utilization among breast cancer survivors. Cancer. (2006) ;106: (11):2482–8. |
[13] | Keating NL , Landrum MB , Guadagnoli E , Winer EP , Ayanian JZ. Factors related to underuse of surveillance mammography among breast cancer survivors. Journal of Clinical Oncology. (2006) ;24: (1):85–94. |
[14] | Shelby RA , Scipio CD , Somers TJ , Soo MS , Weinfurt KP , Keefe FJ. Prospective study of factors predicting adherence to surveillance mammography in women treated for breast cancer. J Clin Oncol. (2012) ;30: (8):813. |
[15] | Giuliani O , Mancini S , Puliti D , Caranci N , Ravaioli A , Vattiato R , et al. Patterns and determinants of receipt of follow-up mammography and/or clinical examination in a cohort of Italian breast cancer survivors. Breast Cancer Res Treat. (2016) ;158: (3):543–51. |
[16] | Garcia C , Lyon L , Littell RD , Powell CB. Comparison of risk management strategies between women testing positive for a BRCA variant of unknown significance and women with known BRCA deleterious mutations. Genet Med. (2014) ;16: (12):896. |
[17] | Champion VL , Skinner CS. The Health Belief Model. In: GlanzK , RimerBK , ViswanathK editors. Health Behavior and Health Education – Theory, Research and Practice. 4th Ed. San Francisco, CA: John Wiley & Sons, Inc.; (2008) . |
[18] | Petrie KJ , Weinman J. Patients’ perceptions of their illness: The dynamo of volition in health care. Curr Dir Psychol Sci. (2012) ;21: (1):60–5. |
[19] | Rosenstock IM. Historical origins of the health belief model. Health Educ Monogr. (1974) ;2: (4):328–35. |
[20] | Tanner-Smith EE , Brown TN. Evaluating the Health Belief Model: A critical review of studies predicting mammographic and pap screening. Soc Theory Health. (2010) ;8: (1):95–125. |
[21] | Paalosalo Harris K , Skirton H. Mixed method systematic review: the relationship between breast cancer risk perception and health protective behaviour in women with family history of breast cancer. J Adv Nurs. (2017) ;73: (4): 760–74. |
[22] | Leventhal H , Nerenz D , Steele D. Illness representations and coping with health threats. In: BaumA , TaylorSE , SingerJE , editors Handbook of psychology and health. Hillsdale NJ: Erlbaum; (1984) . p. 219–252 |
[23] | Petrie K , Weinman J. Why illness perceptions matter. Clin Med. (2006) ;6: (6):536–9. |
[24] | Griva F , Anagnostopoulos F , Madoglou S. Mammography screening and the theory of planned behavior: suggestions toward an extended model of prediction. Women Health. (2010) ;49: (8):662–81. |
[25] | Henshaw EJ , Freedman Doan CR. Conceptualizing mental health care utilization using the health belief model. Clin Psycol-Sci Pr. (2009) ;16: (4):420–39. |
[26] | Vedanthan R , Kamano JH , Naanyu V , Delong AK , Were MC , Finkelstein EA , et al. Optimizing linkage and retention to hypertension care in rural Kenya (LARK hypertension study): study protocol for a randomized controlled trial. Trials. (2014) ;15: (1):143. |
[27] | Baumeister RF , Vohs KD , Nathan DeWall C , Zhang L. How emotion shapes behavior: Feedback, anticipation, and reflection, rather than direct causation. Pers Soc Psychol Rev. (2007) ;11: (2):167–203. |
[28] | Broadbent E , Petrie KJ , Main J , Weinman J. The brief illness perception questionnaire. J Psychosom Res. (2006) ;60: (6):631–7. |
[29] | Consedine NS , Magai C , Neugut AI. The contribution of emotional characteristics to breast cancer screening among women from six ethnic groups. Prev Med. (2004) ;38: (1):64–77. |
[30] | Mackenbach JP , Stirbu I , Roskam A-JR , Schaap MM , Menvielle G , Leinsalu M , et al. Socioeconomic inequalities in health in 22 European countries. N Engl J Med. (2008) ;358: (23):2468–81. |
[31] | Edgar L , Glackin M , Hughes C , Mary K , Rogers A. Factors influencing participation in breast cancer screening. Br J Nurs. (2013) ;22: (17). |
[32] | Seneviratne S , Lawrenson R , Harvey V , Ramsaroop R , Elwood M , Scott N , et al. Stage of breast cancer at diagnosis in New Zealand: impacts of socio-demographic factors, breast cancer screening and biology. BMC Cancer. (2016) ;16: (1):129. |
[33] | Sheppard VB , Mays D , LaVeist T , Tercyak KP. Medical mistrust and self-efficacy influence Black women's level of engagement in BRCA1/2 genetic counseling and testing. J Natl Med. (2013) ;105: (1):17. |
[34] | Shavers VL. Measurement of socioeconomic status in health disparities research. J Natl Med. (2007) ;99: (9):1013. |
[35] | Radloff LS. The CES-D scale: A self-report depression scale for research in the general population. Appl Psychol Meas. (1977) ;1: (3):385–401. |
[36] | Hann D , Winter K , Jacobsen P. Measurement of depressive symptoms in cancer patients: evaluation of the Center for Epidemiological Studies Depression Scale (CES-D). Journal Psychosom Res. (1999) ;46: (5):437–43. |
[37] | Zigmond AS , Snaith RP. The hospital anxiety and depression scale. Acta Psychiatr Scand. (1983) ;67: (6):361–70. |
[38] | Bjelland I , Dahl AA , Haug TT , Neckelmann D. The validity of the Hospital Anxiety and Depression Scale: an updated literature review. J Psychosom Res. (2002) ;52: (2): 69–77. |
[39] | Singer S , Kuhnt S , Götze H , Hauss J , Hinz A , Liebmann A , et al. Hospital anxiety and depression scale cutoff scores for cancer patients in acute care. Br J Cancer. (2009) ; 100: (6):908. |
[40] | Goldberg LR. A broad-bandwidth, public domain, personality inventory measuring the lower-level facets of several five-factor models. In: Personality psychology in Europe Volume 7, edn. Edited by MervieldeI, DearyIJ, FruytFD , OstendorfF. Tilburg, The Netherlands: Tilburg University Press;(1999) :7–28. |
[41] | Goldberg LR , Johnson JA , Eber HW , Hogan R , Ashton MC , Cloninger CR , et al. The international personality item pool and the future of public-domain personality measures. J Res Pers. (2006) ;40: (1):84–96. |
[42] | Gow AJ , Whiteman MC , Pattie A , Deary IJ. Goldberg’s ‘IPIP’Big-Five factor markers: Internal consistency and concurrent validation in Scotland. Pers Individ Dif. (2005) ;39: (2):317–29. |
[43] | Stafford L , Judd F , Gibson P , Komiti A , Mann GB , Quinn M. Anxiety and depression symptoms in the 2 years following diagnosis of breast or gynaecologic cancer: prevalence, course and determinants of outcome. Support Care in Cancer. (2015) ;23: (8):2215–24. |
[44] | Tiro JA , Sanders JM , Shay LA , Murphy CC , Hamann HA , Bartholomew LK , et al. Validation of self-reported post-treatment mammography surveillance among breast cancer survivors by electronic medical record extraction method. Breast Cancer Res Treat. (2015) ;151: (2):427–34. |
[45] | Tabachnick BG , Fidell LS. Using multivariate statistics. Boston, MA: Allyn & Bacon/Pearson Education; (2007) . |
[46] | Consedine NS , Magai C , Krivoshekova YS , Ryzewicz L , Neugut AI. Fear, anxiety, worry, and breast cancer screening behavior: a critical review. Cancer Epidemiol Biomarkers Prev. (2004) ;13: (4):501–10. |
[47] | Diefenbach MA , Miller SM , Daly MB. Specific worry about breast cancer predicts mammography use in women at risk for breast and ovarian cancer. Health Psychol. (1999) ;18: (5):532. |
[48] | McCaul KD , Reid PA , Rathge RW , Martinson B. Does concern about breast cancer inhibit or promote breast cancer screening? Basic Appl Soc Psych. (1996) ;18: (2):183–94. |
[49] | Styra R , Sakinofsky I , Mahoney L , Colapinto ND , Cur-rie DJ. Coping styles in identifiers and nonidentifiers of a breast lump as a problem. Psychosomatics. (1993) ;34: (1): 53–60. |
[50] | Von Wagner C , Good A , Whitaker K , Wardle J. Psychosocial determinants of socioeconomic inequalities in cancer screening participation: a conceptual framework. Epidemiol Rev. (2011) ;33: (1):135–47. |
[51] | Swan J , Breen N , Coates RJ , Rimer BK , Lee NC. Progress in cancer screening practices in the United States. Cancer. (2003) ;97: (6):1528–40. |
[52] | Litaker D , Tomolo A. Association of contextual factors and breast cancer screening: finding new targets to promote early detection. J Womens Health. (2007) ;16: (1):36–45. |
[53] | Davis C , Emerson JS , Husaini BA. Breast cancer screening among African American women: adherence to current recommendations. J Health Care Poor Underserved. (2005) ;16: (2):308–14. |
[54] | Braveman PA , Cubbin C , Egerter S , Chideya S , Marchi KS , Metzler M , et al. Socioeconomic status in health research: one size does not fit all. JAMA. (2005) ;294: (22):2879–88. |
[55] | McCaffery K , Wardle J , Nadel M , Atkin W. Socioeconomic variation in participation in colorectal cancer screening. J Med Screening. (2002) ;9: :104–108. |
[56] | Fulton B. R. Organizations and survey research implementing response enhancing strategies and conducting nonresponse analyses. Sociological Methods & Research. (2016) ; doi:10.1177/0049124115626169 |
[57] | Groves RM , Peytcheva E. The impact of nonresponse rates on nonresponse bias. Public Opinion Quarterly. (2008) ;72: :167–189. |
[58] | Edwards PJ , Roberts I , Clarke MJ , Diguiseppi C , Wentz R , Kwan I. et al. Methods to increase response to postal and electronic questionnaires. Cochrane Database of Systematic Reviews(3). (2009) ; MR000008, doi: 10.1002/14651858.MR000008.pub4Dfdd |


