
Multi-modal approach for COVID-19 detection using coughs and self-reported symptoms
Abstract
COVID-19 (Coronavirus Disease of 2019) is one of the most challenging healthcare crises of the twenty-first century. The pandemic causes many negative impacts on all aspects of life and livelihoods. Although recent developments of relevant vaccines, such as Pfizer/BioNTech mRNA, AstraZeneca, or Moderna, the emergence of new virus mutations and their fast infection rate yet pose significant threats to public health. In this context, early detection of the disease is an important factor to reduce its effect and quickly control the spread of pandemic. Nevertheless, many countries still rely on methods that are either expensive and time-consuming (i.e., Reverse-transcription polymerase chain reaction) or uncomfortable and difficult for self-testing (i.e., Rapid Antigen Test Nasal). Recently, deep learning methods have been proposed as a potential solution for COVID-19 analysis. However, previous works usually focus on a single symptom, which can omit critical information for disease diagnosis. Therefore, in this study, we propose a multi-modal method to detect COVID-19 using cough sounds and self-reported symptoms. The proposed method consists of five neural networks to deal with different input features, including CNN-biLSTM for MFCC features, EfficientNetV2 for Mel spectrogram images, MLP for self-reported symptoms, C-YAMNet for cough detection, and RNNoise for noise-canceling. Experimental results demonstrated that our method outperformed the other state-of-the-art methods with a high AUC, accuracy, and F1-score of 98.6%, 96.9%, and 96.9% on the testing set.
1Introduction
COVID-19, firstly reported in 2019 in Wuhan, China, is a novel pathogen of the severe acute respiratory syndrome coronavirus 2 (SARS-Cov-2). The disease has been quickly spread worldwide within three months and was then declared a global pandemic on February 11, 2020, by the World Health Organization (WHO).
Owing to the development of effective vaccines, such as the Pfizer/BioNTech BNT162b2 mRNA vaccine, the pandemic is gradually under control in many countries. However, its impact will linger for an extended period [13]. Therefore, the combination of different methods to reduce the spread of COVID-19 is critical. In this context, early detection is still an important determinant to control the outbreak [54].
Dyspnea, fever, cough, and muscle pain are the most common symptoms of COVID-19. In the early period of infection, these symptoms are similar to other diseases such as flu, pneumonia, and allergies [10]. Consequently, it is difficult to distinguish them if based only on clinical signs. The laboratory diagnosis is required to confirm the diagnosis of COVID-19. The reverse-transcription polymerase chain reaction (RT-PCR) assay is the gold standard for COVID-19 confirmation [1]. However, such testing is time-consuming, expensive, and requires adequately skilled staff [31]. Rapid Antigen Test Nasal is another method that allows quickly detecting COVID-19. But, this method is still uncomfortable, painful, and difficult for self-testing [30].
Recently, artificial intelligence and deep learning have attracted wide attention from researchers in diagnosing, preventing, and controlling diseases [36]. It allows for reducing response times and acting as an efficient solution for far-flung locations, or overloaded hospitals [14].
This has opened up great opportunities for early detection of COVID-19. Numerous neural networks, for example, Convolutional neural networks (CNN) [17], Long short-term memory (LSTM) [8], or bidirectional-Long short-term memory (biLSTM) [1], have been successful in deriving useful high-level features of the disease from low-level ones [36].
Due to the acute respiratory failure caused by COVID-19, existing studies mainly analyzed the respiratory system to detect infections. Respiratory sounds (RS), computer tomography (CT), or X-Ray images of chests and lungs are the most used data. RS consists of important information about the structure and function of the respiratory system. Therefore, numerous related sounds have been employed in the literature for COVID-19 detection, for example, breath and cough sound as presented in the work of Alkhodari et al. [2], Pahar et al. [40], or Vrindavanam et al. [62].
Similarly, owing to the possibility of visualizing and monitoring the condition of body parts, CT and X-Ray images have been applied in many studies for COVID-19 diagnoses, such as the works of Elmuogy et al. [16], Farag et al. [17] or Mahanty et al. [33]. But, such data are not easy to collect: patients should come to the hospital and be scanned by doctors.
Recently, to improve the accuracy of COVID-19 detection, several researchers have applied multi-modal methods. This latter is the process of knowledge creation by conjointly examining different forms of information sources and seeing how the combination and interaction between various modes in generating meaning as a whole [37]. Therefore, it can provide essential complementary information that can be used to enhance the understanding of the studied problem. The multi-modal method for COVID-19 usually combines common symptoms and data, such as sounds, images, or the presence/absence of fever, dyspnea, or muscle pain [9, 15]. They rely on the idea that these symptoms are all important in COVID-19 diagnosis [15]. Nevertheless, existing works either mainly used medical images (i.e., CT and X-ray images) [42, 58] or still have room for improvement in terms of performance.
We are interested in early detection methods that can be self-tested without requiring complex devices and physicians (i.e, CT and X-ray images). Owing to its outperformance, in this study, we propose a multi-modal method for early detection of COVID-19 using cough sounds and self-reported symptoms. Our contributions can be summarized as follows:
– we investigate a multi-modal method for early detection of COVID-19, using cough sounds, and self-reported symptoms.
– we propose an architecture that combines three neural networks to deal with multi-modal inputs, including CNN-biLSTM for sequence MFCCs, EfficientNetV2 [57] for Mel spectrogram images, and Multilayer Perceptron (MLP) for binary vectors of self-reported symptoms.
– to pre-process input recordings, we applied two techniques: (i) transfer learning on the YAMNet [65] to produce a new model (C-YAMNet) that allows detecting cough sounds; and (ii) noise canceling using RNNoise neural network [60].
– we evaluate the proposed method on a public dataset of COVID-19 (Coswara) and highlight the experimental results thus obtained
The remainder of this paper is organized as follows. In Section 2, we will discuss related studies. Our material and methods are presented in Section 3. Section 4 reports the experiments and results, followed by conclusions in Section 5.
2Related works
Since 2020, there have been significant efforts to diagnose COVID-19 using artificial intelligence. Based on the input data, they can be roughly divided into two groups, including unimodal and multi-modal-based methods [15]. The first groups are widely applied in previous studies, which used only one type of data for COVID-19 diagnoses, such as medical images like CT or X-ray images) or acoustics like cough, breathing, or speech [1, 2, 9, 46].
For example, Alshazly et al. [3] proposed to apply transfer learning with several CNN architectures (SqueezeNet [24], Inception [55], ResNet [20], Xception [11], ResNeXt [64], ShuffleNet [32], and DenseNet [23]) on two CT image datasets (SARS-CoV-2 CT [53] and COVID19-CT [21]). With some different configurations and custom-sized inputs for each network, the authors reported a high performance with average accuracies of 99.4% and 92.9% and sensitivity scores of 99.8% and 93.7% on the two datasets. Similarly, Mahanty et al. [33] presented a method to detect COVID-19 using X-ray images of chests. The authors applied three machine learning methods, including a traditional classification model (SVM), and two deep transfer learning models (VGG16 & Xception). The dataset consists of 208 images (104 positives and 104 negatives). Their methods achieved high accuracies of 95.55%, 96.54%, and 97.46% for SVM, VGG16, and XCeption, respectively. Other similar works can be found in the literature, for example, COVID-19 detection with chest CT scans [6, 16, 27, 49, 70], with chest X-ray images [17, 39, 48] or prediction of COVID-19 mutation [41].
Concerning the acoustic, for instance, Mohammed et al. [34] developed pre-screening models for COVID-19 using cough sound with shallow machine learning, Convolutional Neural Network (CNN), and pre-trained CNN models. This work has been conducted on two crowdsourced cough datasets, in which the authors segmented the cough sound recordings into individual non-overlapped segments to enrich the COVID-positive records. The obtained models achieved a high accuracy of 75%. Similarly, Pahar et al. [40] based on cough sounds to develop a non-contact method for COVID-19 detection. The authors experimented with seven machine learning classifiers (four traditional machine learning and three deep learning models) on two public datasets, including Cosawa [51] and Sarcos [40]. The datasets were collected from volunteers via web and mobile platforms. Cosawa consists of breathing, cough, phonation of sustained vowels, and spoken digits, while Sarcos contains only cough. The obtained accuracies ranged from 75.7% to 95.33%, in which the best performance was exhibited by the ResNet50. Similar works can be found in the literature, such as cough [5, 43], breath [1, 46] or speech [4, 29].
In general, the medical image methods are not portable and must involve equipment and experts (i.e., doctors) from hospitals or medical centers [15]. In contrast, the acoustic approaches are easier in data collection. Since they can be simply retrieved using commercially available devices that are accessible by many users, especially cough or breath. Moreover, acoustic signals recorded at the mouth provide an accurate assessment of respiration quality without the need for an external excitation signal or deductive operations. Therefore, the acoustic data are suitable for early detection of COVID-19.
The second group, multi-modal methods, combines data from different modalities that provide separate views on the disease. For example, Chetupalli et al. proposed a multi-modal method using the Coswara dataset [51], which fuses cough, breathing, and speech signals with eight self-reported symptoms. The authors separately applied four traditional machine learning methods to each type of data to produce prediction scores. Logistic regression (LR), SVM with linear kernel, and SVM with radial basis function kernel were consecutively explored for acoustic data, while the decision tree model for eight symptoms. A probability score of COVID-19 infection was then obtained from the average of the prediction scores. The proposed method demonstrated a significant improvement over individual modality, with the highest area-under-curve (AUC) of 92.4%. Similarly, Effati et al. [15] proposed a multi-modal method based on coughs, breathing, and fever to predict COVID-19. The authors trained two separate deep neural networks using CIder CNN [12] on the Cambridge dataset [7]. In contrast with the work of Chetupalli et al. [9], which used an equal weighting function for the fusion of modalities, this method employed different weights for each symptom. These weights were calculated from the average of their prevalence in the dataset. From the obtained results, the authors concluded that there is a considerable improvement in COVID-19 detection. Similar studies can be found in [26, 29, 44, 59, 63].
Table 1 summarizes the methods and modalities that these recent works have applied. The same trend was observed for this multi-modal approach, where acoustic recordings and clinical symptoms were common data for early COVID-19 detection. Among the studied methods, cough sounds are the most used modality. They are usually passed through several pre-processing steps, such as noise reduction [29] or cough detection [63]. The second most modalities are breathing and clinical symptoms. According to Zardini et al. [68], some symptoms are more prevalent in COVID-19 patients, such as fever, muscle pain, fatigue, or the appearance of coughs. Consequently, many existing works fuse self-reported symptoms with others to detect COVID-19. X-rays, CT images, and speech are also popular. But to collect these data, participants should strictly follow predefined instructions or be scanned by complex devices.
Table 1
Recent multi-modal methods for COVID-19 diagnosis
| Recent works | Dataset | Methods | Audio | Image | Clinical symptoms | |||
| Cough | Breathing | Speech | X-ray | CT | ||||
| [15] | Cambridge [7] | CNN | X | X | X | |||
| [9] | Coswara [51] | LR, SVM | X | X | X | X | ||
| [63] | Cambridge [7] | SVM, VGGish | X | X | X | |||
| [26] | Virufy and Coswara [51] | CovParaNet + CovTinyNet | X | X | X | X | X | |
| [29] | X-ray: Self-collected datasets. Cough: Coughvid Detect Now and Virufy | CNN | X | X | ||||
| [44] | COUGHVID [38] | CoughNet-V2 | X | X | ||||
| [59] | Coswara and COUGHVID | MLP + Nested Hierarchical Transformer | X | X | ||||
Regarding the applied methods, the existing works employed two main approaches: traditional machine learning and deep learning. Some most popular examples are SVM [9, 47], Decision Tree Classifier [9, 61], Random Forest (RF) [25, 66], k-Nearest Neighbour (kNN) [28, 35], Artificial Neural Network (ANN) [45] for the first approaches, and CNN [15], LSTM [40], biLSTM [1] for the second approaches. Experimental results show that the deep models outperform the traditional ones [33, 40]. It can be explained by the fact that the shallow architectures are not suitable for complicated large-scale real-world problems such as COVID-19 detection [69]. These problems require a more profound and layered architecture to extract the complex information [19], which can be resolved by multi-layer neural networks, with many hidden layers, as in deep learning techniques.
The multi-modal approaches have shown promising and better results than the unimodal methods. However, the existing works did not provide a clear reason to fuse symptoms. The most common symptoms of this disease are coughs and some self-reported symptoms [68]. Therefore, including breathing or speech can introduce unexpected noise to the training data.
3Material and methods
3.1Multi-modal neural network for COVID-19 detection
In this study, we propose a multi-modal neural network to detect COVID-19. Considering the most common symptoms of COVID-19 [68], we fused two modalities, including cough sounds and the presence/absence of 2 groups of symptoms: (i) fever/muscle pain; (ii) asthma/cold/sore throat/diarrhea. The cough sounds were extracted into two different features: MFCCs and Mel spectrogram, while a binary vector was used to represent the second modality. The proposed method consists of five neural networks, including C-YAMNET for cough detection, RNNoise for noise reduction, 1D CNN-biLSTM for MFCC features, Efficient NetV2 [57] for Mel spectrogram, and Multilayer Perceptron (MLP) for the binary vector, as shown in Fig. 1.
Fig. 1
Overall architecture of the proposed method.
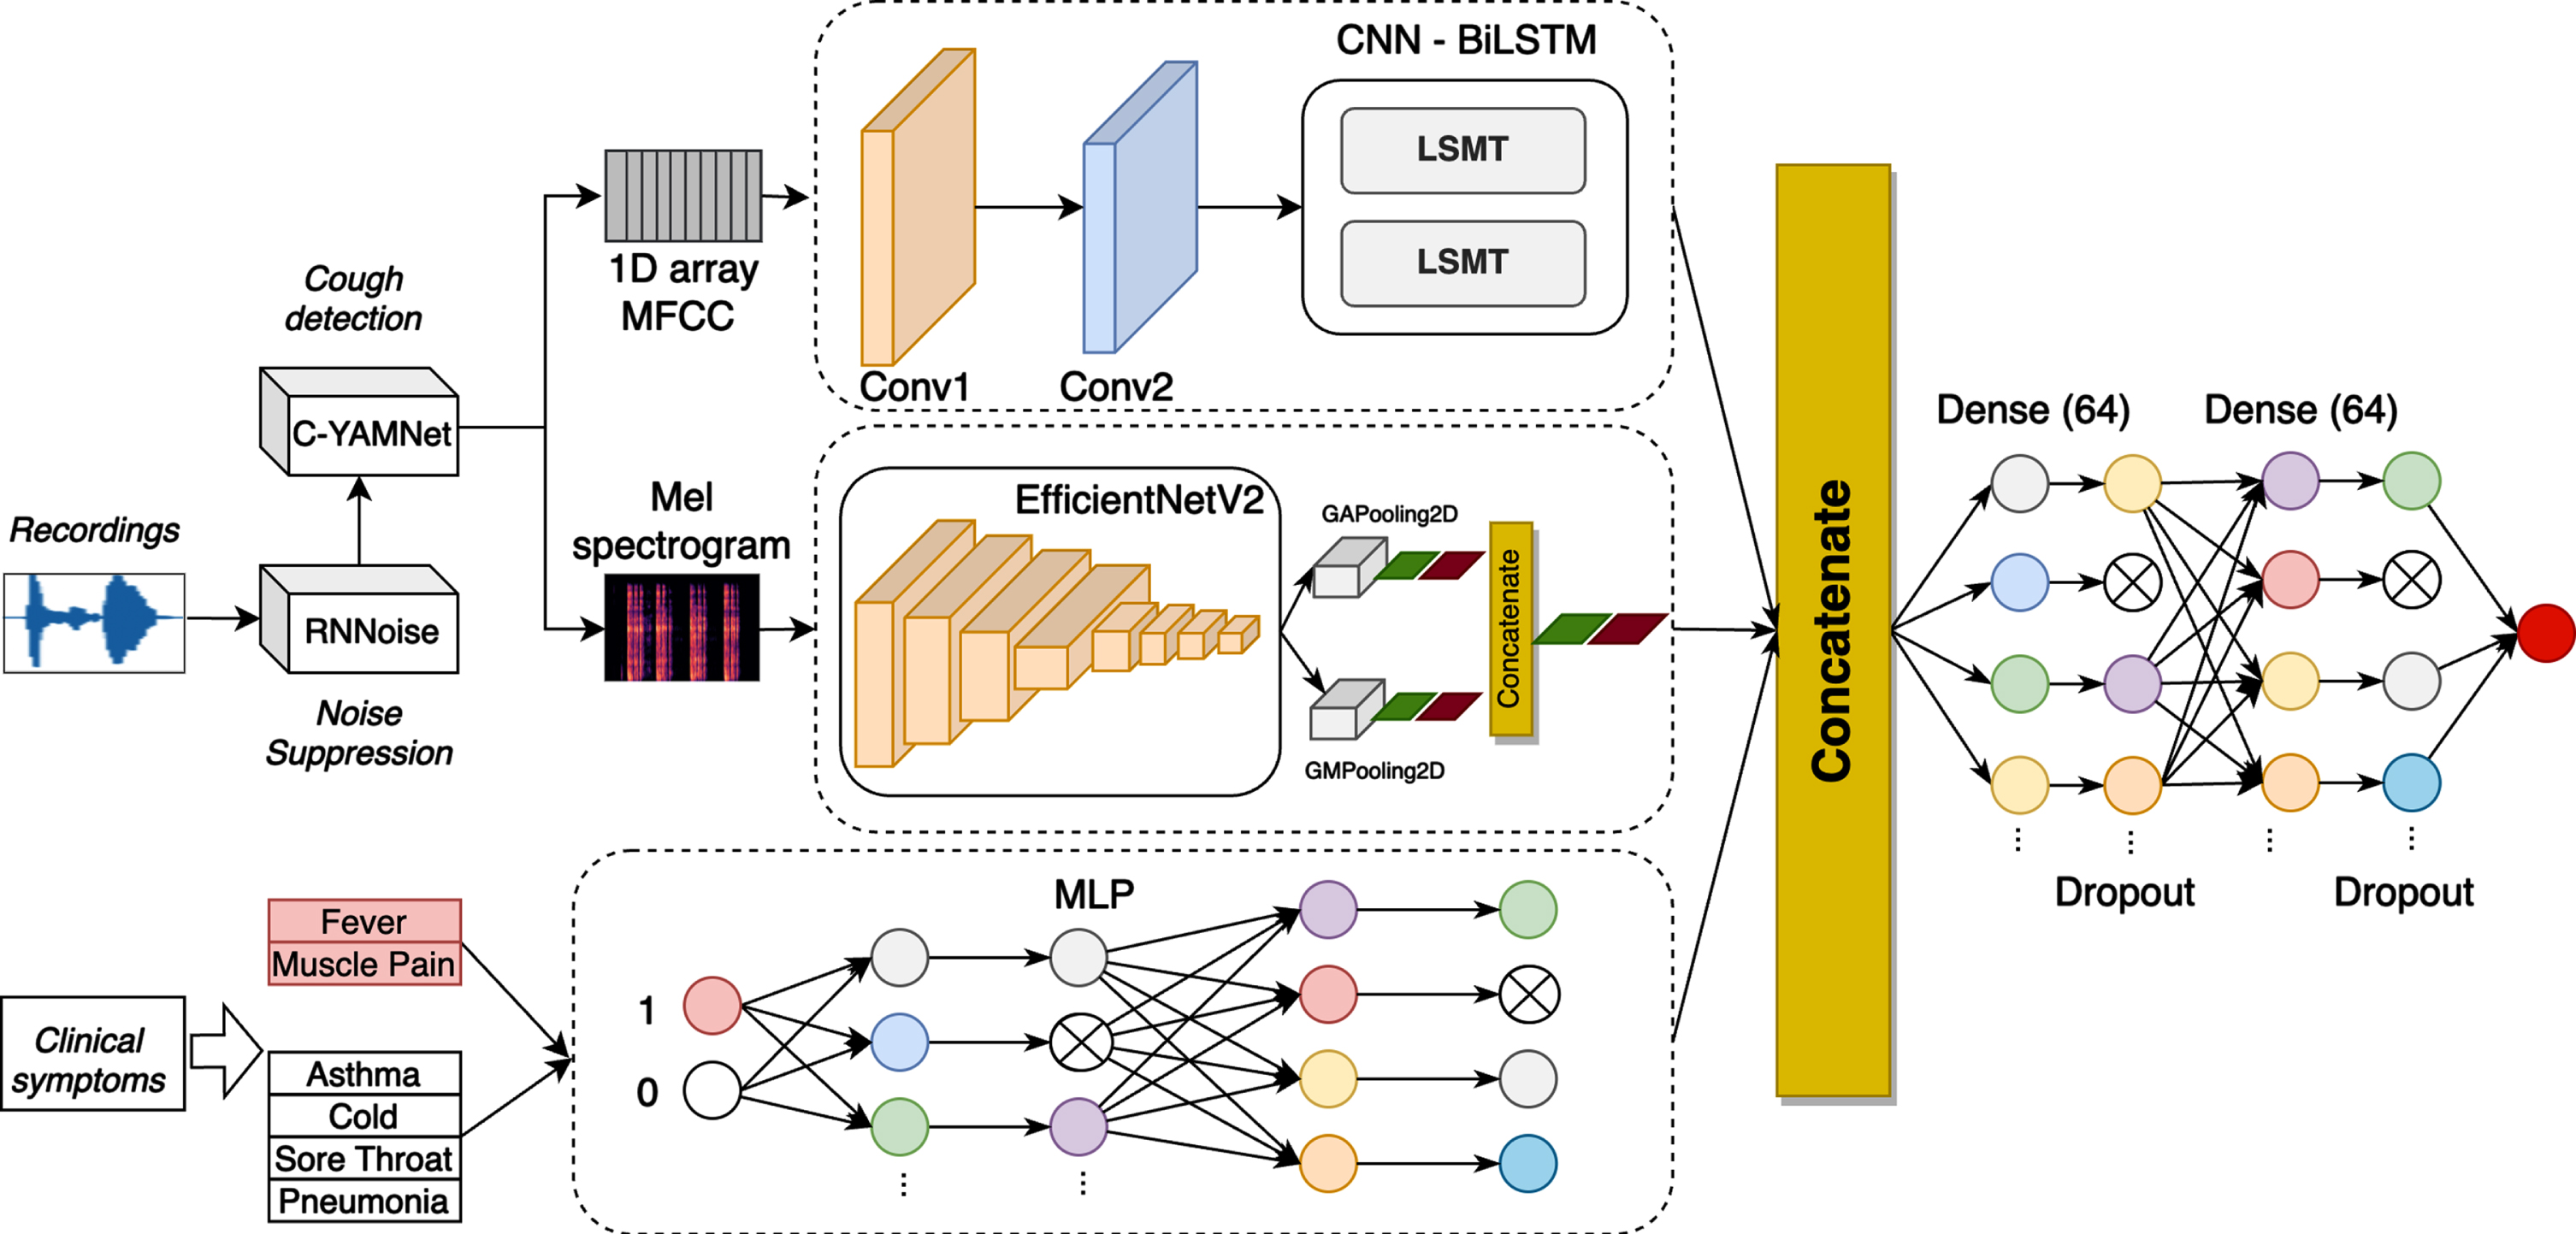
To combine different types of features extracted from the three modalities, we horizontally concatenated outputs generated from the last layer of CNN-biLSTM, EfficientNetV2 and MLP. They are then passed to two fully connected and dropout layers, before predicting COVID-19 or non-COVID-19.
In the next section, we will present in detail the used features and the architecture of the three networks.
3.2Pre-processing
To normalize and improve the quality of input recordings, we performed two pre-processing steps, including noise reduction and cough detection. First, we applied RNNoise (Recurrent Neural Network Noise) [60] to filter noise. RNNoise is a comb filter defined at the pitch interval, applied to each window. RNNoise slides over the Vorbis window of size 20 ms with 50% of overlapping.
After noise canceling, we determined the existence of cough sounds by a dedicated model, C-YAMNet, that was based on the YAMNet network [65] trained on AudioSet ontology [18]. The network used the Mobilenet depthwise-separable convolution architecture [22] and allows for predicting 521 audio event classes. It consisted of twenty-two layers: nineteen convolutional, followed by an average pooling, fully-connected, and softmax layer. The first nineteen layers are depthwise separable convolutions. Each convolutional layer used ReLU as the activation function, and the batch norm was used for the standardized distribution of batches.
Recently, the Coswara dataset has updated its annotations to describe the quality of cough sounds. The audio files were manually listened to and labeled as one of the three categories: 2 (excellent), 1 (good), and 0 (bad). We considered that the two first categories contain cough sounds, while the last one is the others. We fine-tuned YAMNet on this new dataset to classify two classes: cough and others. Therefore, the feature extractor was kept as the original network. To adapt to our purpose, we updated the classifier section with a new softmax layer that adjusts to 2 classes only. Only recordings containing cough sounds were passed to the next step (feature extraction). The new model was named C-YAMNet to differentiate from the original network, as illustrated in the upper branch of Fig. 1.
3.3Feature extraction
In this study, we extracted three features coming from two types of data to train models. Because of their ubiquity and efficiency in sound analysis, MFCC was chosen for the first feature. The feature is computed from the short-term Fourier Transform as the spectrum of the mel-warped spectrum. MFCC represents phonemes (which are the distinct units of sound) as the shape of the vocal tract (which is responsible for sound generation) is manifest in them [52]. They allow modeling the signals based on the human sense of hearing, which has proven to achieve better performance in analyzing cough sounds, as presented in [2, 40, 62]. For this purpose, we down-sampled the frequency of cough sounds to 22kHz, as human ears can only consume sounds that have a frequency value up to 20kHz. We extracted then 39-dimensions MFCC with a window length of 20 ms and an overlap of 10 ms. From this, we created two features, including a 1D array and Mel-spectrogram images. First, the mean values of the 39-dimensions MFCC were calculated for the 1D array that was fed to CNN-biLSTM, as shown in Fig. 1. Second, Mel spectrogram images were generated, which is similar to MFCC but with the filter bank energies, instead of using the discrete cosine transform [50]. The images have the size of 224 x 224 x 3, which was used to train EfficientNetV2, as illustrated in Fig. 1.
The last feature was relied on the two most informative clinical symptom types of COVID-19, including (i) fever/muscle pain symptoms and (ii) asthma, cold, sore throat, or pneumonia. We model this feature by a binary vector, in which the value 1 corresponds to the occurrence of at least one of these symptoms and vice versa.
3.41D CNN-biLSTM for sequence MFCC
We propose a deep convolutional biLSTM architecture to analyze the 1D array. The network starts with two convolutional layers as the feature extractor, followed by two biLSTM layers. The two first layers have a filter of 32 and 64, with a stride of 1. After each convolutional layer, we used batch normalization to regularize the filtered data. ReLU activation function was used for these two layers.
Since cough sounds are continuous in the time domain, we need an architecture that accounts for the temporal relationships in the input-output mappings. Therefore, we employed two biLSTM layers after the two convolutional layers. These layers were trained with the same configuration, which contains eight hidden units, the tanh function for activation, and the sigmoid for the recurrent activation. At the end of the CNN-biLSTM architecture, we added a dropout layer to avoid overfitting. The output of this network was flattened to one dimension for the fusion of three modalities. Table 2 presents the detailed architecture of the proposed network.
Table 2
Detailed network to produce the first modality
| CNN | ||
| Layer | Configuration (kernel, stride, channel, activation) | Output |
| conv1 x | Conv1: 2, 1, 32, relu | 12 × 32 |
| BatchNormalization | ||
| conv2 x | Conv1: 2, 1, 64, relu | 11 × 64 |
| BatchNormalization | ||
| biLSTM | ||
| biLSTM | Hidden units:8 | 11 × 16 |
| biLSTM | Hidden units:8 | 16 |
| Add | In1: 11 × 16, In2: 16 | 11 × 16 |
| Dense | In:11 × 16 | 11 × 64 |
| Dropout | - | 11 × 64 |
| Flatten | In:11 × 16 | 704 |
3.5EfficientNetV2 for Mel spectrogram images
For Mel spectrogram images, we mainly applied EfficientNetV2 [57] architecture which was recently proven as an efficient solution for image classification. The network is a new family of convolutional networks that have faster training speed and better parameter efficiency. EfficientNetV2 was based on the previous version, EfficientNet1 [56] with some modifications, including (1) extensively using both MBConv and the newly added Fused-MBConv in the early layers, (2) applying smaller kernel sizes (3x3 instead of 5x5), and (3) removing the last stride-1 stage. They also combined training-aware neural architecture search and scaling, to jointly optimize training speed and parameter efficiency.
In this study, we applied the mixed-pooling idea proposed by Yu et al.. After extracting the features, we parallelly reduced them by Global Max Pooling and Global Average Pooling, followed by batch normalization and a dropout layer. A concatenation layer was used to combine the outputs of these two pooling layers. We finally obtained a 1D vector of size 20 for the fusion. Table 3 presents the detailed architecture of the proposed network to extract features from Mel spectrogram images.
Table 3
Detailed network to produce the second modality
| Stage | Operator | Stride | #Channels | #Layers |
| 0 | Conv3x3 | 2 | 24 | 1 |
| 1 | Fused-MBConv1, k3x3 | 1 | 24 | 2 |
| 2 | Fused-MBConv4, k3x3 | 2 | 48 | 4 |
| 3 | Fused-MBConv4, k3x3 | 2 | 64 | 4 |
| 4 | MBConv4, k3x3, SE0.25 | 2 | 128 | 6 |
| 5 | MBConv6, k3x3, SE0.25 | 1 | 160 | 9 |
| 6 | MBConv6, k3x3, SE0.25 | 2 | 272 | 15 |
| 7 | Conv1x1 &Pooling &FC | - | 1792 | 1 |
| Global Max Pooling + Global Average Pooling | ||||
| BatchNormalization | ||||
| Dropout | ||||
| Concatenate(10,10) | ||||
In the next section, we will introduce the MLP network for the clinical symptom data.
3.6MLP for symptoms
We explored Multilayer Perceptron (MLP) networks to analyze the binary vector of symptoms. MLP is a feed-forward Artificial Neural Network (ANN), which consists of an input layer, a hidden layer, and an output layer. An MLP with more than one hidden layer can be considered a Deep Neural Network (DNN), in which every layer contains a bias neuron, except the output layer. They are fully connected to the next layers.
As mentioned previously, the clinical symptoms are divided into two groups. Therefore, the data input for the MLP network has the shape of 2. The MLP network has two fully-connected layers containing 64 nodes, followed by two dropout layers to avoid overfitting, as presented in Fig. 1. Thereafter, we obtained a 1D vector of size 64, which allows us to incorporate the clinical information into the fusion.
3.7Fusion
Since these modalities were observed in almost COVID-19 patients, we considered that they have an equally important role in training models. Therefore, the output of three networks was horizontally concatenated to integrate different types of extracted features. After that, we obtained a feature vector of size 788. The vector was then passed through two fully connected layers to jointly learn non-linear correlations among the features. The concatenation of three features is defined in Equation 1.
(1)
4Experiment
4.1Dataset
We used the dataset from the Coswara project [51] of the Indian Institute of Science (IISc) Bangalore to train and evaluate our models. The objective of this project is to build a diagnostic tool for Covid-19 based on respiratory, cough, and speech sounds. It supports an online platform1where public participants can provide their breathing sounds, cough sounds, sustained phonation of vowel sounds, and a counting exercise.
The participants are recommended to use their smartphone for sound recording, with a sampling frequency of 48 kHz. Each participant contributes nine recordings, including shallow and deep breathing, shallow and heavy cough, sustained phonation of three vowels, and fast and normal pace number counting. Several self-reported information is also required for each participant, such as meta-data (location, age, gender …), health status (cough, fever, muscle pain …, respiratory ailments, and some pre-existing conditions), and COVID-19 test status.
The data published on 24th, February 2022 was used in this study, which contains 2746 samples. Each sample has a COVID-19 status that falls into one of the eight categories, as shown in Table 4. There are 1433 negative (healthy) and 681 positive (positive_mild, positive_moderate, and positive_asymp) COVID-19 samples.
Table 4
COVID-19 status of Coswara dataset
| Categories | Total of samples | |
| 1 | healthy | 1433 |
| 2 | positive_mild | 426 |
| 3 | no_resp_illness_exposed | 248 |
| 4 | positive_moderate | 165 |
| 5 | resp_illness_not_identified | 157 |
| 6 | recovered_full | 146 |
| 7 | positive_asymp | 90 |
| 8 | under_validation | 81 |
Since each participant contains two cough sounds (shallow and heavy cough), we created two samples per participant, which have the same symptoms but with different coughs. According to the request of the Coswara project, participants are recommended to take around 5-7 minutes of recordings. In addition, through a statistical analysis, as shown in Fig. 2, we found that most recordings range from 4-6 seconds. Therefore, only participants whose cough sounds fall in this range were selected. Besides, we eliminated recordings that were assessed as bad quality (not cough sounds). A total of 1947 samples were obtained, which consisted of 520 negatives and 298 positives for shallow cough sounds, and 460 negatives and 255 positives for heavy cough sounds. Finally, we randomly eliminated a number of negative samples to create a balanced dataset (544 negatives and 544 positives for both types of coughs). The dataset was then split into three subsets for training (70%), validation (15%), and testing (15%), respectively. Table 5 presents detailed demographic and clinical information of subjects included in the study.
Fig. 2
Distribution of recording time.
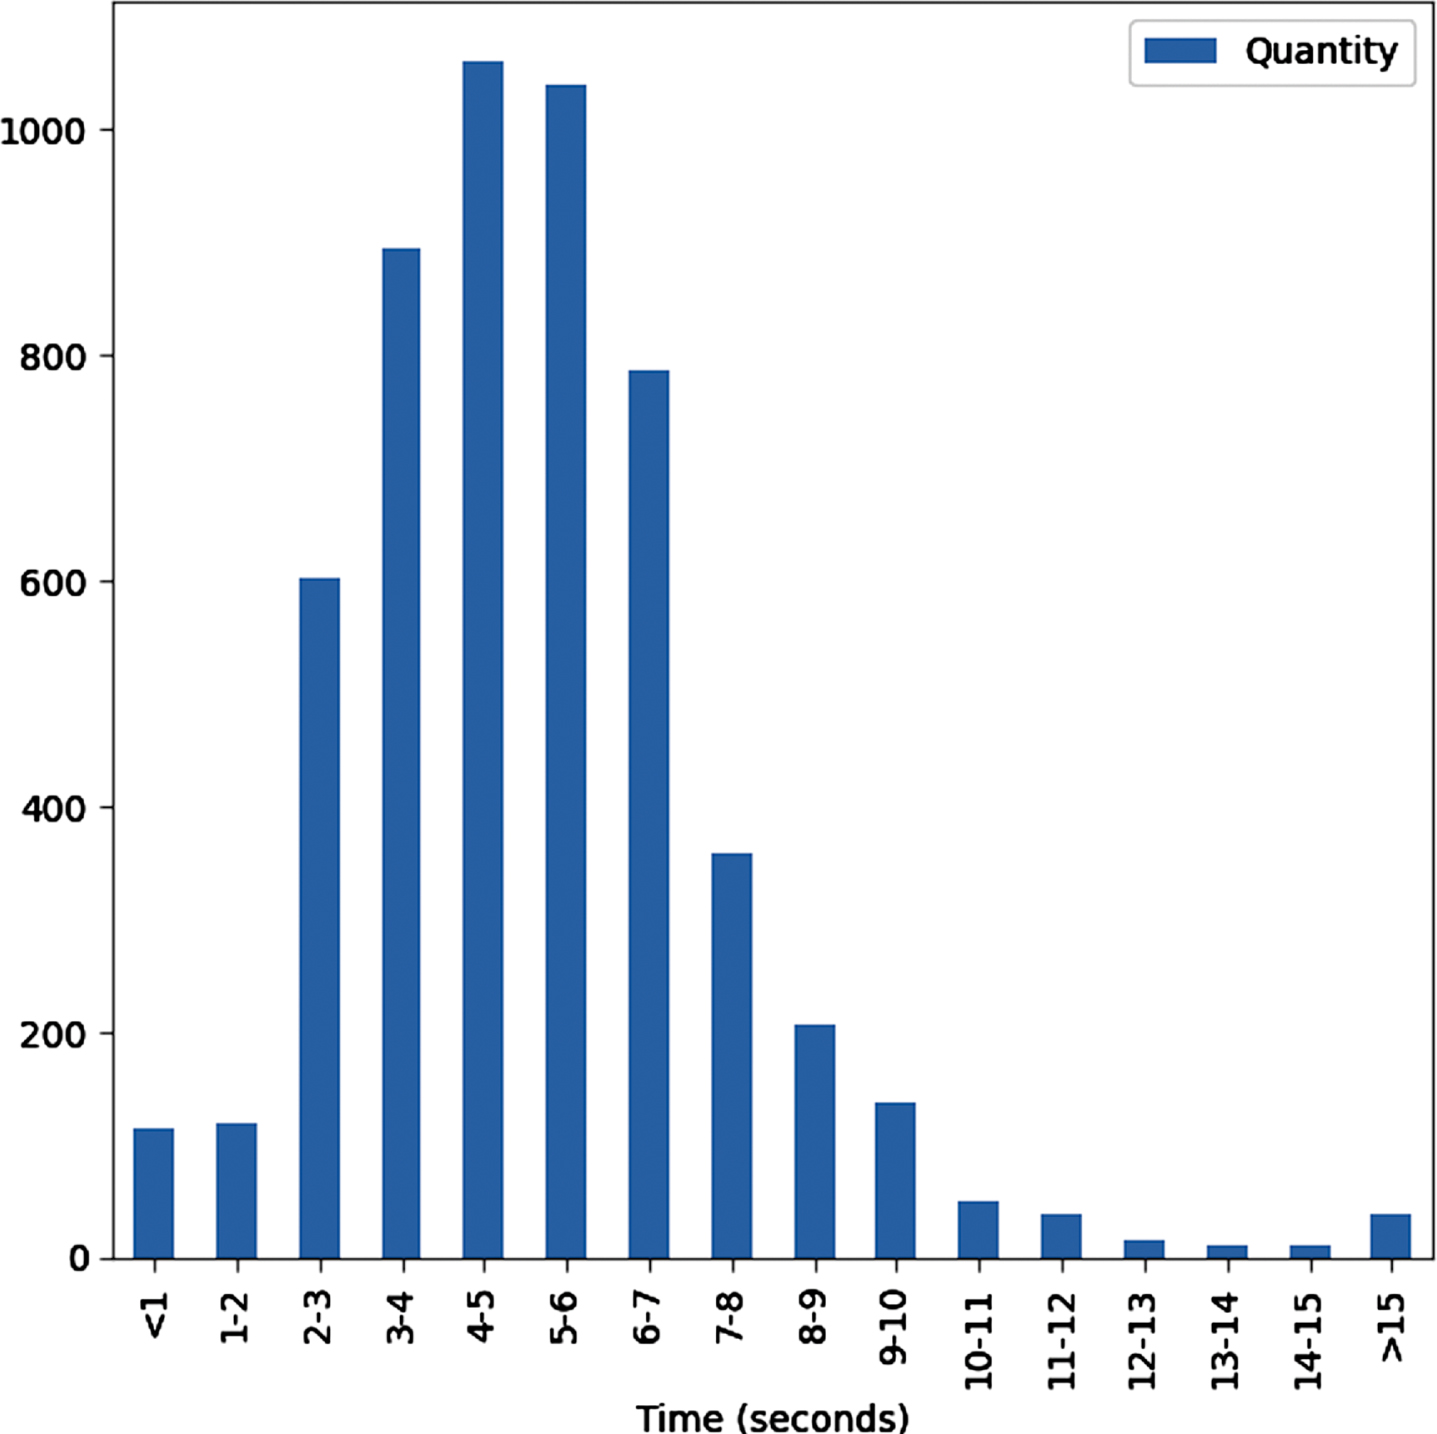
Table 5
Demographic information and self-reported symptoms of studied subjects
| Healthy | Positive | |||
| Mild | Moderate | Asymp | ||
| Demographic information | ||||
| Age (Average) | 33.3 | 37.9 | 45.7 | 31.3 |
| Gender (Male/Female) | 442/166 | 240/122 | 92/78 | 46/30 |
| Self-reported symptoms | ||||
| Fever | 14 | 154 | 104 | 8 |
| Cold | 26 | 126 | 98 | 18 |
| Cough | 40 | 216 | 130 | 14 |
| Muscle pain | 4 | 116 | 94 | 10 |
| Loss of smell | 0 | 58 | 66 | 6 |
| Sore throat | 6 | 100 | 66 | 8 |
| Fatigue | 6 | 166 | 106 | 16 |
| Breathing Difficulties | 6 | 40 | 62 | 4 |
| Diarrhoea | 2 | 18 | 26 | 2 |
4.2Performance metrics
The accuracy, F1 score, precision, recall, accuracy, and confusion matrix were used to evaluate the experimental results. These metrics can be calculated as followings:
(2)
(3)
(4)
(5)
where TP is the true positive, TN is the true negative, FP is the false positive, and FN is the false negative number.
We also calculated the area under the Receiver-Operator Characteristic curve (AUC) as a measure of diagnostic accuracy.
4.3Experiment setup
To evaluate the proposed method and effectiveness of multi-modal fusion, we conducted six experiments, as presented in Table 6. First, we individually evaluated MFCC features with CNN-biLSTM (No #1), and Mel spectrogram with EfficientNetV2 (No #2). Second, three multi-modal networks were conducted, which combined each pair of features, including MFCC and Mel spectrogram (No #3), MFCC and symptoms (No #4), and Mel spectrogram and symptoms (No #5). Lastly, we evaluated the multi-modal with all features (No #6).
Table 6
Six experiments with different inputs and networks
| Exp | Branch 1 | Branch 2 | Branch 3 |
| 1 | MFCC + CNN_biSLTM | - | - |
| 2 | - | Mel Spectrogram + EfficientNetV2 | - |
| 3 | MFCC + CNN_biSLTM | Mel Spectrogram + EfficientNetV2 | - |
| 4 | MFCC + CNN_biSLTM | - | Symptoms + MLP |
| 5 | - | Mel Spectrogram + EfficientNetV2 | Symptoms + MLP |
| 6 | MFCC + CNN_biSLTM | Mel Spectrogram + EfficientNetV2 | Symptoms + MLP |
The TensorFlow Framework 2.3.0, Python 3.6.9 on a 12 GB NVIDIA Tesla K80 GPU, and an Intel(R) 2.3Ghz Xeon(R) microprocessor were used to implement these models.
We used the following parameters and techniques for training models:
– The loss function was the binary cross entropy;
– An Adam optimizer was employed for optimization with β1 = 0.9, β2 = 0.999, and e = 10-7. The initiated learning rate was 10-4, and a self-adjusting learning rate technique was applied;
– To minimize the cost function, we applied a mini-batch with a size of 64;
– An early stop technique with patience of 50 was employed to increase the training speed and reduce overfitting. This makes the model stop learning if it has reached its maximum accuracy;
– Other details of the network parameters are shown in Table 2, and Table 3 for CNN-biLSTM, and Efficient Net V2, respectively.
4.4Results and discussion
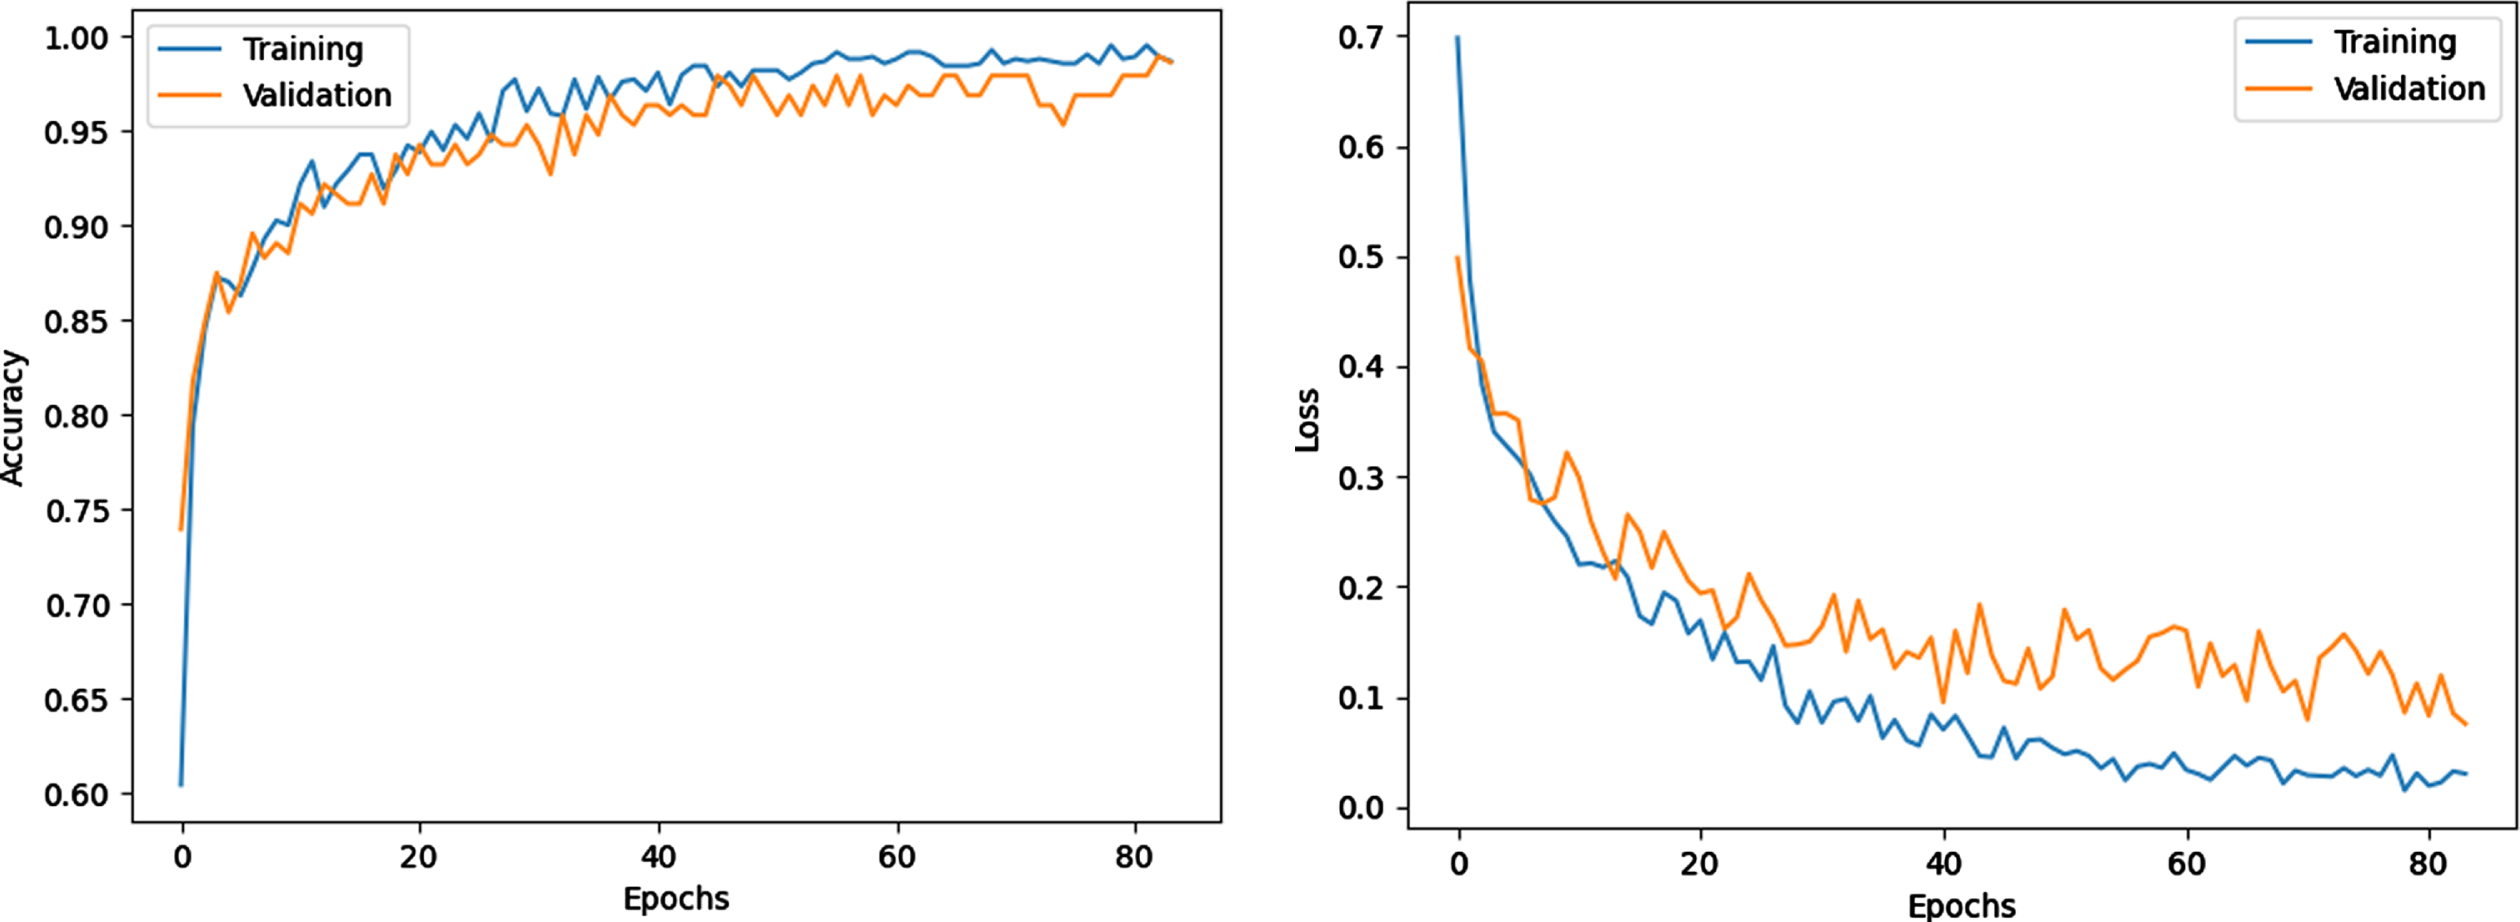
Owing to the early stop technique, the training was stopped after 83 epochs. Figure 3 shows the model training progress over time in terms of accuracy and loss of the sixth experiment. The training and validation accuracy increases, while training and valuation loss decrease as the number of training iterations increases. The gap between the curves is also small, which indicates that no overfitting occurs.
Fig. 3
Training and loss progress.
The results of six experiments are presented in Table 7. The table shows that six models can detect COVID-19 using corresponding inputs and networks. Among the obtained results, the sixth experiment exhibits the best performance, with an AUC of 98.6%, an accuracy of 96.88%, and an F1 Score of 96.86%. This high performance can be explained by the fusion of different modalities and suitable neural networks. Owing to the pre-processing step for dataset balance, the precision, recall, and F1 score are 96.25%, 97.47%, and 96.86% which are not much different from the accuracy.
Table 7
Experiment results
| Exp | Precision | Recall | F1 Score | ACC | AUC |
| 1 | 82.56% | 88.94% | 85.34% | 85% | 90.26% |
| 2 | 87.36% | 100% | 91.18% | 90.63% | 92.72% |
| 3 | 88.61% | 100% | 88.31% | 88.13% | 93.27% |
| 4 | 96.2% | 96.17% | 95.45% | 95.63% | 97.63% |
| 5 | 96.88% | 88.66% | 86.63% | 87.5% | 91.98% |
| 6 | 96.25% | 97.47% | 96.86% | 96.88% | 98.6% |
Table 7 also shows the effectiveness of fusion across the multi-modal data. In general, the fusion of different modalities yields an improvement over individual ones. The accuracy, AUC and F1 score are increased from the first experiment (only MFCC) to the third (MFCC + Mel spectrogram) by 3.13%, 3.01%, 2.96%, to the fourth (MFCC + self-reported symptoms) by 10.62%, 7.1%, 10.11%, and to the sixth (MFCC + Mel spectrogram + self-reported symptoms) by 11.9%, 8.34%, 11.56%, respectively. Similarly, combining the Mel spectrogram with other modalities outperforms the individual one.
Besides, it is observed that if combining cough sounds with self-reported symptoms, there are considerable improvements in COVID-19 detection. For instance, in comparison with the experiments without using self-reported symptoms (exp #1, #2, and #3), the average AUC, accuracy, and F1 score of the three last experiments increase by 3.56%, 4.38%, and 3.9% respectively.
The mean ROC curves for the sixth model is shown in Fig. 4. The figure show that our proposed multi-modal architecture achieved a high AUC of 98.6% and demonstrated a good performance in classification of negative and positive samples.
Fig. 4
Mean ROC curves for the classifiers on the test set.
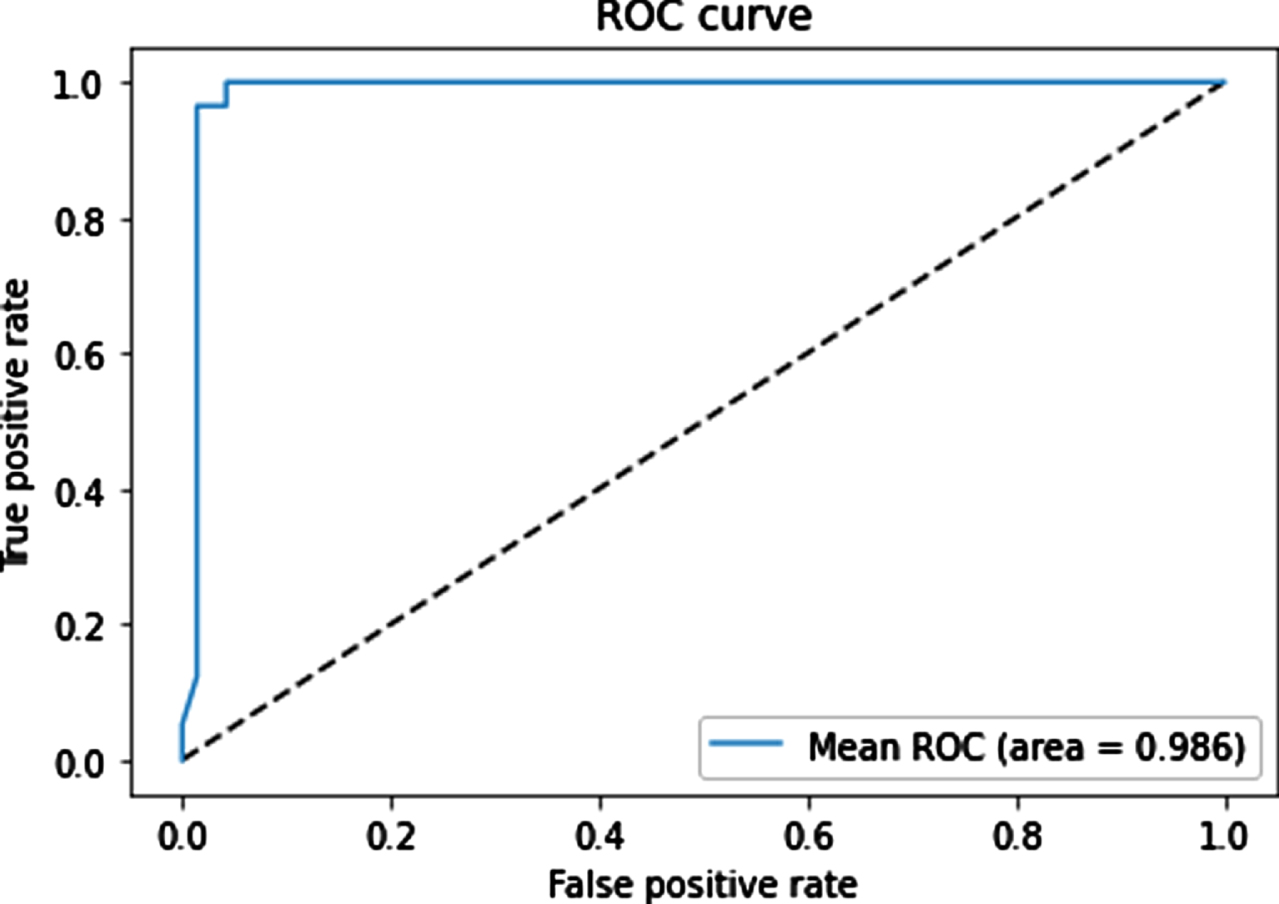
Table 8 presents the detailed classification between COVID-19 patients and healthy people in the sixth experiment. The model performs extremely satisfactorily. The precision, recall, F1 score of negative and positive classes are 97.47%, 96.25%, 96.86%, and 96.3%, 97.5%, 96.89%, respectively. The micro-average and weighted average are about 96.8%. We have found 96.9% accuracy using our model without overfitting. The support is 80 for the COVID-19 class, 80 for the healthy class, and 160 for each accuracy, micro-average, and weighted average.
Table 8
Normal versus COVID-19 classification
| Precision | Recall | F1-score | Support | |
| Class 0 | 0.9747 | 0.9625 | 0.9686 | 80 |
| Class 1 | 0.9630 | 0.9750 | 0.9689 | 80 |
| Accuracy | 0.9688 | 160 | ||
| Macro avg | 0.9688 | 0.9688 | 0.9687 | 160 |
| Weighted avg | 0.9688 | 0.9688 | 0.9687 | 160 |
We also compared the achievement of the proposed method with a recently published method on the same dataset. Table 9 presents the comparison according to AUC, accuracy, F1 Score, recall (specificity), and precision (sensitivity). Our method outperforms all these works in terms of AUC, accuracy, F1 Score, and precision.
Table 9
Performance comparison
| Method | Precision (Sensitivity) | Recall (Specificity) | F1 Score | ACC | AUC |
| Cough audio + SVM [62] | 76.9% | 81.2% | 78.4% | 83.9% | - |
| Multi-modal (deep features) + CNN-biLSTM [1] | 93.16% | 91.06% | 91.98% | 92.08% | 86% |
| Multi-modal + LR/SVM + Decision Tree [9] | 69% | 95% | - | 92.7% | 92.40% |
| Cough audio + CNN-LSTM [40] | 93% | 98% | - | 95.33% | 97.6% |
| Our method | 96.25% | 97.47% | 96.86% | 96.88% | 98.6% |
5Conclusion
In this study, to improve the performance of COVID-19 detection, we propose a multi-modal approach that combines three input categories: sequence MFCC of cough sounds, Mel spectrogram images of cough sounds, and self-reported symptoms. Each type of input was analyzed by a suitable network based on its characteristics. For instance, owing to the sequential and time-dependent features of sequence MFCCs, CNN-biLSTM was applied for this modality; EfficientNetV2 for Mel spectrogram images because of its high performance in image classification; and MLP for a binary vector of self-reported symptoms. Although each modality can be used independently for COVID-19 diagnostic, the multi-modal approach has proven that their fusion leads to superior results. We conducted an empirical experiment on a common COVID-19 dataset, Coswara, to demonstrate the effectiveness of the proposed method, which achieved an AUC of 98.6%, an accuracy of 96.9%, an F1 Score of 96.9%, and outperformed the other state-of-the-art methods. Moreover, six experiments that combine different modalities were conducted. The obtained results show that the fusion of different modalities yields an improvement over individual ones.
In ongoing work, we will integrate the proposed method into an IoT-based pervasive system that allows early detection of COVID-19 patients from distance.
References
[1] | Alkhodari M. and Khandoker A.H. , Detection of covid-19 in smartphone-based breathing recordings using cnn-bilstm: a pre-screening deep learning tool, medRxiv (2021). |
[2] | Alqudaihi K.S. Aslam N. , Khan I.U. , Almuhaideb A.M. , Alsunaidi S.J. , Ibrahim N.M.A.R. , Alhaidari F.A. , Shaikh F.S. , Alsenbel Y.M. , Alalharith D.M. , Alharthi H.M. , Alghamdi W.M. and Alshahrani M.S. , Cough sound detection and diagnosis using artificial intelligence techniques: Challenges and opportunities, IEEE Access 9: ((2021) ), 102327–102344. |
[3] | Alshazly H. , Linse C. , Barth E. and Martinetz, T. , Explainable covid-19 detection using chest ct scans and deep learning, Sensors 21: (2) ((2021) ). |
[4] | Aly M. , Rahouma K.H. and Ramzy S.M. , Pay attention to the speech: Covid-19 diagnosis using machine learning and crowd sourced respiratory and speech recordings, Alexandria Engineering Journal 61: (5) ((2022) ), 3487–3500. |
[5] | Andreu-Perez J. , Pérez-Espinosa H. , Timonet E. , Kiani M. , Girón-Pérez M.I. , Benitez-Trinidad A.B. , Jarchi D. , Rosales-Pérez A. , Gatzoulis N. , Reyes-Galaviz O.F. , Torres-García A. , Reyes-García C.A. , Ali Z. and Rivas F. , A generic deep learning based cough 651 analysis system from clinically validated samples for point-of-need covid-19 test and severity levels, IEEE Transactions on Services Computing 15: (3), ((2022) ) 1220–1232. |
[6] | Biswas S. Chatterjee S. Sen S. Schwenker F. and Sarkar R. , Prediction of covid-19 from chest ct images using an ensemble of deep learning models, Applied Sciences 11: (15) ((2021) ). |
[7] | Brown C. Chauhan J. Grammenos A. Han J. Hasthanasombat A. Spathis D. Xia T. Cicuta P. and Mascolo C. Exploring automatic diagnosis of COVID-19 from crowd sourced respiratory sound data, CoRR abs/2006.05919 (2020). |
[8] | Chandra R. Jain A. and Singh Chauhan D. , Deep learning via lstm models for covid-19 infection forecasting in india, PLOS ONE 17: (1) ((2022) ), 1–28. |
[9] | Chetupalli S.R. Krishnan P. Sharma N. Muguli A. Kumar R. Nanda V. Pinto L.M. Ghosh P.K. and Ganapathy S. Multi-modal point-of-care diagnostics for covid-19 based on acoustics and symptoms (2021). |
[10] | Choodin I. Sutrisno S. Santoso N. Soebroto A.A. Hidayat N. and Rochman N.T. , Smart development of big data app for determining the modelling of covid-19 medicinal compounds using deep AI core engine system, Journal of Physics: Conference Series 1665: (1) ((2020) ), 012003. |
[11] | Chollet F. Xception: Deep learning with depthwise separable convolutions, In Proceedings of the IEEE Conference on Computer Vision and Pattern Recognition (CVPR) (2017). |
[12] | Coppock H. Gaskell A. Tzirakis P. Baird A. Jones L. and Schuller B. , End-to-end convolutional neural network enables covid-19 detection from breath and cough audio: a pilot study, BMJ Innovations 7: (2) ((2021) ), 356–362. |
[13] | Dong H. Ma S. Jia N. and Tian J. , Understanding public transport satisfaction in post covid-19 pandemic, Transport Policy 101: ((2021) ), 81–88. |
[14] | Dumka A. Chapter 8 - smart information technology for universal healthcare, In N. Dey, A.S. Ashour, C. Bhatt and S. James Fong, editors, Healthcare Data Analytics and Management, Advances in ubiquitous sensing applications for healthcare, Academic Press ((2019) ), 211–226. |
[15] | Effati M. Sun Y.-C. Naguib H.E. and Nejat G. Multimodal detection of covid-19 symptoms using deep learning probability-based weighting of modes (2021), 151–156. |
[16] | Elmuogy S. Hikal N.A. and Hassan E. , An efficient technique for ct scan images classification of covid-19, Journal of Intelligent and Fuzzy Systems 40: ((2021) ), 5225–5238. |
[17] | Farag H.H. , Said L.A. , Rizk M.R. and Ahmed M.A.E. , Hyperparameters optimization for resnet and xception in the purpose of diagnosing covid-19, Journal of Intelligent and Fuzzy Systems 41: ((2021) ), 3555–3571. |
[18] | Gemmeke J.F. , Ellis D.P.W. Freedman D. Jansen A. Lawrence W. Moore R.C. Plakal M. and Ritter M. Audio set: An ontology and human-labeled dataset for audio events, In Proc. IEEE ICASSP 2017, New Orleans, LA (2017). |
[19] | Gupta S. Shukla R.S. Shukla R.K. and Verma R. , Deep learning bidirectional lstm based detection of prolongation and repetition in stuttered speech using weighted mfcc, International Journal of Advanced Computer Science and Applications 11: (9) ((2020) ). |
[20] | He K. Zhang X. Ren S. and Sun J. Deep residual learning for image recognition (2015). |
[21] | He X. Yang X. Zhang S. Zhao J. Zhang Y. Xing E. and Xie P. Sample-efficient deep learning for covid-19 diagnosis based on ct scans, medRxiv 2020. |
[22] | Howard A.G. Zhu M. Chen B. Kalenichenko D. Wang W. Weyand T. Andreetto M. and Adam H. Mobilenets: Efficient convolutional neuralnetworks for mobile vision applications, (2017). |
[23] | Huang G. Liu Z. van der Maaten L. and Weinberger K.Q. Densely connected convolutional networks, In Proceedings of the IEEE Conference on Computer Vision and Pattern Recognition (CVPR) (2017). |
[24] | Iandola F.N. Han S. Moskewicz M.W. Ashraf K. Dally W.J. and Keutzer K. Squeezenet: Alexnet-level accuracy with 50x fewer parameters and <0.5mb model size (2016). |
[25] | Iwendi C. Bashir A.K. Peshkar A. Sujatha R. Chatterjee J.M. Pasupuleti S. Mishra R. Pillai S. and Jo O. , Covid-19 patienthealth prediction using boosted random forest algorithm, Frontiers in Public Health 8: ((2020) ), 357. |
[26] | Jayachitra V. Nivetha S. Nivetha R. and Harini R. , A cognitiveiot-based framework for effective diagnosis of covid-19 usingmultimodal data, Biomedical Signal Processing and Control 70: ((2021) ), 102960. |
[27] | Khan M.A. Alhaisoni M. Tariq U. Hussain N. Majid A. Damaševičius R. and Maskeliūnas R. , Covid-19 caserecognition from chest ct images by deep learning,entropy-controlled firefly optimization, and parallel featurefusion, Sensors 21: (21) ((2021) ). |
[28] | Khan M.U. Farman A. Rehman A.U. Israr N. Ali M.Z.H. and Gulshan Z.A. Automated system design for classification of chronic lung viruses using non-linear dynamic system features and k-nearest neighbour, In 2021 Mohammad Ali Jinnah University International Conference on Computing (MAJICC) (2021), 1–8. |
[29] | Kumar S. Chaube M.K. Alsamhi S.H. Gupta S.K. Guizani M. Gravina R. and Fortino G. , A novel multimodal fusion framework forearly diagnosis and accurate classification of covid-19 patientsusing x-ray images and speech signal processing techniques, Computer Methods and Programs in Biomedicine 226: ((2022) ), 107109. |
[30] | Lee S. Widyasari K. Yang H.R. Jang J. Kang T. and Kim S. , Evaluation of the diagnostic accuracy of nasal cavity andnasopharyngeal swab specimens for sars-cov-2 detection via rapid antigen test according to specimen collection timing and viral load, Diagnostics 12: ((2022) ), 3. |
[31] | Leli C. Di Matteo L. Gotta F. Cornaglia E. Vay D. Megna I. Pensato R.E. Boverio R. and Rocchetti A. , Performance of asars-cov-2 antigen rapid immunoassay in patients admitted to theemergency department, International Journal of InfectiousDiseases 110: ((2021) ), 135–140. |
[32] | Ma N. Zhang X. Zheng H.-T. and Sun J. Shuffle net v2: Practicalguidelines for efficient cnn architecture design, In Proceedings of the European Conference on Computer Vision (ECCV) 2018. |
[33] | Mahanty C. Kumar R. Mishra B.K. and Barna C. , Covid-19 detection with x-ray images by using transfer learning, Journal of Intelligent & Fuzzy Systems 5: ((2022) ), 1–10. |
[34] | Mohammed E.A. , Keyhani M.H. Sanati-Nezhad A. Hejazi S.H. and Far B.H. , An ensemble learning approach to digital corona viruspreliminary screening from cough sounds, Scientific Reports 11: ((2021) ). |
[35] | Mukherjee R. Kundu A. Mukherjee I. Gupta D. Tiwari P. Khanna A. and Shorfuzzaman M. IoT-cloud based healthcare model for COVID-19 detection: an enhanced k-Nearest Neighbour classifier based approach, Computing (2021). |
[36] | Nguyen-Trong K. Vu H.N. Trung N.N. and Pham C. , Gesture recognition using wearable sensors with bi-long short-term memoryconvolutional neural networks, IEEE Sensors Journal 21: (13) ((2021) ), 15065–15079. |
[37] | O’Halloran K.L. Tan S. Smith B.A. and Podlasov A. , Multimodalanalysis within an interactive software environment: critical discourse perspectives, Critical Discourse Studies 8: (2) ((2011) ), 109–125. |
[38] | Orlandic L. Teijeiro T. and Atienza D. , The COUGHVID crowdsourcing dataset, a corpus for the study of large-scale cough analysis algorithms, Scientific Data 8: (1) ((2021) ). |
[39] | Oyelade O.N. , Ezugwu A.E.-S. and Chiroma H. , Covframenet: An enhanced deep learning framework for covid-19 detection, IEEE Access 9: ((2021) ), 77905–77919. |
[40] | Pahar M. Klopper M. Warren R. and Niesler T. , Covid-19 cough classification using machine learning and global smart phone recordings, Computers in Biology and Medicine 135: (2021), 104572. |
[41] | Patel P. Bhadla M. Upadhyay J. Suthar D. and Darji D. , Predictive covid-19 risk and virus mutation isolation with cnn based machinelearning technique, In 2022 2nd International Conference onInnovative Practices in Technology and Management (ICIPTM) 2: ((2022) ), 424–428. |
[42] | Qayyum A. Ahmad K. Ahsan M.A. Al-Fuqaha A. and Qadir J. Collaborative federated learning for healthcare: Multi-modalcovid-19 diagnosis at the edge, (2021). |
[43] | Rao C. Narayanaswamy V. Esposito M. Thiagarajan J. and Spanias A. Deep learning with hyper-parameter tuning for covid-19 cough detection, In 2021 12th International Conference on Information, Intelligence, Systems & Applications (IISA) (2021), 1–5. |
[44] | Rashid H.-A. , Sajadi M.M. and Mohsenin T. , Coughnet-v2: A scalable multimodal dnn framework for point-of-care edge devices to detectsymptomatic covid-19 cough, In 2022 IEEE Healthcare Innovationsand Point of Care Technologies (HI-POCT) (2022), 37–40. |
[45] | Rathee G. Garg S. Kaddoum G. Wu Y. Jayakody D.N.K. and Alamri A. , Ann assisted-iot enabled covid-19 patient monitoring, IEEE Access 9: ((2021) ), 42483–42492. |
[46] | Sait U. K.V. G.L. Shivakumar S. Kumar T. Bhaumik R. Prajapati S. Bhalla K. and Chakrapani A. , A deep-learning basedmultimodal system for covid-19 diagnosis using breathing sounds and chest x-ray images, Applied Soft Computing 109: ((2021) ), 107522. |
[47] | Sethy P.K. , Behera S.K. , Ratha P.K. and Biswas P. , Detection of coronavirus disease (COVID-19) based on deep features and support vector machine, International Journal of Mathematical, Engineering and Management Sciences 5: (4) ((2020) ), 643–651. |
[48] | Shah P.M. Ullah F. Shah D. Gani A. Maple C. Wang Y. Shahid Abrar M. and Islam S.U. , Deep gru-cnn model for covid-19 detectionfrom chest x-rays data, IEEE Access 10: ((2022) ), 35094–35105. |
[49] | Shan F. Gao Y. Shi W. Shi N. Han M. Xue Z. Shen D. and Shi Y. , Abnormal lung quantification in chest ct images of covid-19 patients with deep learning and its application to severity prediction, Medical Physics 48: (4) ((2021) ), 1633–1645. |
[50] | Sharan R.V. and Moir T.J. , Acoustic event recognition usingcochleagram image and convolutional neural networks, Applied Acoustics 148: ((2019) ), 62–66. |
[51] | Sharma N. Krishnan P. Kumar R. Ramoji S. Chetupalli S.R. N.R., Ghosh P.K. and Ganapathy S. Coswara —a database of breathing, cough, and voice sounds for COVID-19 diagnosis, In Interspeech 2020. ISCA (2020). |
[52] | Singh N. Khan R.A. and Shree R. , Article: Mfcc and prosodic featureextraction techniques: A comparative study, International Journal of Computer Applications 54: (1) ((2012) ), 9–13. |
[53] | Soares E. Angelov P. Biaso S. Froes M.H. and Abe D.K. Sars-cov-2 ct-scan dataset: A large dataset of real patients ct scans for sars-cov-2 identification, medRxiv (2020). |
[54] | Steyn N. Plank M.J. Binny R.N. Hendy S.C. Lustig A. and Ridings K. , A covid-19 vaccination model for aotearoa new zealand, Scientific Reports 12: ((2022) ), 12. |
[55] | Szegedy C. Vanhoucke V. Ioffe S. Shlens J. and Wojna Z. Rethinking the inception architecture for computer vision, In Proceedings of the IEEE Conference on Computer Vision and PatternRecognition (CVPR) (2016). |
[56] | Tan M. and Le Q.V. Efficientnet: Rethinking model scaling forconvolutional neural networks, (2019). |
[57] | Tan M. and Le Q.V. Efficient net v2: Smaller models and fastertraining, (2021). |
[58] | Tan T. Das B. Soni R. Fejes M. Yang H. Ranjan S. Szabo D.A. Melapudi V. Shriram K. Agrawal U. Rusko L. Herczeg Z. Darazs B. Tegzes P. Ferenczi L. Mullick R. and Avinash G. , Multi-modal trained artificial intelligence solution to triage chestx-ray for covid-19 using pristine ground-truth, versus radiologists, Neurocomputing 485: ((2022) ), 36–46. |
[59] | Tang S. Hu X. Atlas L. Khanzada A. and Pilanci M. Hierarchical multi-modal transformer for automatic detection of covid-19, In 2022 5th International Conference on Signal Processing and Machine Learning (SPML 2022) (2022). |
[60] | Valin J.-M. A hybrid dsp/deep learning approach to real-timefull-band speech enhancement (2018). |
[61] | Vinod D.N. and Prabaharan S. , Data science and the role ofartificial intelligence in achieving the fast diagnosis of covid-19, Chaos, Solitons & Fractals 140: ((2020) ), 110182. |
[62] | Vrindavanam J. Srinath R. Shankar H.H. and Nagesh G. , Machinelearning based covid-19 cough classification models –a comparative analysis, In 2021 5th International Conference on ComputingMethodologies and Communication (ICCMC) ((2021) ), 420–426. |
[63] | Xia T. Spathis D. Brown C. Ch J. Grammenos A. Han J. Hasthanasombat A. Bondareva E. Dang T. Floto A. Cicuta P. and Mascolo C. COVID-19 sounds: A large-scale audio dataset for digital COVID-19 detection, In Thirty-fifth Conference on Neural Information Processing Systems Datasets and Benchmarks Track (Round 2) (2021). |
[64] | Xie S. Girshick R. Dollar P. Tu Z. and He K. Aggregated residualtransformations for deep neural networks, In Proceedings of theIEEE Conference on Computer Vision and Pattern Recognition (CVPR) (2017). |
[65] | YAMNet, Available at https://github.com/tensorflow/models/tree/master/research/audioset/yamnet. Date accessed: October 15 2022. |
[66] | Yeşilkanat C.M. , Spatio-temporal estimation of the daily cases of covid-19 in worldwide using random forest machine learning algorithm, Chaos, Solitons & Fractals 140: ((2020) ), 110210. |
[67] | Yu D. Wang H. Chen P. and Wei Z. Mixed pooling for convolutional neural networks, In D. Miao, W. Pedrycz, D. Ślzak, G. Peters, Q. Hu and R.Wang, editors, Rough Sets and Knowledge Technology, Cham, Springer International Publishing, (2014) , 364–375. |
[68] | Zardini H. Soltaninejad H. Ferdosian F. Hamidieh A.A. and Memarpoor-Yazdi M. , Coronavirus disease (covid-19) in children:Prevalence, diagnosis, clinical symptoms, and treatment, International Journal of General Medicine 13: ((2020) ), 477–482. |
[69] | Zhong G. Ling X. and Wang L.-N. , From shallow feature learning todeep learning: Benefits from the width and depth of deep architectures, WIREs Data Mining and Knowledge Discovery 9: (1) ((2019) ), e1255. |
[70] | Zhu Z. Xingming Z. Tao G. Dan T. Li J. Chen X. Li Y. Zhou Z. Zhang X. Zhou J. Dongpei C. Wen H. and Cai H. , Classification of covid-19 by compressed chest ct image through deep learning on a large patients cohort, Interdisciplinary Sciences: Computational Life Sciences 13: ((2021) ). |


