
Recurrent neural network based sentiment analysis of social media data during corona pandemic under national lockdown
Abstract
The Corona virus pandemic has affected the normal course of life. People all over the world take the social media to express their opinions and general emotions regarding this phenomenon. In a relatively short period of time, tweets about the new Corona virus increased by an amount never before seen on the social networking site Twitter. In this research work, Sentiment Analysis of Social Media Data to Identify the Feelings of Indians during Corona Pandemic under National Lockdown using recurrent neural network is proposed. The proposed method is analyzed using four steps: that is Data collection, data preparation, Building sentiment analysis model and Visualization of the results. For Data collection, the twitter dataset are collected from social networking platform twitter by application programming interface. For Data preparation, the input data set are pre-processed for removing URL links, removing unnecessary spaces, removing punctuations and numbers. After data cleaning or preprocessing entire particular characters and non-US characters from Standard Code for Information Interchange, apart from hash tag, are extracted as refined tweet text. In addition, entire behaviors less than three alphabets are not assumed at analysis of tweets, lastly, tokenization and derivation was carried out by Porter Stemmer to perform opinion mining. To authenticate the method, categorized the tweets linked to COVID-19 national lockdown. For categorization, recurrent neural method is used. RNN classify the sentiment classification as positive, negative and neutral sentiment scores. The efficiency of the proposed RNN based Sentimental analysis classification of COVID-19 is assessed various performances by evaluation metrics, like sensitivity, precision, recall, f-measure, specificity and accuracy. The proposed method attains 24.51%, 25.35%, 31.45% and 24.53% high accuracy, 43.51%, 52.35%, 21.45% and 28.53% high sensitivity than the existing methods.
1Introduction
In 2019, COVID 19 viral disease was formed; a number of patients infected from a wet seafood market at Wuhan, China. Then the infected patients are isolated and molecular analysis on pathogen is the novel corona virus (CoV) initially called 2019-nCoV, later WHO changed the name of this disease to COVID 19. Then the viruses have been spread all over the world, with almost every country fighting the virus and doing everything possible to reduce the spread of the virus as soon as possible. World Health Organization has announced as pandemic and they suggested vaccine engaged in the work of preparation. There are many academic studies that may guide researchers for learning the impact of pandemic on people’s mental health and on the world wide economie [1].
In the first week of March 2020, various countries such as China, Italy, Spain, Australia were fighting the COVID 19 pandemic via carrying severe measures, such as national blockade and containing the area where the risk of community spread was suspected. By consulting foreign counterparts, Indian government made a major national lockdown decision on March 25 for 21 days from March 26 to April 14, 2020. To control the virus spread it was extended until May 3 2020, it was known as lockdown 2.0. With easy curbs, until May 17, 2020 was known as lockdown 3.0. The next lockdown was launched on May 31, 2020, known as lockdown 4.0,the country was divided as zones, viz red, orange, green [2].
In India, the primary case was identified at Jan 30, 2020 in the state of Kerala. Outbreaks in India are categorized from the case group using the World Health Organization’s data report. Original source of transmission was linked to wholesale seafood market in China with bats being assumed the primary host of dangerous virus; while pigs or pangolins are considered as intermediary hosts [3, 4] Maximum number of infections in humans led to transmission theories as animals to humans. Chalked routes of transmission so far contain direct contact, fomite transmission, respiratory droplets, and faucal-oral transmission. Symptoms for fever, dry cough, diarrhea, nausea, giddiness, and abdomen pain are signs of infection virus [5–7].
India is essential for analyzing the spread as well as effect of corona virus in India. The micro-blogging website Twitter is used for analyzing the feelings of people of India. Though, feeling of Indians during the initial lockdown is often favored by few events such as hatred, anger and sadness [8–10]. It is necessary for the government to record the sentiment from time to time to take an essential action. Such actions or events impact a person’s sentiment ormental well-being. Authorities, after knowing the emotional state of the citizens, may mark beneficial policies for them. Additionally, e-commerce stakeholders may adjust based on its status and regulates supply and demand for products [11–13].
Nevertheless, it is negativity, fear, hatred and sadness on lockdown. Indians dependence government, also could have confidence, the government would successfully execute the curfew as well as ensure that no citizen fought for fundamentals during blockade together with necessary arrangements for it [14]. Few tweets express total surprise at this conclusion, other than in general, it seem that people expected a measure like the confinement to spread the virus, which is only possible via social distancing together with practice of hygiene measures.
Looking at COVID 19 statistics, the infection came from other countries and Indians recognize a drastic events are required in India for preventing rapid increase in numbers [15]. They use Twitter for examination. Tweets are scrutinized for measuring the feeling. Twitter sentiment analysis model is basically a classification model. The proposed method uses RNN for analysing the sentiment of people on the corona pandemic during the days of national lockdown. Tweets are removed by two prominent keywords called India Lockdown and India fights Corona from March 25 [16].
One of the rapidly developing research areas is sentiment analysis from social media data. It could play a significant role in case of medical emergencies, like COVID-19 pandemic. Several methods on sentiment classification of Social Media Data to Identify the Feelings of Indians during Corona Pandemic under National Lockdown were suggested. But the existing methods does not accurately classify the sentiment classification of twitter data also does not identify the human emotion. This can be motivated to do this research work.
The main contributions of this work are,
• Sentiment Analysis of Social Media Data to Identify the Feelings of Indians during Corona Pandemic under National Lockdown using RNN method.
• The COVID-19 tweets data set are analyzed using four steps: that is Data collection, data preparation, Building sentiment analysis model and Visualization of the results.
• For Data collection, the twitter dataset are collected from social networking platform twitter by application programming interface.
• For Data preparation, the input data set are pre-processed for removing URL links, removing unnecessary spaces, removing punctuations and numbers.
• After data cleaning or preprocessing entire particular characters and non-US characters from Standard Code for Information Interchange, apart from hash tag, are extracted as refined tweet text. In addition, entire behaviors less than three alphabets are not assumed at analysis of tweets, lastly, tokenization and derivation was carried out by Porter Stemmer to perform opinion mining.
• To authenticate the method, categorized the tweets linked to COVID-19 national lockdown. For categorization, recurrent neural method is used. RNN classify the sentiment classification as positive, negative and neutral sentiment scores.
• The efficiency of the proposed RNN based Sentimental analysis classification of COVID-19 is assessed various performances by evaluation metrics, like sensitivity, precision, recall, f-measure, specificity and accuracy.
• Finally, the efficiency of the proposed RNN method is compared with four existing methods: sentiment analysis of COVID-19 utilizing Novel fusion-based deep learning model (FB-DL) [17], Hybrid Heterogeneous Support Vector Machine (H-SVM [18], LSTM recurrent neural network (RNN-LSTM) [19], Majority Voting technique-based Ensemble Deep Learning(MVEDL) [20].
Remaining manuscript is structured as: section 2 presents the literature review, section 3 depicts the proposed method, section 4 proves the results with discussion, section 5 concludes the manuscript.
2Literature review
Sentimental analysis or opinion mining is a functional region of study in the field of natural language processing that analyzes individual’s opinion, sentiments, assumptions, perspectives, and feelings by means of computational treatment. LIWC utilizes an exclusive word reference of nearly 4,500 words sorted out of 76 classes, remembering 905 words and divided into two classes, positive feelings and negative feelings related to sentiment analysis. Turning point emerged in the application of sentiment analysis on social media data, which is increasing number of studies by several social media platforms for acquiring the sentiment of crowds [21]. It provides minimum accuracy.
To examine general sentiments in Twitter, 2381,297 related tweets are gathered in Turkish and English language. Turkish sentiments deemed note worthy, because Turkey greeting huge count of Syrian refugees, also first carried information in Turkish tweets that reflected the general perception of the refugee hosting country. It acts the relative sense analysis of rescued tweets. The outcomes represent the Turkish tweets sentiments are substantially varied from English tweets sentiments. Here, concluded the Turkish tweets have more +ve sentiments, besides, the huge count of English tweets through substantial margin contains neutral sentiments, which is imitated by -ve sentiments. The ratio of +ve sentiments in Turkish tweets is higher (35%), the ratio of English tweets has lesser +ve sentiments towards Syrians and refugees (12%).This method does not accurately classify the sentimental analysis.
Nilima et al., [22] presented an approach to investigate the psychosocial factors linked by national closure of COVID 19 in India. Online survey was carried out on 2020 Apr 11–16, at 28 states including 8 Union Territories. Contributors have employed by snowball sample process. The cross-section online survey was carried out every state in India. The spatial analysis were done, also Moran’s I statistic were utilized for exploring the entire clustering positions. The exact assessments of fisher’s have been employed for examining. GeoDa with R console was deemed for assess the data. Here, get 1316 responses. Significant involvement was noted in the fact that locking operations and militant government strategy, job profile and physical activity are associated to psychosocial impact. The public health administrators assume community sentiments when planning methods related to pandemic. The presented study helps lawmakers to emphasize the psychology of people along physical condition. The major intention was to assess the psycho-social aspects related to COVID-19 and nationwide lockdown utilizing the spatial analysis. It achieves higher recall with maximum mean
Kandasamy et al., [23] presented that conceptual processing and emotional analysis would fascinate inter-disciplinary investigation. Social media network evaluation, social media absolute volume text obtainable for emotional analysis, was multiplied by many, resulting in a formidable corpus. Tweet sentiment analysis plays out for gauging public opinion on several policies, legislation, personality, social movements. In sentimental analysis of twitter data, fuzzy logic has been utilized where neutrosophy, which takes into account the perception of indeterminacy was not utilized for analyzing tweets. With the help of 2 positive, 3 intermediate and 2 negative members, the multi-refined neutrosophic set was presented. In tweets sentiment analysis such as single value neutrosophic set (SVNS), triple refined indeterminate neutrosophic set (TRINS) together with MRNS were utilized for 10 dissimilar topics. Eight of these topics were selected for emotional investigations that linked the two topics towards the Indian scene and International scene. Comparative investigation method displays, which MRNS methods gives the best refinement of current data.
Gupta et al., [24] have presented a sentiment analysis of tweets posted by Indian citizens was analyzed utilizing natural language process and machine learning (ML) classifiers. The main aim was to control Indian citizen’s sentiments by nationwide lockdown implemented by the government of India to less spreading of Corona virus. Taking decisions of removal of safe zones were become dangerous for keeping the people’s sentiments under control. A total of 12 741 tweets having “India lockdown” around April 5 to 17, 2020 were mined. Data was extracted from Twitter utilizing Tweepy API, annotated utilizing Text Blob along VADER lexicons, also preprocessed utilizing the natural language tool kit called Python. Research achieved 84.4% greatest accuracy including Linear SVC classifier, unigrams. The presented research states that many Indian citizens were supported the decision of lockdown which were implemented by the Indian government during the outburst of corona.
Basiri et al., [25] presented the sentiment forecast methods were frequently utilized to allocate numeric scores to free-text assess printed through people on online assess websites. To take advantage of textual content fine-grained structural information, assess can be viewed from sentence collection, everyone with their own sentimental orientation and punctuation. Thus, a method score aggregation was required for combining sentence-level scores to the general review grade. While the recent operations focus on designing effectual sentence-level forecast techniques, issue of getting well-organized algorithms of score aggregation. Based on existing technique investigation, the suggested novel scores aggregation technique in terms of Dumpster-Shafer theory of evidence. Here, initially noticed the review polarity using ML strategy as well as considering the sentence scores as a proof for general ratings of assess. Outcomes from two public data sets from the social web display the highest performance of the presented technique compared to existing techniques.
Islam et al., [26] presented COVID 19 added to mental distress around the world. COVID 19 connected to psychological troubles that reports on numerous countries, together with Bangladesh. It was a lack of studies of access to COVID 19 linked to human stress with their association through another relevant factor that affect the quality of life in country and that were investigated at current study. An online survey conducted between 340 adult populations of Bangladesh using sociodemo graphic data, probable stress of human owing to COVID 19. The dataset was analyzed during statistical tool set. Around 85.60% were participants who were in stress related to COVID 19, resulting in lack of sleep, short temper together with chaos at family. Due to COVID 19 infection, hampered programmed study plan, financial future and career uncertainty were recognized as top cases of human stress. Principal component analysis (PCA) and CA component analysis outcomes exposed a major interface between the perception of responses and human stress factors that coincided with the current scenario in the country. It was necessary to execute care tracking policy at country that can helps at management of pandemics, and nurture a positive public mental health for combating the psychological challenge related to COVID 19.
Avasthi et al., [27] have presented a sentiment analysis for gaining insight in to COVID-19 crisis. To ensure the spread of virus in minor effect, various actions and rules were taken by the government. Moreover, a major challenge was taken for monitoring the patient’s mental condition. However, the basic anxiety were to keep them adjust with aspects, such as immediate changes in their daily life, rules of lockdown, entire rate of economy. Twitter, data were utilized for analyzing the topic throughout text corpus. The gathered tweet was employed for gaining the insights in the feelings of people, how they respond to actions during the situations of pandemic.
Grifoni et al., [28] have analyzed most of 17K We Ibo publications as January 13, 2020 to January 26, 2020. Analyses were depend on recognizing the psychological profile of users in terms of Online Ecological Recognition and learning models predictive automatic, and as a result recognize the user emotions. The outcome implies noticeable decrease in life fulfillment along raise in –ve feeling.
Medford et al., [29] presented that twitter was most widely utilized platforms and rich medium for analyzing various factors in population, like public sentiments, public response for situation around world, predicting disease outbreaks, etc. The posts on Twitter through January 14, 2020 and January 28, 2020 associated to Covid-19 were removed to know the feelings changes amid people about Covid-19. Tweets of negative emotions have been viewed in the shaving area at greater number of reported cases. Sharma et al., [30] have intended dashboard, which recognizes misinformation created spread regarding Covid-19, user reactions toward several emergency policy, feelings from across the country, etc., and shows them on dashboard. Taking into account, significance of posts at Twitter, Dataset was too unpredictable to give information on public response to pandemic in multiple countries along languages. Around 364,000 Twitter posts were extracted and analyzed during December 31, 2019 to February 6, 2020 to forecast the Covid-19 outbreak. It was viewed, which any tweets around the world was direct proportional to the direction of number of cases that reports on the nations. Correlations were viewed among nature of terms utilized at publications together with publications respective sentiments. They were classified in two classes: controversial and uncontroversial by LDA topic models together with analysis outcomes denoted that records by controversial words shows greater level of negative emotions through January 28, 2020 and April 9, 2020
3Methodology
This section defines a detailed description of the proposed methodology. COVID 19 causes death, agony, chaos. For analyzing the results, few tasks are carried out. Such tasks may support to understand and extract insights from COVID 19 data, there by controlling the spread of the virus across the country. Another factor causing the virus means the impact of particular socio-economic aspects is intervened through the spreading rates of virus, which is recognize potential behaviour with socio-economic risk factors for infections and feelings, viz fear, joy, anger, sadness. They have five dissimilar tasks that were done below,
1. Forecast the corona virus spread in the region.
2. To analyze the development rates and mitigation types in the countries.
3. Forecast the epidemic will end.
4. To analyze the virus transmission rate.
5. Correlate corona virus and weather conditions [31].
Lockdown 2.0 period is noticeable by event trends like AarogyaSetu app usage, challenge of wearing your mask and motivational song of well-known Indian personalities, mass gatherings of spiritual purposes, seasoning country’s corona virus warriors, such as policemen, doctors, and health personnel, and special trains facilitation for transition of trapped workers locked up to its places of origin. A total of 29,554 lockdown 2.0 tweets are collected as social networking platform twitter by application programming interfaces (APIs). A 47,672 tweets are together to 3rd block with analysis by “syuzhet” package at penny of emotions, called positive and digest. The flow process to get such sentiments and feelings is displays at Fig. 1 [32].
Fig. 1
Flow chart for sentiment analysis.
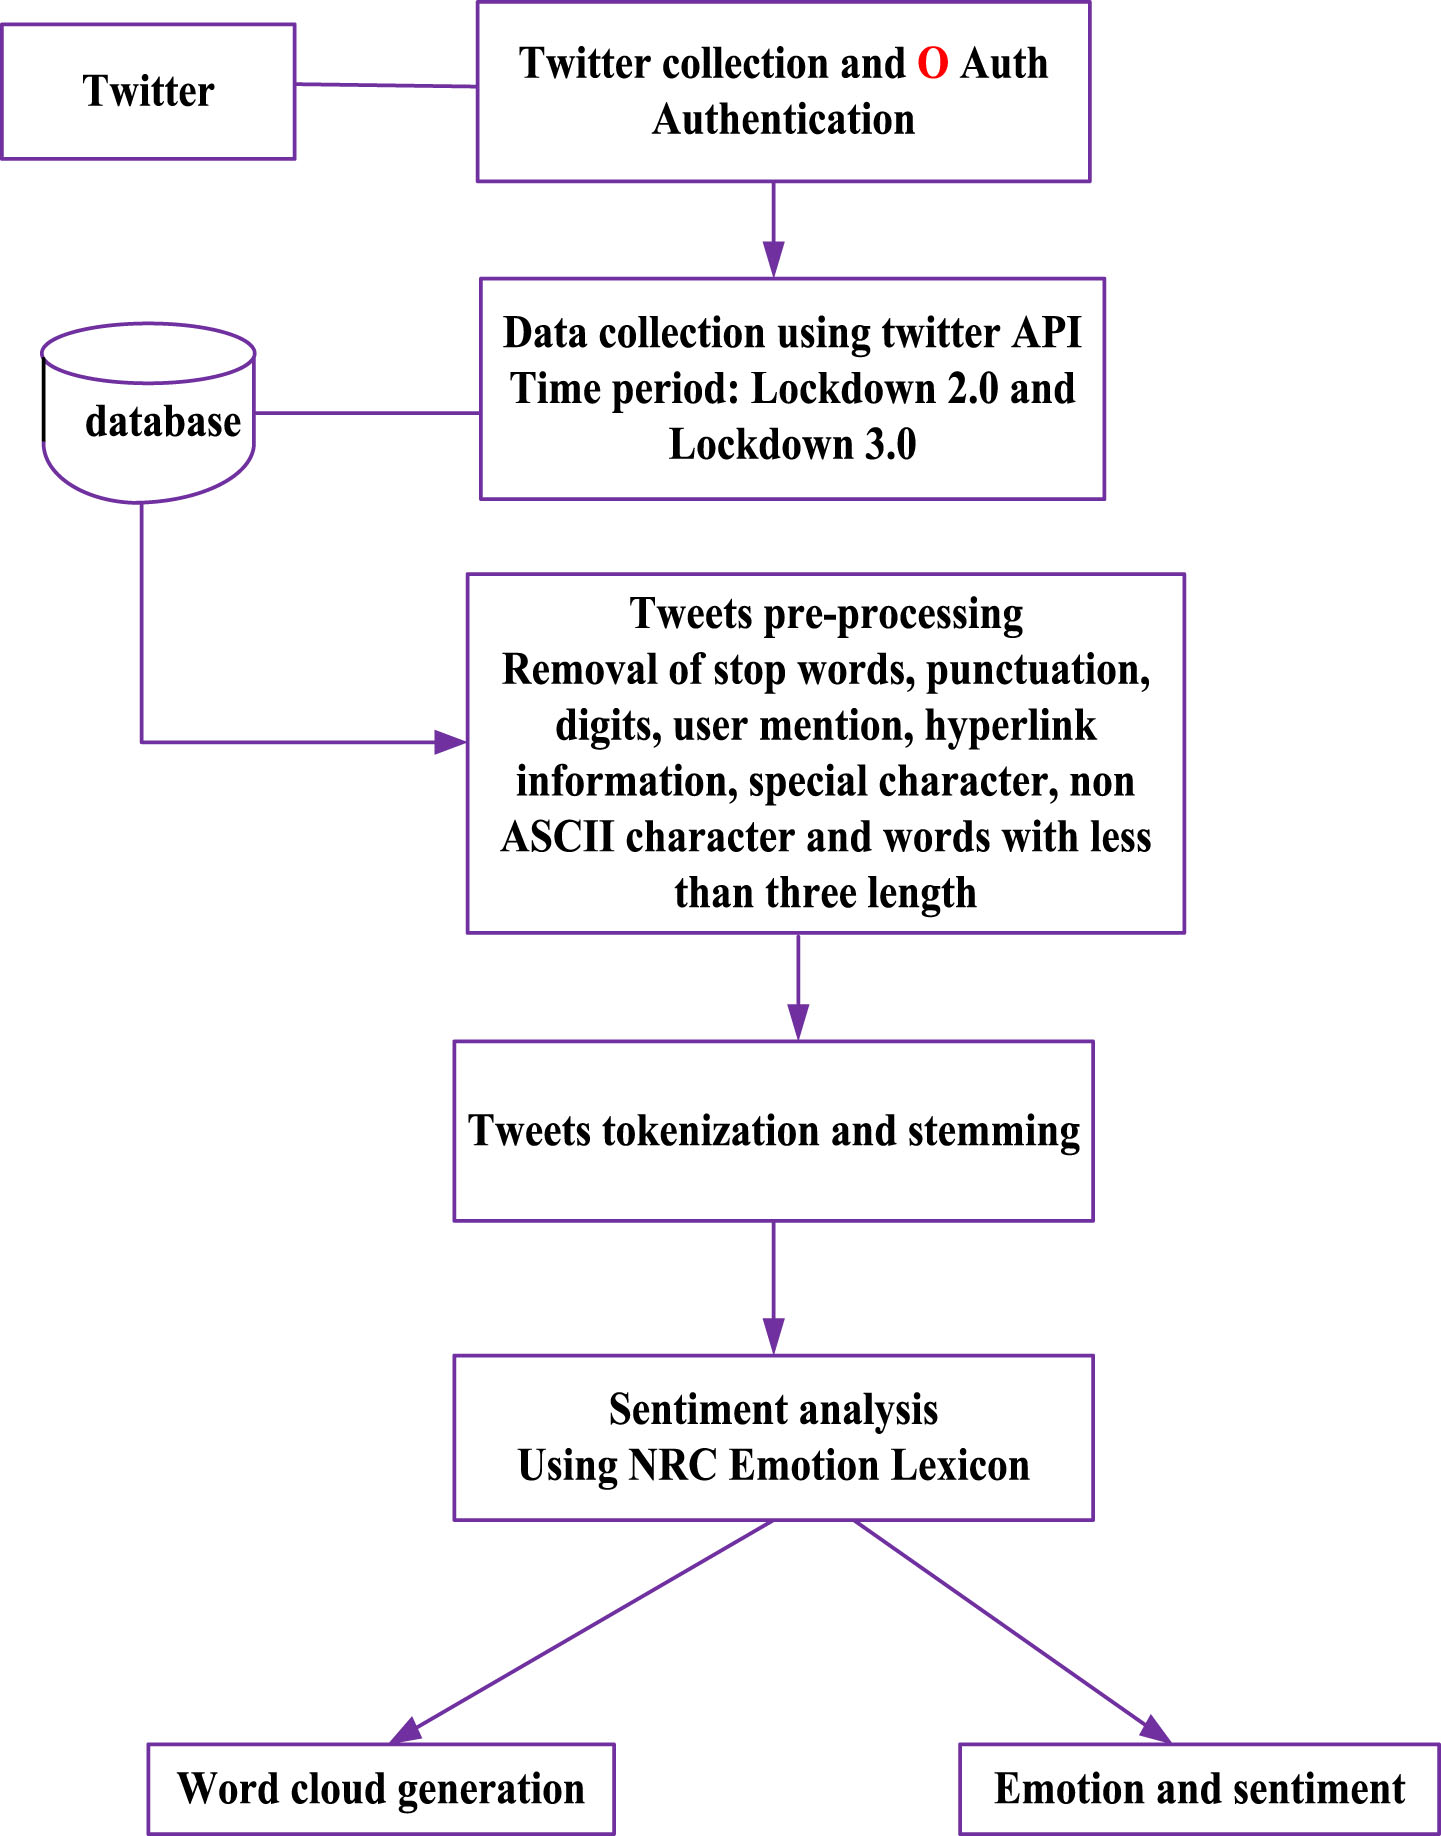
An overall 47,672 tweets gathered for 3rd lockdown, then examined by ‘syuzhet’ package in R for presence of emotions, viz fear, joy, sadness.
After pre-processing tweets, National Research Council Canada (NRC) analyzed a lexicon of emotions that can identify the Indians perceptions in eight different sensitive with two feelings through its period. Therefore, every tweet may be falling into different sensitive and feelings. As part of pre-processing the user mentioned hyperlink information is extracted as tweets. After that entire particular characters and non-US characters from Standard Code for Information Interchange, apart from hash tag, are extracted as refined tweet text. In addition, entire behaviors less than three alphabets are not assumed at analysis of tweets, lastly, tokenization and derivation was carried out by Porter Stemmer to perform opinion mining [33].
There are four main steps in the tweets analysis process, which has been followed in the work,
• Data collection
• Data preparation
• Building sentiment analysis model
• Visualization of the results
3.1Data collection
India ranks eighth in the world with more than 300 thousand active cases (before the 2ndwave). India had a peak around in the middle of Sep 2020 nearly 100 thousand cases reported daily, which step by step diminished around 11 thousand cases daily at the end of Jan 2021, then it was raising slowly. At Mar 2021, the cases started rapidly rising. India had 47,000 newly cases that moved towards a 2nd peak. The dataset for this study are the tweets from various states of India. There are two main types of tweets that are extracted from Twitter namely, current and historical tweets. Current tweets are helpful to track keywords or hash tags at real- time and the other can be used to search the past tweets during a predefined time frame. The tweets from Twitter were obtained using Twitter API for two periods they are,
1. March 20, 2020 to March 27, 2020 that is the early days of the National lockdown
2. March 27 2020 to May 3, 2020 a month after the lockdown
The tweets were obtained from Twitter based on latitude and longitude for the following locations for the keywords COVID 19 and Corona in India for both periods as shown in Table 1 and Table 2. A total of 6376 and 12752 tweets were obtained for both periods [34].
Table 1
Period 1
| Location | Total tweets requested |
| New Delhi | 1000 |
| Chennai | 1000 |
| Kolkata | 1000 |
| Mumbai | 1000 |
| Kerala | 1000 |
| India | 2000 |
Table 2
Period2
| Location | Total number of tweets |
| New Delhi | 1000 |
| Chennai | 1000 |
| Mumbai | 1000 |
| Kolkata | 1000 |
| Kerala | 1000 |
| India | 1000 |
A total of 6376 tweets along with re- tweets were obtained in the first period and around 6804 tweets were extracted in the second period, this data set contains the tweet text, author name, re-tweets, location, language, timestamp and other attributes
The initial effort is created to survey investigations in terms of open data source sets related to COVID-19 pandemic. Researcher analyzed using techniques of Artificial Intelligence for data acquisition, segmentation, COVID-19 diagnosis. It did not focus on papers that using publicly obtainable data sets. It could not aspect the Artificial Intelligence (AI) applications of COVID-19 epidemiology and psychology dataset. Rather, a comprehensive overview of COVID-19 open source survey data details using artificial intelligence and statistical methods. Any survey can able to assist the investigations to identify the proper open source data sets. The datasets are compared based on application, type, and size unequal items that give precious information on dataset selection. Furthermore, we highlight future investigation directions based on missed investigation opportunities including missing data sets as a result of which the investigation community may operate on public availability of data [35].
Addition from the current context of the infection necessarily requires a fast publication process. Moreover, non-peer-reviewed study inclusions are supported through its transparent open source techniques that may be separately established. A total of 6376 tweets along with re- tweets were obtained in the first period and around 6804 tweets were extracted in the second period, this data set contains the tweet text, author name, re-tweets, location, language, timestamp and other attributes. Consolidated outlook of taxonomy of open source COVID-19 data sets is demonstrated at Fig. 2.
Fig. 2
Taxonomy of COVID-19 open-source data sets.
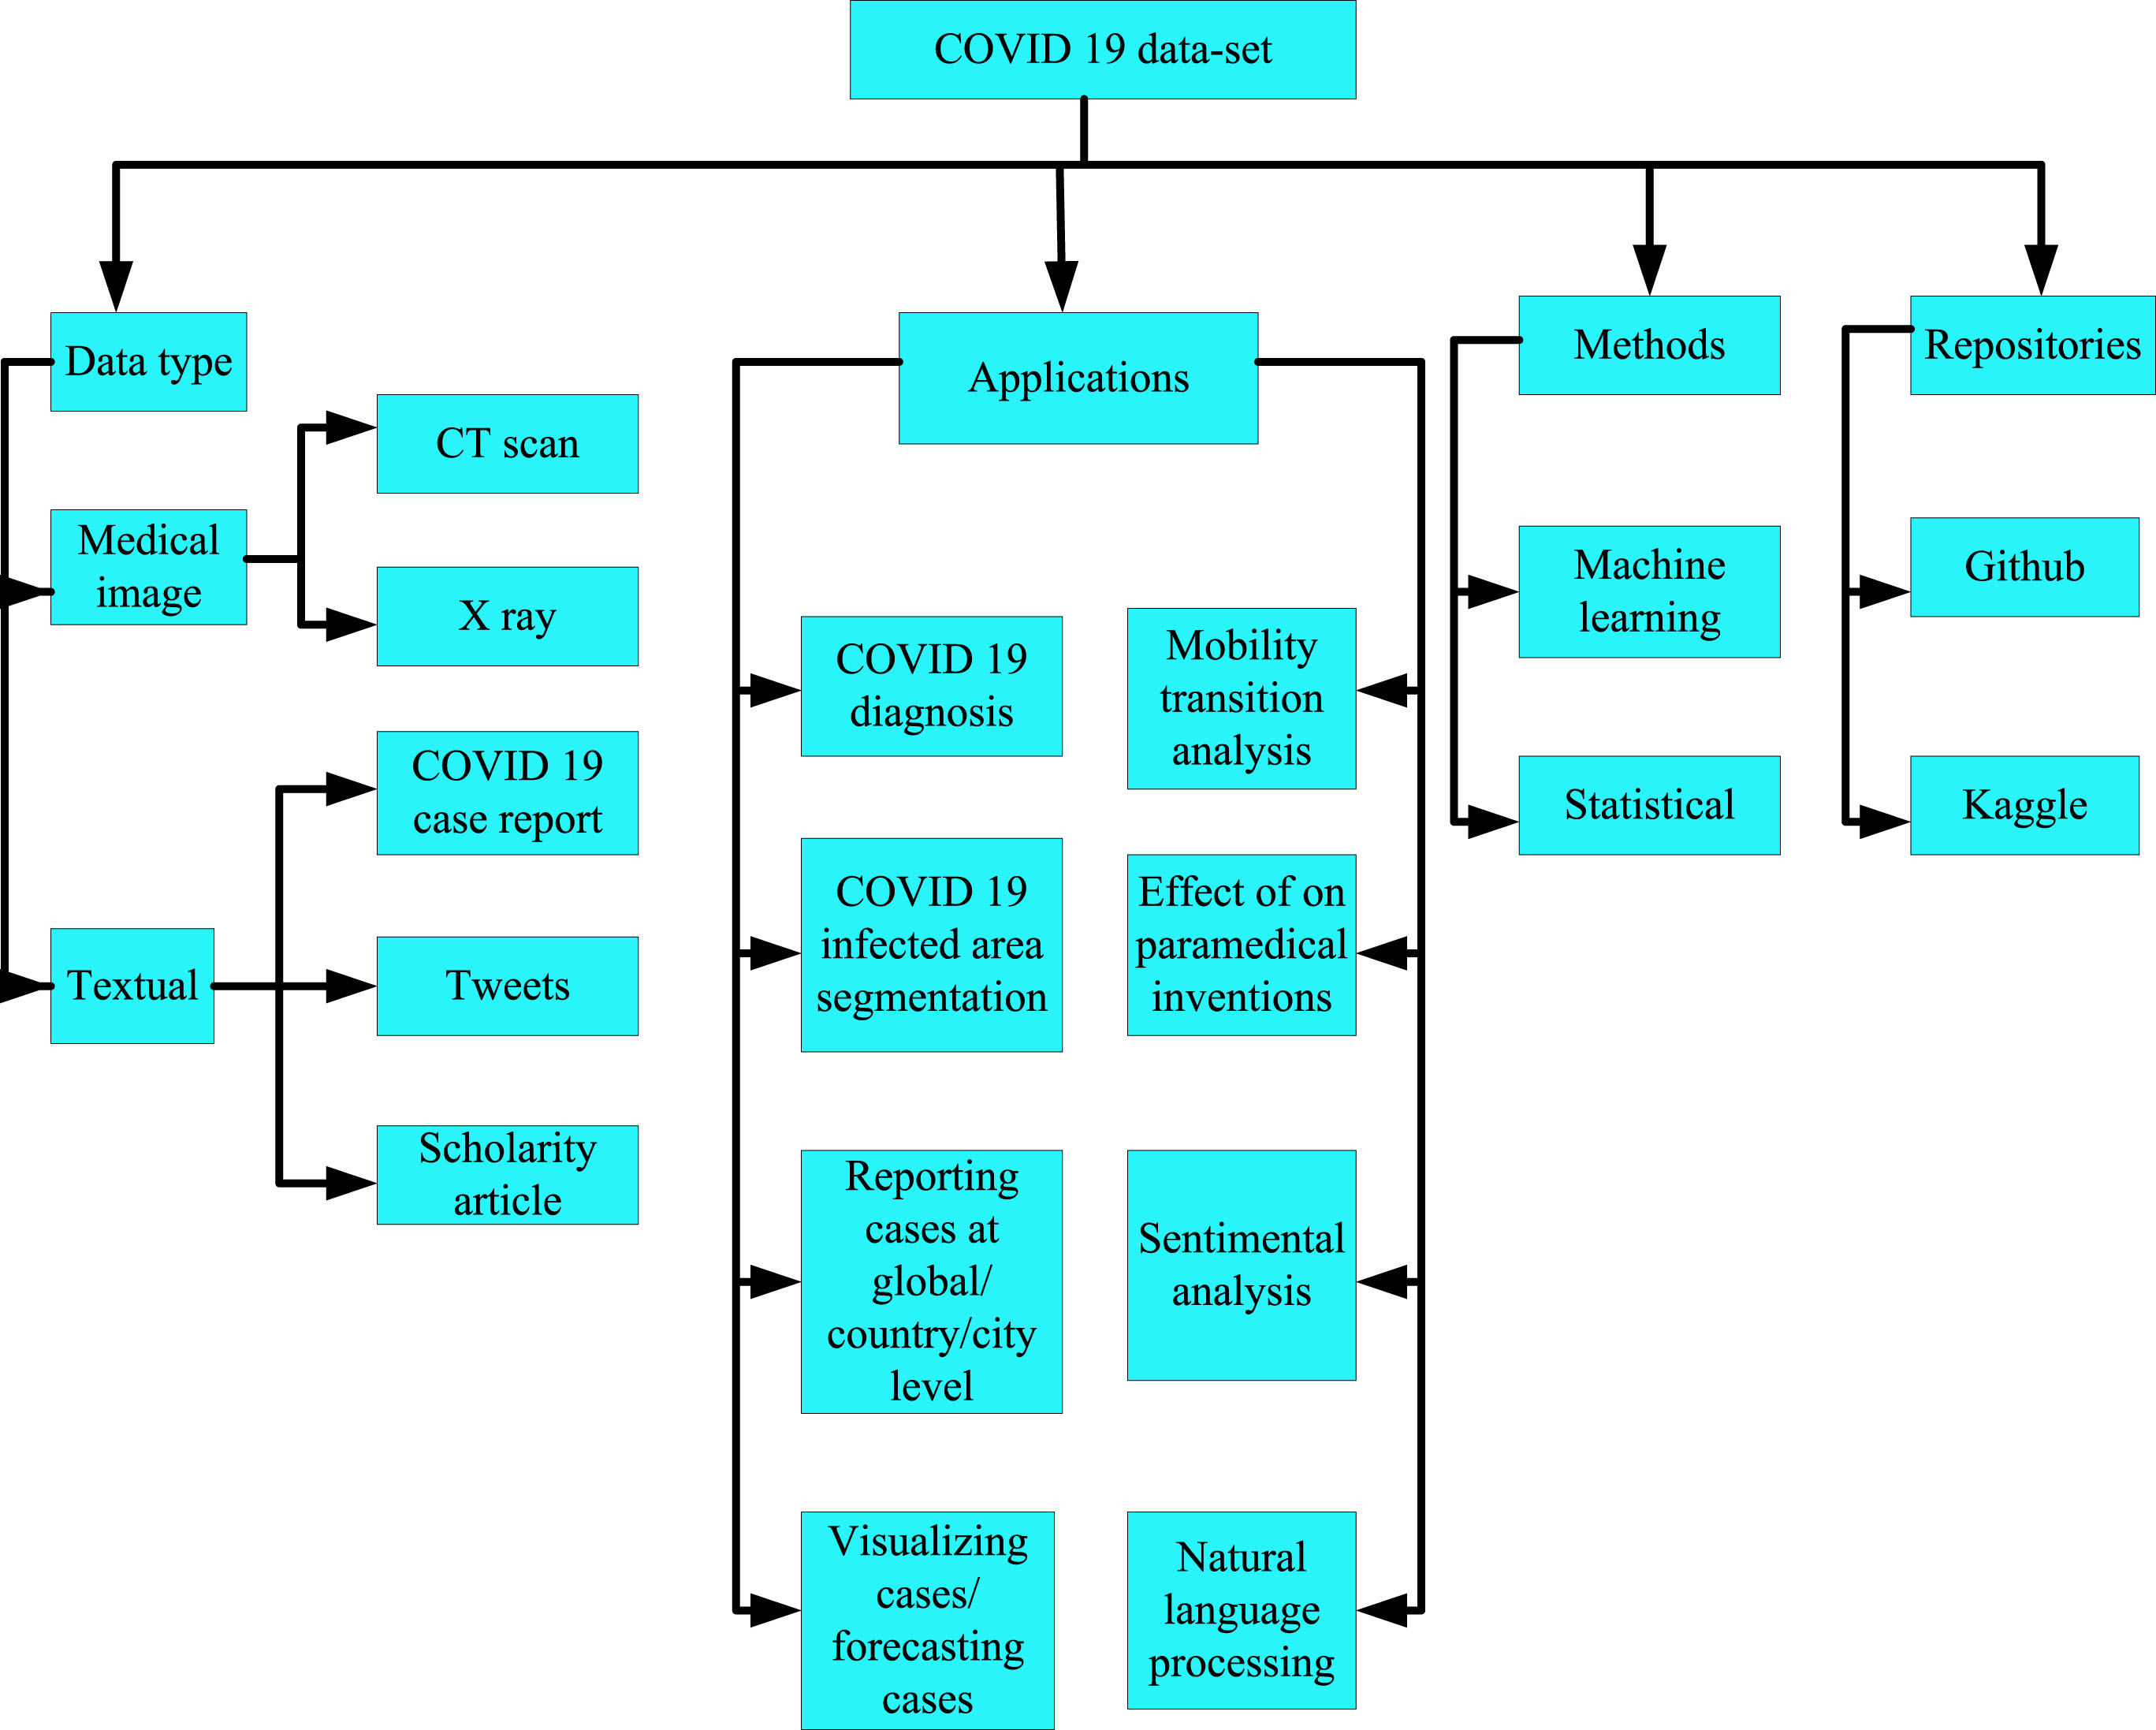
The data sets are separated into two major types: (i) medical images, (ii) textual data. Data sets depend on medical imaging are put in service primarily for detection and COVID-19 diagnosis. Clinical imageries are chest CT scan/ X-rays. Clinical imaging datasets must assume the approval of patient for preserving patient secrecy. Diagnosis based on clinical imaging reduces the burden of conventional screening based on PCR. Text databases serve 3 major intentions: forecasting the transmission, spread of COVID-19 in terms of reported cases, analysis public emotion / opinion / extracting keywords linked to COVID-19 in popular social media platforms [36].
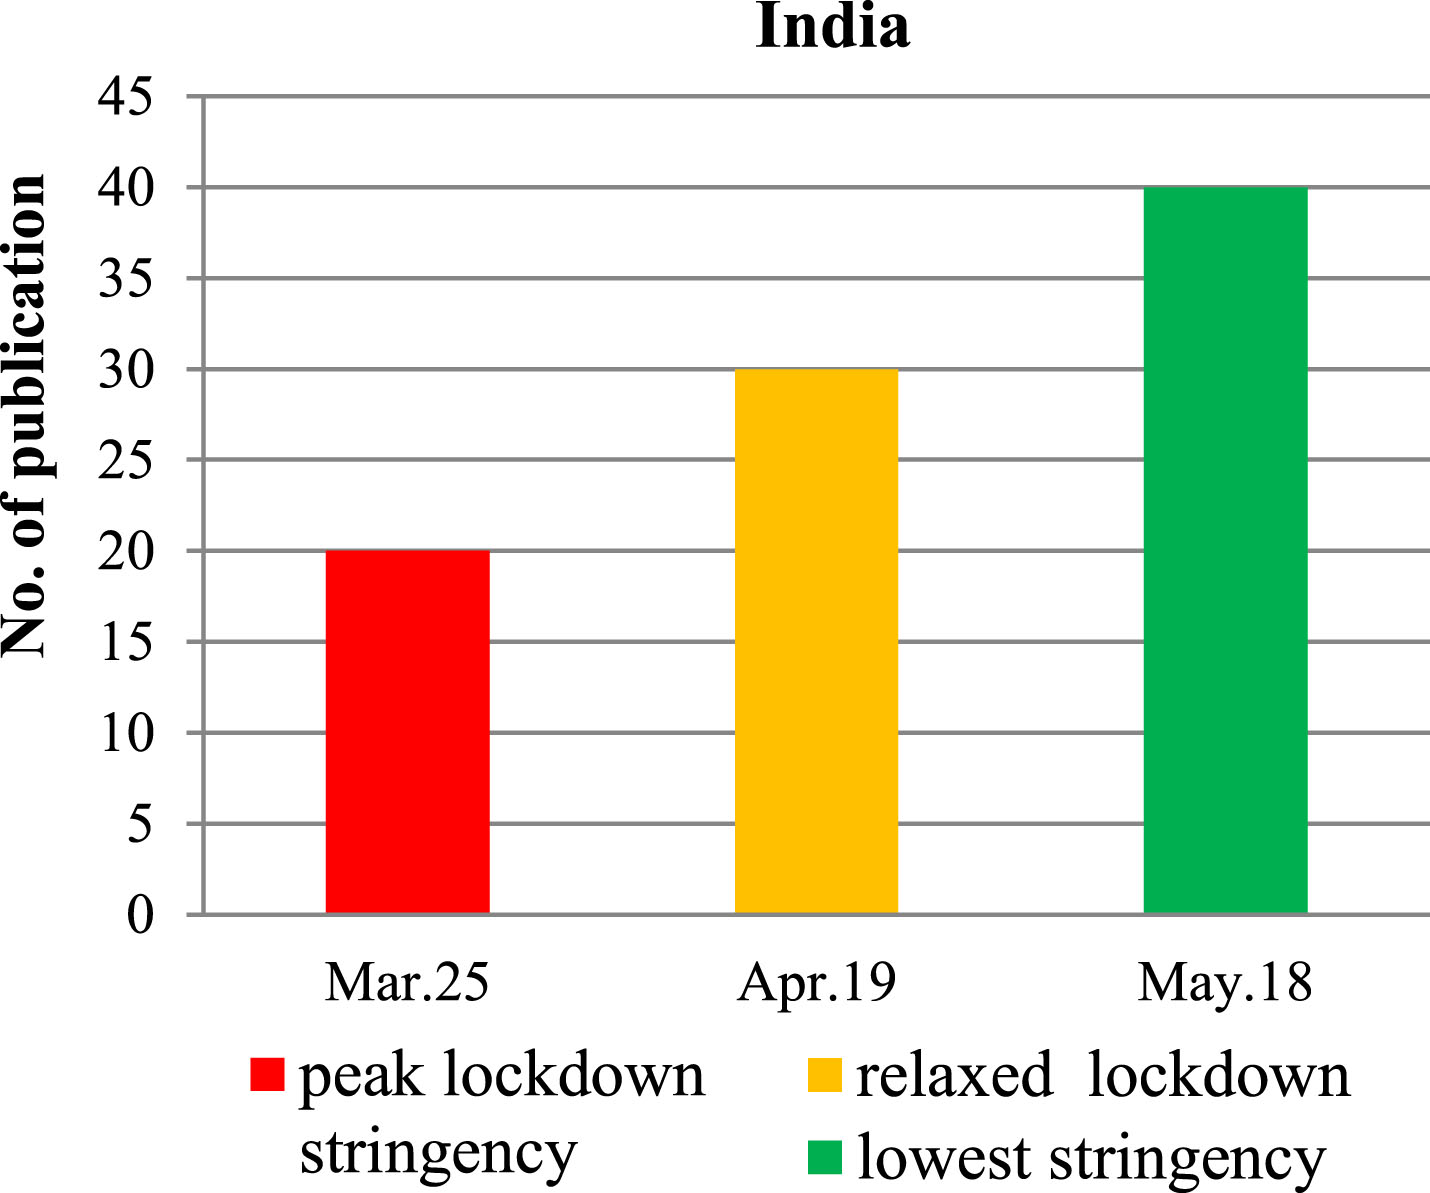
This graph shows the count of daily cases together with cumulative count of tests conducted per confirmed case or chosen countries around 50,000 cases. The peak lockdown stringency was specified by red line, orange line specifies when it was relaxed, green line specifies when lower stringency. Stringency is measured by Oxford University depending on 17 indicators, like school closing. Figure 3 shows the daily cases and the cumulative number of test cases.
Fig. 3
Daily cases and the cumulative number of test cases.
3.2Data preparation
This method involves pre-processing and cleaning the tweets for further analysis. Preprocessing the tweet dataset has task series in extracting entire types of unrelated information such as emojis, particular characters, additional blank spaces. It may also make formatting development, deleting copy tweets or tweets, which are less than three characters. The following cleansing activities were performed on the tweet datasets. Figure 4 shows the structure of data preparation.
Fig. 4
Structure of data preparation.
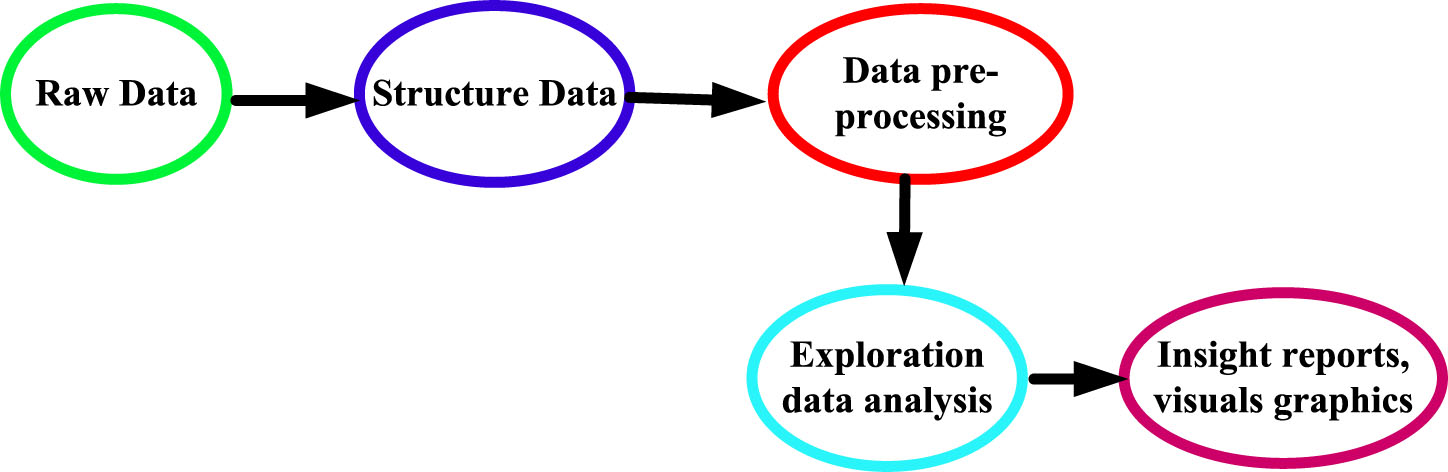
• Removal of URL links
• Removal of unnecessary spaces
• Removal of punctuations and numbers
• Removal of emojis and special characters
• Removal of the words in the other languages
The other pre-processing includes natural languages processing activities such as stemming, vectorization and term document matrix. Vectorization produces a spare matrix representing all words as a number and frequency of each word. Then the term frequency and inverse document frequency matrices are obtained.
Data preparation is a significant part of data science. It involves two concepts, such as data cleansing and function engineering. Both of these are required higher accuracy and performance at machine learning together with deep learning [37].
Data preparation is required due to the presence of raw real word data. The majority of real world data is made up of,
• Inaccurate data
• The presence of noisy data
• Inconsistent data
3.2.1Inaccurate data (missing data)
It has a lot of reasons for missing data, like data not being together continuously, data input error, technical issues, by biometric which require proper data preparation.
3.2.2Presence of noisy data (erroneous data and outliers)
Reason for noisy data existence should be technological issue of gadget collecting data, human error through data entry.
3.2.3Inconsistent data
Due to inconsistencies in data such as duplication of data, the human data entry contains errors in codes or names that violate the data restrictions and necessitates data preparation and analysis [38].
3.2.4Machine learning approach
A Machine Learning Approach is used for text classification, which examines the data is deemed as positive, negative or neutral, also it extracts the features of that model the variation amid the multiple classes and construes, a function is employed for categorizing new cases are hidden. The ML process with text classification is specified as: data pre-processing, feature generation, feature selection, learning approach, model evaluation. This is a general practice to acts data pre-handling before utilizing any sentiment classification approach. Data pre-handling allows making a higher quality text classification as well as lessening the computational complexity. Typical pre-preparing approach combines with parts-of-Speech tagging, stemming with lemmatization, stop-words elimination, tokenization. Features are content traits which is precious for catching few information patterns. The most well-known feature utilized as part of machine learning classification is the nearness or the recurrence of n-grams extricated amid the pre-processing step. In situations where the content length varies incredibly, the use of term frequency (TF) and inverse document frequency (IDF) measurements may be mandatory. In short messages such as tweets, however, words will probably not rehash within one instance, making the double measure of presence as instructive as the counts. Sentiment score computation is the vast process of feature creation. Sentiment computation computes the opinion of a given text from the polarity of words/phrases present in that text. The opinion score of the text can be processed as the normal of the polarities passed on by each of the words in the text. The general thought is to calculate a sentiment score for every tweet, So it would be known how positive or negative.
3.3Building a twitter sentiment analysis model
Almost 80% of world’s digital data is shapeless, and high part of it includes social media data. Sentiment analysis tools employ machine learning with natural language processing to automatically organize unstructured text data. Sentiment analysis algorithms can learn as data samples for detecting the tweets polarity at real time. All that needs to be done is to train sentiment analysis models for recognizing sentiment at tweets. The major benefits of Twitter sentiment analysis are,
• Real time analysis
• Scalability
• Consistent criteria
Twitter sentiment analysis model is basically a classification model [39]. The dataset are divided into training and testing sets with class labels assigned manually for each tweets. Analyzing emotion in twitter data involves numerous steps,
• Collect twitter data
• Arrange your data
• Generate a sentiment analysis model
• Visualize your outcomes
The class labels are one of the three polarities viz, positive, negative, neutral. This kind of model is used to predict the sentiment or polarity of the new unknown tweet. Figure 5 shows the general steps involved in sentiment analysis. Since goal of this investigation is to analyze the sentiments we have used various R packages to analyze the overall sentiment of Indian people during the corona pandemic [40].
Fig. 5
Sentiment analysis model.
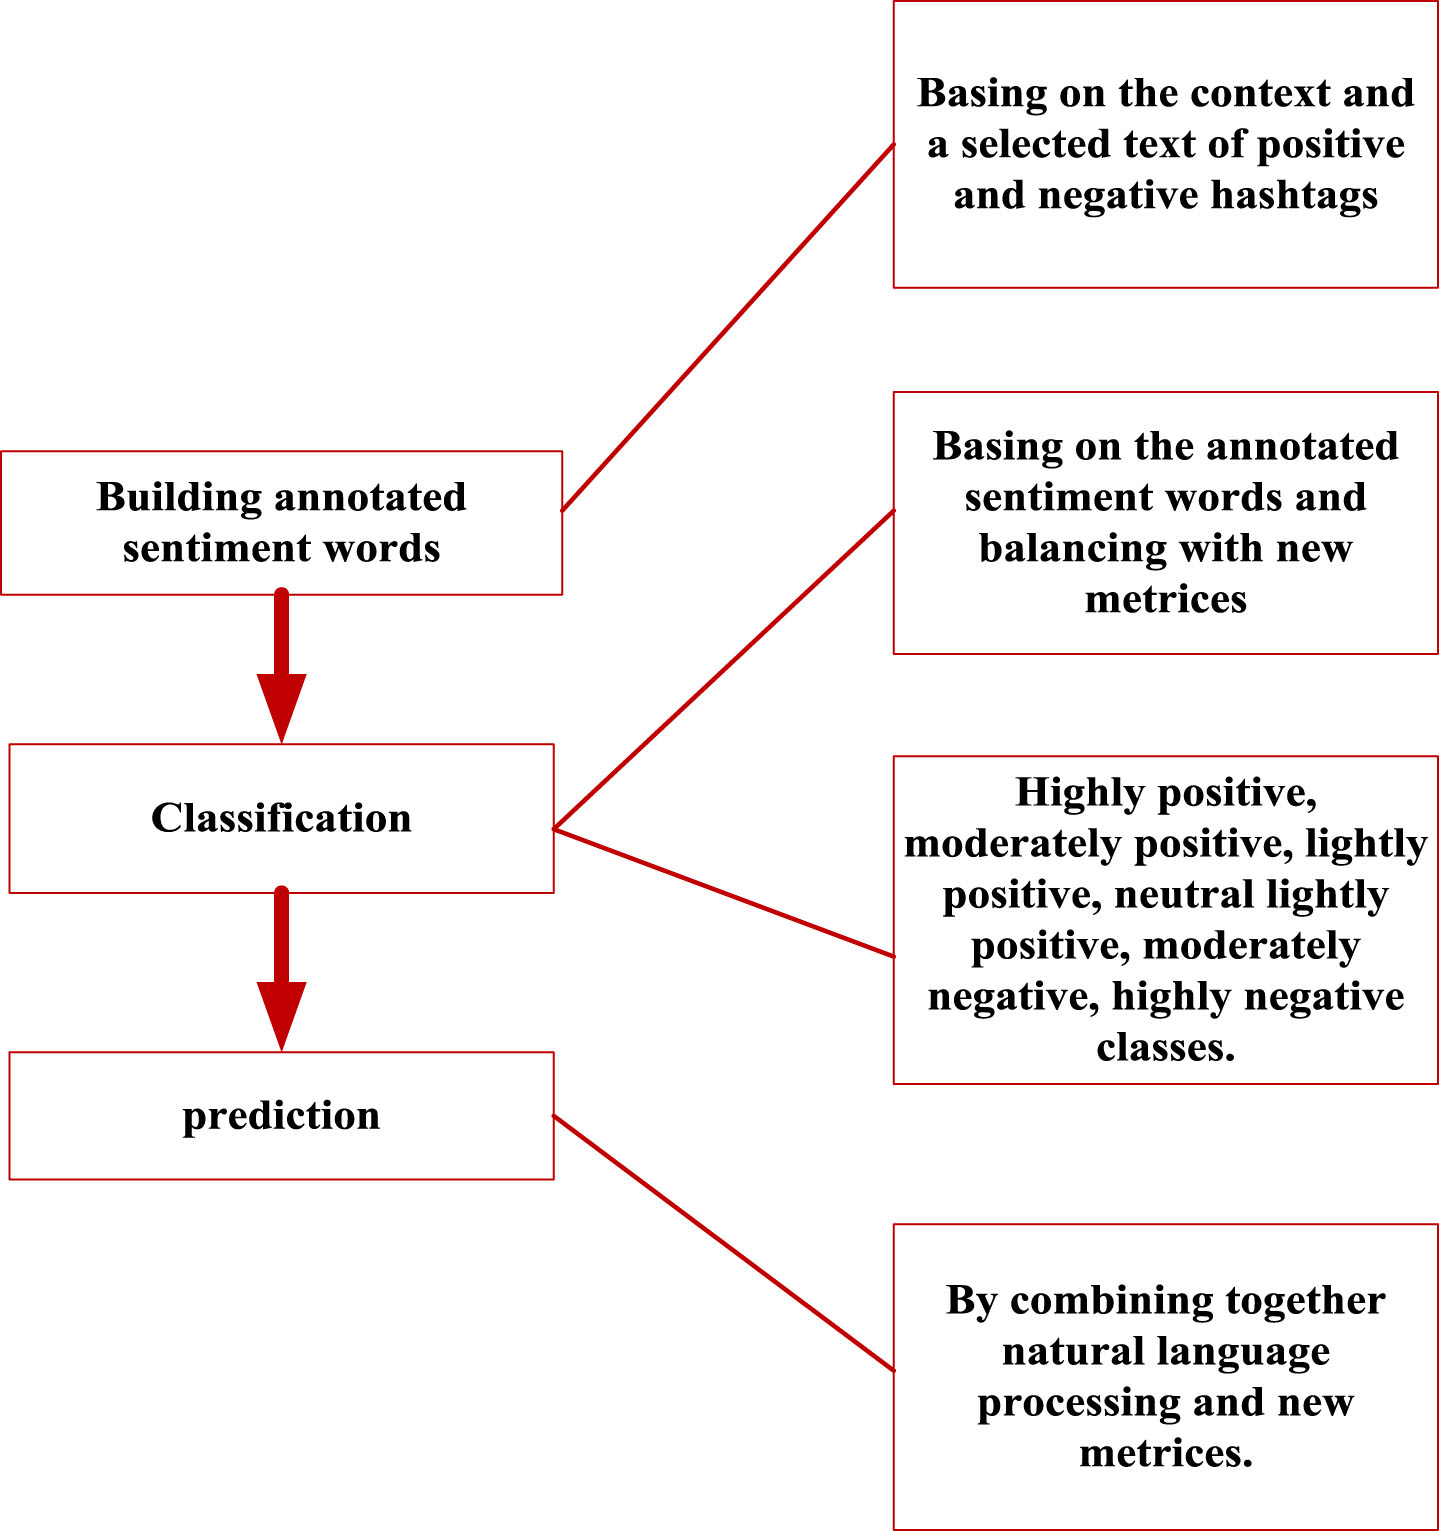
Twitter sentiment analysis model is basically a classification model.
3.4Recurrent Neural Networks (RNN)
The features of the COVID 19 data’s are given to the Recurrent Neural Networks (RNN) that contains artificial neurons including one or more than one feedback loops. This RNN is employed for predicting the sentiment analysis of COVID19.To train the recurrent neutral network, the input and target data having training dataset that feds in NNs input layer utilizing back-propagation along stochastic gradient descent for adjusting the node biases including edges weights. The results of NN are likened to the anticipated outcomes. Then, the alteration amid the final and anticipated result is measured, also its result is propagated backward via every node from the output to input layer.The reiteration procedures carry on until matches the final output with the anticipated outcome, whereas the training error lessens until to sufficient state. A simple recurrent neural network has 3 layers: input, hidden, output that are illustrated in Fig. 6; also it shows the architecture of RNN. The input layer consist of N inputs, input is presented in vectors at time t denotes {. . . . {xt-1,xt, xt+1 . . . . . . . . . . . . . .}} here xt = (x1, x2, x4 . . . , xn).
Fig. 6
Architecture of RNN.
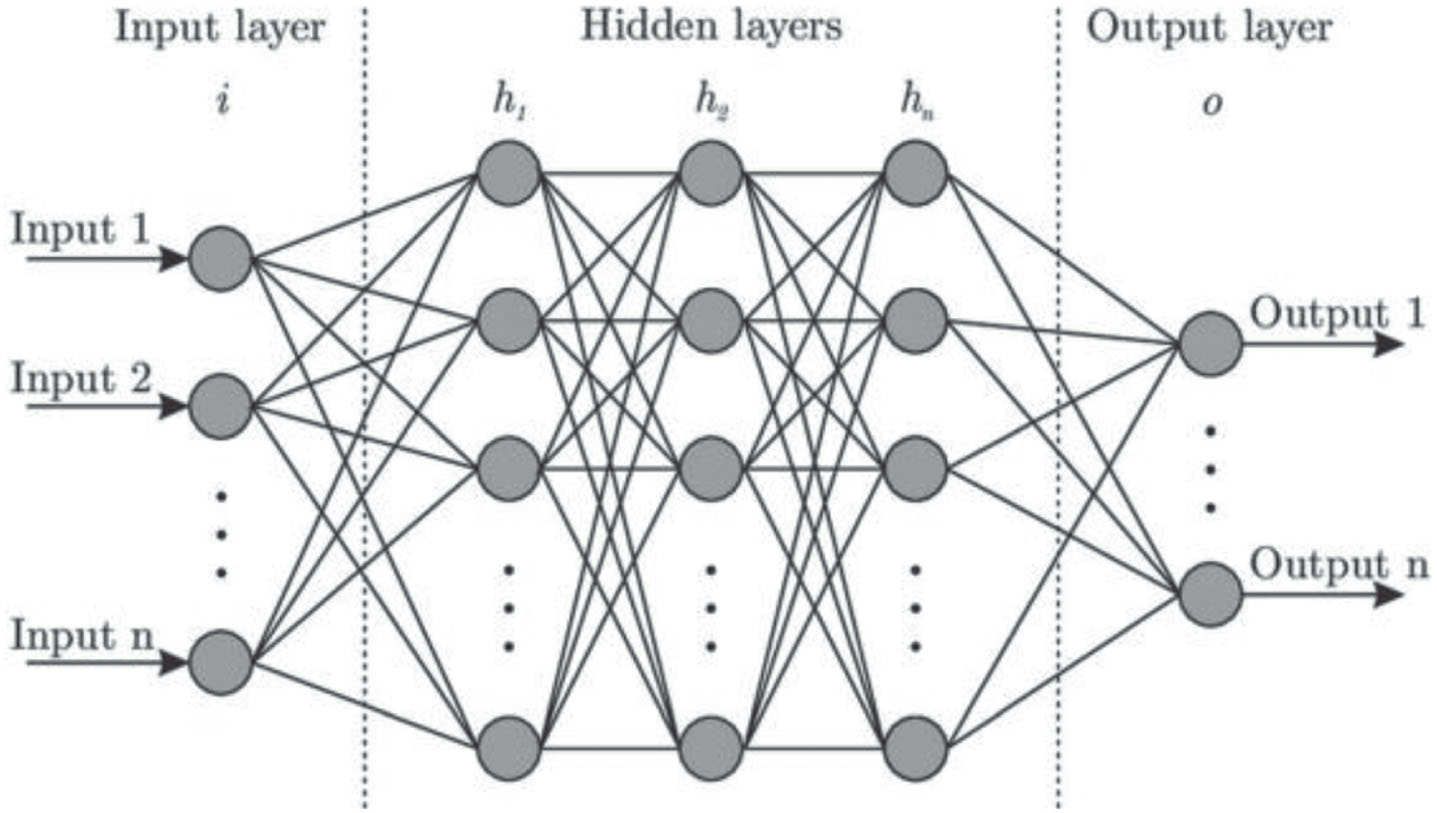
The units of input layer are analyzed with hidden layer units. The units are categorized as WIH weight matrix within the hidden layer. The hidden layer has M hidden units implicates ht = (h1, h2h3 . . . hM), which is associated each other. The state of hidden layer is considered as,
(1)
(2)
(3)
3.4.1Activation function
Every node in neural networks (NNs) having an activation function connected in it as well as determines through the output of respective node by presenting input or set of inputs. It has many activation functions that are associated with NNs; also sigmoid with tanh is utilized typically. To train the classification mode, these activation functions are utilized in the output layer and consolidated with loss functions. The sigmoid, tanhactivation functions are expressed below,
(4)
(5)
This is scaled by scaled sigmoid function that are specified using the below equation,
(6)
3.4.2Loss function
Compute the network performance using loss function though it is compared with the output yt and target output zt, that are described below,
(7)
Finally, the recurrent neural network is used to classify the sentiment classification as positive, negative, neutral sentiment scores.
3.5Visualization of the result
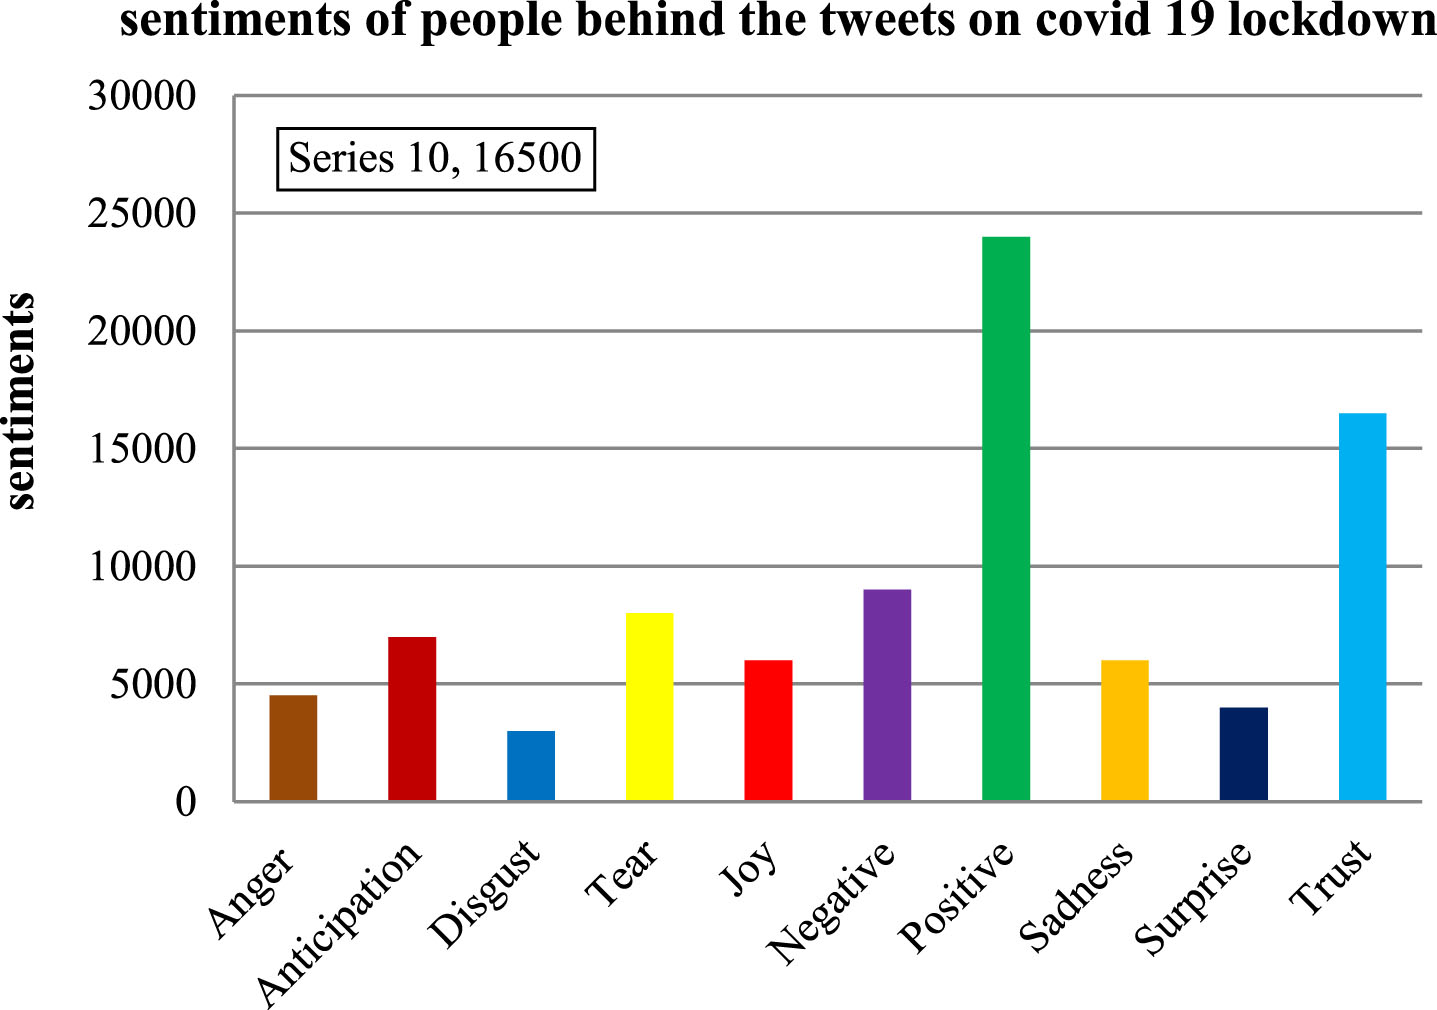
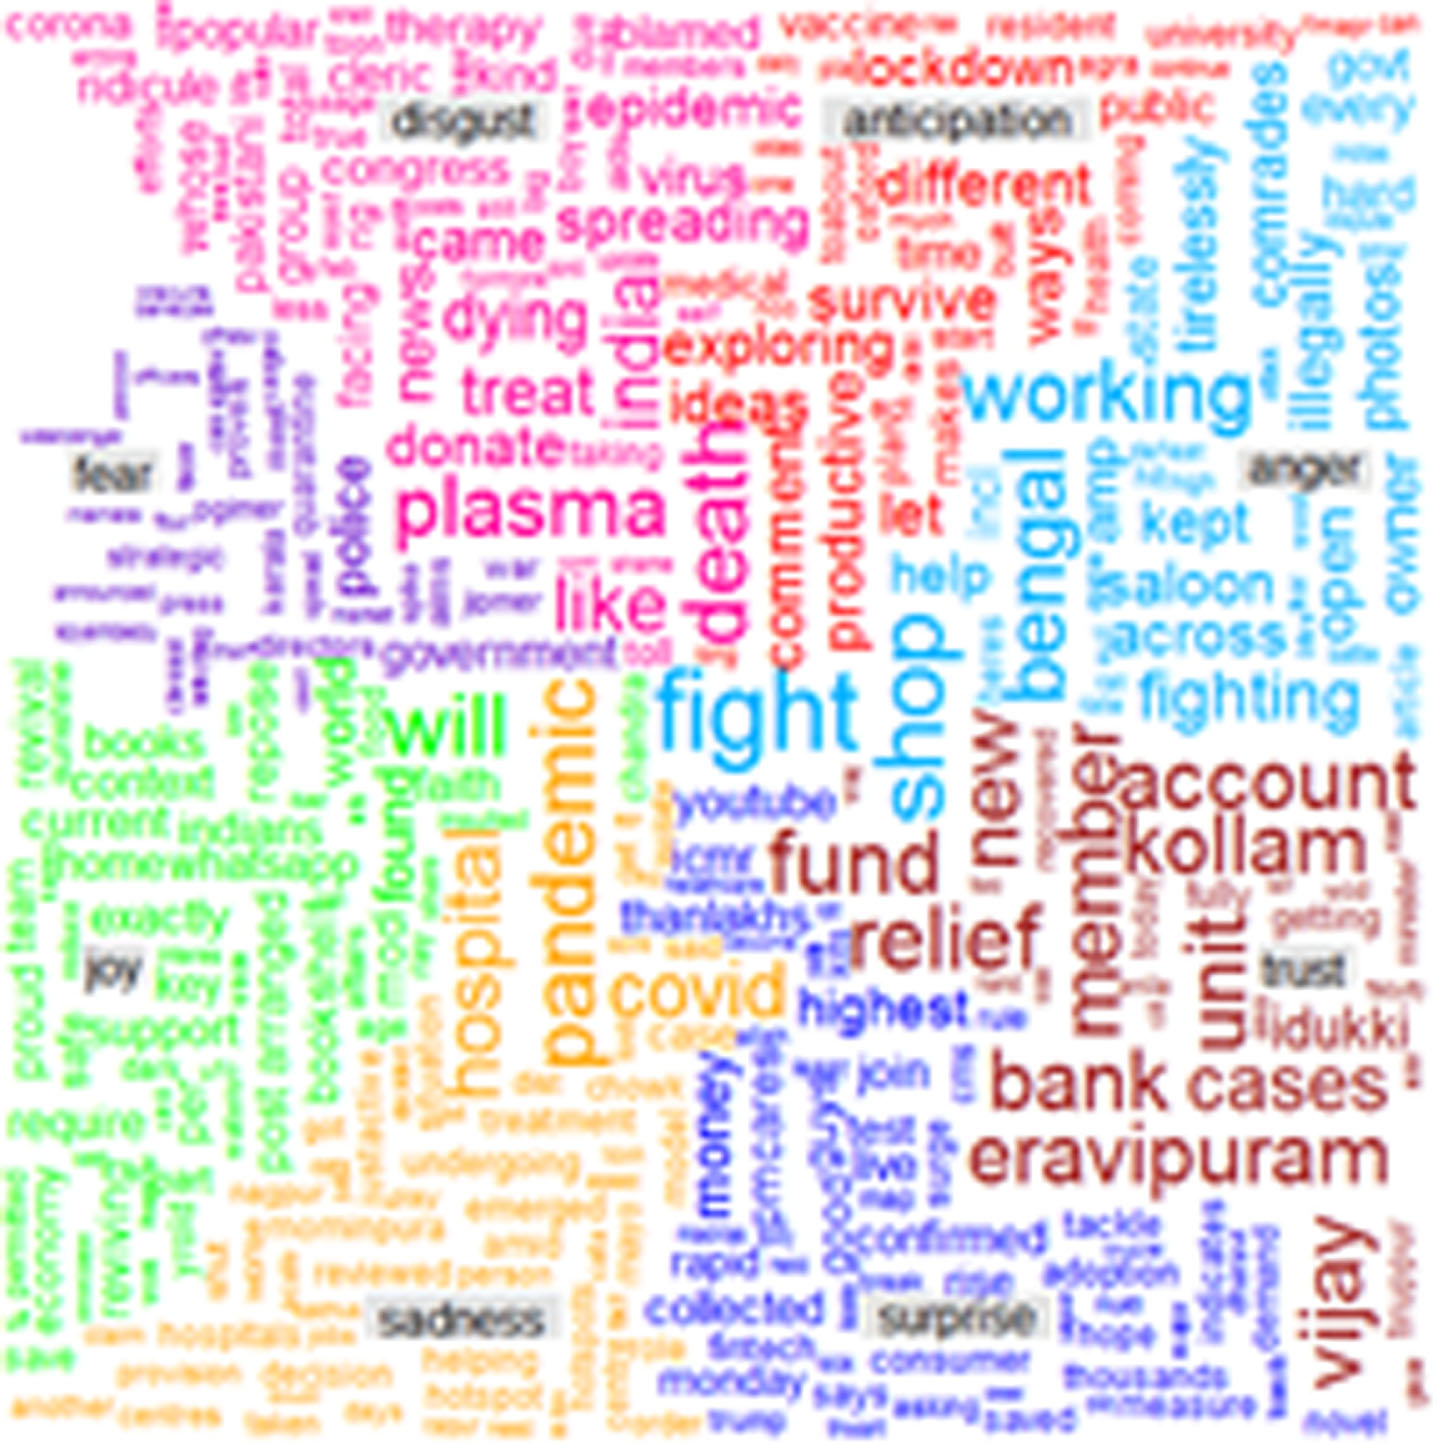
The given Fig. 7 displays the intensity of various feelings; they are sad since people are worried about what the day laborers are doing to endure the closure period. When question arose regarding non-availability of alcohol through lockdown there was anxiety over the alcohol addict before the signs of extraction.
Fig. 7
Graphical representations of sentiments.
In general, it may view, which Indians consider the fight next to COVID 19 in a positive way and most agree with the government for announcing blockade to flatten the curve, which should be seen in tweets, which angered a lot of people because the crash occurred too late.
Lockdown must have been publicized a week earlier. Additionally, few tweets articulated concern that the foreign passengers who flew must have been quarantined by their families before being united. However, blocking response appears to be positive and denotes that India has been able to regulate the corona virus spreading.
Future studies may analyze tweets before and after lockdown and understand if there is a change at sentiment from starting to lockdown end. Additionally, future studies may view at factors, which involve metal health through blockages and spread of a pandemic. Other area for future investigation should be address false news circulating throughout social media, which affects the mental health of the recipients [41].
4Results and discussion
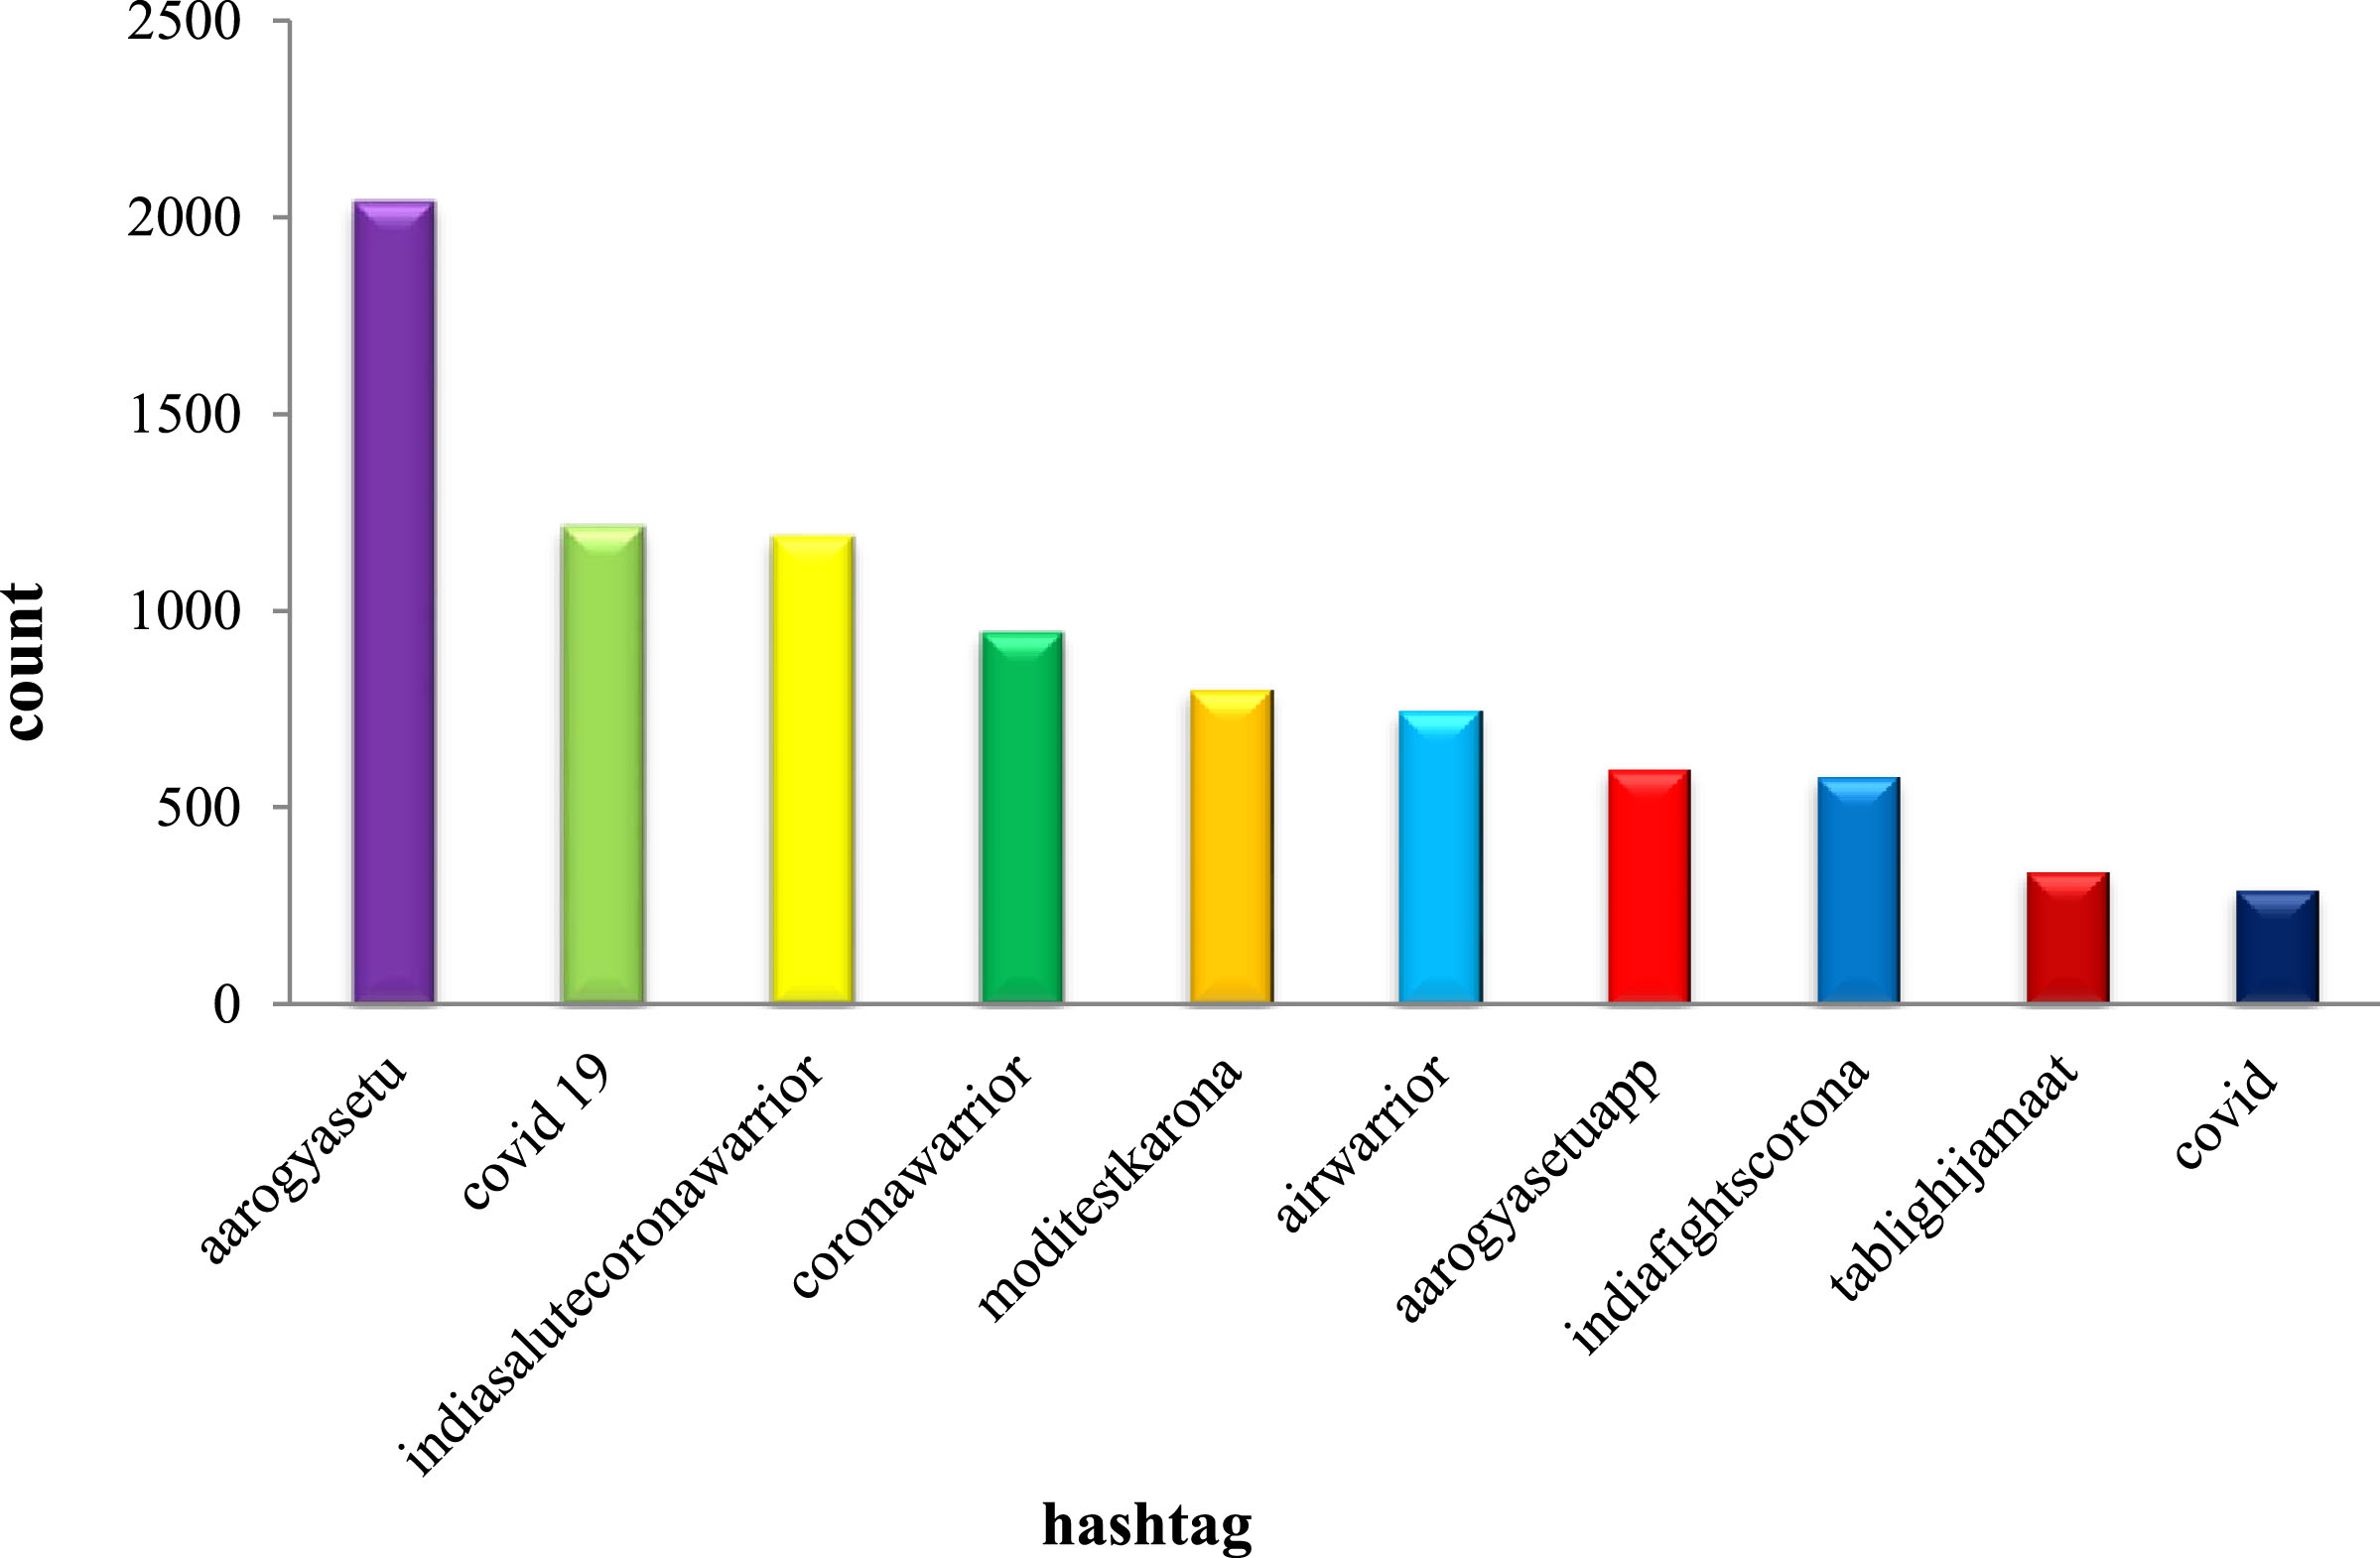
Analysis was carried out by R language and world cloud representing main emotions throughout the 3.0 confinement is acquired. AarogyaSetu is top positive hash tag at lockdown 2.0 and India Fights Corona kept the positive hash tag at lockdown 2.0 given in Fig. 8.
Fig. 8
Top 10 +ve hash tags when lockdown 2.0 in India.
This work, sentiment scores of the tweets are automatically assigned to the R function get sentiment () using which the category of the sentiment were also identified [42]. A sample of the tweets score and their category is shown below Table 3.
Table 3
Sample sentiment score of the tweets
| Tweet | Category | Score |
| 1 | “positive” | “0.5” |
| 2 | “positive” | “0.5” |
| 3 | “positive” | “1.9” |
| 4 | “positive” | “0” |
| 5 | “positive” | “0.6” |
| 6 | positive” | “0” |
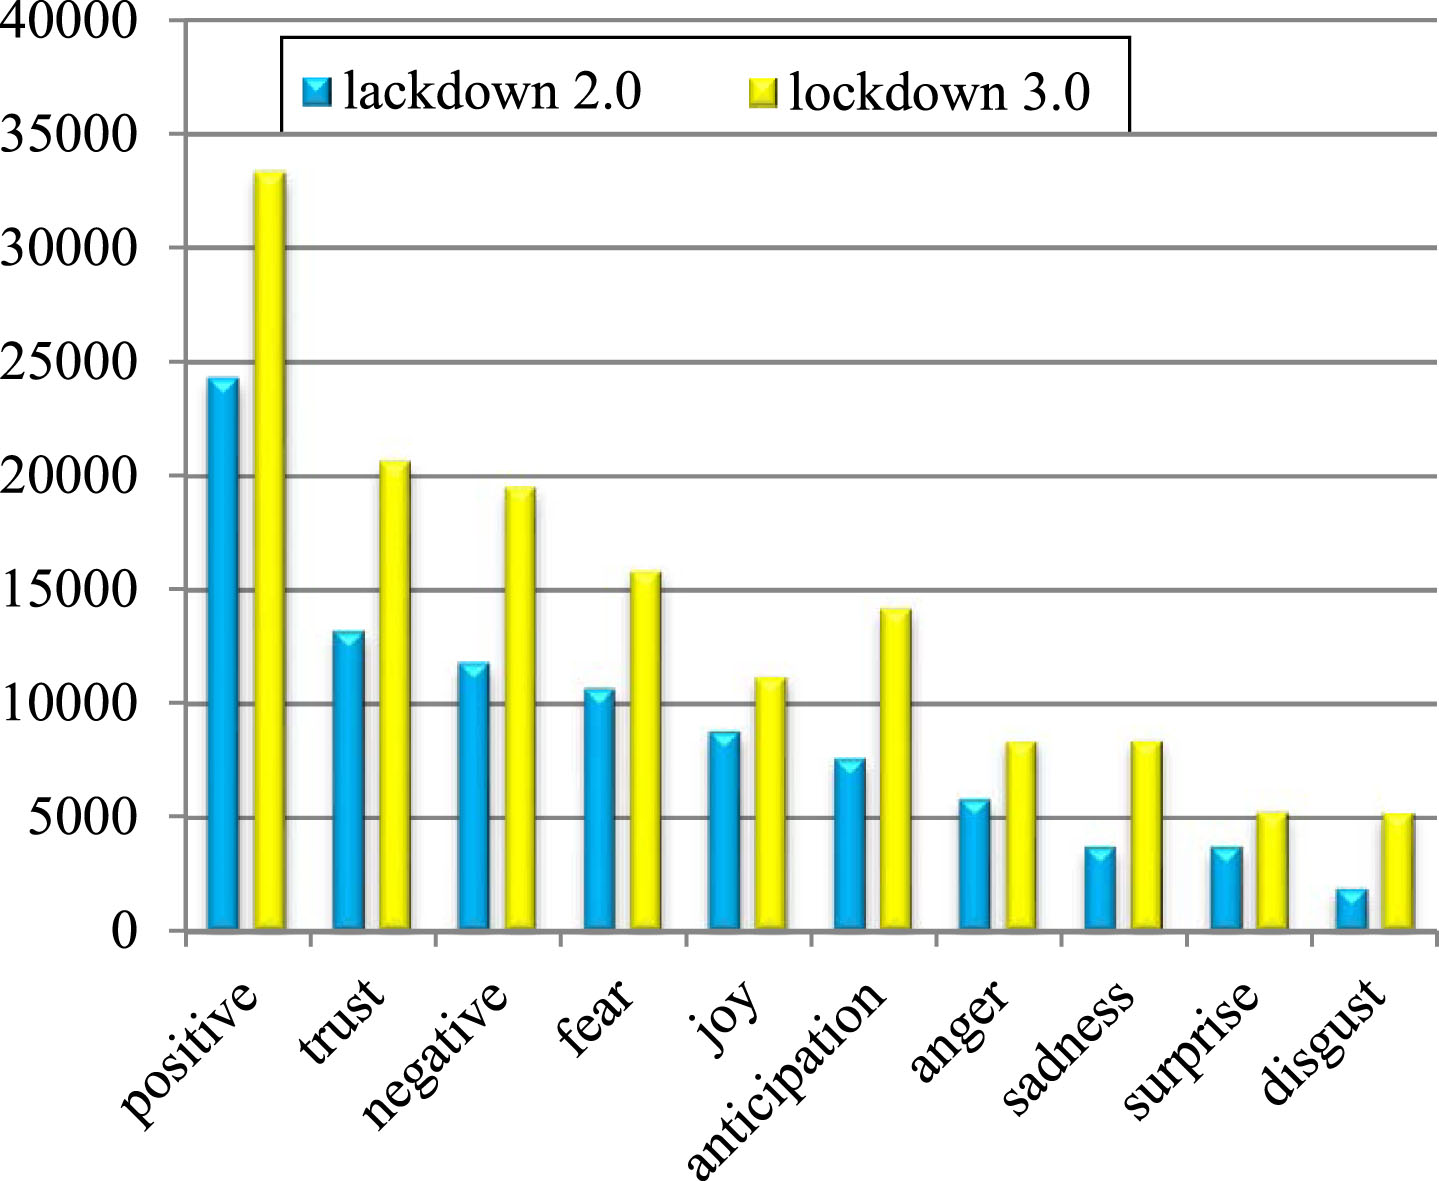
Twitter sentiment user is classified as 2 sentiments: (i) +ve, (ii) -ve. Twitter users resorted to social media usage platform for expressing its opinion. Attempts have been prepared for understanding the mindset of Indians using R software, throughout current lockdown 2.0 (April 15, 2020 to May 3, 2020) and lock down 3.0 (May 4, 2020 to May 17, 2020) using the tweets from social media platform Twitter Analysis is carried out using R software. Though this country is positive towards lockdown 2.0, due to sadness, disgust and so on, large part of people show negative sentiment towards lockdown 3.0.We could also derive the various emotions of the tweets for both the lockdown 2.0 and lockdown 3.0as shown below, [43]. Figure 9 shows the twitter user’s emotional analysis–lockdown 2.0 Vs 3.0.
Fig. 9
Twitter user’s emotional analysis–lockdown 2.0 Vs 3.0.
This analysis may assist health professionals for understanding people’s mindsets, authorities to take appropriate action to eliminate the virus, and e-commerce partners for adapting a new attitude by altering supply and demand plans consequently. The three main categories of tweets for both the periods were derived as shown in Table 4 and 5 respectively,
Table 4
Tweet classification for period 1
| Negative | Neutral | Positive |
| 1306 | 2760 | 2310 |
Table 5
Tweet classification for period 2
| Negative | Neutral | Positive |
| 1874 | 7302 | 3576 |
The word cloud for the tweet during the periods is shown in Fig. 10 and Fig. 11 word clouds display the most frequently used word in the text. Here the word COVID has the highest frequency [44].
Fig. 10
Word cloud for period 1.
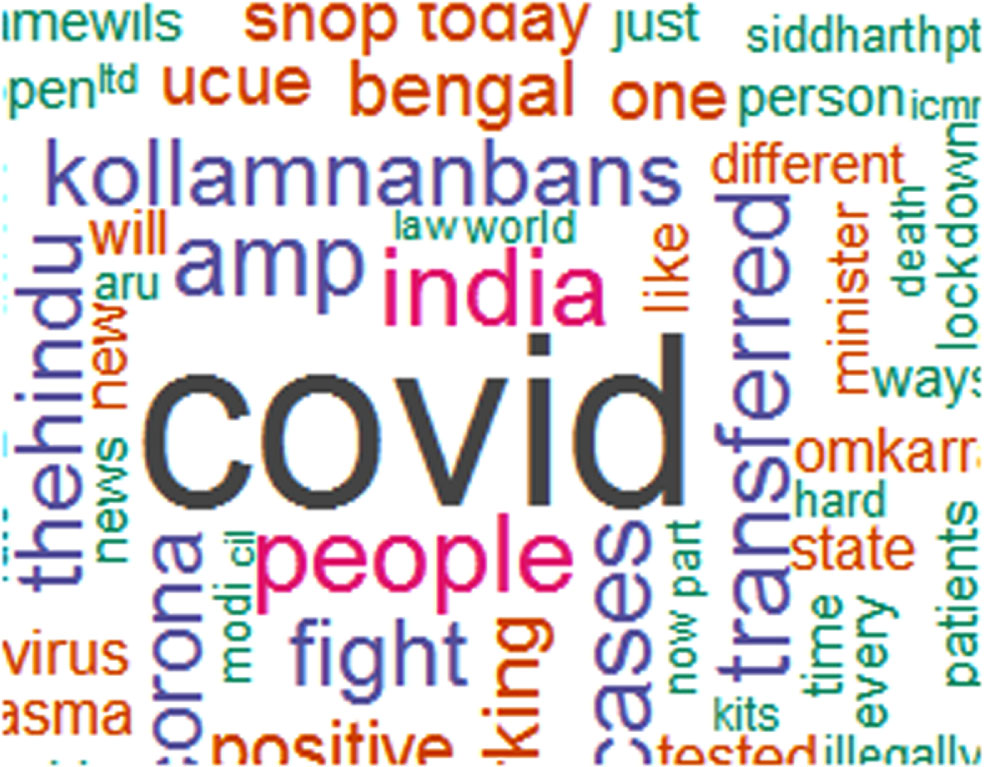
Fig. 11
Word cloud for period 2.
The sentiment derived from the study of twitter tweets is neutral across the country during 25th March 2020 to 27th March 2020 [45].
4.1Evolution of COVID 19
The first case of pneumonia is exposed on December 8, 2019 at wet market on Wuhan, capital of China’s Hubel province. Various groups of pneumonia patients are reported during the last December 2019. The given Table 6 gives the key events timeline of January 2020.
Table 6
Cumulative cases and deaths from COVID 19 pandemic
| Date | Events |
| 4 Jan 2020 | WHO declared cluster of pneumonia cases at Wuhan, Hubel, China |
| 7 Jan 2020 | WHO recognizes COVID-19 |
| 13 Jan 2020 | 1st official COVID-19 case declared in Thailand |
| 17 Jan 2020 | Authorities at Nepal, South Korea, Malaysia, France, Singapore, Australia confirm cases |
| 21 Jan 2020 | 1stCOVID-19 case reports atUSA |
| 22 Jan 2020 | WHO get proof from person-to-person migrating of China |
| 23 Jan 2020 | China inflict blockade at Wuhan, Xiantao, Chibi |
| 30 Jan 2020 | WHO announces COVID-19 international concern public health emergency |
| 31 Jan 2020 | United States announces COVID-19 a National Public Health Emergency |
| 2 Feb 2020 | First death in Philippines |
| 9 Feb 2020 | Count of death at China exceeds the severe acute respiratory syndrome (SARS) of 2002-03 |
| 14 Feb 2020 | Egypt reports COVID-19 first case on African continent |
| 15 Feb 2020 | France reports first COVID-19 death outside Asia |
| 23 Feb 2020 | COVID-19 Cases increase in Italy at Largest Outbreak all over the world |
| 26 Feb 2020 | Brazil confirms 1st COVID-19 case on South America |
| 27 Feb 2020 | 1st case of community transmission declared on USA |
| 29 Feb 2020 | First death from COVID-19 on USA |
| 8 Mar 2020 | Above 100 countries declared the cases Italy enforced quarantine on Lombardy |
| 11 Mar 2020 | WHO announces COVID-19 pandemic |
| 13 Mar 2020 | Donald Trump announces a national emergency on USA |
| 17 Mar 2020 | 50 US states contain at least one confirmed case, the initial California state to execute “stay at home” order. |
| 19 Mar 2020 | The death count in Italy exceeds China |
| 21 Mar2020 | EU suspend public shortage rules for injecting fiscal stimulus in all countries |
| 25 Mar 2020 | White House and Democratic Senate leaders and Republican parties on US reach a contract on $ 2 trillion stimulus to help workers, business with health care system reply to pandemic. |
| 26 Mar 2020 | United States guides world at COVID-19 cases |
| 2 Apr 2020 | Worldwide COVID-19 cases arrive at 1 million |
| 8 Apr 2020 | China lift lockdown on Wuhan, 76 days subsequent to include COVID-19 |
| 11 Apr 2020 | US records 2,000 deaths in a day, greatest number of deaths in a single day recorded via any country |
| 15 Apr 2020 | Global COVID-19 cases arrived at 2 million |
| 24 Apr 2020 | The death count in US exceeds 50,000 |
| 27 Apr 2020 | Worldwide COVID-19 cases arrived at 3 million |
| 28 Apr 2020 | COVID-19 cases at USA exceed 1 million |
| 21 May 2020 | Worldwide COVID-19 cases exceed 5 million |
| 22 May 2020 | Brazil exceeds Russia as second country by largest number of cases, subsequent to US. |
| 27 May 2020 | The death count in US exceeds 100,000 |
Cumulative cases and deaths of COVID 19 pandemic, death cases began to rise as March 2020 in June, the total cumulative cases is more than 9.2 million, and more than 777,000 deaths over the world [46].
4.2Observational studies on mental health issues associated with COVID-19
In Table 7, there are 4 studies, entirelyin Chinese centers that observed the frequency of exact variables linked to mental health at people who are affected by COVID 19 outbreak and its outcomes are given below.
Table 7
Observational investigations on mental health problems associated with COVID 19
| Author | Country of origin | Population study | Methodology | Study instruments | Outcomes |
| Kuo et al., [15] | China | Common population (n = 1210) | Survey of online | Depression, Anxiety, Stress Scale (DASS-21); Event Scale-Revised impact | 16.5%, 28.8% moderate for depressive,anxiety signs; 8.1% reasonable for rigorous stress |
| Xiao et al., [47] | China | Clinical staff treats patients with COVID-19 (n = 180) | Cross-sectional, self-rate questionnaire | Self-Rating Anxiety Scale; Common Self-Efficiency Scale; Stanford Acute Stress Reaction Questionnaire; Pittsburgh Sleep Quality Index; Social Support Rate Scale | Mean anxiety scores 55.3±14.2; anxiety positively interrelated to stress and negatively with sleep quality, social support, self-efficiency (p < 0.05, entire correlations) |
| Grifoni et al., [28] | China | Common public (n = 214); front-line nurse (n = 234); non-front line nurse (n = 292) | Cross-sectional, survey of self-rate utilizing mobile app | Chinese version of Vicarious Traumatization Scale | Traumatization associated with COVID-19 maximal amid non-front line and front-line nurses (p < 0.001); Traumatization between common public maximal to front-line nurses (p < 0.005) other than non-front-line nurses |
| Xiao et al., [47] | China | persons at 14 days isolation (n = 170) | Cross-sectional, self-rated questionnaire | SAS; SASR; PSQI; PSCI-16 | Mean anxiety score 55.4±14.3; Anxiety is positively interrelated by stress, negatively with sleep quality with social capital; social capital positively interrelated through sleep quality. (p < 0.05, entire correlations) |
On observing the previous outcomes, the study has roughly estimated the frequency of individual mental health indication through nervousness being most common. Both studies linked the anxiety by sleep disturbances. At study of population, poor perception of health are linked by greater rates of anxiety and depression; on contrary, availability of correct information and specific preventive measure utilize, like hand washing, seemed for mitigating such effects. This type of descriptive study should not be recovered from other countries.
4.3Performance evaluation
The performance of the proposed model is evaluated with the help of accuracy and sensitivity is as follows,
4.3.1Accuracy
This is the classification proficiency corresponding to the total count of classification tests. Accuracy is given in Equation (8),
(8)
4.3.2Sensitivity
It computes quantity of actual positives which is correctly predictable and is formulated as,
(9)
Table 8 shows the performance comparison of proposed RNN model along with four existing methods. In this, the proposed method is compared with four existing approach such assentiment analysis of COVID-19 using Novel FB-DL, H-SVM, RNN-LSTM, MVEDL. The accuracy of the proposed RNN method is 43.35%, 40.5%, 33.45%, 40.25% is higher than the existing methods, such as FB-DL, H-SVM, RNN-LSTM and MVEDL. The specificity of the proposed RNN method is 33.35%, 42.5%, 31.45%, 30.25% is better than the existing FB-DL, H-SVM, RNN-LSTM and MVEDL methods. The sensitivity is 42.35%, 41.5%, 34.45%, 42.25% is better than the existing FB-DL, H-SVM, RNN-LSTM and MVEDL methods. The precision of the proposed RNN method is 41.35%, 43.5%, 32.45%, 40.25% is better than the existing FB-DL, H-SVM, RNN-LSTM and MVEDL methods. F-score is 43.35%, 40.5%, 33.45%, 40.25% is better than the existing FB-DL, H-SVM, RNN-LSTM and MVEDL methods.
Table 8
Performance comparision of proposed RNN model with the existing method
| Methods | Accuracy (%) | Specificity (%) | Sensitivity (%) | Precision (%) | F-Score (%) |
| Proposed(RNN) | 94.5 | 96.5 | 97.5 | 98.5 | 96.5 |
| FB-DL | 90.3 | 92.3 | 89.3 | 93.3 | 90.32 |
| H-SVM | 90.46 | 93.46 | 90.46 | 94.46 | 93.46 |
| RNN-LSTM | 90.3 | 94.3 | 94.3 | 91.3 | 94.3 |
| MVEDL | 9.23 | 92.2 | 96.23 | 94.23 | 94.23 |
5Conclusion
This study is successful in its goal of analyzing people sentiments and emotions during the COVID-19 pandemic. The analysis of tweets in the early days of the lockdown shows that the people are neither positive nor negative. They remain marginally neutral. After a month of lockdown, most of them are more positive or neutral. This gives an insight mental feeling of the people in India after the corona attack. When India went into lockdown on 24th March 2020 only 500 positive cases were reported across the country and people were not fearful to the situation, and after a month during the last week of April 2020 these cases had risen to 33,000 with a death toll of 1000 approximately. Even the people remained more positive cases but not fearful. This could be due to the fact that the death rate was low and the recovery rates are high compared to other countries in the world. This kept the people more positive and hopeful. This research can be used for future work to examine the changing emotions and feelings of individuals from these countries and check whether there are significant changes in them over time. Future work includes analyzing people’s sentiments on health facilities, government response to the pandemic, offline exams, mental health etc.
Funding information
This research did not get any particular grant from the funding agencies in the public, commercial, or not-for-profit sectors.
Data availability statement
Data sharing is not applicable to this article as no new data were analyzed or created in this study.
References
[1] | El M.E. , Zowalaty and J.D. Järhult, From SARS to COVID-19: A previously unknown SARS-related coronavirus (SARS-CoV-2) of pandemic potential infecting humans–Call for a One Health approach, One Health 9: ((2020) ), 100124. |
[2] | Singh R.P. and Chauhan A. , Impact of lockdown on air quality in India during COVID-19 pandemic, Air Quality, Atmosphere & Health 13: (8) ((2020) ), 921–928. |
[3] | Naserghandi A. , Allameh S.F. , Saffarpour R. All about COVID-19 in brief, New Microbes and New Infections (2020). |
[4] | Shajin F.H. , Rajesh P. and Raja M.R. , An efficient VLSI architecture for fast motion estimation exploiting zero motion prejudgment technique and a new quadrant-based search algorithm in HEVC, Circuits, Systems, and Signal Processing 41: (3) ((2022) ), 1751–1774. |
[5] | Sheikhzadeh E. , Eissa S. , Ismail A. , Zourob M. Diagnostic techniques for COVID-19 and new developments, Talanta 121392. |
[6] | Rajesh P. , Muthubalaji S. , Srinivasan S. and Shajin F.H. , Leveraging a Dynamic Differential Annealed Optimization and Recalling Enhanced Recurrent Neural Network for Maximum Power Point Tracking in Wind Energy Conversion System, Technology and Economics of Smart Grids and Sustainable Energy 7: (1) ((2022) ), 1–5. |
[7] | Alharbi A.S. and de Doncker E. , Twitter sentiment analysis with a deep neural network: An enhanced approach using user behavioral information, Cognitive Systems Research 54: ((2019) ), 50–61. |
[8] | Vibha A.N. , Kamath G.B. and Pai D.V. , Keeping the country positive during the COVID 19 pandemic: Evidence from India, Asian Journal of Psychiatry 51: ((2020) ), 102118. |
[9] | Shajin F.H. , Rajesh P. and Thilaha S. , Bald eagle search optimization algorithm for cluster head selection with prolong lifetime in wireless sensor network, Journal of Soft Computing and Engineering Applications 1: (1) ((2020) ), 7. |
[10] | Hu Y. , Sun J. , Dai Z. , Deng H. , Li X. , Huang Q. , Wu Y. , Sun L. and Xu Y. , Prevalence and severity of corona virus disease (COVID-19): A systematic review and meta-analysis, Journal of Clinical Virology 127: ((2020) ), 104371. |
[11] | Chehal D. , Gupta P. , Gulati P. Implementation and comparison of topic modeling techniques based on user reviews in e-commerce recommendations, Journal of Ambient Intelligence and Humanized Computing, (2020). |
[12] | Rajesh P. , Shajin F.H. , Kommula B.N. An efficient integration and control approach to increase the conversion efficiency of high-current low-voltage DC/DC converter, Energy Systems (2021), 1–20. |
[13] | Yang J. , Zheng Y. , Gou X. , Pu K. , Chen Z. , Guo Q. , Ji R. , Wang H. , Wang Y. and Zhou Y. , Prevalence of comorbidities and its effects in patients infected with SARS-CoV-2: a systematic review and meta-analysis, International Journal of Infectious Diseases 94: ((2020) ), 91–95. |
[14] | Kooistra E.B. , Reinders Folmer C. , Kuiper M.E , Olthuis E. , Brownlee M. , Fine A. , Van Rooij B. , Mitigating covid-19 in a nationally representative uk sample: Personal abilities and obligation to obey the law shape compliance with mitigation measures, Amsterdam Law School Research Paper (2020), (2020-19). |
[15] | Kuo P.J. , Lee C.L. , Wang J.H. , Hsieh S.Y. , Huang S.C. and Lam C.F. , Inhalation of volatile anesthetics via a laryngeal mask is associated with lower incidence of intraoperative awareness in non-critically ill patients, PloS one 12: (10) ((2017) ), e0186337. |
[16] | Samuel J. , Ali G.G. , Rahman M. , Esawi E. and Samuel Y. , Covid-19 public sentiment insights and machine learning for tweets classification, Information 11: (6) ((2020) ), 314. |
[17] | Basiri M.E. , Nemati S. , Abdar M. , Asadi S. and Acharrya U.R. , A novel fusion-based deep learning model for sentiment analysis of COVID-19 tweets, Knowledge-Based Systems 228: ((2021) ), 107242. |
[18] | Kaur H. , Ahsaan S.U. , Alankar B. and Chang V. , A Proposed Sentiment Analysis Deep Learning Algorithm for Analyzing COVID-19 Tweets, Information Systems Frontiers 20: ((2021) ), 1–3. |
[19] | Jelodar H. , Wang Y. , Orji R. and Huang S. , Deep sentiment classification and topic discovery on novel coronavirus or covid-19 online discussions: Nlp using lstm recurrent neural network approach, IEEE Journal of Biomedical and Health Informatics 24: (10) ((2020) ), 2733–2742. |
[20] | Malla S. and Alphonse P.J. , COVID-19 outbreak: An ensemble pre-trained deep learning model for detecting informative tweets, Applied Soft Computing 107: (2018) ((2021) ), 107495. |
[21] | Öztürk N. and Ayvaz S. , Sentiment analysis on Twitter: A text mining approach to the Syrian refugee crisis, Telematics and Informatics 35: (1) ((2018) ), 136–147. |
[22] | Nilima N. , Kaushik S. , Tiwary B. and Pandey P.K. , Psycho-social factors associated with the nationwide lockdown in India during COVID-19 pandemic, Clinical Epidemiology and Global Health 9: ((2021) ), 47–52. |
[23] | Kandasamy I. , Vasantha W.B. , Obbineni J.M. and Smarandache F. , Sentiment analysis of tweets using refined neutrosophic sets, Computers in Industry 115: ((2020) ), 103180. |
[24] | Gupta P. , Kumar S. , Suman R.R. , Kumar V. Sentiment Analysis of Lockdown in India During COVID-19: A Case Study on Twitter, IEEE Transactions on Computational Social Systems (2020). |
[25] | Basiri M.E. , Naghsh-Nilchi A.R. and Ghasem-Aghaee N. , Sentiment prediction based on dempster-shafer theory of evidence, Mathematical Problems in Engineering 27: ((2014) ). |
[26] | Islam S.D. , Bodrud-Doza M. , Khan R.M. , Haque M.A. and Mamun M.A. , Exploring COVID-19 stress and its factors in Bangladesh: a perception-based study,e, Heliyon 6: (7) ((2020) ), 04399. |
[27] | Avasthi S. , Chauhan R. , Acharjya D.P. Information Extraction and Sentiment Analysis to Gain Insight into the COVID-19 Crisis. In International Conference on Innovative Computing and Communications (2022), (pp. 343-353). Springer, Singapore. |
[28] | Grifoni A. , Sidney J. , Zhang R. , Scheuermann H. , Peters B. and Sette A. , A sequence homology and bioinformatic approach can predict candidate targets for immune responses to SARS-CoV-2, Cell host & Microbe 27: (4) ((2020) ), 671–680. |
[29] | Medford R.J. , Saleh S.N. , Sumarsono A. , Perl T.M. and Lehmann C.U. , An “infodemic”: leveraging high-volume Twitter data to understand early public sentiment for the coronavirus disease outbreak. , Open Forum Infectious Diseases 7: (7) ((2020) ) Inofaa258. US: Oxford University Press. |
[30] | Bangalore S. , Sharma A. , Slotwiner A. , Yatskar L. , Harari R. , Shah B. , Ibrahim H. , Friedman G.H. , Thompson C. , Alviar C.L. and Chadow H.L. , ST-segment elevation in patients with Covid-19— a case series, New England Journal of Medicine 382: (25) ((2020) ), 2478–2480. |
[31] | Tsou M.H. , Yang J.A. , Lusher D. , Han S. , Spitzberg B. , Gawron J.M. and Gupta D. , An L. Mapping social activities and concepts with social media (Twitter) and web search engines (Yahoo and Bing): a case study in US Presidential Election, Cartography and Geographic Information Science 40: (4) ((2013) ), 337–348. |
[32] | Kaity M. and Balakrishnan V. , Sentiment lexicons and non-English languages: a survey, Knowledge and Information Systems 22: ((2020) ), 1–36. |
[33] | Rahman M.A. , Zaman N. , Asyhari A.T. , Al-Turjman F. , Bhuiyan M.Z. and Zolkipli M.F. , Data-driven dynamic clustering framework for mitigating the adverse economic impact of Covid-19 lockdown practices, Sustainable cities and society 62: ((2020) ), 102372. |
[34] | Sufian A. , Ghosh A. , Sadiq A.S. and Smarandache F. , A survey on deep transfer learning to edge computing for mitigating the COVID-19 pandemic, Journal of Systems Architecture 108: ((2020) ), 101830. |
[35] | Shuja J. , Alanazi E. , Alasmary W. and Alashaikh A. , COVID-19 open source data sets: a comprehensive survey, Applied Intelligence 21: ((2020) ), 1–3. |
[36] | Paital B. , Das K. and Parida S.K. , Inter nation social lockdown versus medical care against COVID-19, a mild environmental insight with special reference to India, Science of the Total Environment 728: ((2020) ), 138914. |
[37] | Xu X. , Lei Y. and Li Z. , An incorrect data detection method for big data cleaning of machinery condition monitoring, IEEE Transactions on Industrial Electronics 67: (3) ((2019) ), 2326–2336. |
[38] | Zhang Y. , Song D. , Zhang P. , Li X. and Wang P. , A quantum-inspired sentiment representation model for twitter sentiment analysis, Applied Intelligence 49: (8) ((2019) ), 3093–3108. |
[39] | Pergola G. , Gui L. and He Y. , TDAM: A topic-dependent attention model for sentiment analysis, Information Processing & Management 56: (6) ((2019) ), 102084. |
[40] | Vaishnav V. and Vajpai J. , Assessment of impact of relaxation in lockdown and forecast of preparation for combating COVID-19 pandemic in India using Group Method of Data Handling, Chaos, Solitons& Fractals 140: ((2020) ), 110191. |
[41] | Yadav A. and Vishwakarma D.K. , Sentiment analysis using deep learning architectures: a review, Artificial Intelligence Review 53: (6) ((2020) ), 4335–4385. |
[42] | Ruiz-Roso M.B. , Knott-Torcal C. , Matilla-Escalante D.C. , Garcimartín A. , Sampedro-Nuñez M.A. , Dávalos A. and Marazuela M. , COVID-19 lockdown and changes of the dietary pattern and physical activity habits in a cohort of patients with type 2 diabetes mellitus, Nutrients 12: (8) ((2020) ), 2327. |
[43] | Stella M. , Restocchi V. and De S. , Deyne, # lockdown: Network-enhanced emotional profiling in the time of Covid-19, Big Data and Cognitive Computing 4: (2) ((2020) ), 14. |
[44] | Hamzah F.B. , Lau C. , Nazri H. , Ligot D.V. , Lee G. , Tan C.L. , Shaib M.K. , Zaidon U.H. , Abdullah A. and Chung M.H. , CoronaTracker: worldwide COVID-19 outbreak data analysis and prediction, Bull World Health Organ 1: (32) ((2020) ), 1–32. |
[45] | Shi H. , Han X. , Jiang N. , Cao Y. , Alwalid O. , Gu J. , Fan Y. and Zheng C. , Radiological findings from 81 patients with COVID-19 pneumonia in Wuhan, China: a descriptive study, The Lancet Infectious Diseases 20: (4) ((2020) ), 425–434. |
[46] | Rajkumar R.P. , COVID-19 and mental health: A review of the existing literature, Asian Journal of Psychiatry 52: ((2020) ), 102066. |
[47] | Xiao H. , Zhang Y. , Kong D. , Li S. and Yang N. , Social capital and sleep quality in individuals who self-isolated for 14 days during the coronavirus disease (COVID-19) outbreak in January in China,e, Medical Science Monitor: International Medical Journal of Experimental and Clinical Research 26: ((2020) ), 923921–1. |


