
Multilayer hybrid ensemble machine learning model for analysis of Covid-19 vaccine sentiments
Abstract
This work presents the analysis of significant sentiments and attitudes of people towards the COVID-19 vaccination. The tweeter messages related to the COVID-19 vaccine is used for sentiment evaluation in this work. The proposed work consists of two steps: (i) natural processing language (NLP) and (ii) classification. The NLP is utilized for text pre-processing, tokenization, data labelling, and feature extraction. Further, a stack-based ensemble machine learning model is used to classify sentiments as positive, negative, or neutral. The stack ensemble machine learning model includes seven heterogeneous machine learning techniques namely, Naive Bayes, Logistic regression, Decision Tree, Random Forest, AdaBoost Classifier, Gradient Boosting, and extreme Gradient Boosting (XGB). The highest classification accuracy of 97.2%, 88.34%, 88.22%, 85.23%, 86.30%, 87.54%, 86.63%, and 88.78% is achieved by ensemble machine learning model, Logistic regression, AdaBoost, Decision Tree, Naive Bayes, Random Forest, Gradient Boosting, and XGB Classifier, respectively.
1Introduction
Coronavirus disease (COVID-19) is a lethal virus that afflicts many countries. It is considered as pandemic disease in March 2020 by World Health Organization [29]. COVID-19 pandemic affected the lives of more than 200 nations [30]. Hundreds of thousands died from the unexpected outbreak of COVID-19. Governments and authorities actively combated the disease worldwide through various tactics and policies such as travel restrictions, vaccination, and facility closures. The invention of a COVID-19 vaccine is one of the important technique applied by the government to control its spreading [26]. Many countries such as America, Britain, and Brazil reported fewer COVID cases in 2021 due to the high percentage of vaccination. The Indian government has decided to start a widespread immunization effort to stop spreading of COVID-19. The COVID-19 vaccination was initially available to health care and front-line personnel. Citizens above the age of 18 are now part of the phase-3 vaccination drive [33]. The effectiveness of any immunization campaign is determined by its publicity rate and pace of acceptance [12]. Many misconceptions and doubts emerges in ordinary people’s minds about COVID-19 vaccinations. The effectiveness of the vaccination program is determined by public approval. Vaccine development is a slow and time-consuming process which requires multiple test for potency, efficacy, and protection. Furthermore, the acceptability of the newly released vaccine is required for an effective immunization program. Preliminary data indicates that the authorized vaccinations are safe and efficient. Still the long-term efficacy and adverse effects are unclear. The vaccination and immunization of 100% population can avert the pandemic effectively. However, research on the sentiment analysis of public view towards COVID-19 vaccine has not been done yet.
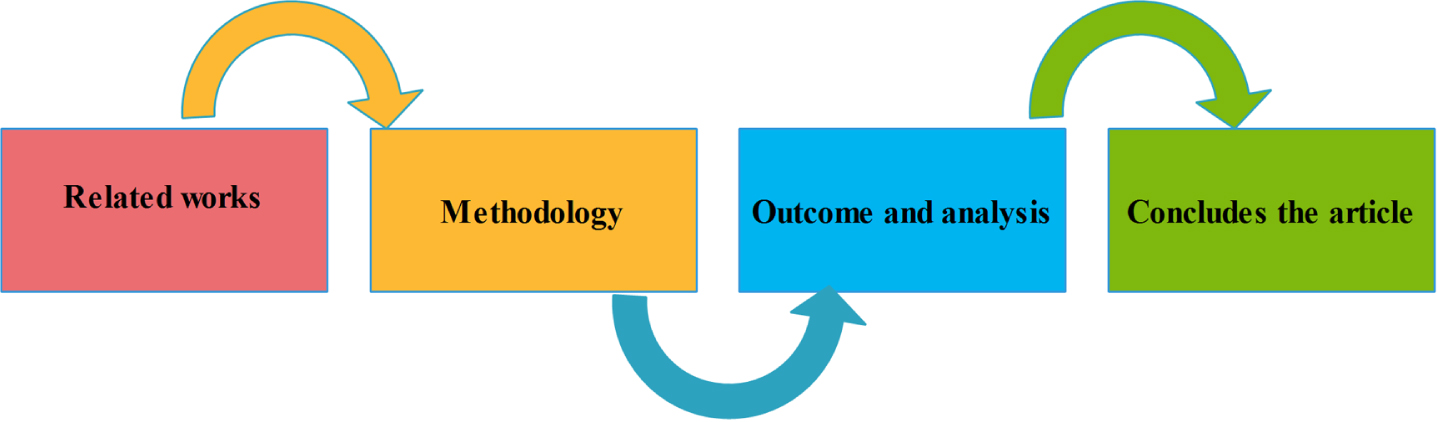
This study aims to investigate the views of Indians regarding the COVID-19 vaccination. The present work focuses on the sentiment analysis of Twitter messages of Indian people about the COVID-19 vaccine and classify their sentiments into three groups as positive, neutral, and negative. The outcome of the present work can be utilized by the Policymakers to address the people’s queries before mass vaccination. Organization of the remaining part of the paper is shown in Fig. 1. Section 2 discusses the literature review. The proposed methodology and algorithm are presented in Section 3. The experimental results and discussions are given in Section 4, followed by conclusions are given in Section 5.
Fig. 1
Organization of the paper.
– Novelty of the proposed work
2Background information and related work
Alam et al. investigated the public opinion about COVID-19 vaccinations based on the tweets posted between December 2021 to July 2021 [1]. The NLP based tool named as Valence Aware Dictionary for Sentiment Reasoner (VADER) is used to analyze the attitudes about vaccination in their work. The performance of the predictive model is tested using a recurrent neural network, long short-term memory (LSTM), and bidirectional LSTM (Bi-LSTM). The highest 90.59% and 90.83% of accuracy obtained with LSTM and Bi-LSTM model, respectively. Aspect-based sentiment analysis is used by Aygün et al. with six different COVID-19 vaccine-related tweets [2]. Four distinct BERT (Bidirectional Encoder Representations from Transformers) models namely, mBERT-base, BioBERT, ClinicalBERT, and BERTurk is applied in their work with highest accuracy of 87%. COVID-19 Arabic tweets are examined by Baker et al. with 54,065 Twitter posts with four classifiers, namely SVM, k-NN, decision trees, and Naive Bayes [3]. The highest classification accuracy of 89.06% and 86.43% is achieved through Naive Bayes and k-NN, respectively. Bonnevie et al. studied the evolution of vaccine resistance by evaluating the tweets about COVID-19 vaccine posted by citizens of United States [4]. Hou et al. analyzed public interest of COVID-19 by using the Weibo posts [19]. The emotions are classified based on Baidu emotions analysis tool in their work. Hung M et al. utilized a lexicon-based technique to determine the emotional state of COVID-19 [20]. The Latent Dirichlet Allocation (LDA) is utilized to extracts latent semantics patterns from Twitter posts. The three sentiment analysis such as pleasant, neutral, and negative is performed based on Dictionary of Valence Aware and sentiment Reasoner (VADER). The compound score or sentiment score with emotion ratings are also computed by the authors. Jain et al. applied two lexicons namely, SentiwordNet and AFINN for sentiment analysis [21]. Authors applied SVM and Naive Bayes classifier for tweet classification. Lwin et al. utilized 20,325,929 pandemic-related tweets to gauge public emotions using a lexicon technique [25]. The CrystalFeel algorithm is employed by authors to classify four different sentiments such as fear, anger, sorrow, and joy. Total 80,32,78 Persian tweets related to imported vaccines, i.e., Pfizer/BioNTech, AstraZeneca/Oxford, Moderna, and Sinopharm are utilized by Nezhad et al. for sentiment analysis [28]. Deep learning based CNN-LSTM model has been used to determine the sentiments of retrieved tweets by the authors. Valdés et al. utilized a hybrid technique to analyze 1,499,227 vaccine-related tweets from 18 March 2019 and 15 April 2019 with accuracy rate of more than 85% [32]. Praveen et al. used a text-blob lexicon and Latent Dirichlet Allocation to study Indians attitudes regarding COVID-19 immunisation [34]. Villavicencio et al. suggested Naive Bayes algorithms for analyzing the general sentiments of Filipino citizens about COVID-19 vaccines with 81.77%. accuracy [38]. Liu et al. suggested an attention mechanism and a graph convolutional network for Aspect-based sentiment categorization [24]. The multi-head attention technique is utilized in their work to select input data and achieved 82.72% accuracy with BERT embedding.
3Methodology used
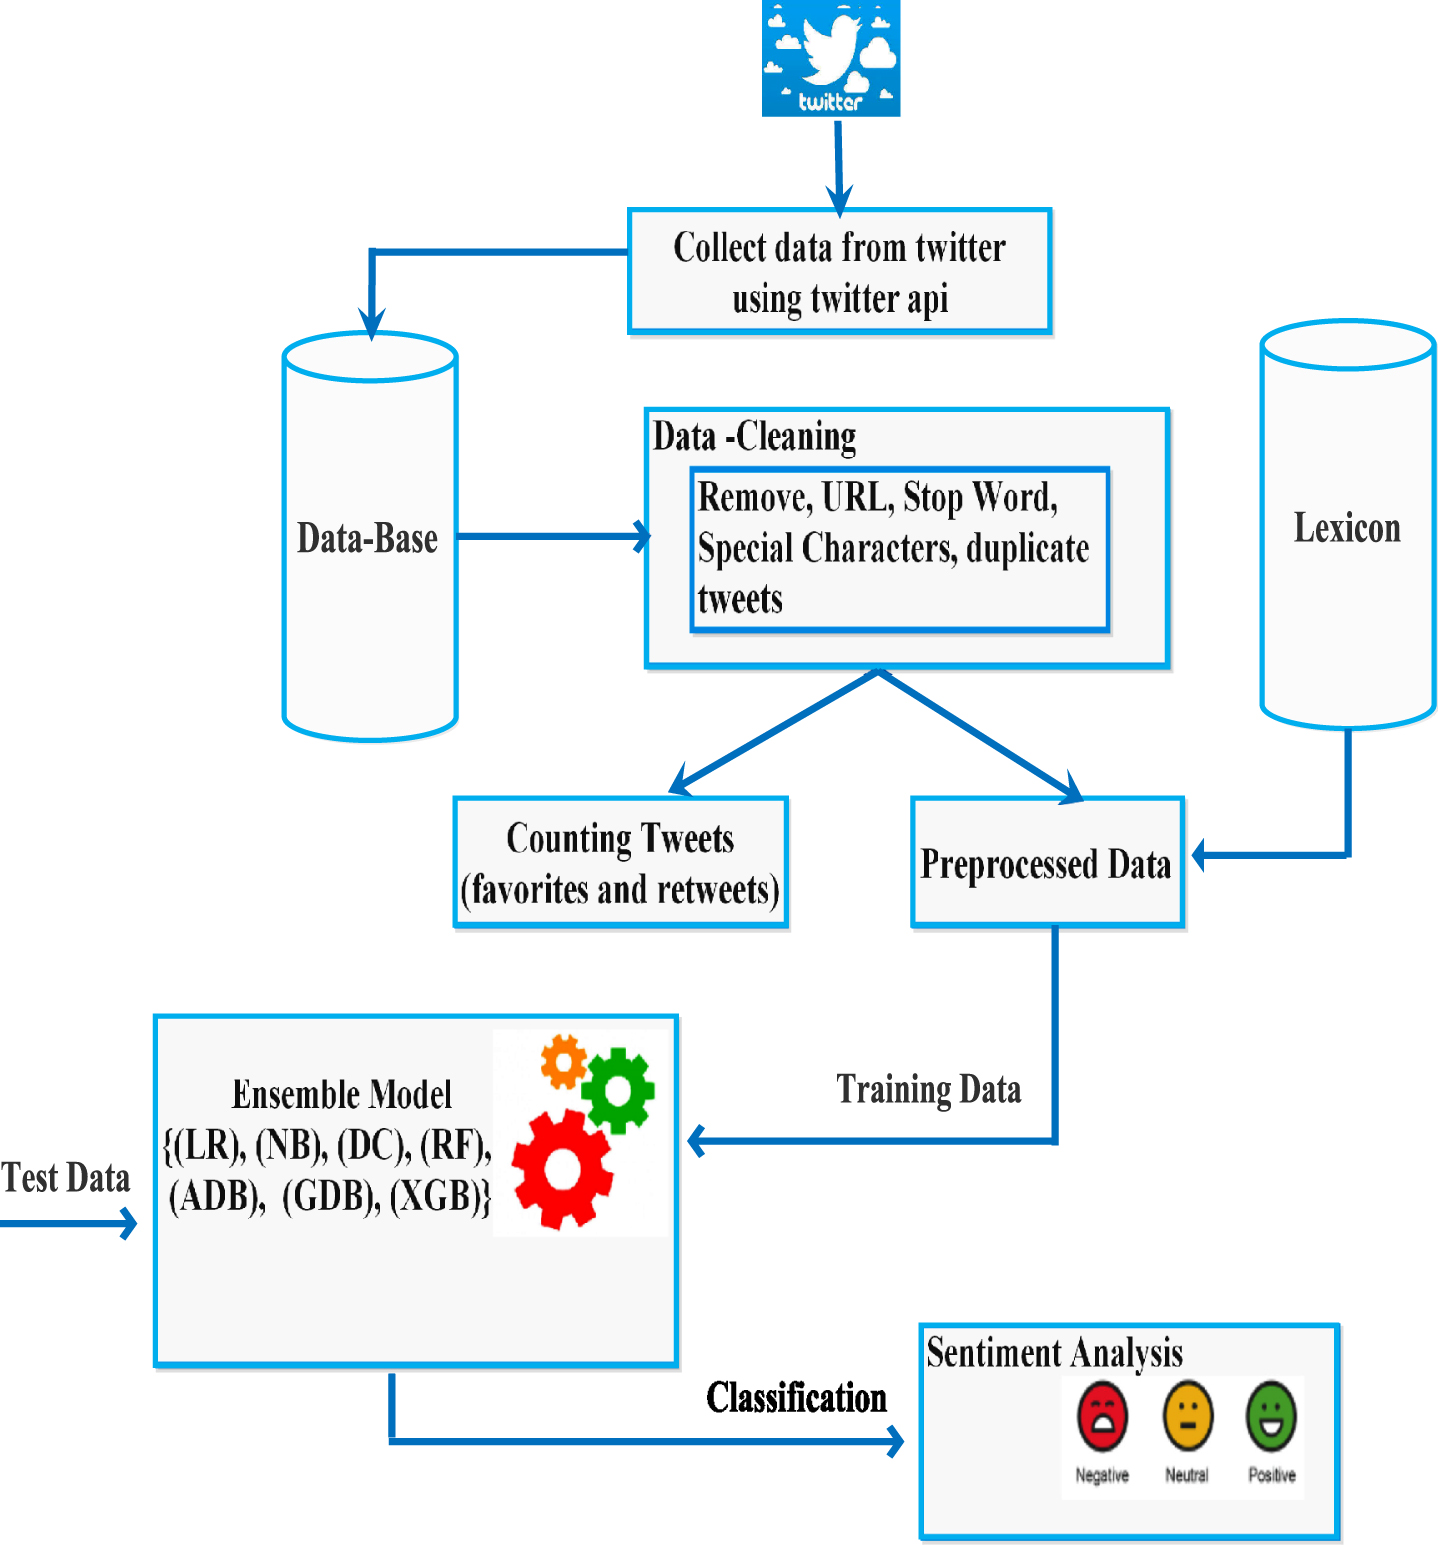
The proposed methodology for sentiment analysis and classification consist of four steps (i) Data gathering, (ii) Data preprocessing, (iii) Sentiment analysis, and (IV) Sentiment classification as positive, negative or neutral. The flowchart and algorithm of the proposed methodology is illustrated in Fig. 2 and algorithm 1, respectively. The brief description of each step of present work is given in subsequent subsections.
Fig. 2
Flow chart of the proposed work.
3.1Data gathering
Social media is the biggest resource of understanding the general viewpoint of public opinions during extraordinary times [5, 7, 13, 40]. The Twitter data related to the COVID-19 vaccine is collected for the sentiment analysis in this work. Total 27,810 tweets related to “COVID-19 vaccination” are collected using Tweepy API.
Algorithm 1 Sentiment analysis of COVID-19 vaccine
Require: Twitter data (tweets) about COVID-19 vaccine
Ensure: Sentiment analysis as positive, negative, and neutral)
1: Twitter scrap using twint.
2: Collection of tweets as data-set.
3: Apply data cleaning and preprocessing operation on data-set df1
4: df1 ⇐ Deletion of null value.
5: df1 ⇐ conversion of df1 text into lower case.
6: df1 ⇐ Removal of stop words, @, and URL from data-set.
7: df1 ⇐ Removal of emoticons and punctuation from df1.
8: df1 ⇐ Tokenization and lemmatization.
9: FX ⇐ Feature extraction (TF-IDF, n-grams) from df1.
10: FX[“ps”]⇐ Calculation of polarity score of tweets stored in the data-set.
11: Convert polarity score into sentiment categories.
12: for each FX[“ps”]i, where i =0......... n
13: If FX[“ps”]i score >0
14: Assign as “Positive”.
15: else if
16: FX[“ps”]i score <0
17: Assign as “Negative”.
18: else
19: Assign as “Neutral”.
20: end for
21: Create a filter function filter-by-vaccy(df,vax), filter vaccine namely, ‘covaxin’, ’moderna’, ’pfizer’, ’biontech’, ’sputnik’, ’covishield’ according to timeline from the data-set FX.
22: FX[“vaccine-name”] ⇐ Divide all the emotions into three categories: “positive”, “negative”, and “neutral.”
23: for each FX[“vaccinename”] The frequency of each word must be calculated as “positive,” “negative,” and “neutral”.
24: end for
25: Analysis of negative sentiment of each vaccine
3.2Data pre-processing
The data preprocessing process consists of four sub-steps (i) data cleaning, (ii) Normalization of data, (iii) Tokenization of text, and (iv) Vectorization as shown in Fig. 3.
Fig. 3
Steps of data pre-processing.
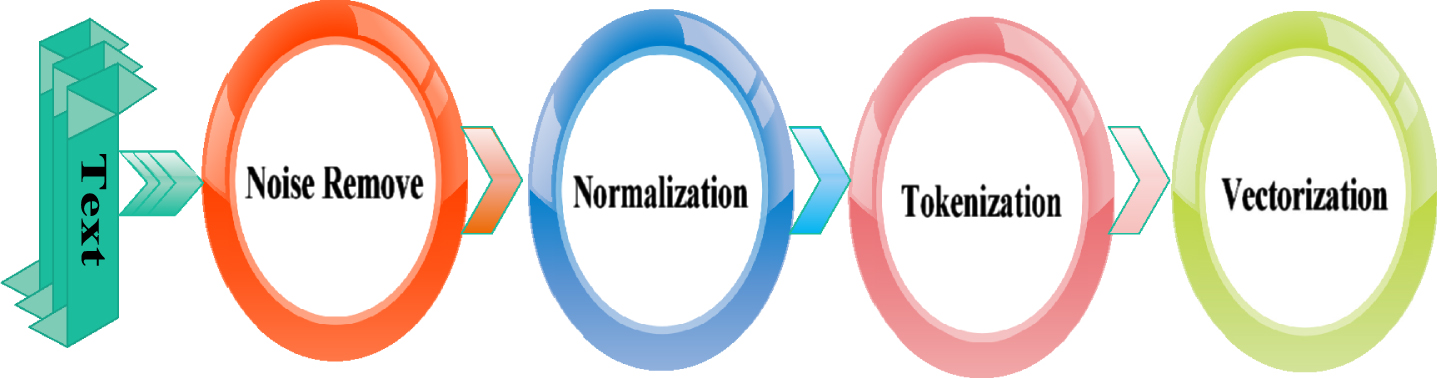
As the collected tweets are noisy and unlabelled. Thus, The data cleaning process is applied to remove noises which includes (a) Removal of unnecessary words, (b) Elimination of HTML tags, (c) Elimination of emojis and data numbering patterns, (d) Removal of additional characters in sentences, and (e) Removal of blank spaces, emails, stopping words, URLs, and punctuation. Further, Stemming and Lemmatization techniques are applied for data normalization by using WordNetLemmatize package of natural language tool kit (nltk). The Stemming technique removes terminators from words to determine the root form. The Lemmatization is used for grouping the various forms of similar words for dimensionality reduction. In next step, normalized data-set are tokenized by dividing the text string into tokens and stored as features for labelling process.
– Data labelling
(1)
TF-IDF: The tf-idf vectorization technique converts the text data into the vector form suitable for further classification. It is an features extraction method works with labelled data and based on the frequency of words in the text. TF represents phrase frequency which computes how often the word has appeared in the text and mathematically represented as:
(2)
(3)
(4)
3.3Classification
Sentiment classification as positive, neutral, and negative is performed by applying eight machine learning models namely, Random forest, Logistic regression, Naive Bayes, Decision tree, AdaBoost, Gradient boosting, Extreme Gradient Boosting, and a stack ensemble model. Brief descriptions of each machine learning techniques are given in the subsequent subsections.
3.3.1Logistic regression
A logistic regression classifier is adopted by machine learning from the field of statistics which establishes the relation between independent and dependent variables. The logistical function of the classifier is used to obtain the input, set of weighted functions, and the correlation between event classes [17]. The accuracy and generalizability of the model can be increased by proper selection of the features. The feature vector i is categorized as positive, neutral, or negative with mathematical expression represented as:
(5)
3.3.2Naive Bayes
The Naive Bayes is a probabilistic based classifier that estimates the group probability [27]. This classifier requires minimal amount of training data. It gives better results due to its strong foundation and simplicity [31]. The Bayes theorem is based on the mathematical equation given as [23]:
(6)
3.3.3Decision tree
The decision tree classifier provides provision of multi-stage decisions by distributing a complicated problem into a union of a smaller one [10, 18]. Data classification is performed by using entropy technique represented as:
(7)
3.3.4Random forest classifier
Random forest classifier uses many decision trees to resolve the regression and classification problems [6]. This classifier operates by generating many decision-making models during training and anticipating the most common classes of decision-makers. It uses the Gini Index and Entropy for the classification of data which are mathematically defined as:
(8)
(9)
3.3.5AdaBoost algorithm
AdaBoost is widely used boosting algorithm based on an ensemble approach for building a strong classifier from several weak classifiers [15]. It integrates the several classifiers in each cycle with training set selection and delivers the final vote.
3.3.6Gradient boosting classifier
Gradient boosting classifiers combine many weak learning models to generate a potent prediction model for categorization of huge data-set. The bias error can be reduced by this model. The gradient boosting model create an approximation,
(10)
3.3.7Extreme gradient boosting classifier
XGB includes the collection of gradient boosting techniques designed for current data science challenges and tools. It is an ensemble model of classification and regression tree sets (CART). XGB is highly scalable parallelizable, faster, and regularised to control over-fitting. The mathematical description of this model is given as:
(11)
3.3.8Stack ensemble machine learning model
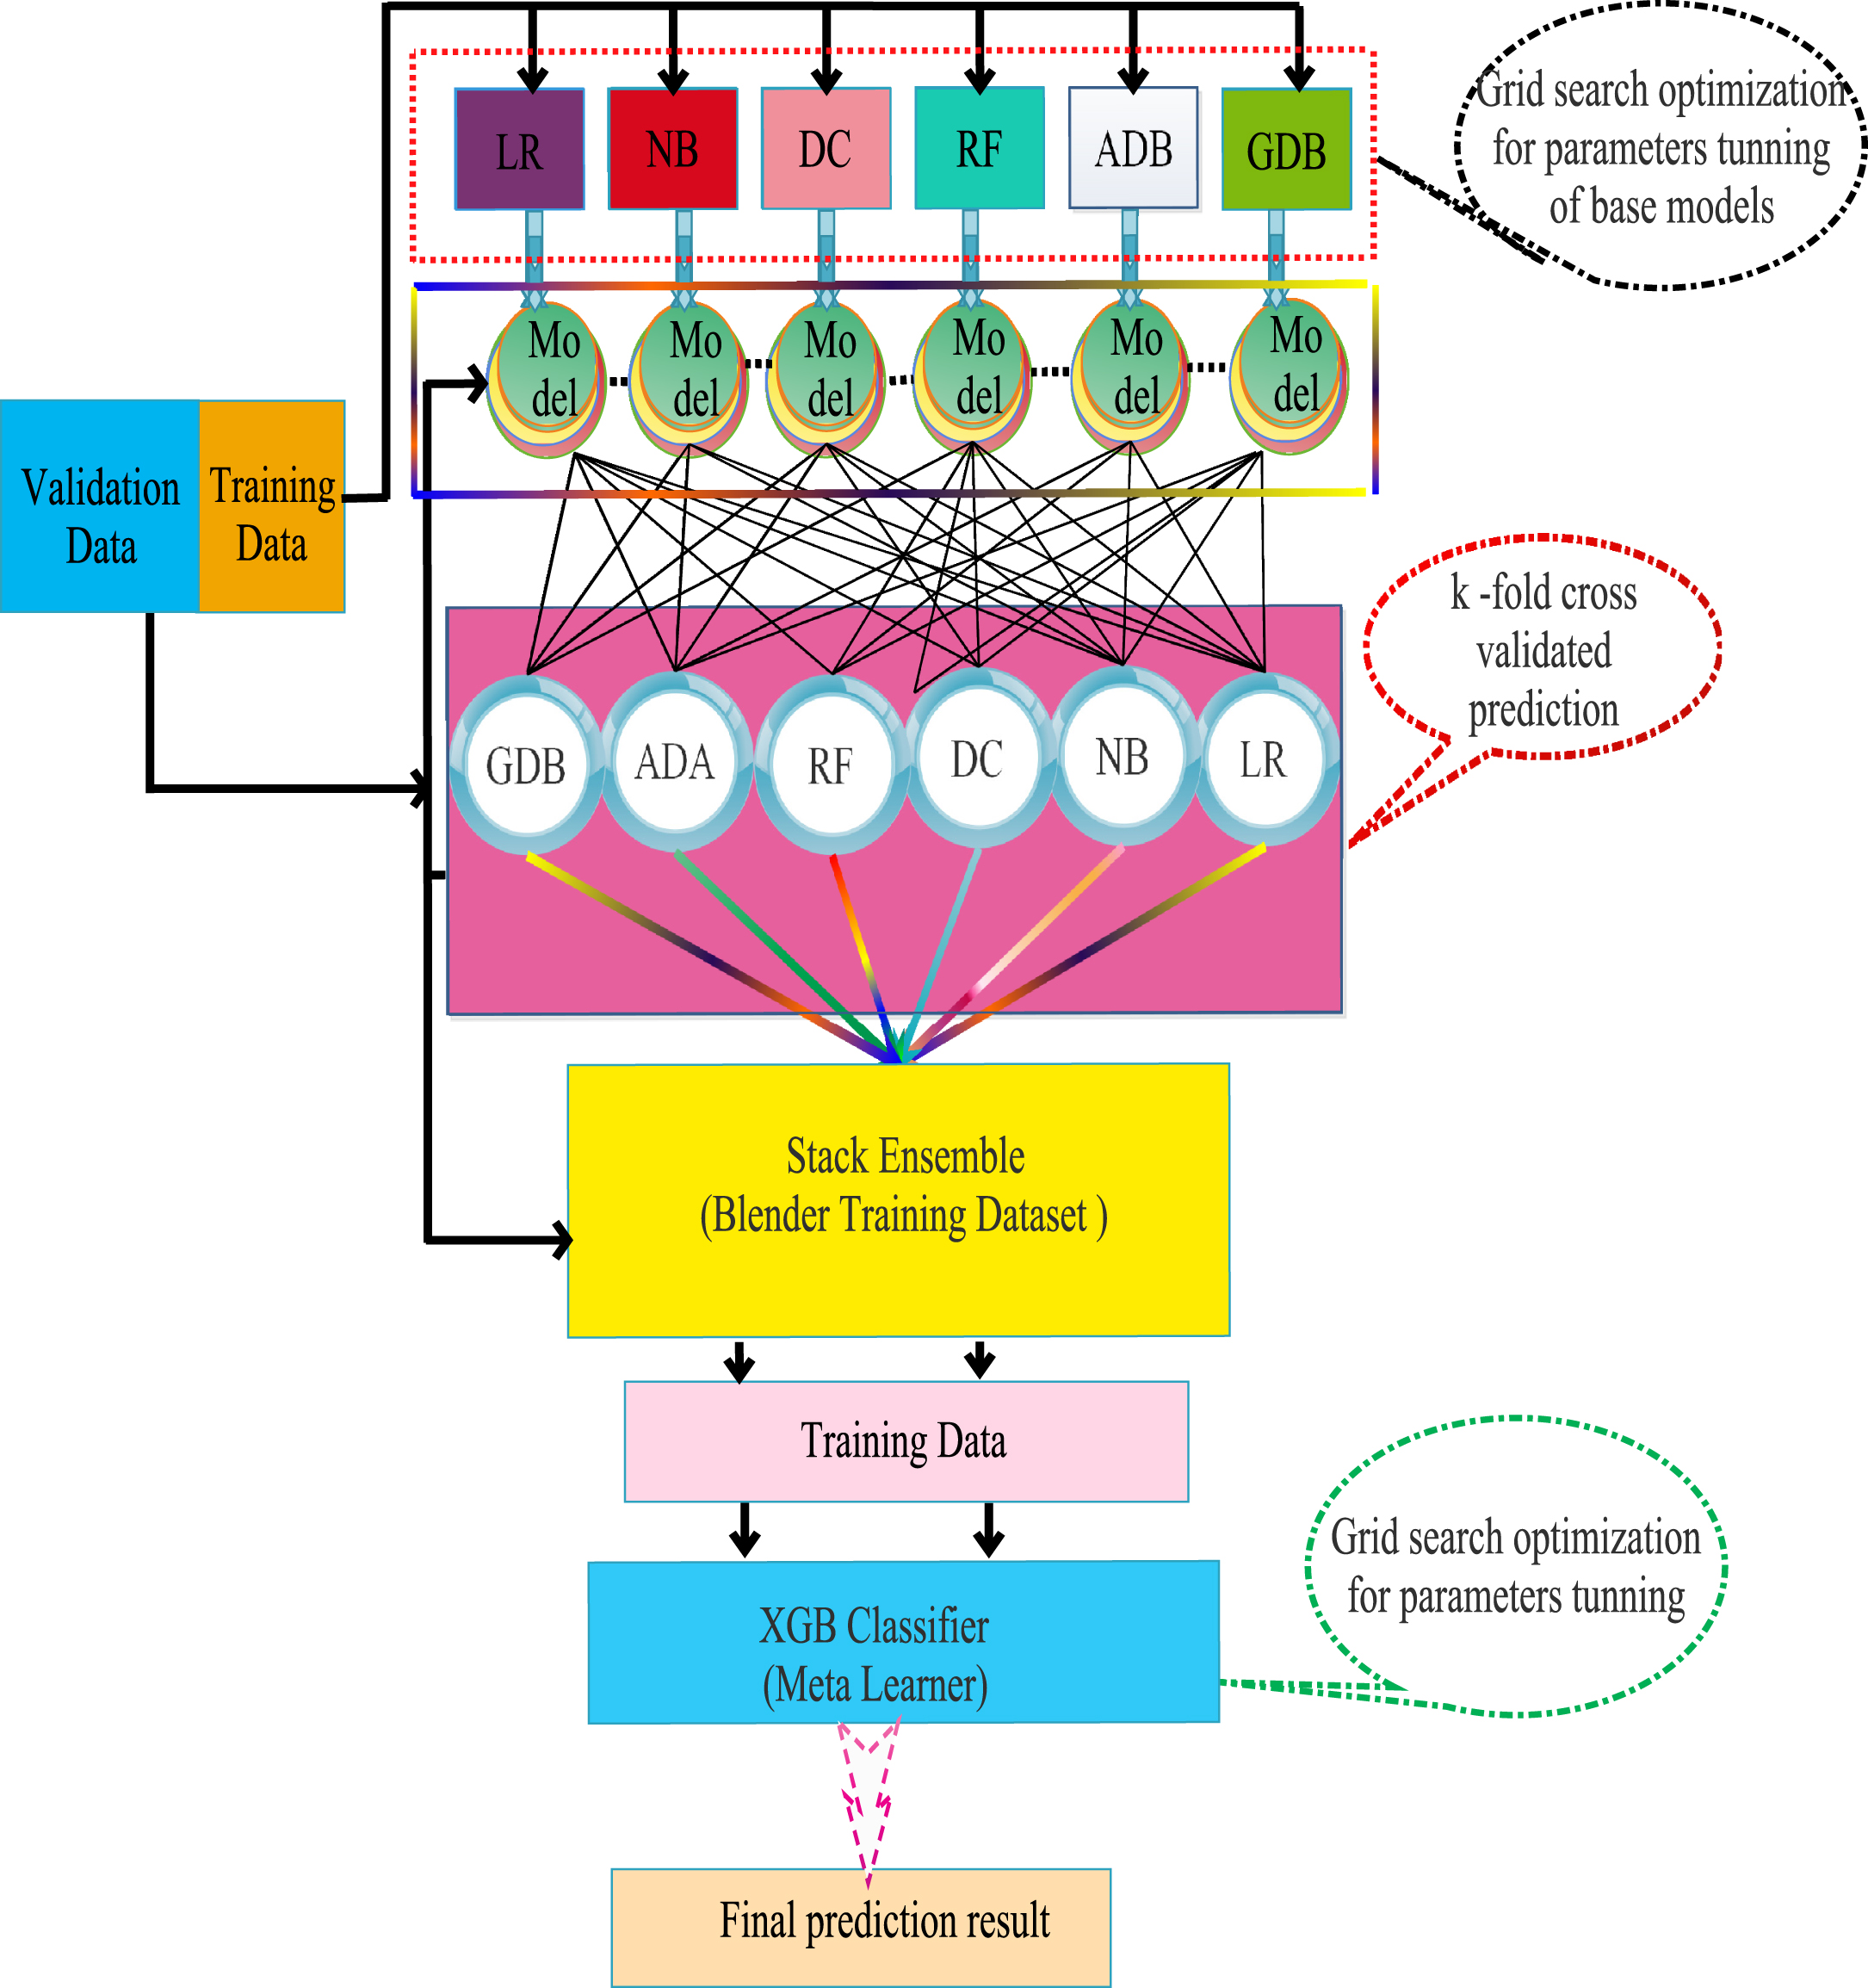
The results of the machine learning model can be improved by an ensemble machine learning technique for training and testing [8]. Stack ensemble machine learning technique enables a better predictive model as compared to a single model by combining predictions from several models [14, 22, 36]. Block diagram of stacking machine learning model is shown in Fig. 4. A stacking model consists of two or more base models, in the first layer. Second layer known as Meta-Classifier combines the predictions of all base models. The multi-layer stacking ensemble technique with seven base models namely, Naive Bayes, Logistic regression, Decision Tree, Random Forest, AdaBoost, GradientBoosting, and Extreme GradientBoosting, has been used to construct an ensemble model as shown in Fig. 5. Whole training data-set is used to train all base models. Meta-Classifier model has been trained by using the output generated by base models. All base-models used in stacking are distinct and fit to the same data-set. The XGB classifier is used as a Meta-Classifier in this work. The working process of the stack ensemble model as:
i. Divide the data-set into two sets: training and testing. Afterward, the training data is broken down into K-folds.
ii. A base model is fitted into K-1 pieces and given the predictions for the Kth part.
iii. This approach is repeated until anticipated all folds.
iv. After that, the base model is fitted to the entire training data-set in order to compute performance of test data-set.
v. Repetition of steps ii-iv for other base model
vi. Predictions of the base models are used as input features for the Meta-Classifier.
vii. The second-level model is used to classify the test data-set as positive, neutral, and negative.
Fig. 4
Stacking ensemble technique.
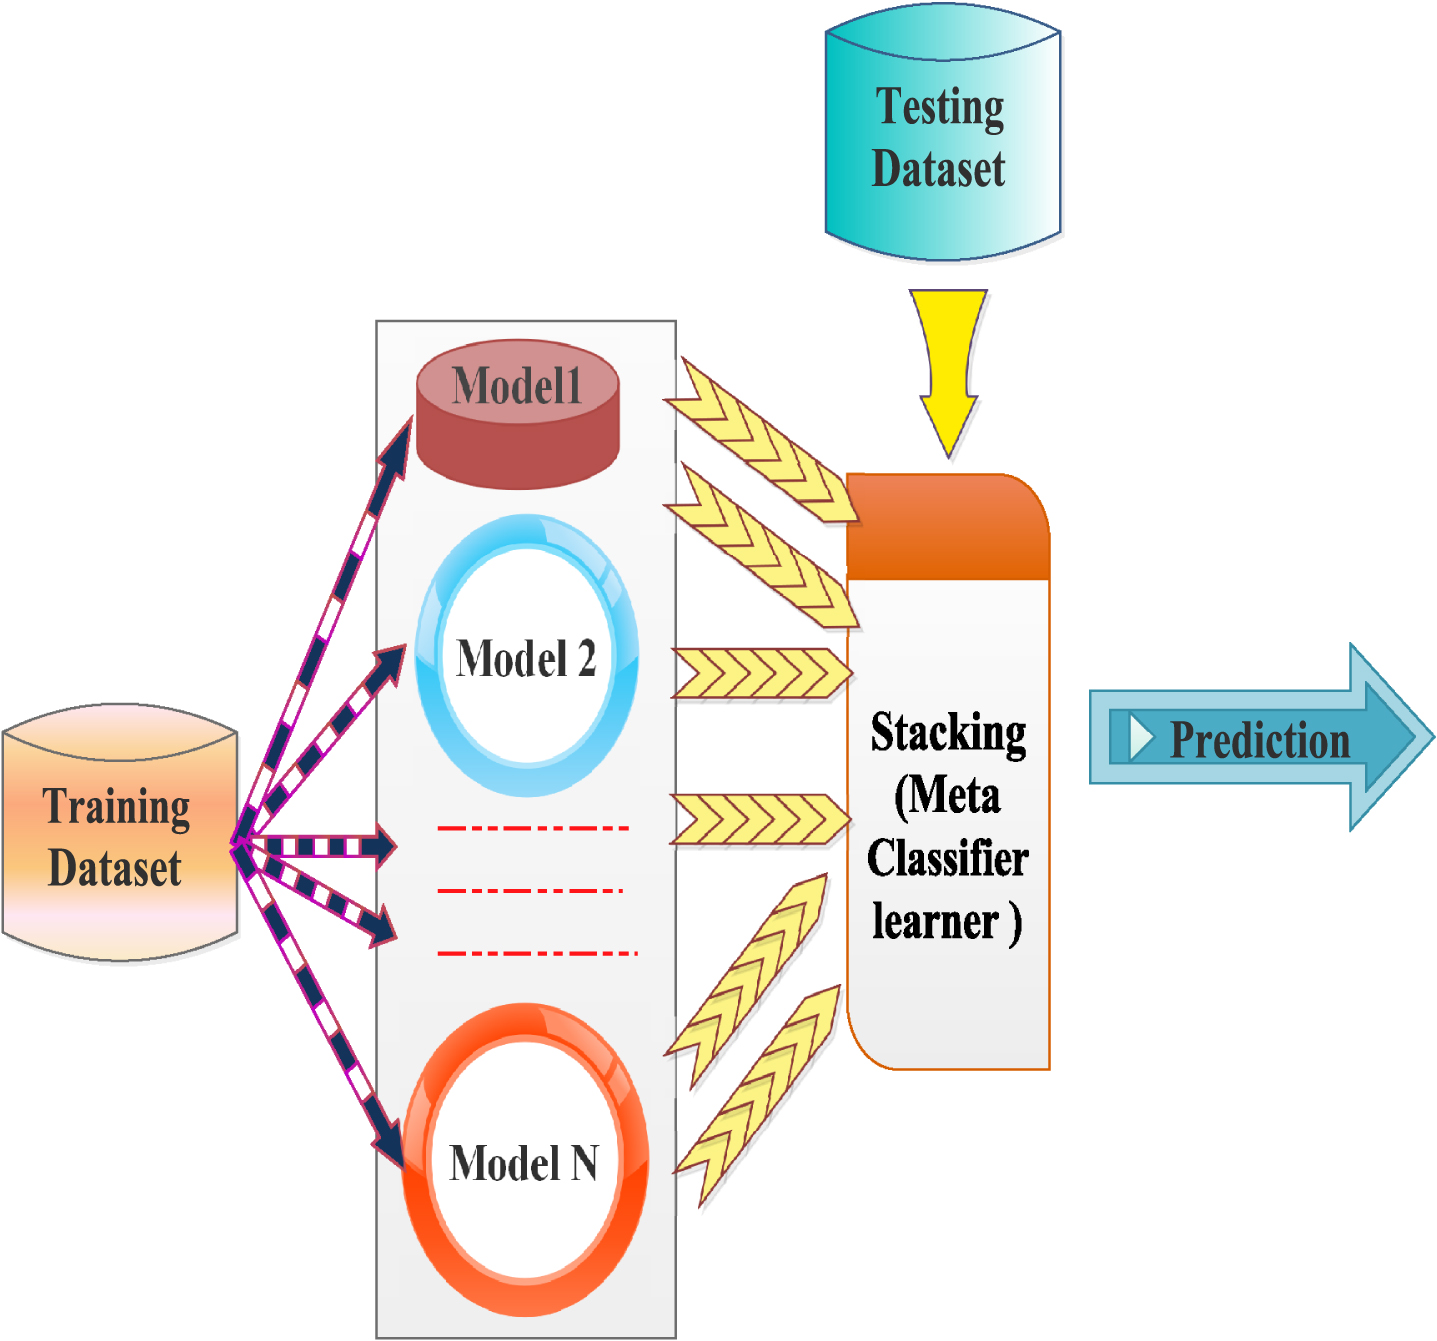
Fig. 5
Proposed hybrid machine learning architecture using multi-layer stacking ensemble.
4Experimental results and discussions
The outcome of sentiment analysis using NLP and performance evaluation of the various applied machine learning techniques are discussed in this section. In this work, total 27,810 tweets of year 2020 and 2021 are collected for sentiment analysis of Indian people about vaccines. The Python Tweepy API is used for collection of tweets. Total 15 extracted fields such as user i_d, user_name, user_location, user_description, user_created, user_ followers, user_friends, user_fav- ourites, user_verified, date, text, has_htags, source, re_tweets, favorites,re_tweet are stored as database. The sample data of the collected data-set is shown in Table 1.
Table 1
Dataset contents
| Id | User-name | Date | Text |
| 340539111-971516416 | Rachel Roh | 2020-12-20 06:06:44 | The same sources said that daikon paste may be used .. |
| 133785121-5875608579 | Gunther Fehlinger | 2020-12-12 20:06:00 | It is a little depressing to attribute success to ... |
| 133784229-5857623042 | Ch.Amjad Ali | 2020-12-12 19:30:33 | States will start getting C |
| 133784193-4170255365 | Tamer Yazar | 2020-12-12 19:29:07 | while deaths are closing in on the 300,000 mar... |
The hashtags linked to tweets of COVID-19 vaccination trend denotes the people opinions about it. Sample tweets collected from hashtags are shown in Table 2.
Table 2
Hashtags
| Hashtags 1 | Hashtags 2 | Hashtags 3 |
| #vaccination | #AstraZeneca | #VaccinesSaveLives |
| #CovidVaccine | #Pfizervaccine | #Moderna |
| #PfizerBioNTech | #COVID19Vaccine | #COVIDvaccine’ |
Figure 6(a) and (b) illustrated the outcome of the preprocessed data-set and polarity score of sentence. Polarity score value is utilized for labelling of data-set as positive, negative, and neutral. Figure 7 shows negative sentiment tweets about the COVID-19 vaccine. The negative, neutral, and positive sentiments of the user towards Pfizer or BioNTech COVID-19 vaccines are shown in Fig. 8. The word cloud for the Moderna vaccine is shown in Fig. 9, which reveals similar information as the Pfizer tweets. The side effects of this vaccine such as arm cramps, chilliness, nervousness, nausea, tiredness sensations, and other minor signs can be seen. Positive Moderna-specific tweets are similar to positive Pfizer-specific tweets posted by users who have completed their first dose. Lastly, the word cloud for Covaxin is illustrated in Fig. 10. The words “propaganda” and “political” are associated with negative tweets which require further investigation. The distribution of sentiment after data labelling is shown in Table 3. Highest 50.39%, 39.84%, and 9.77%, input tweets are analyzed as neutral, positive, and negative tweets, respectively. The COVID-19 cases decreases as positive attitude increases towards the vaccination, whereas negative attitude towards vaccines increases the COVID-19 cases.
Fig. 6
(a) Preprocessing outcome. (b) Polarity value.
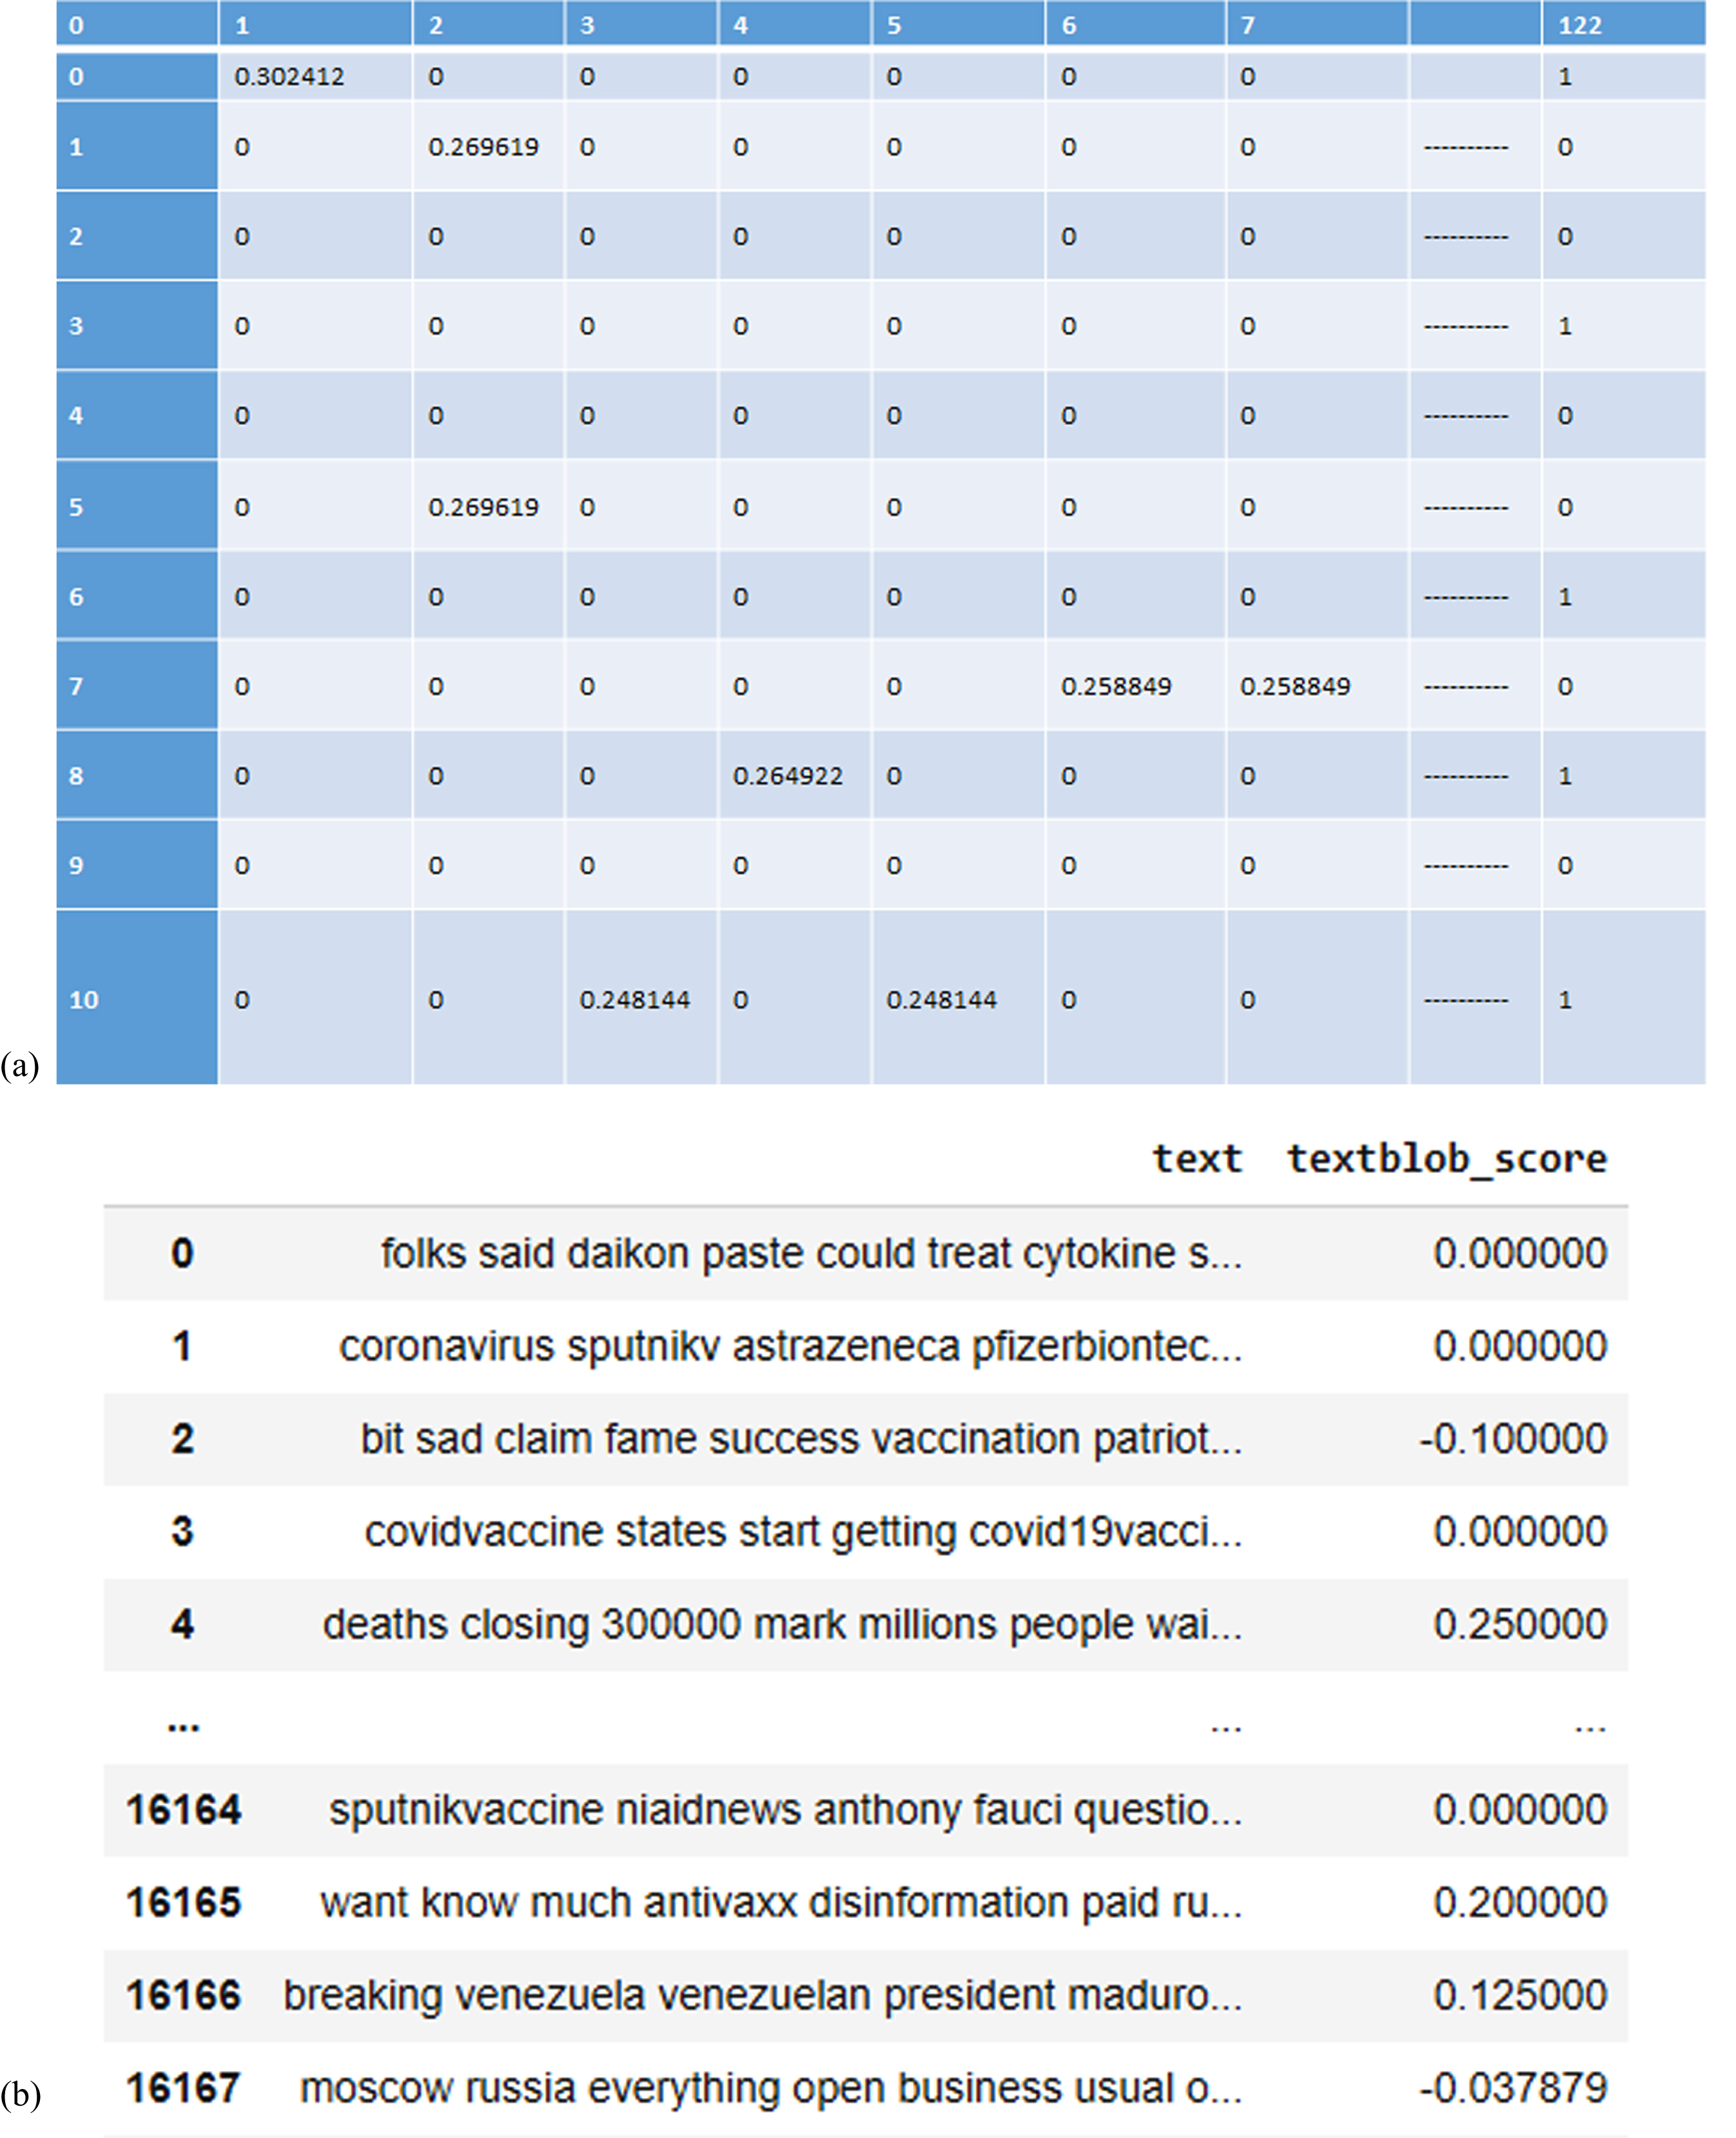
Fig. 7
Popular negative sentiment of input data-set.
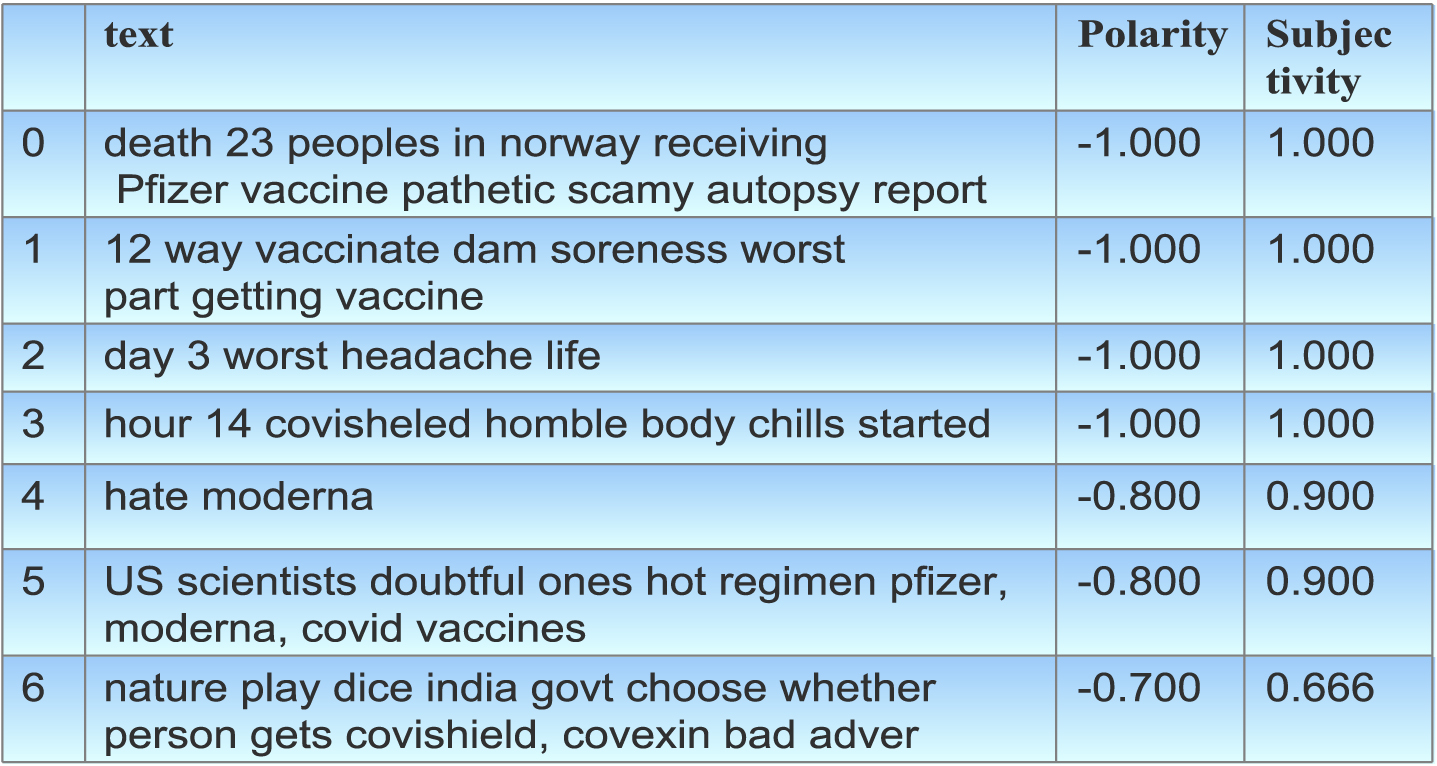
Fig. 8
Negative, positive, and neutral sentiment about Pfizer and BioNTech COVID-19 vaccine.
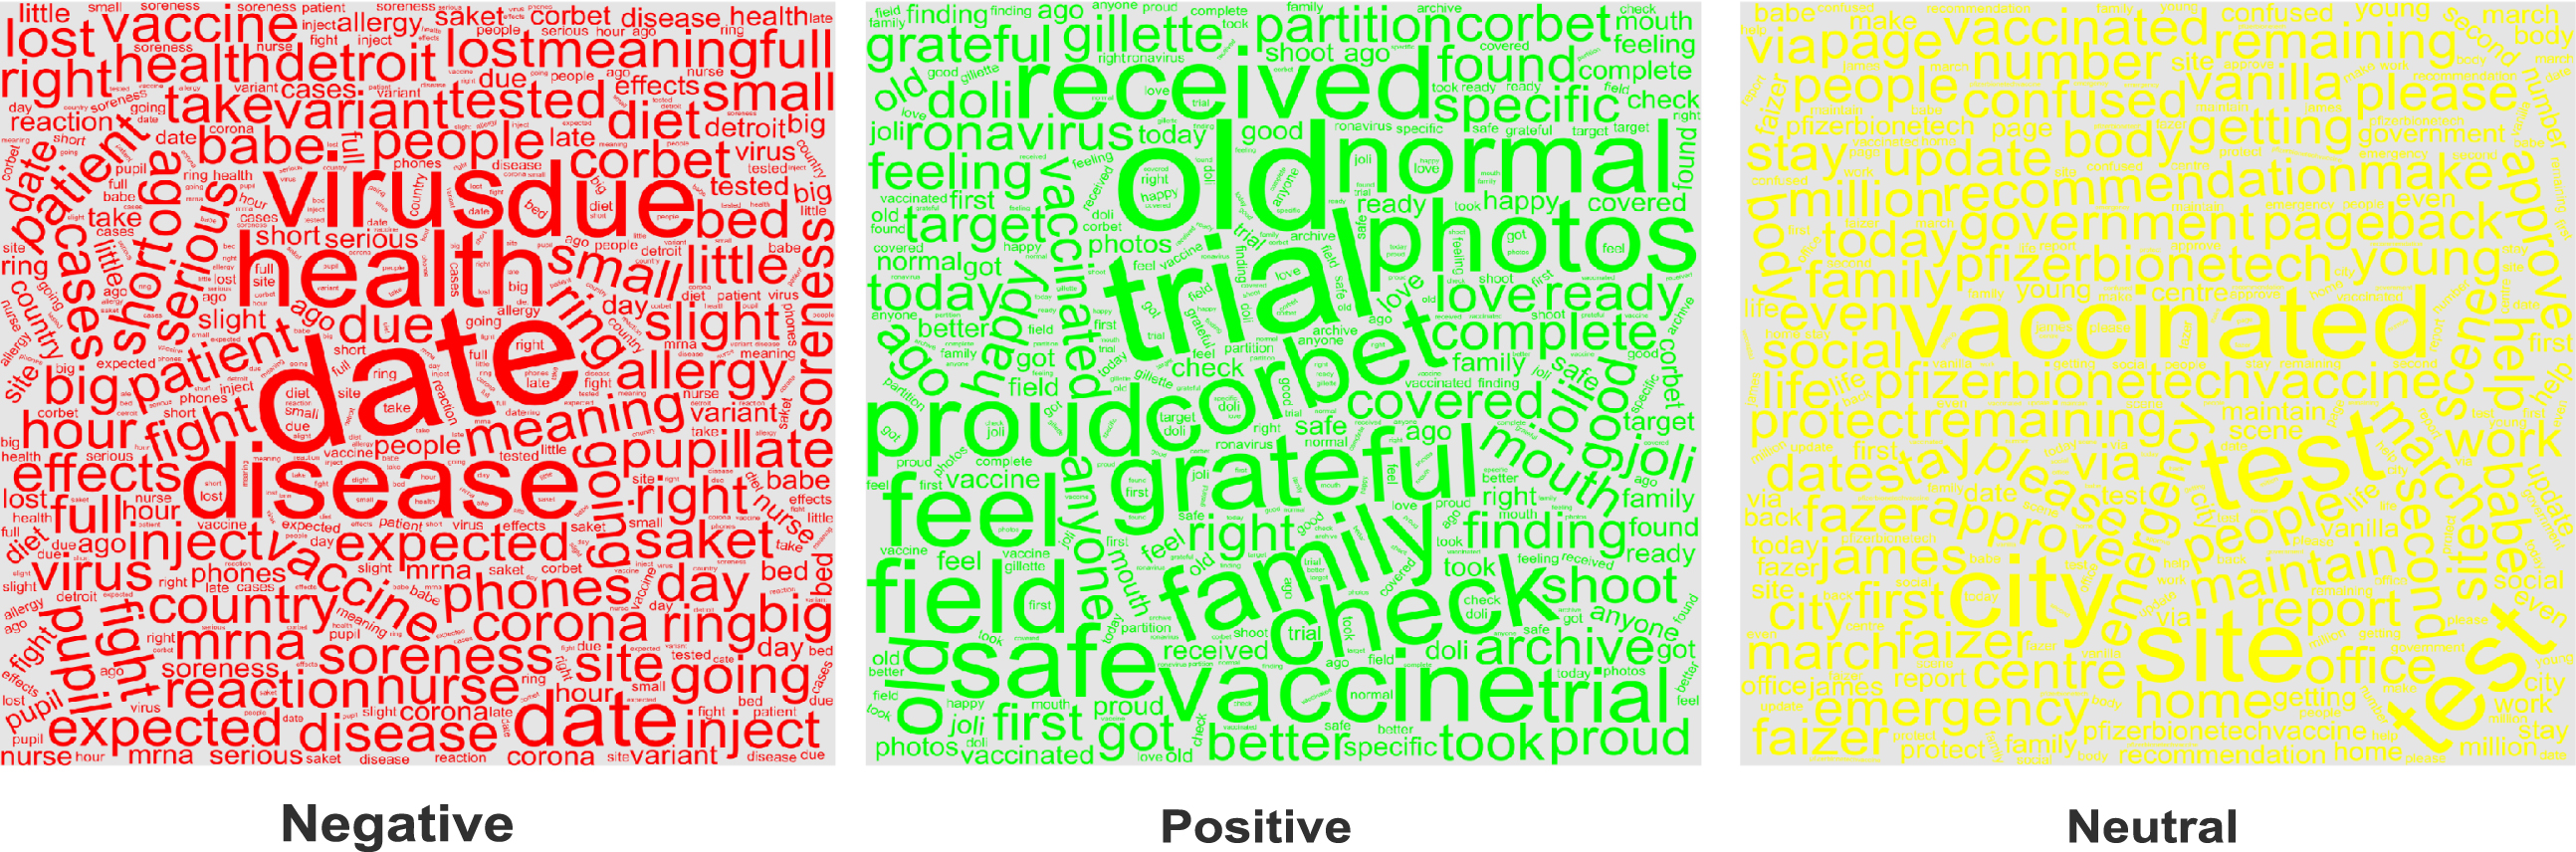
Fig. 9
Negative, positive, and neutral sentiment about Moderna COVID-19 vaccine.
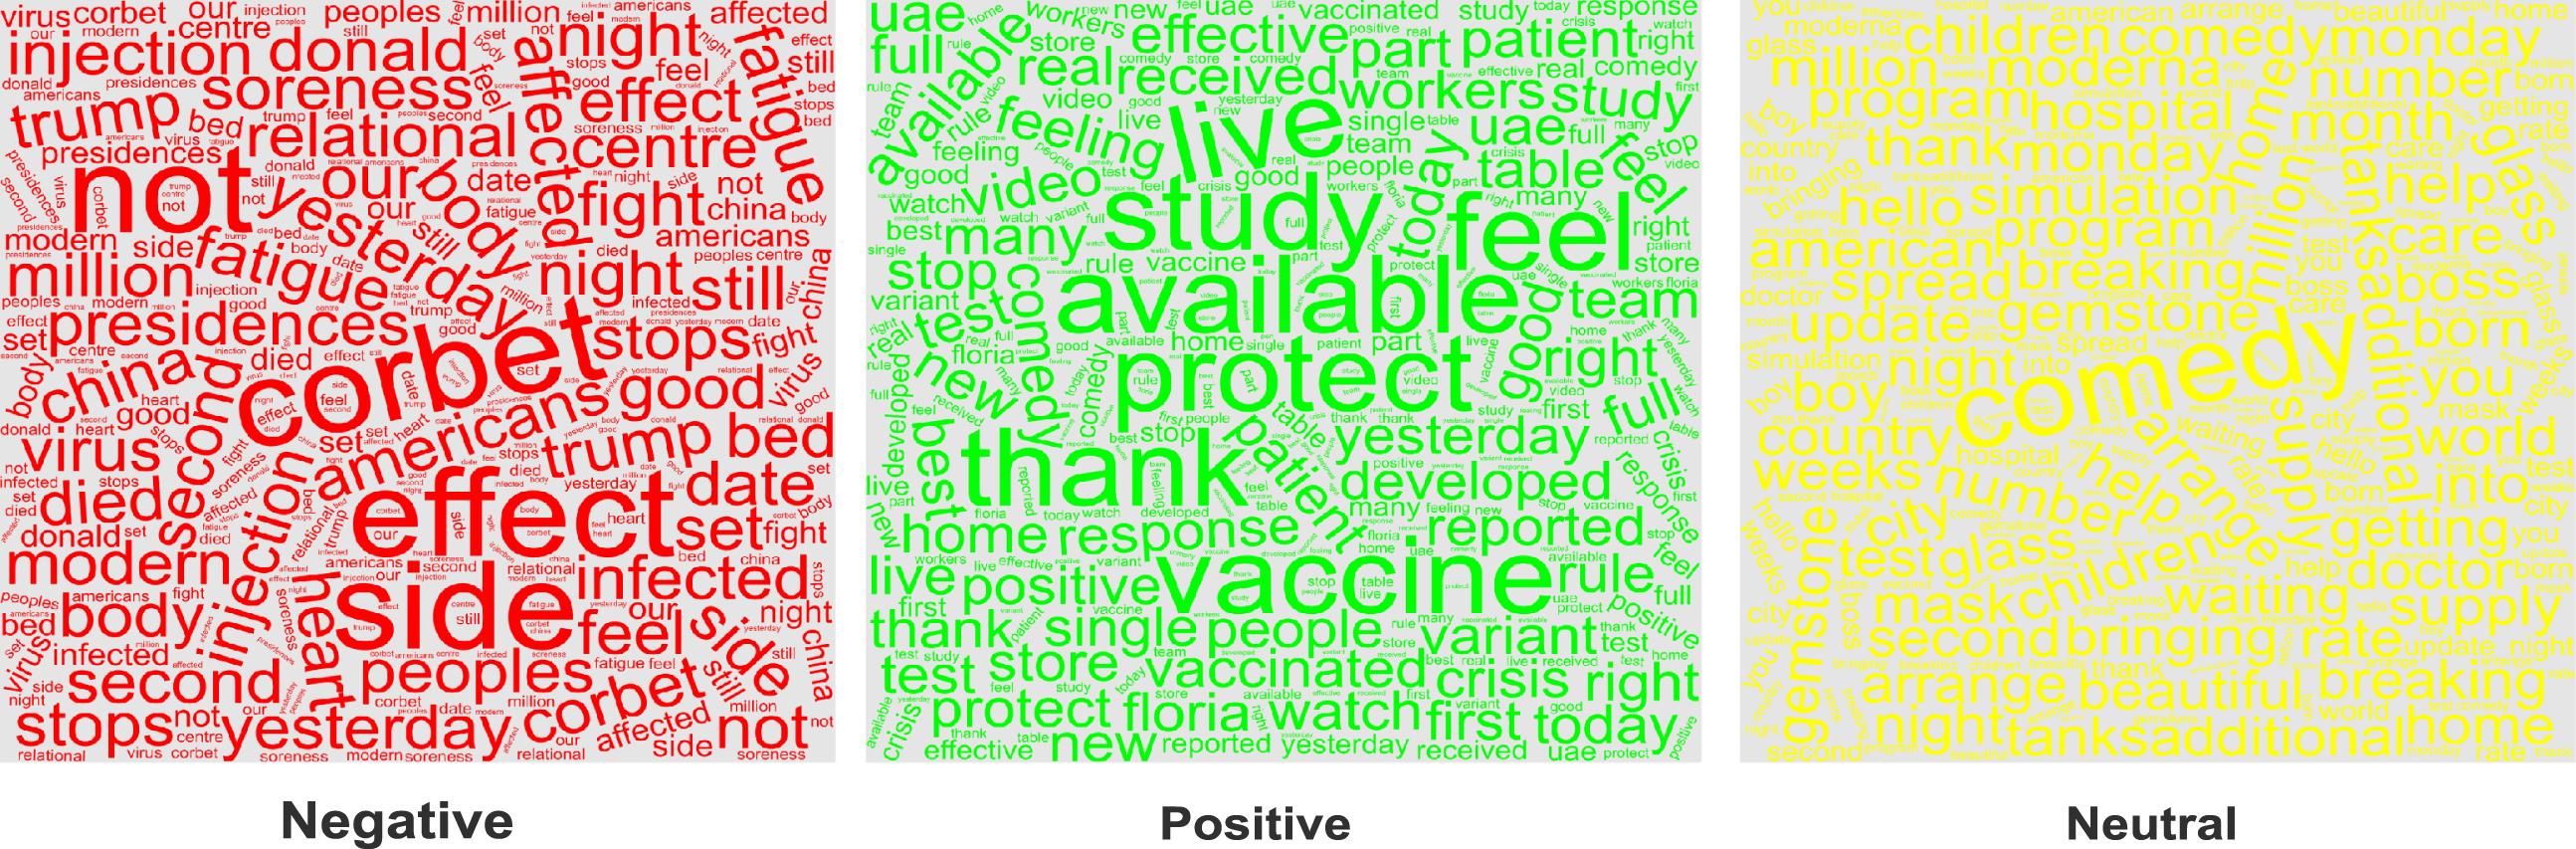
Fig. 10
Negative, positive, and neutral sentiment about Covaxin COVID-19 vaccine.
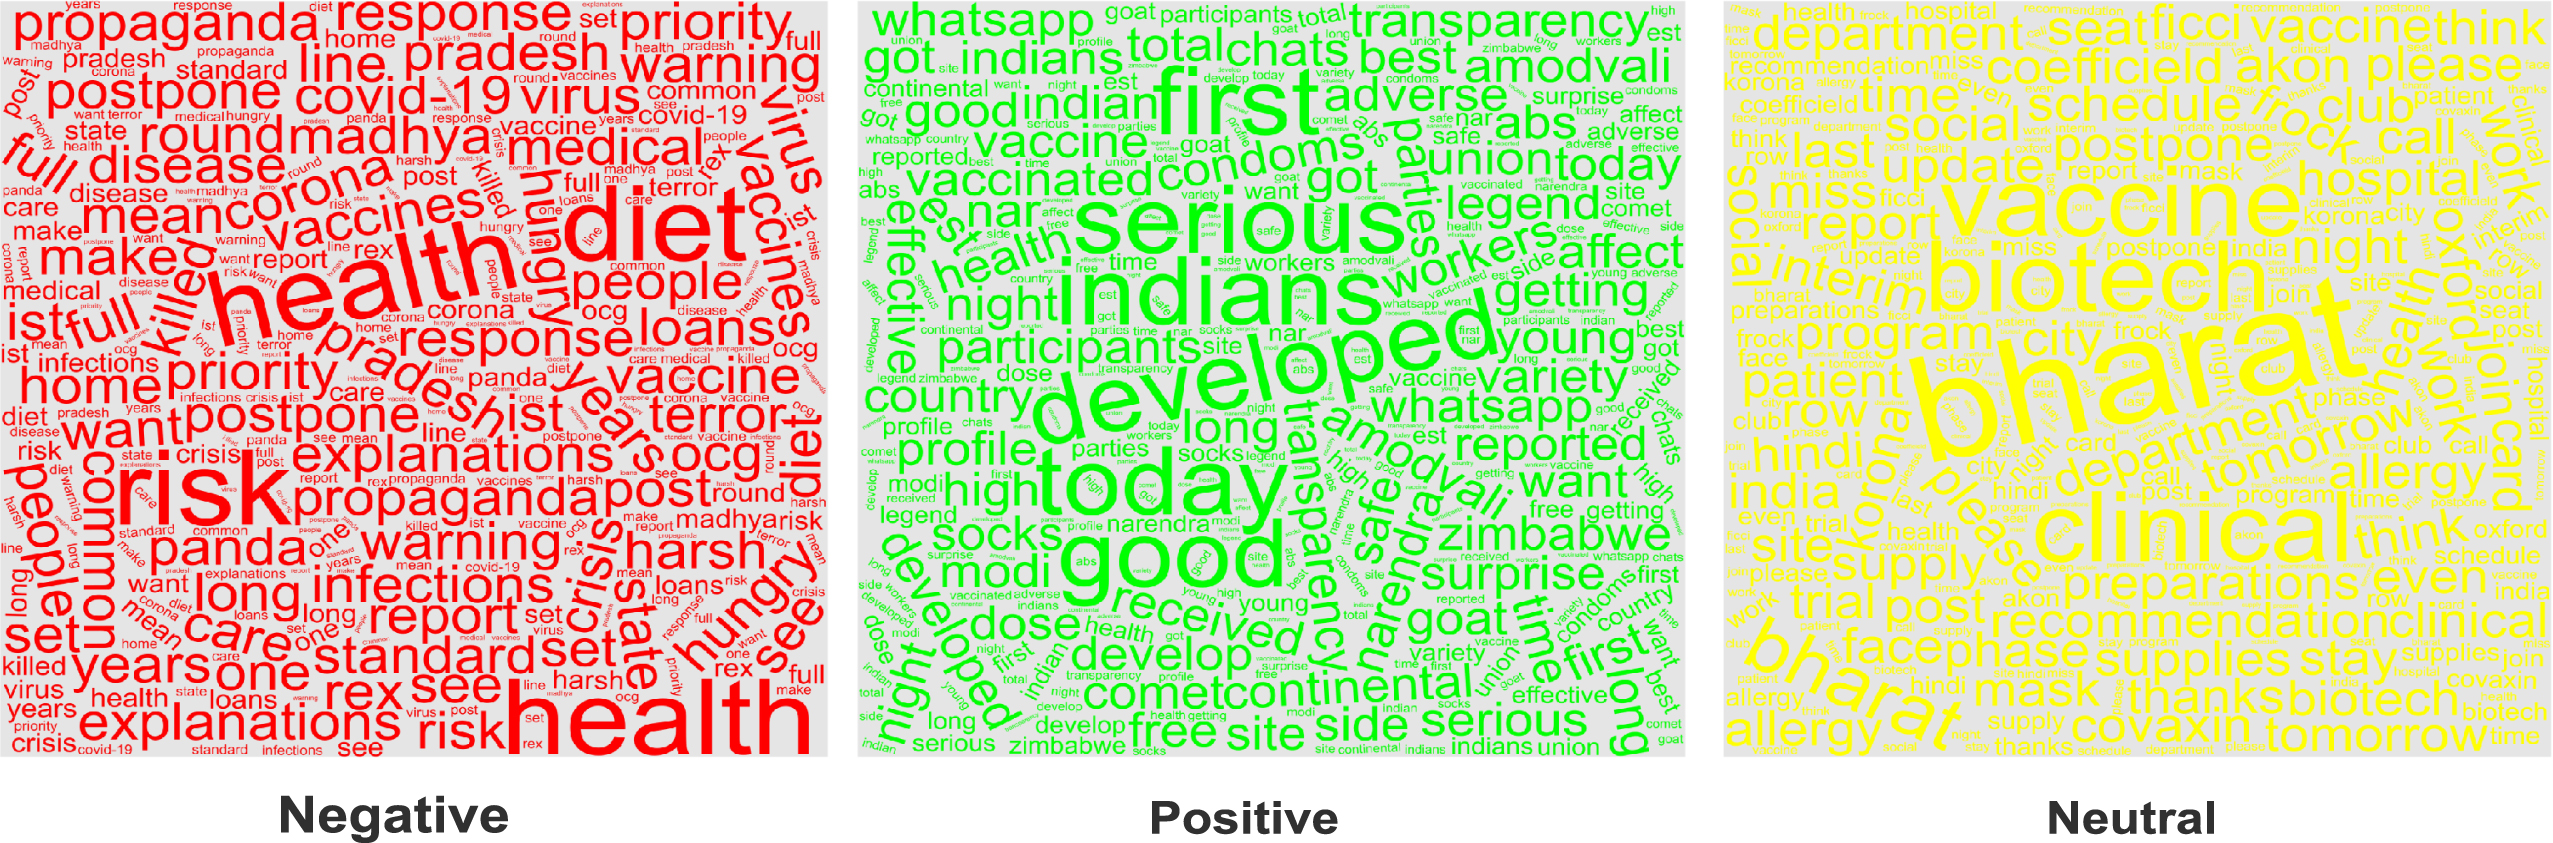
Table 3
Distribution of sentiments in data-set after data labelling
| Total number of tweets | Neutral | Positive | Negative |
| 27,810 | 14,013 (50.39%) | 11,078 (39.84%) | 2,718 (9.77%) |
4.1Classification results and discussion
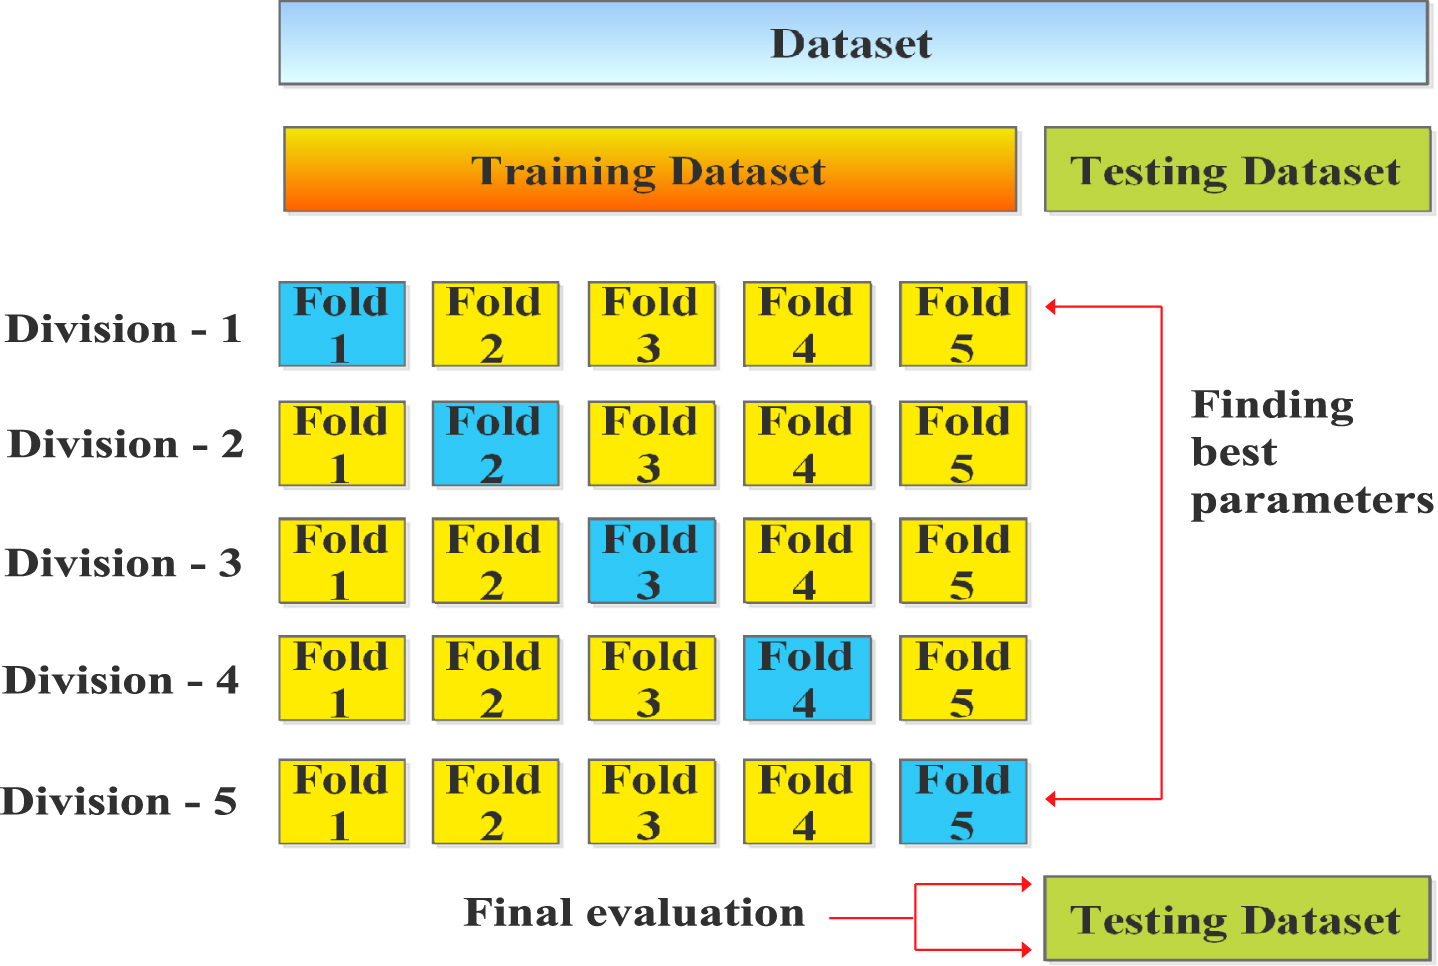
The 5-fold cross-validation technique is used for training and testing of all seven machine learning models namely, linear regression, decision tree, random forest, AdaBoost, GradientBoost, XGB, and stack ensemble. The various parameters values initialized for the stacked ensemble classifier are presented in Table 4. The various components used for training and testing with 5-fold cross-validation technique are presented in Fig. 11. First, training data-set is randomly divided into five sub-parts. The first four sub-part and last remaining sub-part is used as training and testing data, respectively.
I. First four fold training data is used to train a model.
II. Validity of the resultant model is tested for the rest of the data-set component.
Table 4
Set of parameters and its value taken for stack ensemble model
| Parameters | Value |
| max_depth | 15 |
| colsamplebytree | 0.5 |
| gamma | 0.3 |
| min_childweight | 3 |
| learning_rate | 0.1 |
Fig. 11
Five-fold cross-validation architecture.
4.2Performance assessment parameters of classifiers
Performance of classifiers are measured in terms of accuracy, precision, recall, f1- score, and receiver operating curve (ROC). Definition and mathematical expression of each parameters are given as: Accuracy is defined as the number of data correctly classified by the classifier out of the total number of data instance. The mathematical representation of accuracy is given as:
(12)
(13)
A recall is defined as accurate positive predictions divided by the total number of positive [39]. It is mathematically denoted as:
(14)
The F1-Score needs to provide W_Q weighting and occasionally W_X weighting. F1 is a weighted average precision and recall, which implies that W_Q and W_X have equal significance.
(15)
here, M_Q, M_X, W_Q, W_X denotes the truly identified, wrongly identified, truly rejected, and wrongly rejected, respectively. The classification result in terms of accuracy is shown in Fig. 12. Highest classification accuracy 97.2% is achieved by ensemble learning classifier.
Fig. 12
Accuracy classification report.
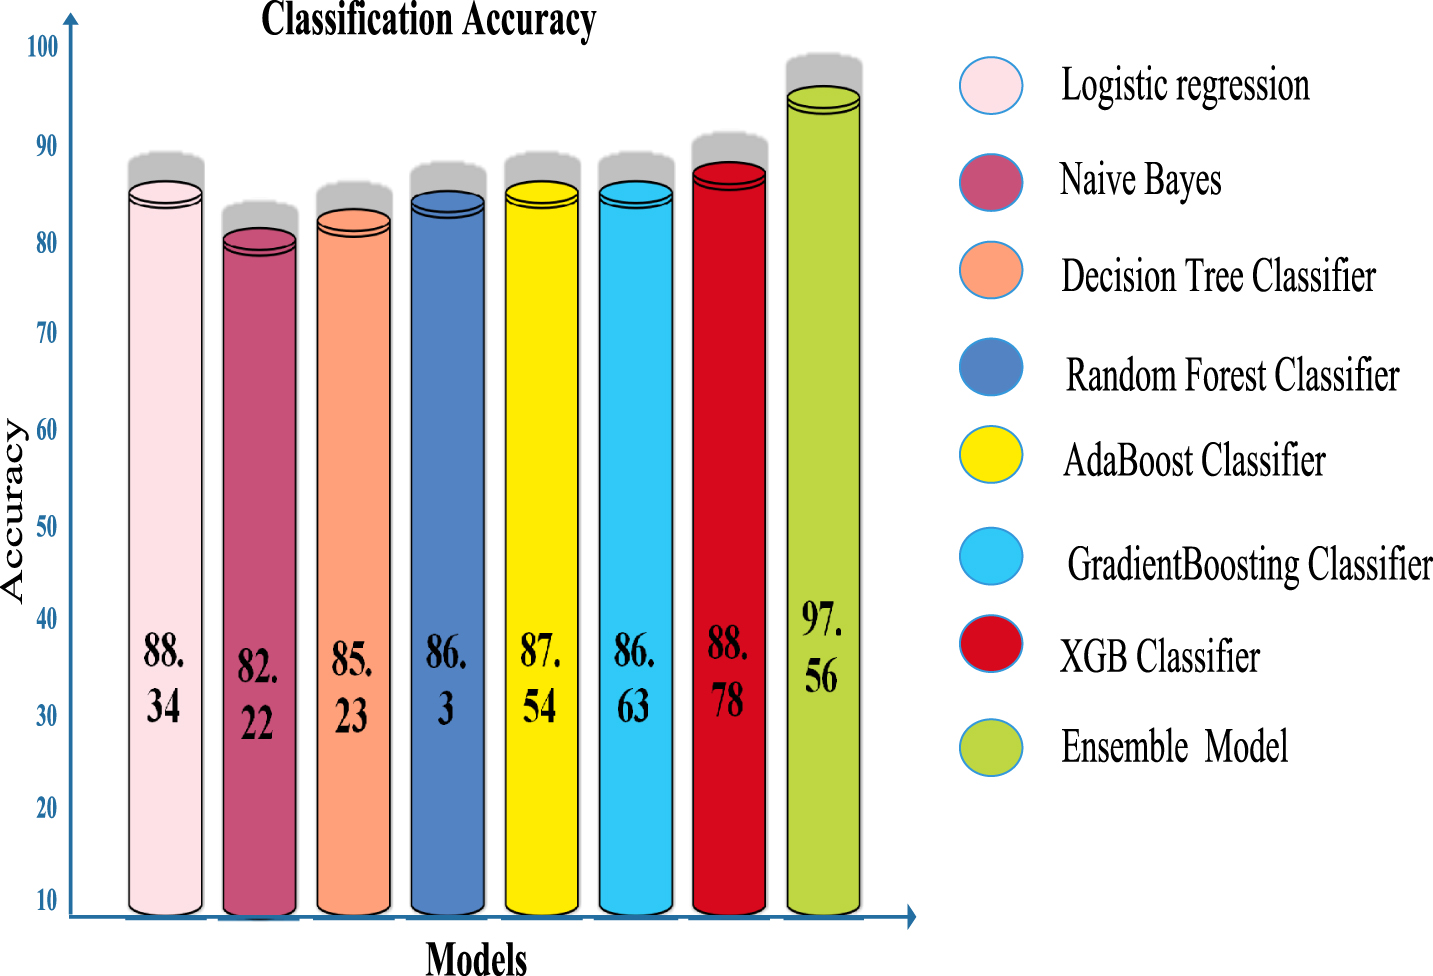
Accuracy obtained by ensemble learning model is compared with all seven machine learning model as shown in Fig. 12 The precision, recall, and F1-score achieved from stack ensemble model along with seven basic models are also presented in Table 5. The value of precision, recall, and F1-score should be 1 (high) which indicates the good results. The value of precision, recall, and F1-score obtained by the proposed model near to 1 indicates the higher accuracy level of this model. The area under curve (AUC) achieved by the ROC curve and confusion matrix of all eight classifiers are shown in Figs. 13 and 14, respectively. The highest 97.2%, 0.99%, 96.86%, 95.41%, and 96.63% of classification accuracy, AUC, precision, recall, and F1-score have been achieved, respectively, by the stack ensemble model. It can be observed from the confusion matrix that the proposed model correctly identified 97% of the positive sentiment. The 96.23% and 96.71% of sentiments are correctly classified as neutral and negative, respectively.
Fig. 13
ROC curve obtained from all classifiers.
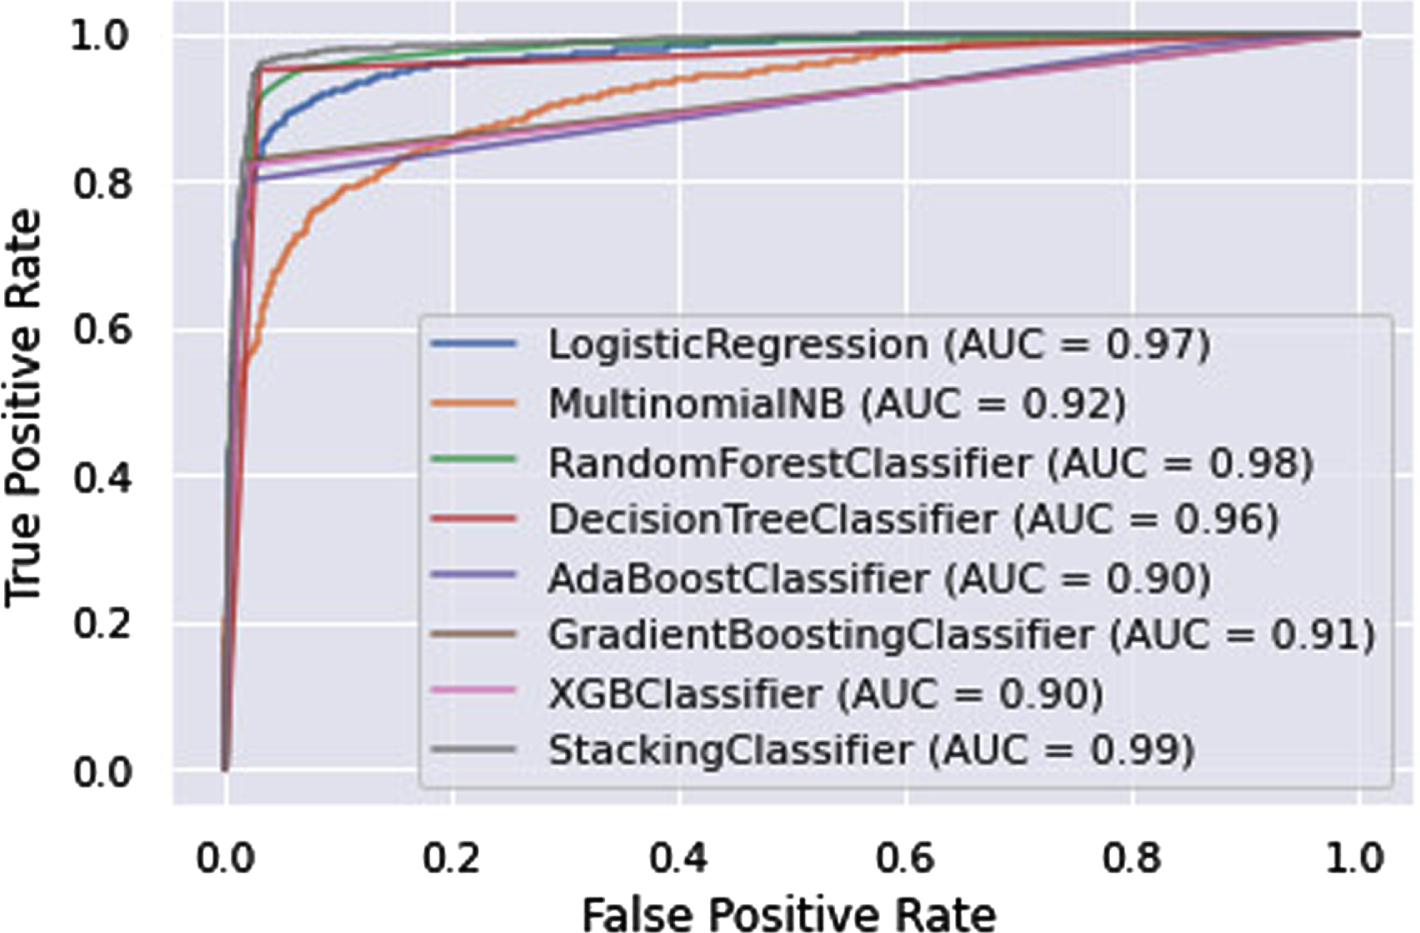
Fig. 14
Confusion matrix obtained by stack ensemble model.
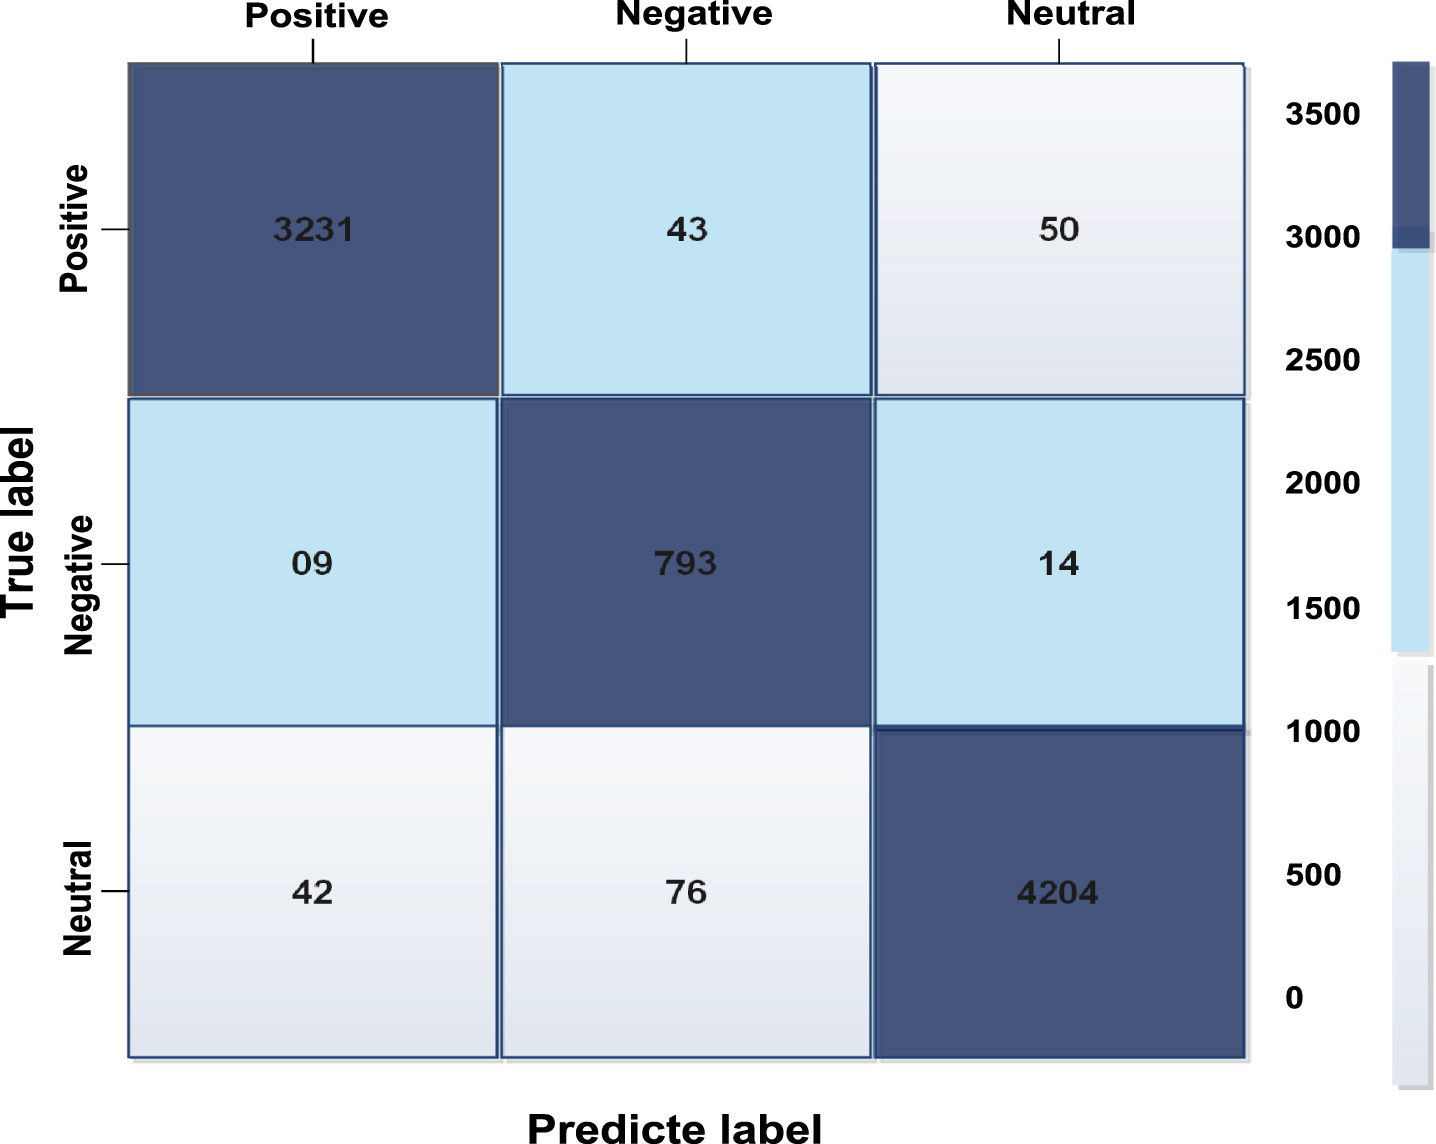
Table 5
Performance evaluation of different classifiers
| Models | Precision_score | Recall_score | F1_score |
| Logistic Regression | 95.46 | 72.46 | 82.38 |
| Naive Bayes | 88.44 | 69.78 | 71.34 |
| Random Forest | 91.43 | 85.13 | 88.17 |
| Decision Tree | 88.92 | 89.00 | 88.96 |
| AdaBoost Classifier | 92.33 | 87.83 | 84.46 |
| GradientBoosting Classifier | 95.04 | 87.67 | 89.05 |
| XGB Classifier | 95.12 | 85.49 | 87.57 |
| Stacking Classifier | 96.86 | 95.41 | 96.63 |
4.3Comparison with existing work
Outcome of the present work is compared with the existing work also. The comparative result of proposed model with some existing work is shown in Table 6. A Gaussian membership function-based fuzzy rule is presented by Chakraborty et al. for sentiments detection of COVID-19 Twitter messages and achieved highest accuracy of 79% [9]. Garcia et al. examined a large number of COVID-19 tweets of Brazil and USA [16]. The Gibbs sampling algorithm and Topic modelling for the Dirichlet Multinomial Mixture are used for sentiment analysis in their work with 87% accuracy. In the context of text analytics, Samuel et al. has been given a methodological analysis of two machine classification algorithms and compared their efficacy for categorizing COVID-19 tweets [35]. They achieved a high rating accuracy of 91% and 74% using the Naive Bayes and logistic regression techniques, respectively. The highest classification accuracy of 97.2% is achieved by the proposed stack ensemble machine learning model. The proposed model outperforms the existing work.
Table 6
Comparison of proposed work with existing work in terms of accuracy
| Author /year | Technical approach | Accuracy (in %) | Dataset |
| Garcia et al. [16] | Topic modeling with Gibbs sampling algorithm for the Dirichlet Multinomial Mixture. | 87% | COVID-19-related tweets from Brazil and USA. |
| Chakraborty et al. [9] | Gaussian membership function based fuzzy rule | 79 | COVID-19-related tweets. |
| Aygün et al.[2] | BERT models | 87 | COVID-19 vaccines. |
| Alam et al.[1] | Bidirectional LSTM (Bi-LSTM) | 90.83 | Collected from Kaggle. |
| Villavicencio et al.[38] | Naïve Bayes and RapidMiner | 81.77 | Gathered tweets related to COVID-19 vaccines in the Philippines. |
| Valdés et al.[32] | SVM classifier | 86 | COVID-19 vaccines related tweets had been Crawled through a API. |
| Samuel et al. [35] | Naïve Bayes and Logistic Regression classifiers. | 91 and 74 | COVID-19-related Tweets from Twitter. |
| Proposed Model | Bi-gram+Tf-idf+classifier (Logistic regression, Naive Bayes, Decision Tree, Random Forest, ADB, GDB, XGB) then ensemble all of them with XGB as Meta-Classifier. | 97.2 | Scrap twitter tweets related to COVID-19 vaccine. |
5Conclusions
The sentimental analysis of Indian people about various COVID-19 vaccine is analyzed in this work. The analysis has been done on the sample data collected from Twitter platform. Various natural language processing operations has been applied for text preprocessing of raw text messages. Total 50.39%, 39.84%, and 9.77% tweets are labelled as neutral, positive, and negative, respectively. The proposed stack ensemble model is used for classification of sentiment as neutral, positive, and negative. Proposed model gives highest 97.2%, 0.99%, 96.86%, 95.41%, and 96.63% of classification accuracy, AUC, Precision, Recall, and F1-score, respectively. The obtained results proved that the ensemble model outperforms the basic machine learning techniques. The classification of other sentiments such as happy, sad, and fear will be performed in future work.
Q 1: How do the general people feel about the COVID-19 vaccine?
While most people’s views on social media about vaccinations and their consequences are neutral, just 39.84 % are optimistic, which should be a source of concern for the government and policymakers. Vaccination will not be effective unless the government can persuade the majority of the population that the vaccine’s results and consequences will be positive. The government should concentrate on overcoming vaccine anxiety before introducing mass vaccination.
Q 2: What are Indian citizens’ core questions in the case of the COVID-19 vaccine?
Although nearly 11 million Indians have been infected with COVID-19. A sizable proportion of Indian people believe the pandemic has been exaggerated, according to our research. Citizens would oppose the vaccine as a result of this mindset. Aside from that, skepticism about the vaccines, skepticism about vaccine trials since receiving the vaccine, skepticism about one’s health, fear of vaccination mortality, vaccine-induced allergic reactions, skepticism against pharmaceutical firms, Concerns about data from vaccine companies, a large number of vaccines are available, and there are questions over which ones are the safest. Although the Indian general public has legitimate doubts about the COVID-19 vaccine, our research has shown that certain conspiracy theories based on superstition have not been proved, COVID-19 is inflated. Certain vaccinations are viewed with scorn or disbelief due to nationality and have also been echoed when discussing the COVID-19 vaccine. According to our research, a significant portion of the Indian population does not trust the government or pharmaceutical companies on social media. According to recent studies, even COVID-19 survivors’ immunity is only expected to last for eight months [11]. Policymakers and the government must engage in Vaccination education for the general public and the importance of returning to normal life. Governments, pharmaceutical firms, and Non-Governmental Organizations (NGOs) should make significant efforts to educate people about the vaccine program and tell them how essential it to regain normalcy. It is necessary to pay special attention to people’s fears and misconceptions about COVID-19 vaccines to inspire and persuade people to get vaccines. With just over 39.84% of people saying they are optimistic about vaccinations, the government should overcome vaccine anxiety before introducing mass vaccination. It is crucial to understand why people hesitate to get a COVID-19 vaccination. It can assist health officials in raising vaccination awareness and reduce the spread of the illness. According to studies, vaccine uptake is a complex decision-making process. Using Random Forest, decision trees, logistic regression, and Naive Bayes categorize feelings as positive, neutral, or negative. The proposed ensemble model achieved 97.2% accuracy and outperforms to all other classifiers in terms of classification accuracy.
References
[1] | Alam K.N. , Khan M.S. , Dhruba A.R. , Khan M.M. , Al-Amri J.F. , Masud M. and Rawashdeh M. , Deep learningbased sentiment analysis of covid-19 vaccination responses from twitter data, Computational and Mathematical Methods in Medicine, (2021) . |
[2] | Aygun I. , Kaya B. and Kaya M. , Aspect based twitter sentiment analysis on vaccination and vaccine types in covid-19 pandemic with deep learning, IEEE Journal of Biomedical and Health Informatics, ((2021) ). |
[3] | Baker Q.B. , Shatnawi F. , Rawashdeh S. , Al-Smadi M. and Jararweh Y. , Detecting epidemic diseases using sentiment analysis of arabic tweets, J Univers Comput Sci 26: ((2020) ), 50–70. |
[4] | Bonnevie E. , Goldbarg J. , Gallegos-Jeffrey A.K. , Rosenberg S.D. , Wartella E. and Smyser J. , Content themes and influential voices within vaccine opposition on twitter, American Journal of Public Health 110: ((2020) ), S326–S330. |
[5] | Brajawidagda U. and Chatfield A.T. , Twitter tsunami early warning network: A social network analysis of twitter information flows, ((2012) ). |
[6] | Breiman L. , Random forests, Machine Learning 45: ((2001) ), 5–32. |
[7] | Buntain C. , Golbeck J. , Liu B. and LaFree G. , Evaluating public response to the boston marathon bombing and other acts of terrorism through twitter, in: Proceedings of the international AAAI conference on web and social media, ((2016) ). |
[8] | Cambria E. , Das D. , Bandyopadhyay S. , Feraco A. ((2017) ), Affective computing and sentiment analysis, in: A practical guide to sentiment analysis, Springer, pp. 1–10. |
[9] | Chakraborty K. , Bhatia S. , Bhattacharyya S. , Platos J. , Bag R. and Hassanien A.E. , Sentiment analysis of covid-19 tweets by deep learning classifiers– a study to show how popularity is affecting accuracy in social media, Applied Soft Computing 97: ((2020) ), 106754. |
[10] | Cockett J.R.B. , Discrete decision theory: Manipulations, Theoretical Computer Science 54: ((1987) ), 215–236. |
[11] | R. COVID, 19. patients last immunity for 8 months, raise hopes for vaccine: Study. |
[12] | Dror A.A. , Eisenbach N. , Taiber S. , Morozov N.G. , Mizrachi M. , Zigron A. , Srouji S. and Sela E. , Vaccine hesitancy: the next challenge in the fight against covid-19, European Journal of Epidemiology 35: ((2020) ), 775–779. |
[13] | Earle A. , Jagerskog A. and Ojendal J. , Transboundary WaterManagement: Principles and Practice, ((2010) ). |
[14] | Fayaz M. , Khan A. , Rahman J.U. , Alharbi A. , Uddin M.I. and Alouffi B. , Ensemble machine learning model for classification of spam product reviews, Complexity 2020: ((2020) ). |
[15] | Freund Y. and Schapire R.E. , A decision-theoretic generalization of on-line learning and an application to boosting, Journal of Computer and System Sciences 55: ((1997) ), 119–139. |
[16] | Garcia K. and Berton L. , Topic detection and sentiment analysis in twitter content related to covid-19 from brazil and the usa, Applied Soft Computing 101: ((2021) ), 107057. doi: https://doi.org/10.1016/j.asoc.2020.107057 |
[17] | Ghosh M. and Sanyal G. , Analysing sentiments based on multi feature combination with supervised learning, International Journal of Data Mining, Modelling and Management 11: ((2019) ), 391–416. |
[18] | Haralick R.M. , The table look-up rule, Communications in Statistics-Theory and Methods 5: ((1976) ), 1163–1191. |
[19] | Hou K. , Hou T. and Cai L. , Public attention about covid-19 on social media: An investigation based on data mining and text analysis, Personality and Individual Differences 175: ((2021) ), 110701. |
[20] | Hung M. , Lauren E. , Hon E.S. , Birmingham W.C. , Xu J. , Su S. , Hon S.D. , Park J. , Dang P. and Lipsky M.S. , Social network analysis of covid-19 sentiments: Application of artificial intelligence, J Med Internet Res 22: ((2020) ), e22590. URL: http://www.jmir.org/2020/8/e22590/, doi:10.2196/22590. |
[21] | Jain V.K. and Kumar S. , Effective surveillance and predictive mapping of mosquito-borne diseases using social media, Journal of Computational Science 25: ((2018) ), 406–415. |
[22] | Kyriakides G. and Margaritis K. , Hands-On Ensemble Learning with Python: Build highly optimized ensemble machine learning models using scikit-learn and Keras, Packt Publishing ((2019) ), URL: https://books.google.co.in/books?id=N4mkDwAAQBAJ |
[23] | Lindley D.V. , Fiducial distributions and bayes’ theorem, Journal of the Royal Statistical Society, Series B (Methodological) ((1958) ), 102–107. |
[24] | Liu J. , Liu P. , Zhu Z. , Li X. and Xu G. , Graph convolutional networks with bidirectional attention for aspect-based sentiment classification, Applied Sciences 11: ((2021) ), 1528. |
[25] | Lwin M.O. , Lu J. , Sheldenkar A. , Schulz P.J. , Shin W. , Gupta R. and Yang Y. , Global sentiments surrounding the covid-19 pandemic on twitter: analysis of twitter trends, JMIR Public Health and Surveillance 6: ((2020) ), e19447. |
[26] | Malik A. , McFadden S. , Elharake J. and Omer S. , Determinants of covid-19 vaccine acceptance in the us, Eclinicalmedicine 26: ((2020) ), 100495. |
[27] | McKeown K. , Agarwal A. and Biadsy F. , Contextual phrase-level polarity analysis using lexical affect scoring and syntactic n-grams, ((2009) ). |
[28] | Nezhad Z.B. and Deihimi M.A. , Twitter sentiment analysis from iran about covid 19 vaccine, Diabetes & Metabolic Syndrome: Clinical Research & Reviews 16: ((2022) ), 102367. |
[29] | Organization W.H. , Global situation report-55, ((2020) ). https://www.who.int/publications/m/item/situation-report–55 |
[30] | Pal M. , Berhanu G. , Desalegn C. and Kandi V. , Severe acute respiratory syndrome coronavirus-2 (sars-cov-2): an update, Cureus 12: ((2020) ). |
[31] | Patil T.R. , Msss performance analysis of naive bayes and j48 classification algorithm for data classification, intl. Journal of Computer Science and Applications 6: ((2013) ). |
[32] | Piedrahita-Valdes H. , Piedrahita-Castillo D. , Bermejo-Higuera J. , Guillem-Saiz P. , Bermejo-Higuera J.R. , Guillem-Saiz J. , Sicilia-Montalvo J.A. and Machio-Regidor F. , Vaccine hesitancy on social media: Sentiment analysis from june 2011 to april 2019, Vaccines 9: ((2021) ), 28. |
[33] | Pogue K. , Jensen J.L. , Stancil C.K. , Ferguson D.G. , Hughes S.J. , Mello E.J. , Burgess R. , Berges B.K. , Quaye A. and Poole B.D. , Influences on attitudes regarding potential covid-19 vaccination in the united states, Vaccines 8: ((2020) ), 582. |
[34] | Praveen S. , Ittamalla R. and Deepak G. , Analyzing the attitude of indian citizens towards covid-19 vaccine– a text analytics study, Diabetes & Metabolic Syndrome: Clinical Research & Reviews 15: ((2021) ), 595–599. |
[35] | Samuel J. , Ali G.G.M.N. , Rahman M.M. , Esawi E. and Samuel Y. , Covid-19 public sentiment insights and machine learning for tweets classification, Information 11: ((2020) ). URL: https://www.mdpi.com/2078-2489/11/6/314, doi: 10.3390/info11060314. |
[36] | Sarkar D. and Natarajan V. , Ensemble Machine Learning Cookbook: Over 35 practical recipes to explore ensemble machine learning techniques using Python, Packt Publishing, ((2019) ). URL: https://books.google.co.in/books?id=dCWGDwAAQBAJ |
[37] | Shen F. , Zhao X. , Li Z. , Li K. and Meng Z. , A novel ensemble classification model based on neural networks and a classifier optimisation technique for imbalanced credit risk evaluation, Physica A: Statistical Mechanics and its Applications 526: ((2019) ), 121073. |
[38] | Villavicencio C. , Macrohon J.J. , Inbaraj X.A. , Jeng J.H. and Hsieh J.G. , Twitter sentiment analysis towards covid-19 vaccines in the philippines using naive bayes, Information 12: ((2021) ), 204. |
[39] | Vujović D. , Classification model evaluation metrics, Int J Adv 12: ((2021) ), 6. |
[40] | Wang B. and Zhuang J. , Crisis information distribution on twitter: a content analysis of tweets during hurricane sandy, Natural Hazards 89: ((2017) ), 161–181. |

