
Fuzzy enhancement and deep hash layer based neural network to detect Covid-19
Abstract
This paper proposes a deep learning framework for Covid-19 detection by using chest X-ray images. The proposed method first enhances the image by using fuzzy logic which improvises the pixel intensity and suppresses background noise. This improvement enhances the X-ray image quality which is generally not performed in conventional methods. The pre-processing image enhancement is achieved by modeling the fuzzy membership function in terms of intensity and noise threshold. After this enhancement we use a block based method which divides the image into smooth and detailed regions which forms a feature set for feature extraction. After feature extraction we insert a hashing layer after fully connected layer in the neural network. This hash layer is advantageous in terms of improving the overall accuracy by computing the feature distances effectively. We have used a regularization parameter which minimizes the feature distance between similar samples and maximizes the feature distance between dissimilar samples. Finally, classification is done for detection of Covid-19 infection. The simulation results present a comparison of proposed model with existing methods in terms of some well-known performance indices. Various performance metrics have been analysed such as Overall Accuracy, F-measure, specificity, sensitivity and kappa statistics with values 93.53%, 93.23%, 92.74%, 92.02% and 88.70% respectively for 20:80 training to testing sample ratios; 93.84%, 93.53%, 93.04%, 92.33%, and 91.01% respectively for 50:50 training to testing sample ratios; 95.68%, 95.37%, 94.87%, 94.14%, and 90.74% respectively for 80:20 training to testing sample ratios have been obtained using proposed method and it is observed that the results using proposed method are promising as compared to the conventional methods.
1Introduction
The usage of machine learning (ML) intends to impart intelligence by a machine in solving various real time problems. In healthcare sector, ML can act as a transforming edge for clinical decisions [1]. ML algorithms provide precise and accurate information by training any image data which helps to detect the particular disease in its early stage. The major requisite of ML algorithm is availability of real time data and high computational power [2, 3]. For a pandemic situation like Covid-19, ML can be used to predict the infection in patients in its early stage which can help the clinical industry to identify the effective treatment. Covid-19 disease has 2% fatality rate and most of the deaths are due to respiratory failure [4, 5]. If early detection of Covid-19 is performed then the further spread of this disease can be reduced by referring the patient to quarantine. World Health Organization (WHO) is receiving data from all over the world for this pandemic and this data is also made available to public by different image repositories which enables the researcher to design an automated diagnosis for this disease [6, 7]. Thus, the need it to develop an efficient ML algorithm for prediction of Covid-19 infection with higher accuracy. This paper proposes a model which has been analyzed by two classification algorithms i.e. SVM and ELM with the use of chest X-ray image. The outcomes of classifier are adopted in this paper for Covid+and Pneumonia identification. This paper uses an integration of deep learning (DL) with ML and has several advantages in terms of feature extraction and classification which can benefit the clinical decisions. DL refers to extract features by using deep convolutional neural networks (CNNs) [8]. The CNN layer processes all non-linear information. The deeper the layer is the more complex information is learned [8].
The fuzzy set theory is used to enhance the intensity and contrast of dark areas of image by setting the fuzzy rules in such a way that the pixels with incomplete information of redundant information are separated. In this paper, we have chosen the fuzzy logic based approach for image pre-processing so that the image quality can be enhanced by using fuzzy membership of intensity and noise threshold. Moreover, it makes it easier to divide the image into smooth and detail regions because these regions are separated by comparing the intensity threshold as computed in fuzzy logic based approach.
In this paper, we have used the chest X-ray images for automatic diagnosis of Covid-19 by training and testing the proposed model. We have used chest X-ray image dataset [6, 7] to train and test the proposed model in three ratios of training to testing samples i.e. 20:80, 50:50 and 80:20. We have observed that as the number of training images increase the prediction accuracy also increases. We have first developed a deep CNN using a hashing layer to learn the imaging characteristics of the chest X-ray image. Then we have analyzed the performance of proposed method by using extreme machine learning (ELM) classifier [9] and support vector machine (SVM) classifier [10] to classify Covid+, Pneumonia and Normal cases. ELM method has shown better performance over SVM method for the given training set. The hashing layer that has been introduced in the proposed model transforms the high dimensional feature information into low dimensional binary data. This binary data captures the detailed regions of Covid infection effectively. It has been observed that Covid+images have more detailed regions and Covid- images have more smooth regions. Thus a smaller patch size is effective for capturing these detailed regions more precisely. The performance of the proposed method has been compared with other state-of-art methods. It is assumed that the proposed method is superior to other methods. We have obtained promising results that show the effectiveness of proposed method for automatic detection of Covid-19.
1.1Contribution
The contribution of this paper is as follows:
1. Initially, the chest X-ray images of the patients are fuzzified in terms of intensity enhancement and noise suppression.
2. The enhanced image is divided in sub-regions as smooth and detail regions by using a block based sliding window method.
3. The features are extracted from these sub-regions and are used for training the deep neural network.
4. A new hashing layer is added in the proposed network which transforms the high dimensional real features into low dimensional binary features.
The rest of the paper is as follows: Section 2 presents literature overview; the proposed method and the proposed algorithm have been detailed in Section 3. Section 4 discusses results and finally Section 5 concludes the paper.
2Literature review
In [11] the authors proposed a COVIDX-Net arctitecture that included seven different architectures of deep CNN models. But, due to the lack of public COVID-19 datasets, the study is validated on 50 Chest X-ray images only. In [12–14] the authors have analysed the existing deep learning architectures for classifying Covid cases. In [14] the authors have proposed a COVID-Net Deep CNN architecture which was tested for 13870 chest X-ray images and obtained classification accuracy of 93.3%. In [15] authors have proposed deep CNN framework known as DeepCOVIDExplainer which was tested for 16995 chest X-ray images and obtained 93.1% classification accuracy. In [16] the authors proposed DarkCovidNet model for detecting the Covid virus in 1125chest X-ray images and obtained 98.08% classification accuracy. In [17] authors have 260 chest X-ray images to train the DL model. But, due to limited number of training set the accuracy was not validated. In [18] the authors adopted the concept of transfer learning with CNN and proposed a model for Covid detection but the number of classes were taken as 2 and 3 only. This model had an average 3- class classification accuracy of 92%. In [19] the authors have used a pre-trained ResNet-50 for detecting the Covid virus in chest X-ray images and obtained 96.23% classification accuracy. In [20] the authors used SVM classifier with Res-Net model for detecting the Covid virus in chest X-ray images and obtained 95.38% classification accuracy in 41 epochs only. In [21] the authors implemented a hybrid deep learning model by using SVM classifier and obtained accuracy of 90.5 %. In [22] the authors used the existing DL method to extract image features but have not used any technique for improvising the feature extraction.
Based the literature review it has been observed that various deep learning frameworks have been proposed for early detection of COVID-19 in the patients. But, so far the feature extraction which is further fed to the training model has not been improved as per literature survey. Moreover, the researchers have not used any technique for improvising the image during pre-processing. In this paper we have pre-processed the image using a fuzzy based method and overall accuracy of the proposed deep network has been improvised by inserting a hashing layer after fully connected layer.
3Proposed model
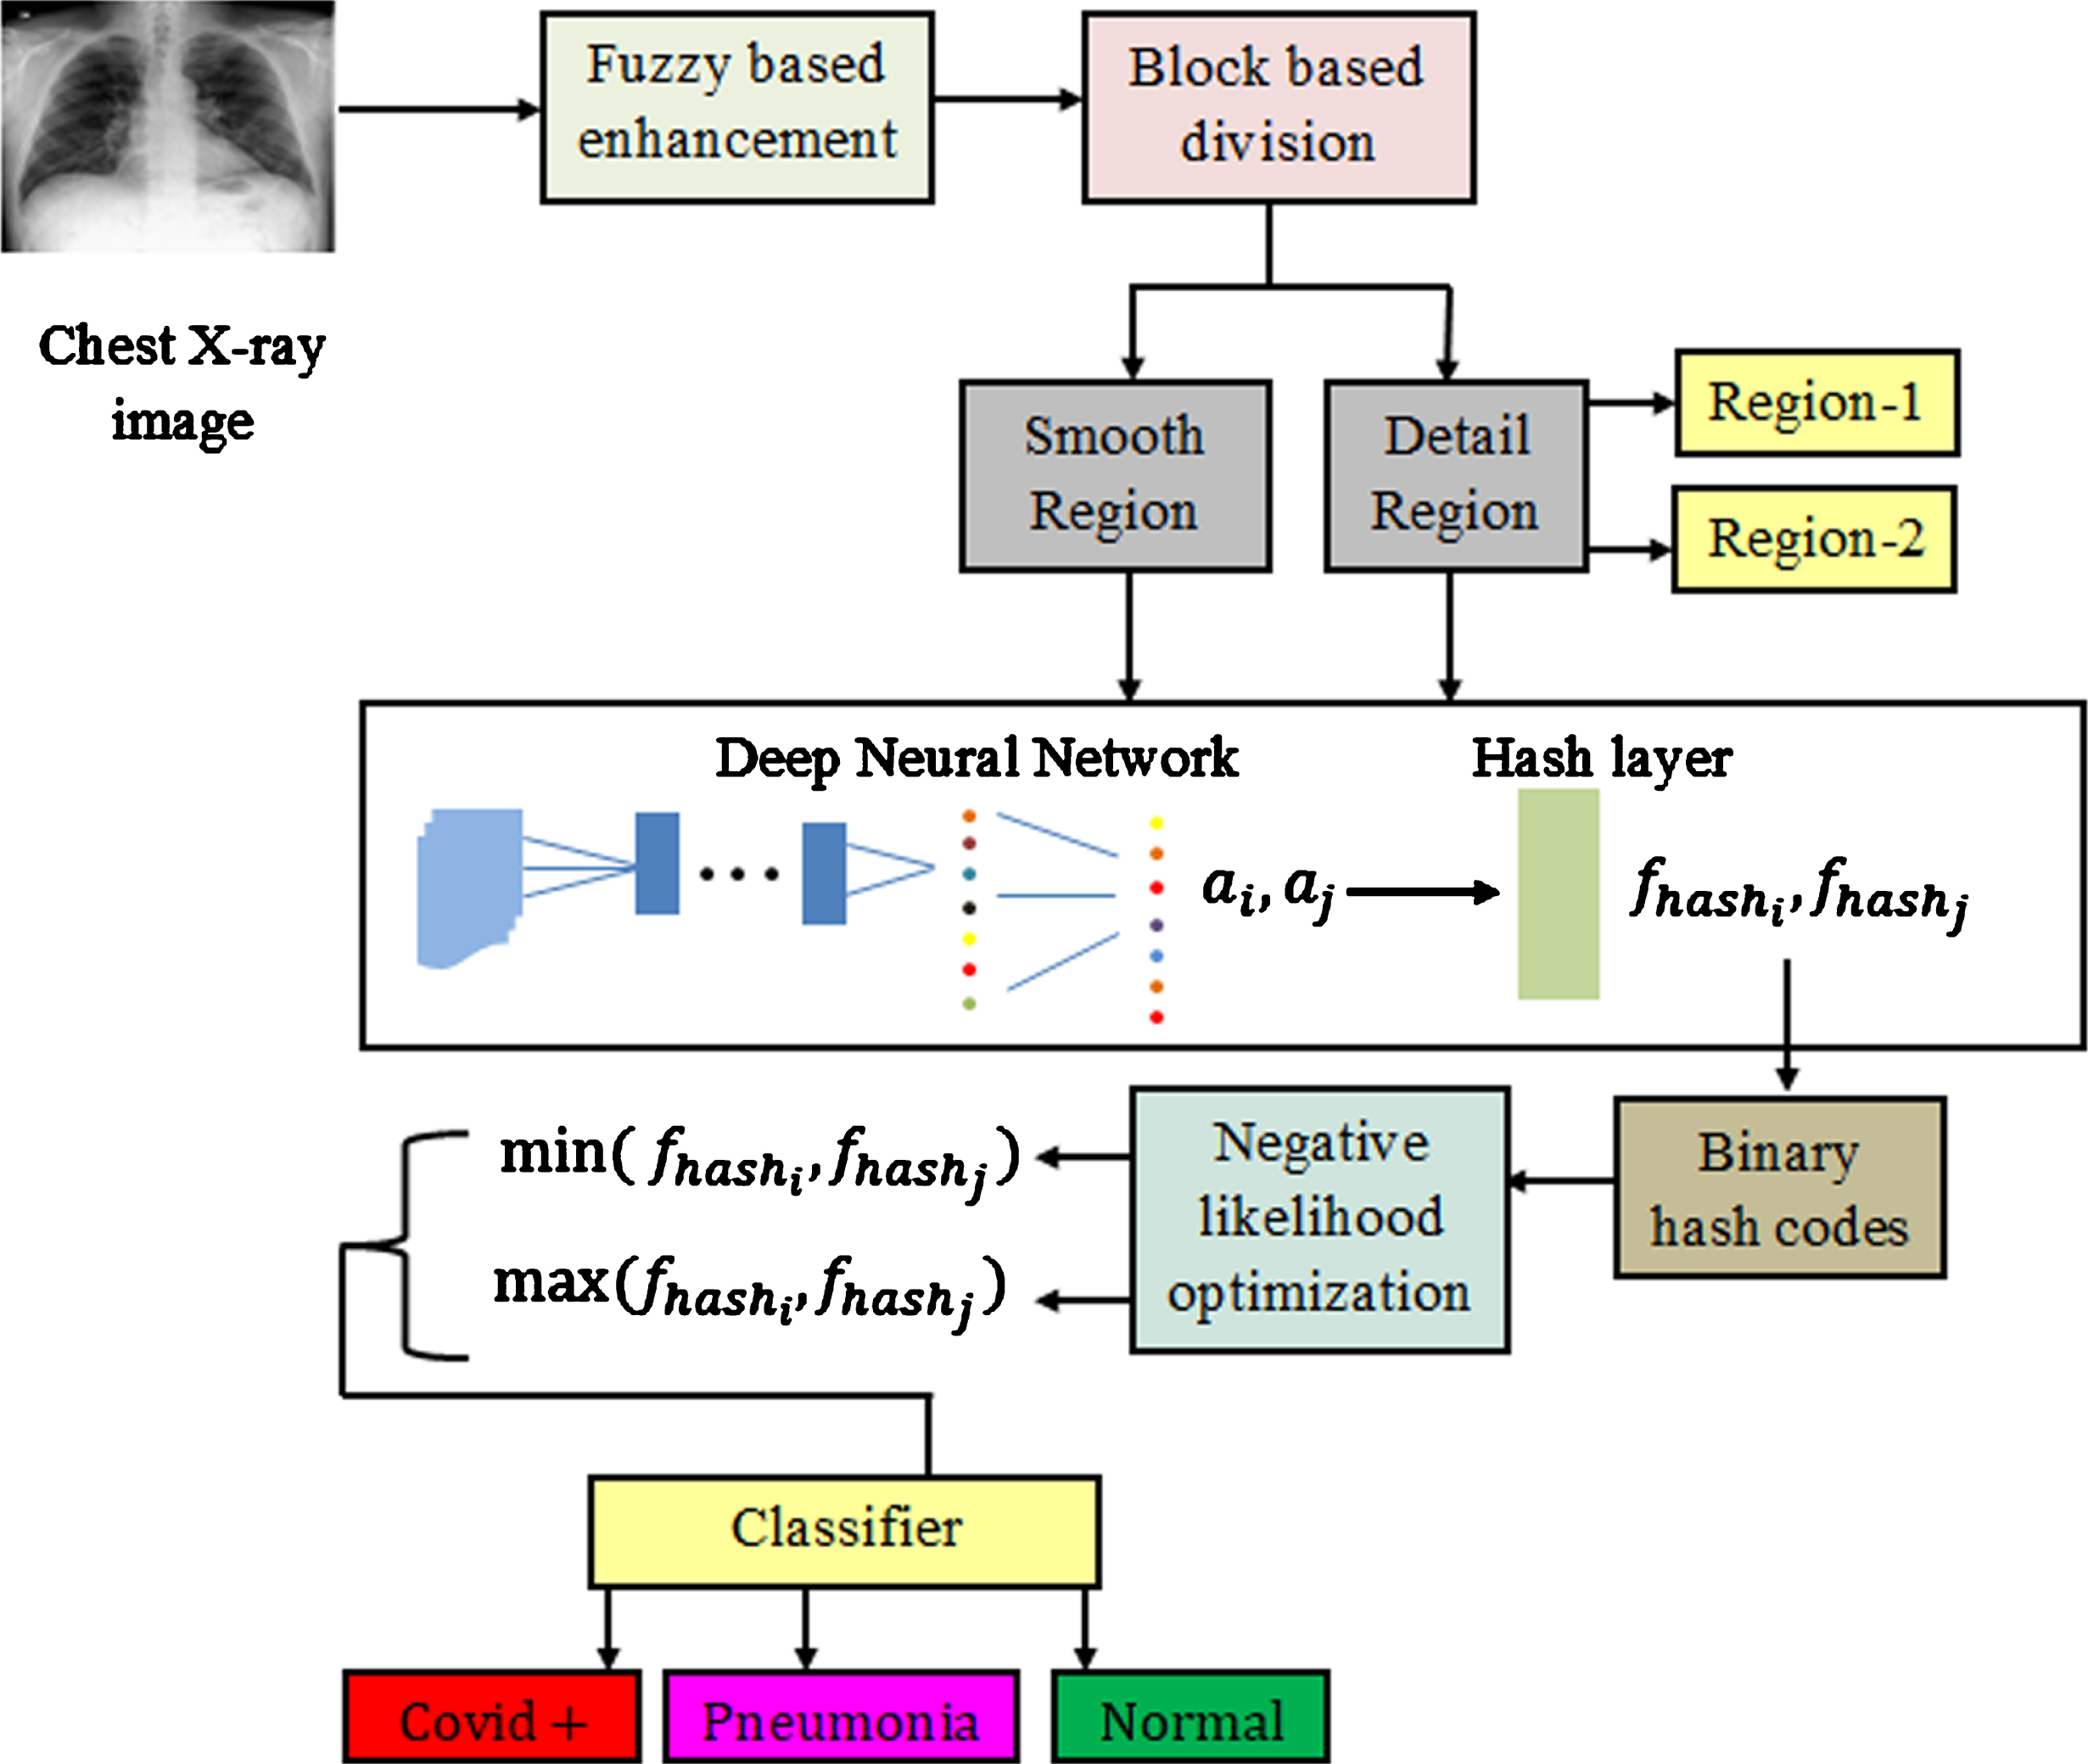
In this paper we propose a machine learning framework for Covid-19 detection. The process starts with image pre-processing which enhances the chest X-ray images using fuzzy logic [23]. Then the image is divided into smooth and detail regions on the basis of pixel intensity. After fuzzification, the features are extracted using machine learning (ML) method. After feature extraction the training data is generated and classifier is trained to detect Covid+, Pneumonia and Normal cases. Figure 1 presents the block diagram of the proposed model.
Fig. 1
Block diagram of the proposed model.
| Algorithm 1 Fuzzy enhancement of chest X-ray image | |
| 1 | Input: Chest X-Ray image, I (i, j). |
| 2 | Output: Fuzzy enhanced Image, F (i, j). |
| 3 | Calculate intensity value of each pixel of input image, Iintensity (i, j). |
| 4 | Calculate fuzzy limits for intensity and noise value as, mintensity and mnoise respectively by choosing the value of fuzzy membership operator (m). |
| 5 | Calculate the fuzzy membership operator for smooth and detail region as ms (i, j) and md (i, j) respectively. |
| 6 | Calculate overall fuzzy membership operator, m. |
| 7 | Perform fuzzification for generating intensity enhanced image pixels, (Fintesnity (i, j)). |
| 8 | Perform fuzzification for generating the fuzzified noisy image pixels, (Fnoise (i, j)). |
| 9 | Return, final fuzzy enhanced image as F (i, j) = ∑i = 1N∑j = 1NFintensity (i, j) - Fnoise (i, j). |
3.1Fuzzy based enhancement of chest X-ray
We propose a method, which enhances the contrast between the infrared region and surrounding areas of the X-ray image. Consider, I (i, j) as the input image with pixel space (i, j). The image is first pre-processed to bring it to the image size N × N. In image pre-processing the fuzzy logic based enhancement is performed on the chest X-ray images.
3.1.1The fuzzification algorithm
The proposed algorithm for fuzzy based enhancement of chest X-ray is based on the pixel intensity and background noise. Algorithm 1 presents the steps for Fuzzy enhancement of chest X-ray image. The step-wise algorithm is detailed as follows:
Step 1: The intensity value of each pixel is calculated as
(1)
Where, Imax and Imin are maximum and minimum intensity of pixel. G (i, j) is absolute value of image gradient to pixel intensity. Iintensity (i, j) is the intensity of pixel at pixel space (i, j).
Step 2: The fuzzy membership function [24, 25] is modeled in such a way that it reduces the effect of background noise. The intensity (mintensity) and noise (mnoise) values with which the fuzzy limits are set are given as
(2a)
(2b)
Where
(3)
Here, τn is noise threshold where n is the noise level and τ is the intensity threshold. The membership value of each smooth region pixel (ms (i, j)) is given as
(4)
| Algorithm 2 Block based Division of Smooth and Detail regions | |
| 1 | Input: Fuzzy enhanced image, F (i, j). |
| 2 | Output: Smooth and detail regions for feature extraction. |
| 3 | for i = 1, 2 . . N do |
| 4 | Find first and last non-zero pixel. |
| 5 | end for |
| 6 | for j = 1, 2 . . N do |
| 7 | Find first and last non-zero pixel. |
| 8 | end for |
| 9 | Select a rectangle by x-axis and y-axis coordinates as (w × h). |
| 10 | Scan F (i, j) by w × h rectangle as a sliding window. |
| 11 | Compare the image pixel intensity (τ) in the rectangle with intensity thresholds (τc, τpτn). |
| If τ ⩾ τc or τp < τ < τc, label those pixels in detailed region-1, | |
| If τp ⩽ τ < τc, label those pixels in detailed region-2, | |
| If τn ⩽ τ label those pixels in smooth region. | |
| 12 | Return smooth, detail region-1 and detail region-2 for feature extraction. |
When the membership value is associated with intensities of detail and smooth regions then m is enhanced and when the membership value originates from the noise then we suppress it. Thus, the overall fuzzy membership operator is given as
(5)
Step 3: In this step fuzzification is done on intensity and noise values. The fuzzification based on intensity generates the intensity enhanced image pixels (Fintensity (i, j)) which is illustrated as follows
then
Else if
Then
Step 4: The fuzzification based on noise generates the fuzzified noisy image pixels (Fnoise (i, j)) which is illustrated as follows
Then
Else if
Then
Step 5: The noise is suppressed for all the pixels in both smooth and detail regions. Thus, in the fuzzy enhanced image (F (i, j)) the image intensity is restored and noise is reduced using fuzzy rule which can be written as
(6)
| Algorithm 3 Feature extraction | |
| 1 | Input: Smooth and detail regions as dataset D = { F (i, j) } i, j = 1N. |
| 2 | Output: Deep features, fdeep. |
| 3 | Map every region to image patch with size (a × a). |
| 4 | Take lij = 1 when ai, aj belong to same class of image patch (ai, aj) i,j = 1N. |
| 5 | Take lij = 0 when ai, aj belong to different class of image patch, (ai, aj) i,j = 1N. |
| 6 | Use network characterization as
|
| 7 | Return deep features fdeep. |
3.2Block based division of image into smooth and detailed regions
In this paper we propose a block based method to divide the image into smooth and detail regions. Algorithm 2 presents the steps for block based division of smooth and detail region. In order to divide smooth and detail regions, all rows and columns of the image are scanned for first and last non-zero pixel. The rectangle area (w × h) is segmented using sliding window to generate sub-regions for smooth and detailed features. Here, width of rectangle is w = (xi - xj) and length of rectangle is h = (yi - yj) . x, y are length across x-axis and y-axis of the rectangle. Thus, N sub-regions are generated which are segmented as detailed and smooth regions. The pixel intensities in each rectangle segment (τ) are compared with maximum value of intensity threshold values calculated from classified Covid+, Normal and Pneumonia images as τc, τn, τp respectively such that τc > τp > τn. If τ > τn then those pixels are
labeled in detailed region and if τ ⩽ τn then label those pixels in smooth region. Further, the detailed region is sub-classified as detailed region-1 and detailed region-2. If τ ⩾ τcorτp < τ < τc, then the image corresponding to the detailed region-1. If τp ⩽ τ < τc, then label those pixels in detailed region-2.
3.3Feature extraction
Consider the dataset
Table 1
Configuration of deep network used
| Layer | Configuration |
| Convolution layer1 (Conv1) | Filter 64 × 11 × 11, stride2 × 2, pad0, pool2 × 2 |
| Convolution layer1 (Conv1) | Filter 256 × 5 ×5, stride1 × 1, pad1, pool2 × 2 |
| Convolution layer1 (Conv1) | Filter 256 × 3 ×3, stride1 × 1, pad1 |
| Convolution layer1 (Conv1) | Filter 256 × 3 ×3, stride1 × 1, pad1 |
| Convolution layer1 (Conv1) | Filter 256 × 3 ×3, stride1 × 1, pad1, pool2 × 2 |
| Fully connected layer1 (FCC1) | 4096 |
| Fully connected layer2 (FCC2) | 4096 |
3.4Deep learning
The extracted deep features are separated on the basis of similarity with the original feature space. Figure 2 shows the layer wise structure of the feature learning part of the deep network used. This is achieved by evaluating the feature distance for all the extracted features. We use Eucledian distance (ED) [28] to measure the similarity between deep features and is calculated as
Fig. 2
Layer wise structure of the feature learning part of the deep network used.
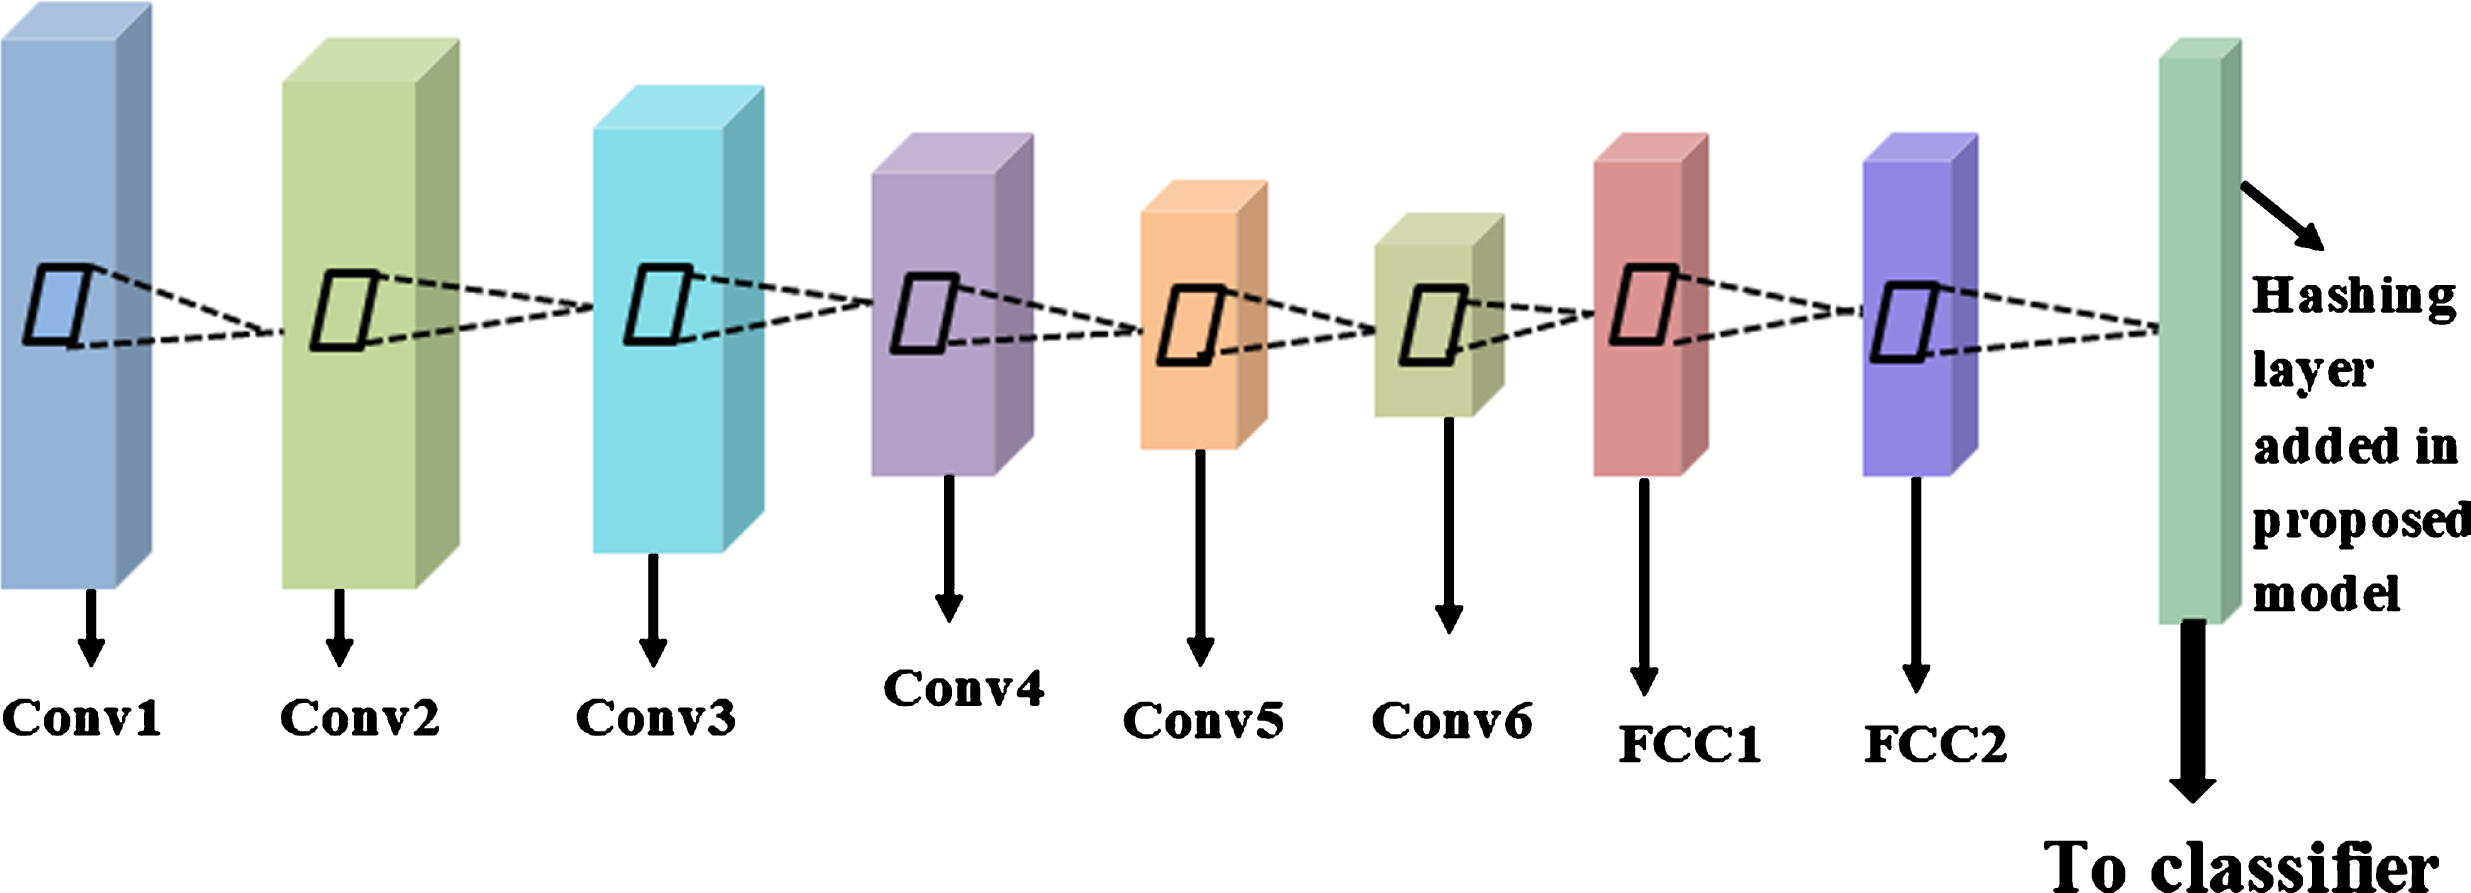
We insert a hashing layer after fully connected layer to compute feature distance effectively because when the FD is very high then the computation of ED is not feasible [28]. This new layer transforms the high dimensional real features into low dimensional binary features. The binary features generated form the hashing layer is written as
(7a)
(7b)
sgn (.) performs element wise operations on the binary valued features. Thus, the hashing layer generates the binary codes for all the feature pairs. These binary codes are represented as
(8)
The negative likelihood of Equation (8) resembles an optimization problem [29] where the minimization of lij leads to minimizing the feature distance between similar samples to as small as possible and maximizing the feature distance between dissimilar samples to as large as possible.
(9)
log(p (lij|fhash)) is equated to minimization function
The above mode can be integrated into the proposed framework of deep learning such that,
(10)
Where, p1, p2, … p7 are the parameters of seven layers corresponding to which the output of each layer is computed. We choose two more parameters for minimization problem i.e. W and b. We also need a regularization parameter 𝓇 which forms the minimization problem as
(11)
The effect of regularization parameter on overall accuracy has been analysed in results section. Thus, the feature learning and hash code learning are connected together in the proposed framework. The major advantage of the proposed framework is minimization of the feature distance between similar samples which improves the overall accuracy. The proposed framework has also been minimized for weight and bias.
3.5Classification
Once the network is trained through the proposed model we can obtain the deep learned features effectively. These features are then into an ELM classifier [9] and SVM classifier [10] for the subsequent classification as Covid+, Pneumonia and Normal cases. The simulation results validates that by using an ELM classifier the detection is faster and is insensitive to manual parameter setup. Algorithm 4 presents the steps for deep hash learning and classification.
| Algorithm 4 Deep hash learning and classification | |
| 1 | Input: Deep features, fdeep. |
| 2 | Output: Classifier output for subsequent classification as Covid+, Pneumonia and Normal cases. |
| 3 | Input deep features to deep hash layer which generates binanary hash code, fhash. |
| 4 | Calculate likelihood of pairwise labels for similar class labels and dissimilar class labels, p (lij|fhash). |
| 5 | Calculate negative likelihood p (lij|fhash) which minimizes the feature distance between similar samples to as small as possible, min (fhashi, fhashj) and maximizes the feature distance between dissimilar samples to as large as possible, (fhashi, fhashj). |
| 6 | Chose weight (W) and bias (sb) as minimization parameter for minimization problem which is computed as
|
| 7 | Input the deep learned features to ELM and SVM classifier. |
| 8 | Return Covid+, Pneumonia and Normal cases as classification output. |
4Results and discussion
We have analysed the efficiency of the proposed method on the chest X-ray image data set [6, 7]. The dataset includes 123 frontal view chest X-rays images from [6] and 224 Covid+images, 700 pneumonia images and 504 normal images [7]. We have taken the 12 classes of the data. A quantitative analysis is performed to evaluate the performance of proposed method w.r.t. length of hashing layer, patch size and regularization parameter. The performance of the proposed method has also been compared with other deep learning methods [14, 18, 21 and 22]. In our experiments we have chosen the 500 samples per class randomly for training and testing. The results have been analyzed for three cases of training and testing ratio i.e. 20:80, 50:50 and 80:20. We evaluate performance metrics i.e. overall accuracy, class accuracy, specificity, sensitivity, F-measure and kappa statistics.
Tables 2–4 present the quantitative comparison with state-of-art methods [14, 18, 21 and 22] for performance metrics (overall accuracy, class accuracy, specificity, sensitivity, F-measure and kappa statistics) w.r.t. training to testing ratio as 20:80, 50:50 and 80:20 respectively. From Tables 2–4 we observe that proposed method shows advantages in 7 classes out of 12. The proposed method has shown significant improvement as compared to Wang et al. [14], as the authors obtained classification accuracy of 93.3% only. Apostolopoulos et al. [18] considered 2 and 3 classes only with classification accuracy of 92% but proposed method has used 12 classes and average classification accuracy is 95.38% for 80:20 training to testing ratio. Alqudah et al. [21] used SVM classifier and obtained accuracy of 90.5%. The performance of proposed method has been analyzed by using SVM and ELM classifiers both and obtained better results with ELM classifier with average accuracy of 94.68% for different training to testing ratios. Li et al. [22] have not used any technique for improvising the feature extraction, on the other hand the proposed method uses a fuzzy based image preprocessing and block based division method to improve the quality of extracted features.
Table 2
Comparison of proposed method with other method for training to testing ratio as 20:80
| Class | Wang et al. [14] | Apostolopoulos et al. [18] | Alqudah et al. [21] | Li et al. [22] | Proposed method |
| 1 | 91.03 | 88.09 | 92.22 | 95.95 | 92.99 |
| 2 | 95.15 | 94.37 | 93.18 | 96.47 | 92.04 |
| 3 | 96.13 | 95.91 | 95.91 | 96.30 | 94.97 |
| 4 | 95.47 | 95.26 | 95.15 | 95.04 | 96.94 |
| 5 | 95.82 | 95.82 | 95.71 | 96.44 | 97.66 |
| 6 | 85.46 | 83.23 | 81.27 | 83.45 | 90.26 |
| 7 | 94.57 | 93.86 | 87.12 | 92.99 | 93.98 |
| 8 | 76.58 | 77.40 | 81.36 | 73.86 | 85.86 |
| 9 | 94.28 | 92.98 | 93.97 | 94.17 | 93.02 |
| 10 | 91.90 | 90.06 | 90.07 | 91.13 | 93.05 |
| 11 | 93.17 | 93.85 | 91.09 | 94.15 | 95.79 |
| 12 | 94.15 | 91.05 | 92.03 | 93.96 | 95.88 |
| Value of performance metric as Average of all class values | |||||
| Overall Accuracy | 91.97 | 90.99 | 90.75 | 91.99 | 93.53 |
| F-Measure | 88.34 | 88.97 | 87.44 | 89.84 | 93.23 |
| Specificity | 88.72 | 87.17 | 86.87 | 88.16 | 92.74 |
| Sensitivity | 86.19 | 85.89 | 84.97 | 87.01 | 92.02 |
| Kappa Statistics | 84.32 | 84.08 | 83.64 | 85.27 | 88.70 |
Table 3
Comparison of proposed method with other method for training to testing ratio as 50:50
| Class | Wang et al. [14] | Apostolopoulos et al. [18] | Alqudah et al. [21] | Li et al. [22] | Proposed method |
| 1 | 91.33 | 88.40 | 92.53 | 96.26 | 93.30 |
| 2 | 95.46 | 94.68 | 93.48 | 96.78 | 92.35 |
| 3 | 96.44 | 96.22 | 96.22 | 96.60 | 95.27 |
| 4 | 95.78 | 95.57 | 95.46 | 95.35 | 97.25 |
| 5 | 96.12 | 96.12 | 96.02 | 96.75 | 97.97 |
| 6 | 85.77 | 83.53 | 81.58 | 83.76 | 90.57 |
| 7 | 94.87 | 94.17 | 87.42 | 93.30 | 94.29 |
| 8 | 76.89 | 77.71 | 81.67 | 74.17 | 86.16 |
| 9 | 94.59 | 93.29 | 94.28 | 94.48 | 93.33 |
| 10 | 92.20 | 90.37 | 90.38 | 91.44 | 93.36 |
| 11 | 93.47 | 94.16 | 91.39 | 94.46 | 96.09 |
| 12 | 94.46 | 91.35 | 92.34 | 94.27 | 96.19 |
| Value of performance metric as Average of all class values | |||||
| Overall Accuracy | 92.28 | 91.29 | 91.06 | 92.30 | 93.84 |
| F-Measure | 88.65 | 89.28 | 87.75 | 86.15 | 93.53 |
| Specificity | 89.03 | 87.47 | 87.18 | 85.47 | 93.04 |
| Sensitivity | 86.49 | 86.20 | 85.27 | 85.32 | 92.33 |
| Kappa Statistics | 84.63 | 84.38 | 83.94 | 85.58 | 91.01 |
Table 4
Comparison of proposed method with other method for training to testing ratio as 80:20
| Class | Wang et al. [14] | Apostolopoulos et al. [18] | Alqudah et al. [21] | Liet al. [22] | Proposed method |
| 1 | 98.16 | 93.12 | 90.12 | 94.34 | 95.13 |
| 2 | 98.69 | 97.34 | 96.54 | 95.32 | 94.16 |
| 3 | 98.51 | 98.34 | 98.12 | 98.12 | 97.15 |
| 4 | 97.23 | 97.67 | 97.45 | 97.34 | 99.17 |
| 5 | 98.66 | 98.02 | 98.02 | 97.91 | 99.91 |
| 6 | 88.37 | 87.43 | 85.14 | 83.14 | 92.34 |
| 7 | 95.13 | 96.74 | 96.02 | 89.12 | 96.14 |
| 8 | 75.56 | 78.34 | 79.18 | 83.23 | 87.83 |
| 9 | 97.34 | 96.45 | 95.12 | 96.13 | 95.16 |
| 10 | 93.23 | 94.01 | 92.13 | 92.14 | 95.19 |
| 11 | 96.32 | 95.31 | 96.01 | 93.18 | 97.99 |
| 12 | 97.12 | 96.32 | 93.14 | 94.15 | 98.09 |
| Value of performance metric as Average of all class values | |||||
| Overall Accuracy | 94.11 | 94.09 | 93.08 | 92.84 | 95.68 |
| F-Measure | 91.91 | 90.37 | 91.02 | 89.45 | 95.37 |
| Specificity | 90.19 | 90.76 | 89.17 | 88.87 | 94.87 |
| Sensitivity | 89.01 | 88.17 | 87.87 | 86.92 | 94.14 |
| Kappa Statistics | 87.23 | 86.26 | 86.01 | 85.56 | 90.74 |
Overall Accuracy (OA) is a performance measure which is computed by dividing the accurately classified classes by total number of classes. The accuracy analysis between the proposed and other models shows that the proposed model achieves higher accuracy due to inclusion of hashing layer and minimization of weight and bias of the network characterization function. F-measure metric is a weighted harmonic mean of the recall and precision. Sensitivity is computed for Covid+cases. Specificity is computed for Covid- cases. Kappa-statistics measures expected value of outcome by subtracting it from the classification success which is kind of reliability measure. It is observed that as we increase the training data these performance metrics improve.
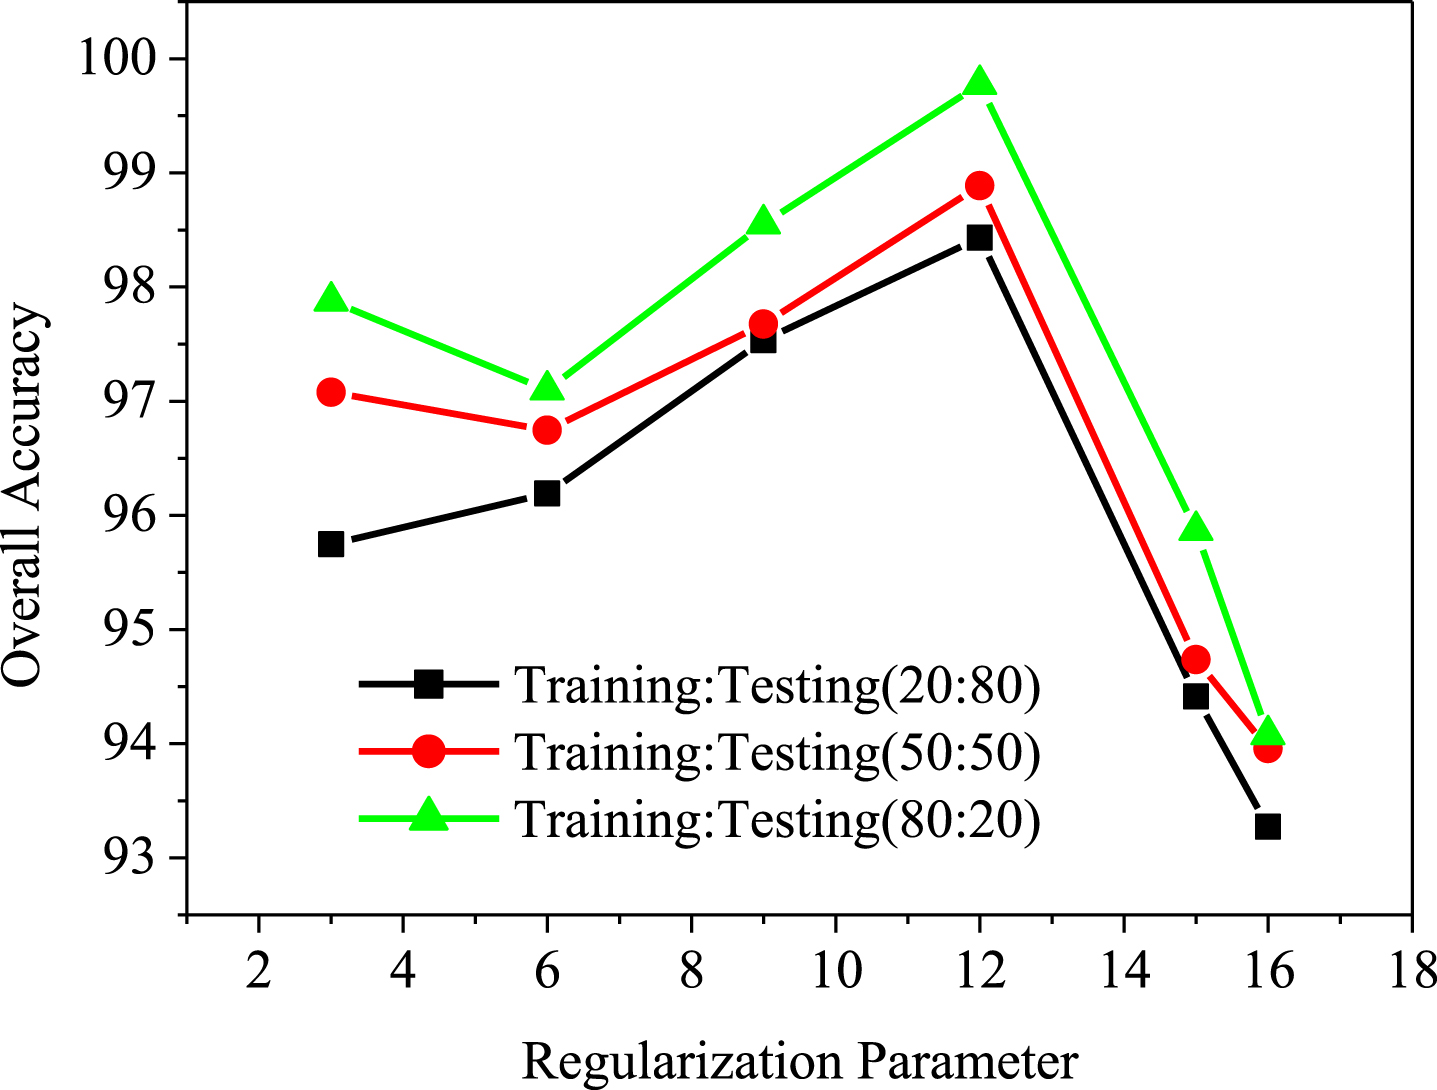
Table 5 presents the ELM and SVM classifier comparison results by using proposed method. It is observed that ELM classifier shows better results as compared to SVM classifier due to its insensitivity to parameters setup. Figure 3 shows that as the length of hashing layer increases the OA increases but this increase is until the length 64. Beyond this length the OA becomes stable. It has been observed that normal images have more smooth regions and infected images have more detailed regions. Therefore the smaller patch size is needed for detecting detailed regions effectively. In Fig. 4, it is observed that OA is more when patch size is smaller which means better detection and OA drops as we increase patch size. for The regularization parameter (𝓇) also affects accuracy. From Fig. 5 it has been observed that the optimal value of accuracy is achieved for 𝓇 = 10.
Table 5
Classifier performance comparison for proposed method
| Classifier | Overall Accuracy | F-Measure | Specificity | Sensitivity | Kappa Statistics |
| Training: Testing (20:80) | |||||
| SVM | 86.02 | 90.13 | 87.01 | 88.14 | 88.12 |
| ELM | 93.53 | 93.23 | 92.74 | 92.02 | 88.70 |
| Training: Testing (50:50) | |||||
| SVM | 85.19 | 85.34 | 82.16 | 82.45 | 83.15 |
| ELM | 93.84 | 93.53 | 93.04 | 92.33 | 91.01 |
| Training: Testing (80:20) | |||||
| SVM | 93.24 | 92.15 | 92.83 | 92.49 | 88.34 |
| ELM | 95.68 | 95.37 | 94.87 | 94.14 | 90.74 |
Fig. 3
Comparison of overall accuracy of proposed method with length of hashing layer.
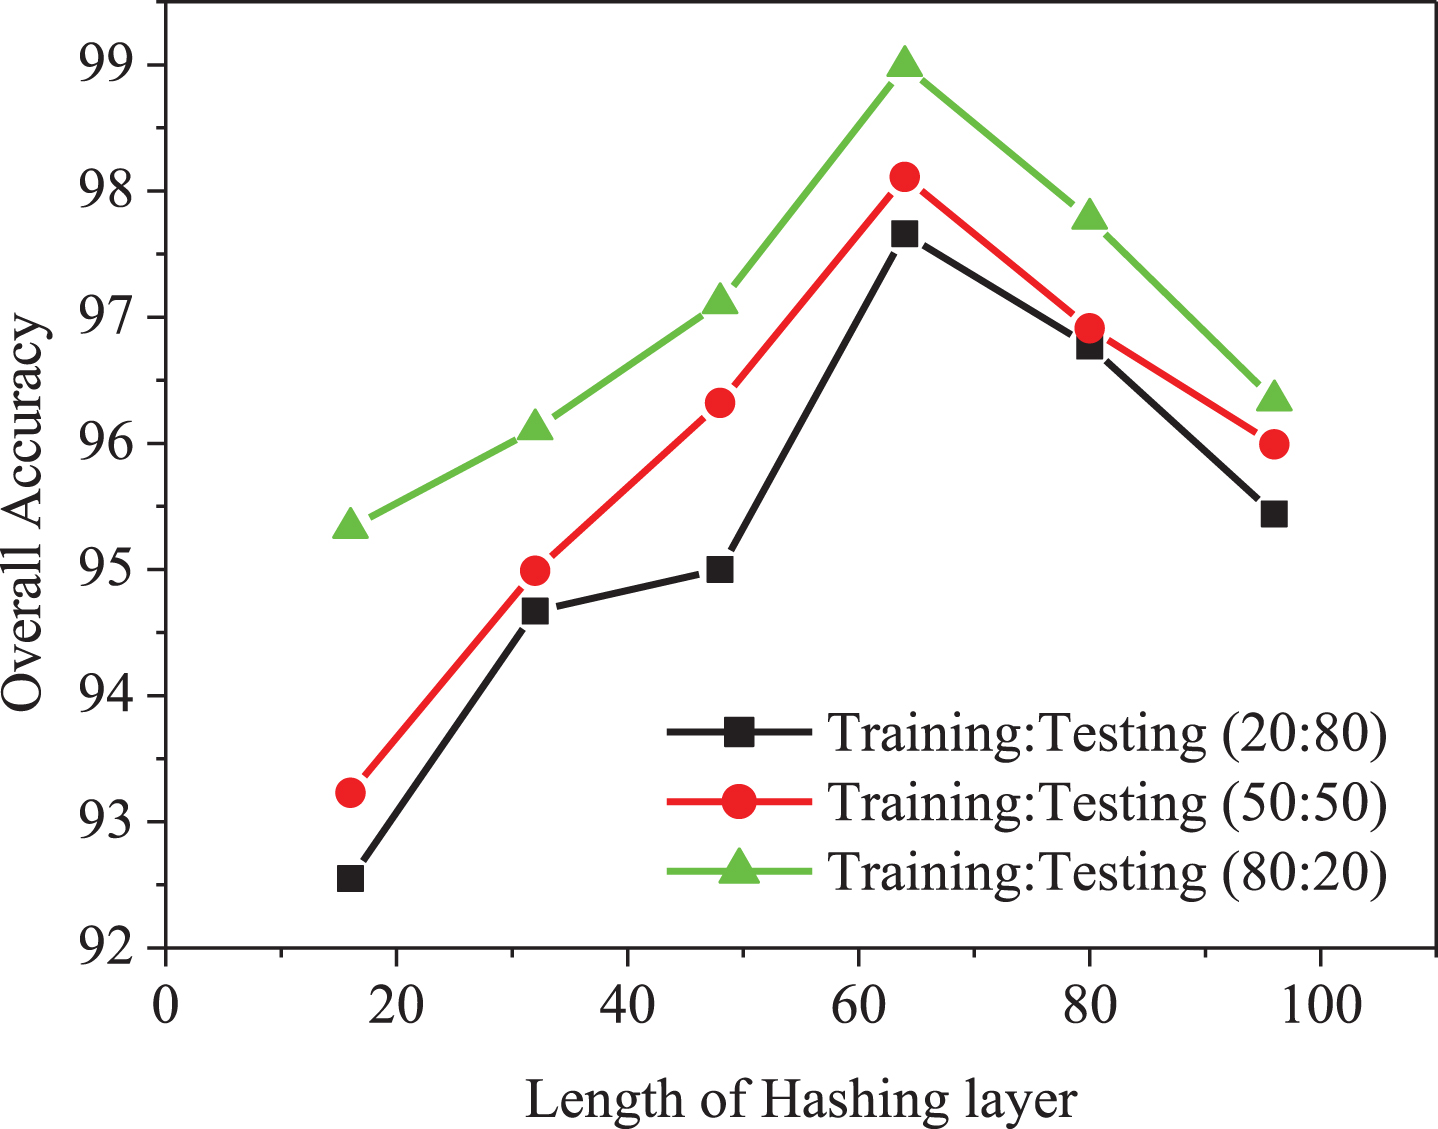
Fig. 4
Comparison of overall accuracy of proposed method with patch size.
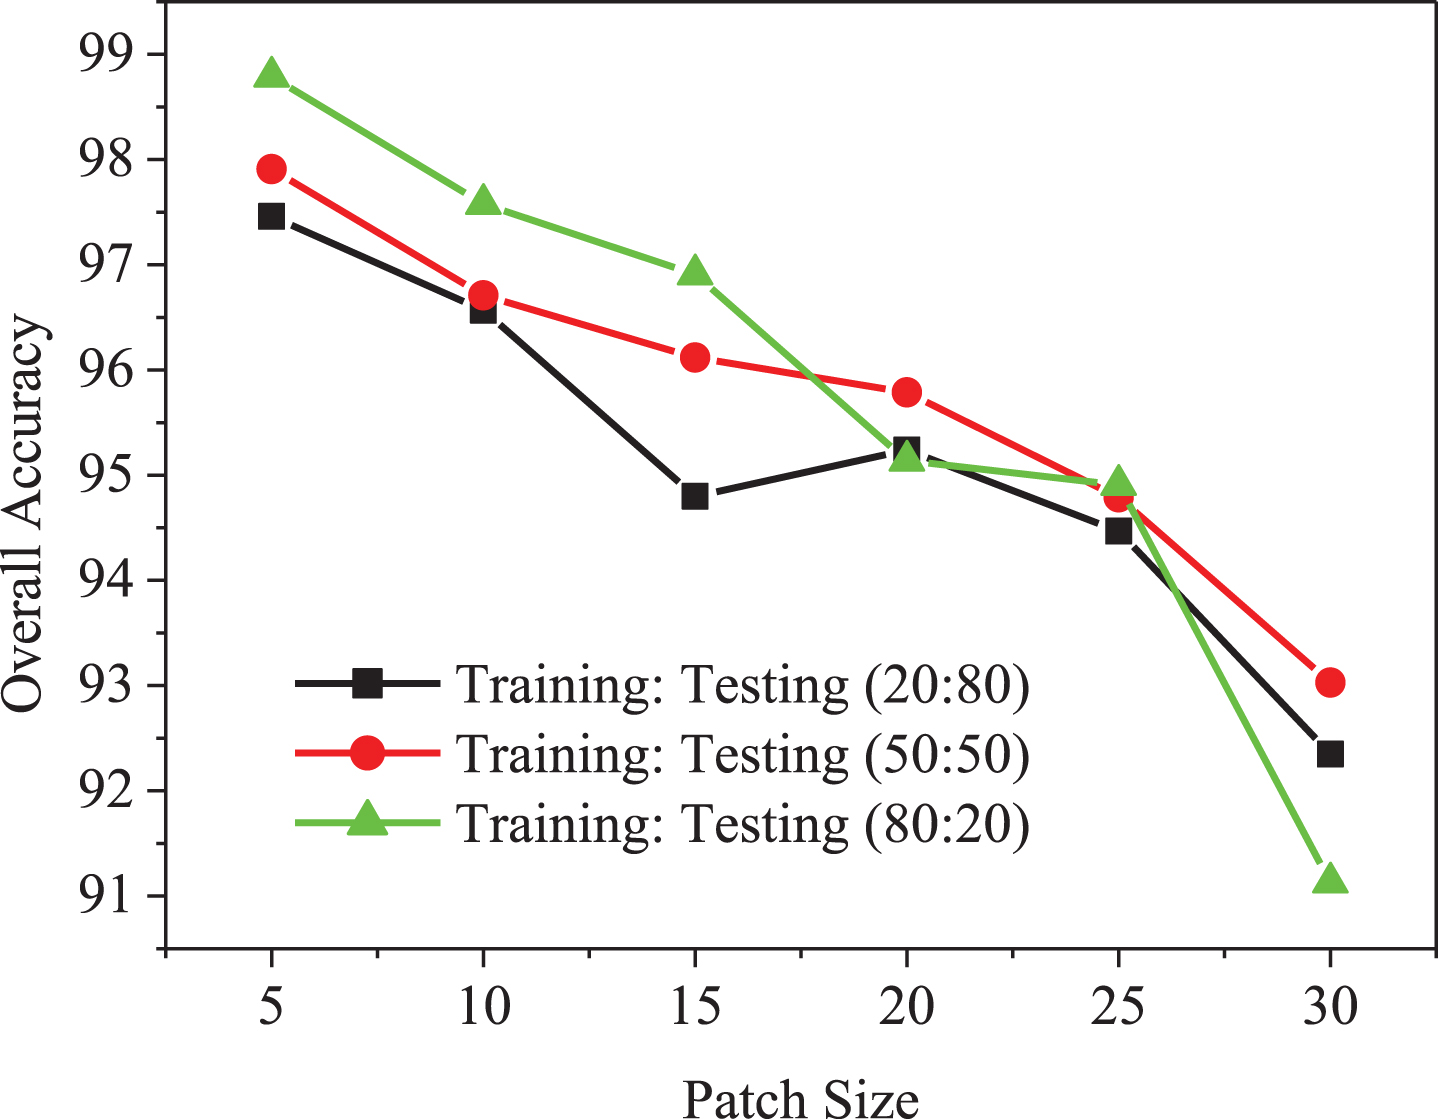
Fig. 5
Comparison of overall accuracy of proposed method with regularization parameter.
5Conclusion
In this paper, a deep learning model is proposed for Covid-19 classification from chest X-ray images. There has been an improvement in OA using propsoed method due to the newly added hashing layer as it minimizes the Euclidian feature distance between similar samples and minimizes the Euclidian feature distance between dissimilar samples. This training dataset is then used in SVM and ELM classifier for Covid-19 classification as Covid+, Pneumonia and Normal cases. The comparison results in terms of various performance metrics are drawn between the proposed method and existing state-of-art methods by considering different ratios of training and testing data. The experimental results show that the proposed method has an overall improvement in terms of accuracy, F-measure, sensitivity, specificity, and Kappa statistics.
This paper proposes a deep learning framework for Covid-19 detection which has better accuracy than conventional models. The limitation of the proposed approach is that if the patients in critical state might not be able to undergo X-ray scanning. This approach can be used for diagnosis due to cost-effectiveness of X-rays images. In future, the diagnosis can be made more effective by training more massive datasets using continuous data collection. Further, it is planned to make use of different classifiers for different features extracted from the chest images. We aim to enhance the model efficiency and usability by deploying it in hardware.
References
[1] | Jiang F. , Jiang Y. , Zhi H. , Dong Y. , Li H. , Ma S. , Wang Y. , Dong Q. , Shen H. and Wang Y. , Artificial intelligence in healthcare: past, present and future, Stroke and Vascular Neurology 2: (4) ((2017) ), 230–243. |
[2] | Hamet P. and Tremblay J. , Artificial intelligence in medicine, Metabolism 69: ((2017) ), S36–S40. |
[3] | Wallis C. , How artificial intelligence will change medicine, Nature 576: ((2019) ), S49–S62. |
[4] | WHO. Clinical management of severe acute respiratory infection when novel coronavirus [nCoV] infection is suspected. Available from: https://www.who.int/publications-detail/clinical-managementof-severe-acute-respiratory-infection-when-novelcoronavirus-[ncov]-infection-is-suspected. |
[5] | World Health Organization. Situation reports. Available from: https://www.who.int/emergencies/diseases/novel-coronavirus-2019/situation-reports/. |
[6] | Cohen J.P. , Morrison P. and Dao L. , COVID-19 image data collection, (2020). |
[7] | Kaggle Dataset. Available from: https://www.kaggle.com/andrewmvd/convid19-X-rays. |
[8] | Litjens G. , Kooi T. , Bejnordi B.E. , Setio A.A.A. , Ghafoorian F.C.M. , Laak J.A.W. , Ginneken B. and Sánchez C.I. , A survey on deep learning in medical image analysis, Medical Image Analysis 42: ((2017) ), 60–88. |
[9] | Huang G. , Song S. , Gupta J.N.D. and Wu C. , Semi-Supervised and Unsupervised extreme learning machines, IEEE Transactions on Cybernetics 44: (12) ((2014) ), 2405–2417. |
[10] | Bennett K.P. and Demiriz A. , Semi-supervised support vector machines, Advances in Neural Information Processing Systems 11: ((1999) ), 368–374. |
[11] | Hemdan E.E. , Shouman M.A. and Karar M.E. , COVIDX-Net: A Framework of Deep Learning Classifiers to Diagnose COVID-19 in X-Ray Images, arXiv preprint arXiv:2003.11055 [Preprint]. (2020), Available from: https://arxiv.org/abs/2003.11055. |
[12] | Asnaoui K.E. , Chawki Y. and Idri A. , Automated methods for detection and classification pneumonia based on x-ray images using deep learning, arXiv preprint arXiv:2003.14363 [Preprint], (2020), Available from: https://arxiv.org/abs/2003.14363. |
[13] | Chowdhury M.E.H. , Rahman T. , Khandakar A. , Mazhar R. , Kadir M.A. , Mahbub Z.B. , Islam K.R. , Khan M.S. , Iqbal A. , Emadi N.A. , Reaz M.B.I. and Islam T.I. , Can AI help in screening viral and COVID-19 pneumonia? arXiv preprint arXiv:2003.13145 [Preprint], (2020), Available from: https://arxiv.org/abs/2003.13145. |
[14] | Wang L. , Lin Z.Q. and Wong A. , COVID-Net: A Tailored Deep Convolutional Neural Network Design for Detection of COVID-19 Cases from Chest Radiography Images, arXiv preprint arXiv:2003.09871 [Preprint], (2020), Available from: https://arxiv.org/abs/2003.09871. |
[15] | Karim M.Z. , Döhmen T. , Schuhmann D.R. , Decker S. , Cochez M. and Beyan O. , Deep Covid explainer: Explainable Covid-19 predictions based on chest x-ray images, arXiv preprint arXiv:2004.04582 [Preprint], (2020). |
[16] | Ozturk T. , Talo M. , Yildirim E.A. , Baloglu U.B. , Yildirim O. and Acharyaf U.R. , Automated detection of COVID-19 cases using deep neural networks with X-ray images, Computers in Biology and Medicine (2020), 121. |
[17] | Salman F.M. , Naser S.S.A. , Alajrami E. , Nasser B.S.A. and Ashqar B.A.M. , Covid-19 detection using artificial intelligence, International Journal of Academic Engineering Research (IJAER) 4: (3) ((2020) ), 18–25. |
[18] | Apostolopoulos I.D. and Bessiana T. , COVID-19: Automatic Detection from X-Ray Images Utilizing Transfer Learning with Convolutional Neural Networks, arXiv:2003.11617 [Preprint]. (2020). Available from: https://arxiv.org/abs/2003.11617. |
[19] | Farooq M. and Hafeez A. , COVID-ResNet: A deep learning framework for screening of COVID19 from radiographs, arXiv:2003.14395 [Preprint], (2020), Available from: https://arxiv.org/abs/2003.14395. |
[20] | Sethy P.R. and Behera S.K. , Detection of Coronavirus Disease (COVID-19) Based on Deep Features, Preprints (2020), doi: 10.20944/preprints202003.0300.v1 |
[21] | Alqudah A.M. , Qazan S. , Alquran H.H. , Qasmieh I.A. and Alqudah A. , COVID-2019 detection using xray images and artificial intelligence hybrid systems, License: CC BY 4.0, 2020. |
[22] | Li X. and Zhu. D , Covid-expert: An AI powered population screening of Covid-19 cases using chest radiography images, arXiv:2004.03042 [Preprint], (2020), Available from: https://arxiv.org/abs/2004.03042. |
[23] | Nandal A. and Bhaskar V. , Fuzzy Enhanced Image Fusion using Pixel Intensity Control, IET Image Processing 12: (3) ((2018) ), 453–464. |
[24] | Klir G. and Yuan B. , Fuzzy set and fuzzy logic: theory and applications, Prentice Hall ((1995) ). |
[25] | Bezdek J.C. , Pattern recognition with fuzzy objective function algorithms, Springer ((1981) ). |
[26] | Lazarevic S.P. and Abraham A. , Hybrid fuzzy-linear programming approach for multi criteria decision making problems, arXiv:cs/0405019 [Preprint], (2004), Available from: https://arxiv.org/abs/cs/0405019. |
[27] | Guo S. and Zhao H. , Fuzzy best-worst multi-criteria decision-making method and its applications, Knowledge-Based Systems 121: ((2017) ), 23–31. |
[28] | Liu B. , Yu X. , Zhang P. , Yu A. , Fu Q. and Wei X. , Supervised deep feature extraction for hyperspectral image classification, IEEE Transactions on Geoscience and Remote Sensing 56: (4) ((2018) ), 1909–1921. |
[29] | Liu Q. , Hang R. , Song H. and Li Z. , Learning multiscale deep features for high-resolution satellite image scene classification, IEEE Transactions on Geoscience and Remote Sensing 56: (1) ((2018) ), 117–126. |


