
Reliability analysis of turbine blades based on fuzzy response surface method
Abstract
To improve the precision of reliability analysis on turbine blades, the fuzzy response surface method of reliability analysis is proposed by considering the fuzziness of the input variables and the vagueness of the limit state variables. Initially, the fuzzy basic variables were converted into equivalent random variables according to the method of equivalent transformation. Additionally, the mathematic model of the fuzzy response surface for structural reliability analysis was established, based on the quadratic polynomial response surface function. The mean value and variance of the blade stress and radial deformation were obtained by using the Monte-Carlo method based on generous linkage sampling to the model. Finally, the probability of failure and fuzzy random reliability index were calculated based on the probability integral method. Results indicate that the reliability probability of the blade is 97.665% , when the allowable stress and deformation are 390 MPa and 0.195 mm, respectively. It is demonstrated that with an increase of the fuzzy coefficient, the blade reliability index decreases; thus, the random reliability of the blade is slightly higher than the fuzzy reliability.
1Introduction
Under complex loads and harsh running conditions, the failure of aero-engine blades due to damage and breakage usually appeared in the operating procession. The basic reason is that the effects of uncertain factors have not yet been fully investigated. There are two major types of uncertainty in engineering: randomness and fuzziness. Randomness is a type of uncertainty due to insufficiency of causality, which is described as unpredictability caused by the defect of causality. Fuzziness refers to ambiguity in the process of intermediary transition, which is described as the unclear boundary of things caused by the defects of the excluded middle law. The blade function involves much uncertainty because of the particularities of the research object. If the influence of uncertainty is neglected, then many safety states that become failure states in actual operation, will be inferred according to the fixed value method. Therefore, uncertain factors must be considered in reliability analysis of aero-engine blades.
At present, the so-called stochastic reliability analysis model, which considers the impact of stochastic uncertainty, has been more fully-studied and widely-used in water conservancy, civil engineering, geology and other fields [1, 11, 14, 15]. In recent years, the random reliability analysis [8, 17, 18, 22] based on the Response Surface Method (RSM) has been widely-used in the fields of risk assessment and mechanical structure sensitivity and instability analysis [2, 8, 19, 21]. The RSM [6, 7] plays an important role in reliability analysis by combining mathematical methods and statistical methods, allowing it to deal with the complex structures of reliability analysis which contains many uncertain variables. When combined with multi-body dynamics and the modal method, C.Y. Zhang andG.C. Bai [4] established the Extremum Response Surface Method (ERSM) by using multiple dynamic parameters as random input variables. In this method, the ERSM is demonstrated as a highly accurate and highly efficient method in the reliability analysis of a two-link flexible robot manipulator. C.W. Fei and G.C. Bai [5] applied ERSM to the multiple input variable reliability analysis on aero-engine blades, and the primary factors influencing the radial displacement was obtained. However, the above reliability analysis of stochastic uncertainty is based on probability, and a double state hypothesis and fuzziness were not considered, which is not reasonable for engineering practice. For example, engineering experience and prior knowledge cannot be incorporated into random reliability analysis, which is based on probability theory. With a small sample, the confidence degree of statistical parameters obtained by the probability theory and mathematical statistical methods will be very low, i.e., the variables have ambiguity. There is no absolute boundary between the safe operation and failure of most non-brittle structures, i.e., the limit states have fuzzy features. Therefore, a fuzzy reliability analysis model which considers fuzzy uncertainty should be established. At present, fuzzy reliability has been gradually applied to mechanical engineering. According to the stress strength interference theory, M.H. Xu, et al. [12] have studied the method, which considers the fuzziness of basic variables, the fuzziness of strength and random of stress, the random of strength and fuzziness of stress, the fuzziness of strength and stress, respectively. Based on the fuzziness of the limit state, M.H. Xu, et al. [12, 20] proposed the computational method of failure probability, which included the moment method and the subset sampling method. Although fuzzy reliability analysis in the reference literature [9, 12, 20] investigates the influence of fuzzy factors, its analytical integral solution is obtained under the condition that the probability density function is explicit. It is difficult to obtain results in cases with many variables in reliability analysis. Meanwhile, previous studies have studied the fuzzy input variables and state variables separately, rather than considering their common impact to the entire system.
The response surface combined with high precision and high efficiency, designated the Fuzzy Response Surface Method (FRSM) of reliability analysis on turbine blades, is proposed in this paper, which takes the fuzziness of input variables and state variables into account. A certain type of aircraft gas turbine engine blade is chosen as the target of study in a reliabilitysimulation in which its running temperature, speed, material density and gravity are taken as the input variables, and the maximum radial blade deformation and maximum stress are taken as the output responses. At the end of this paper, a comparison between FRSM and RSM is conducted.
2Fuzzy response surface method
2.1The basic principle of fuzzy response surface method
The fuzzy principle of reliability analysis has not yet been articulated in a comparatively complete theory. The fuzzy variables of reliability analysis must be equivalent to random variables, necessitating the use of the response surface method to solve reliability problems involving fuzzy variables. This paper applies the method of fuzzy entropy and equivalent transformation of variables [13]. The advantage of this method is that it can be applied to the multivariate case and can directly convert the fuzzy variables to normal random variables, and may have potential application to stochastic reliability analysis. The entropy indicates the uncertainty degree of variable, and the principle of entropy equivalent transformation indicates that the uncertainty degree of fuzzy variables is equal to that of random variables.
As for a random variable x, its probability density function can be defined as f (x). Then, the probability entropy H can be defined as:
(1)
If x is a fuzzy variable and μ (x) is the membership function, then the fuzzy entropy G can be defined as:
(2)
If the entropy is constant while the fuzzy variables are converted to random variables, then:
(3)
The probability density function of normal random variable x is defined as follows:
(4)
Substituting Equation (4) into Equation (1), the equivalent transformation of probability entropy is defined as:
(5)
According to Equations (3) and (5), the mean square deviation after transformation is as follows:
(6)
The membership function of a normal distributed fuzzy variable is as follows:
(7)
Concluded from Equations (2), (6) and (7):
(8)
The mean value of a fuzzy random variable after transformation is as follows:
(9)
The properties of fuzzy variables after transformation are characterized by Equations (8) and (9), which indicate that
The quadratic response surface function model is defined as:
(10)
2.2Fuzzy stochastic reliability analysis
The input variable is the fuzzy response surface function corresponding to the limit state. In random reliability analysis, the component states can be described by the limit state function. Z > 0 represent s the safety state of the component; Z < 0 represents the dangerous state of the component; and Z = 0 represent the limit state. In this way, the failure probability and reliability of components can be calculated according to the following equation:
(11)
(12)
The limit state function is assumed as a normal distribution and the probability density function is taken as known. Then, the failure probability can be expressed by a reliable indicator:
(13)
A intermediate transition process from safety to failure is achieved when the structure is in actual operation. Therefore, it is not reasonable that the limit state function Z > 0, Z = 0, Z < 0 represents the safety or the failure of the structure. Although Z > 0 represents the safe operation of the structure, it may have failed. The possibility of security is only slightly larger than the possibility of failure. Structure may similarly be safe under the condition of Z < 0, and the possibility of failure is just slightly larger than the possibility of safe operation. When the condition Z = 0, the possibility of safety is equal to that of failure. The selected normal membership function [10] is defined as follows:
(14)
The expression of fuzzy structure reliability is that:
(15)
The membership function in a conventional reliability analysis is a simple binary function, thus, fuzzy reliability is the promotion of conventional reliability. The relationship between the two is shown in Fig. 1.
After the explicit fuzzy response surface function is obtained, the mean value μ Z and mean square deviation σ Z of the limit state function can be obtained according to Equations (16) and (17).
(16)
(17)
Equations (14) to (17) can not only solve the problem of fuzzy reliability, but also reasonably deal with the conventional reliability problems. As a result, the fuzzy problem degenerates into a general problem when the effect of the fuzzy variables is not considered (k = 0).
The structure failure probability can be obtained by the probability integral Equation [17]:
(18)
3Example
The paper selects an aero-engine turbine blade as the research object; its material is TC4 alloy. The allowable stress of the blade is [σ]= 390MPa and allowable deformation of the blade is [δ]= 0.195 mm. The blade model is simplified to include simple cooling holes and tenons. A total of 1240 hexahedral units and 2000 nodes are manually generated by Marc software, and the simplified model is imported into analysis for simulation. The finite element mesh model of a blade is as shown in Fig. 2.
There are six working conditions in the operating process of an aircraft, which follows this trajectory: start, slow, maximum, continuous, take off, climb cruise. In order to simplify the calculation, the climbing phase, during which the blade stress and deformation are greatest, is selected as the calculation point [4].
To study the influence of the fuzzy limit state on calculation results, the relationship between positional parameter Z a of the membership function and the mean square deviation σ z is defined as follows:
(19)
To study the influence of fuzzy input variables on the calculation result, the distance value d x i a and the distance value d x i b are assumed to be equal. The relationship between the two is defined as follows:
(20)
The temperature, speed, density, and gravity acceleration of the blade are as assumed to be fuzzy variables and are expected to obey normal distribution. The input variables are shown in Table 1. The blade stress and radial deformation vector diagram of deterministic analysis obtained by software are shown in Figs. 3and 4.
The parameterized model of finite elements can be obtained from the above deterministic analysis. The mean value
The distribution histograms of the blade stress and deformation can be obtained after 10,000 samplings on the fuzzy response surface function, as shown in Figs. 5 and 6.
(21)
(22)
The stress and deformation of the blade obey a normal distribution. The mean value of stress is 3.5611×10⁸ Pa and the square deviation of stress is 1.9296×10³ Pa; the mean value and the standard deviation of deformation is 1.7076 × 10⁻⁴m and 7.5756 × 10⁻¹¹m, respectively. Therefore, the limit state functions of stress and the deformation of blades are obtained, shown respectively in Equations (23) and (24).
(23)
(24)
The reliability index β can be expressed as follows:
(25)
4Verification
The selected blade speed, material density, acceleration of gravity and temperature are selected as the random input variables. The type distribution, mean and variance of random parameter of the maximum displacement and maximum stress point are shown in Table 2.
Without consideration of the fuzziness of the random input and output variables, the random response surface function model is built solely on a theoretical basis (10). The stress and deformation response surface function are shown respectively in Equations (26) and (27).
(26)
(27)
A mathematical model has been established for the 10,000 time linkage sampling, which was used to achieve reliability analysis. The number of stress failures and displacement failures of the blade and the corresponding reliability probabilities are shown in Tables 3 and 4.
The failure probability of stress and deformation can be obtained by Equation (18), and the reliability is shown in Table 5.
5Conclusion
In this paper, the reliability of aero-engine blades was analyzed by simultaneously considering the fuzziness of the input variables and their limit states. Considering the fuzziness effect of basic variables, the fuzzy variables were converted into stochastic variables according to the entropy equivalence method. The failure probability was calculated based on the fuzzy probability theory, and the reliability index was obtained. The example analysis indicates that:
– The fuzziness of basic variables and limit states lead to remarkable effects on the structural fuzzy random reliability index. The reliability index decreases when the coefficient of the fuzzy zone of the input variable increases simultaneously with the coefficient of the limit state of the mushy zone. The fuzziness of the limit state function is not considered when k = 0.
– Respectively considering the effects of fuzziness and randomness on reliability analysis of blades, it is concluded that the fuzzy reliability of blade deformation is smaller than the stochastic reliability at 0.015% ; the fuzzy reliability of blade stress is smaller than its stochastic reliability at 0.006% , as determined by statistical analysis of more than 10,000 linkage samplings to the response surface. Comprehensively considering the efficiency of an aero-engine, the fuzzy reliability achieves the engineering requirement.
Acknowledgments
The authors gratefully acknowledge the support of the National Natural Science Foundation of China (51275138) and the project of Chinese Heilongjiang Province Education Department (12531109).
References
1 | Teixeira AP, Wang GS (2013) Probabilistic modeling of the ultimate strength of ship plates with non-uniform corrosion Marine Science and Technology 18: 115 132 |
2 | Fitzpatrick CK, Baldwin MA, Rullkoetter PJ (2011) Combined probabilistic and principal component analysis approach for multivariate sensitivity evaluation and application to implanted patellofemoral mechanics Journal of Biomechanics 44: 1 13 21 |
3 | Li C, Han X (2011) Analysis of reliability sensitivity for gear engagement based on response surface method Journal of Aerospace Power (in Chinese) 26: 3 711 715 |
4 | Zhang CY, Bai GC (2012) Extremum response surface method of reliability analysis on two-link flexible robot manipulator Journal of Central South University of Technology 19: 101 107 |
5 | Fei CW, Bai GC (2013) Distributed collaborative extremum response surface method for mechanical dynamic assembly reliability analysis Journal of Central South University 20: 2414 2422 |
6 | Allaix DL, Carbone VL (2011) An improvement of the response surface method Structural Safety 33: 2 165 172 |
7 | Bai GC, Fei CW (2013) Distributed collaborative response surface method for mechanical dynamic assembly reliability design Chinese Journal of Mechanical Engineering 26: 6 1160 1168 |
8 | Gao HF, Bai GC (2015) Vibration reliability analysis for aeroengine compressor blade based on support vector machine response surface method Journal of Central University 22: 1685 1694 |
9 | Komal , Sharma SP (2014) Fuzzy reliability analysis of washing unit in a paper plant using soft-computing based hybridized techniques Soft Computing in Industrial Applications 223: 105 115 |
10 | Yang LB, Gao YY, Ling WX (2011) The Principle and Application of Fuzzy Mathematics 78 92 South China University of Technology Press Guangzhou (in Chinese) |
11 | Kartal ME, Basaga HB, Bayraktar A (2011) Probabilistic nonlinear analysis of CFR dams by MCS using response surface method Applied Mathematical Modeling 35: 6 2752 2770 |
12 | Xu MH, Qiu ZP (2014) A collocation reliability analysis method for probabilistic and fuzzy mixed variables Science China Physics, mechanics & Astronomy 57: 7 1318 1330 |
13 | Giri PK, Maiti MK, Maiti M (2014) Entropy based solid transportation problems with discounted unit costs under fuzzy random environment Opsearch 51: 4 479 532 |
14 | Alekseev PV, Kiselev AS, Kiselev AS, Krutko ES, Loskutov OD, Tutonov AA (2014) Probabilistic strength analysis of the main joint of a vver-reactor Atomic Energy 115: 3 176 181 |
15 | Lu Q, Low BK (2011) Probabilistic analysis of underground rock excavations using response surface method and SORM Computers and Geotechnics 38: 8 1008 1021 |
16 | Tan XH, Bi WH, Hou XL (2011) Reliability analysis using radial basis function networks and support vector machines Computer and Geotechnics 38: 2 178 186 |
17 | Tan XH, Hu XJ, Wu KM (2009) Reliability analysis of the fuzzy stochastic finite element method for the slope with limited state fuzziness Handbook of Reliability, Availability, Maintainability and Safety in Engineering Design (in Chinese) 2: 28 3953 3958 |
18 | Han X, Jiang C, Liu LX, Liu J, Long XY (2014) Response-surface-based structural reliability analysis with random and interval mixed uncertainties Science China TechnologicalSciences 57: 7 1322 1334 |
19 | Zhai X, Fei CW, Zhai QG, Wang JJ (2014) Reliability and sensitivity analyses of HPT blade-tip radial running clearance using multiply response surface model Journal of Central University 21: 4368 4377 |
20 | Mahmood YA, Ahmadi A, Verma AK, Srividya A, Kumar U (2013) Fuzzy fault tree analysis: A review of concept and application International Journal of System Assurance 4: 1 19 32 |
21 | Hu Y, Liu SJ, Ding S, Liao YS (2015) Application of response surface method for contact fatigue reliability analysis of spur gear with consideration of EHL Journal of Central University 22: 2549 2556 |
22 | Eom YS, Yoo KS, Park JY (2011) Reliability-based topology optimization using a standard response surface method for three-dimensional structures Structural and Multidisciplinary Optimization 43: 2 287 295 |
Figures and Tables
Fig.1
Types of membership functions.
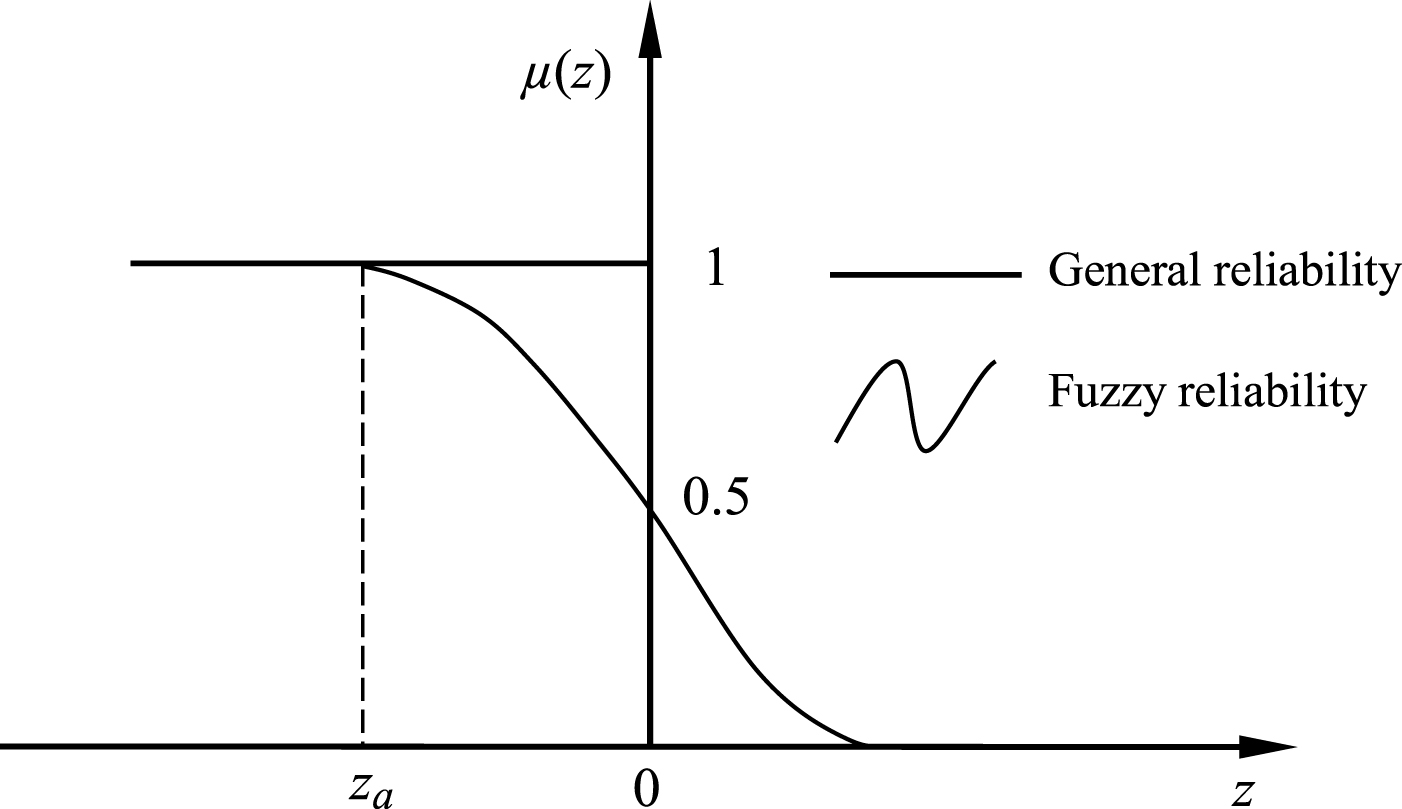
Fig.2
Aero-engine blade finite element model.
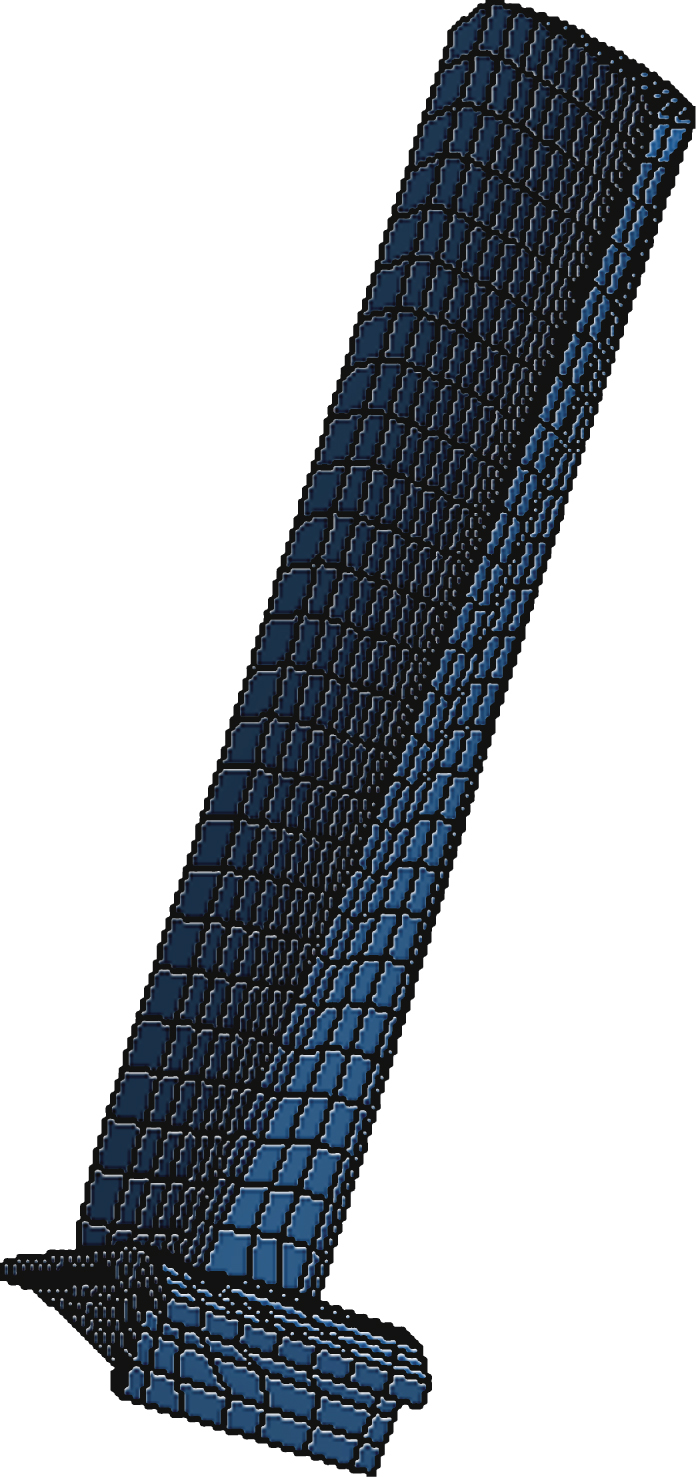
Fig.3
Blade stress vector diagram.
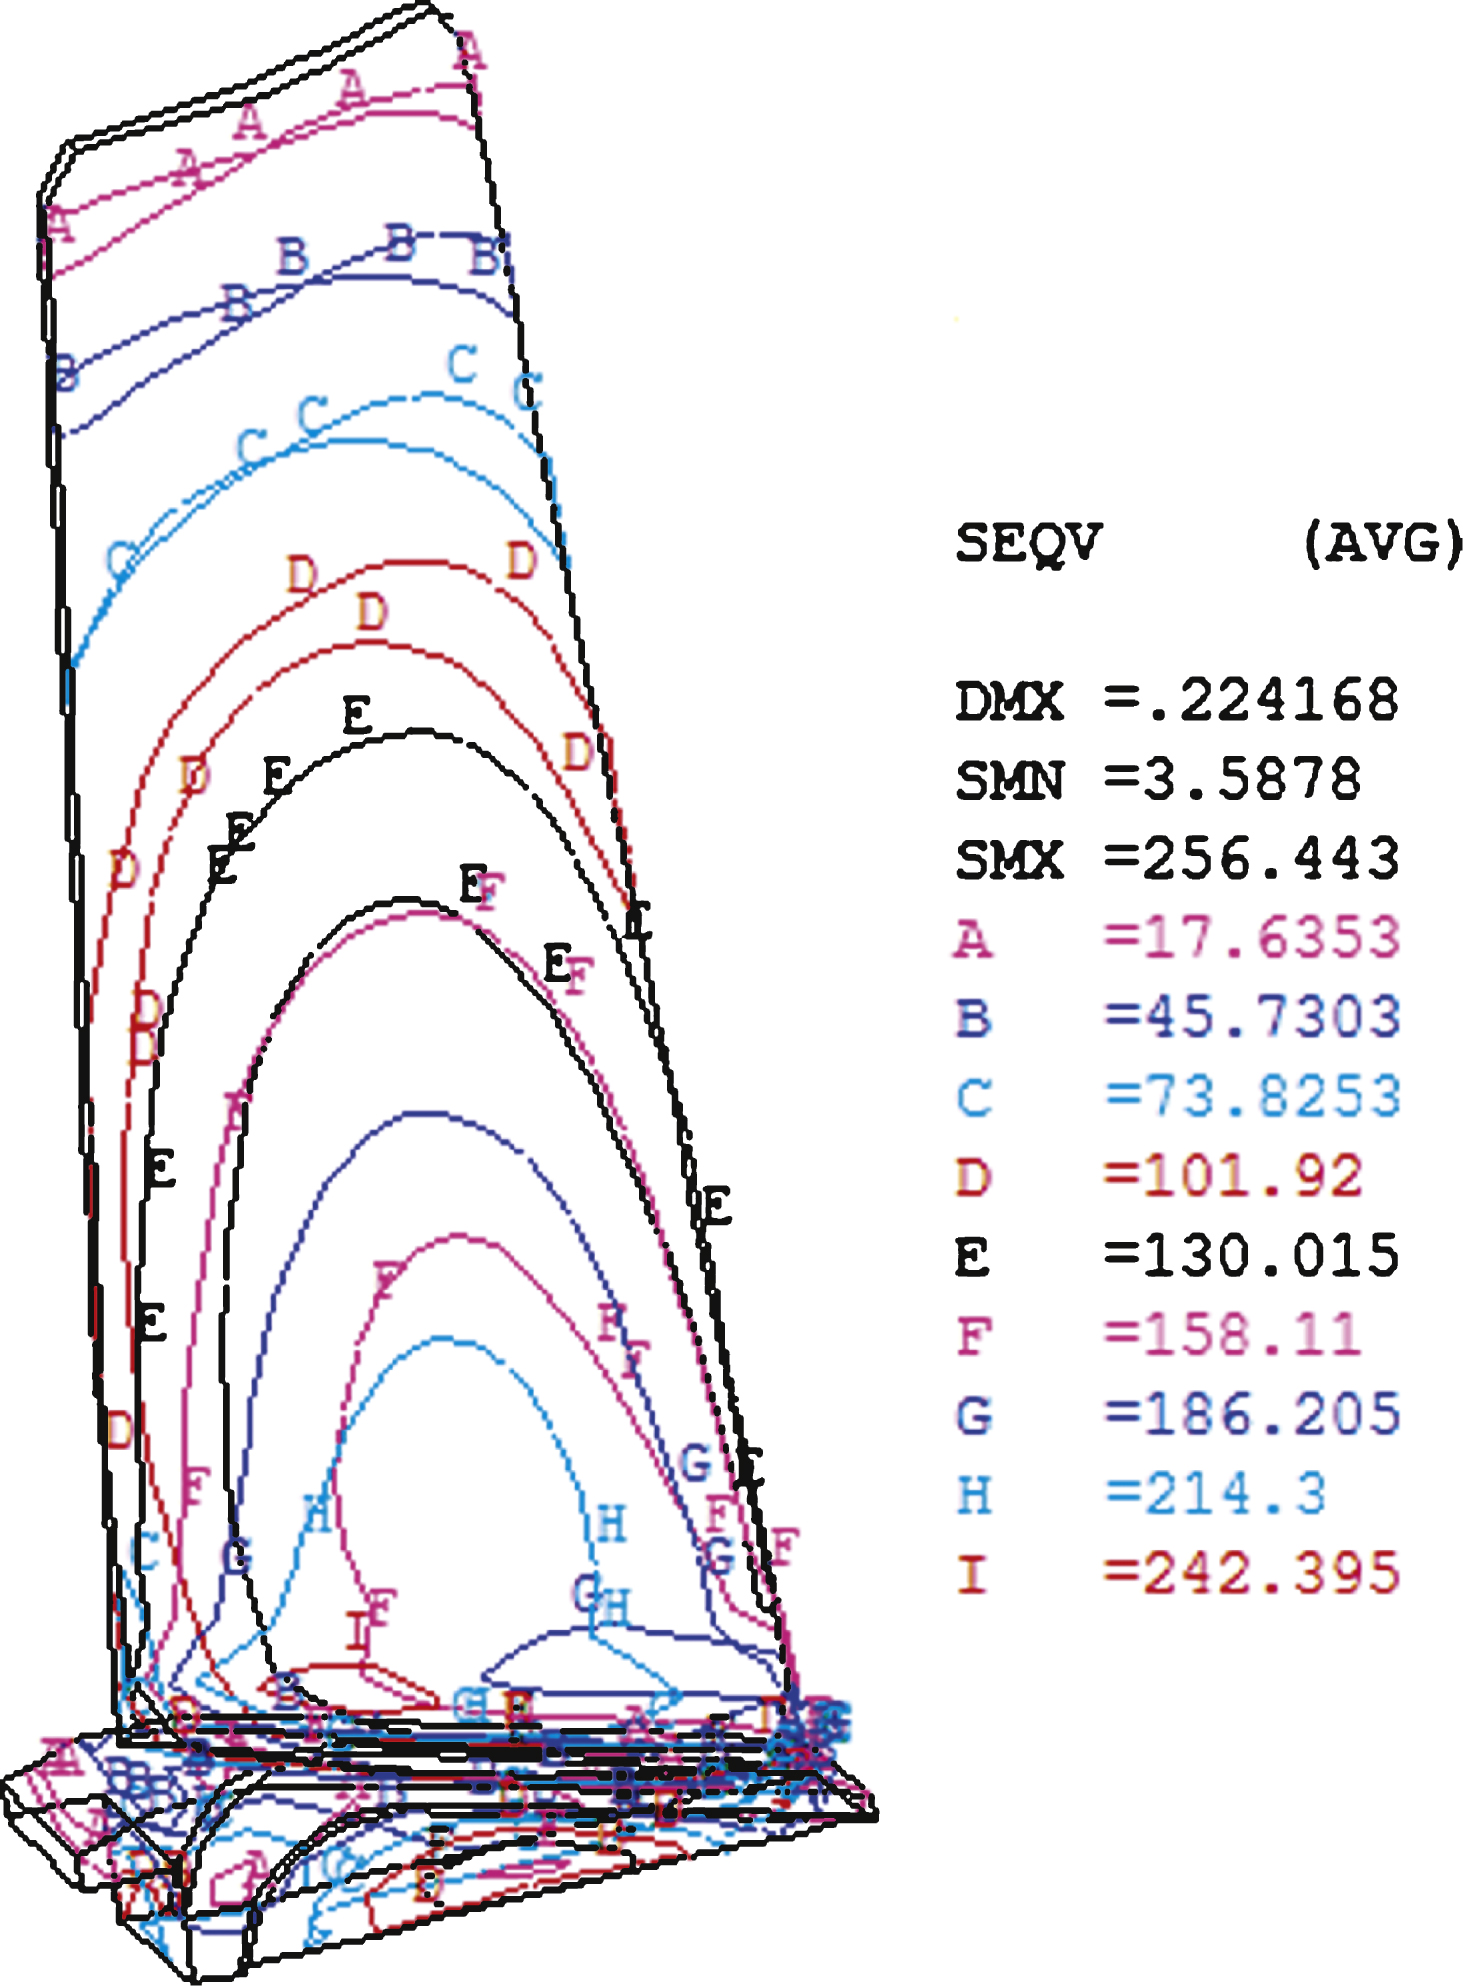
Fig.4
Blade deformation vector diagram.
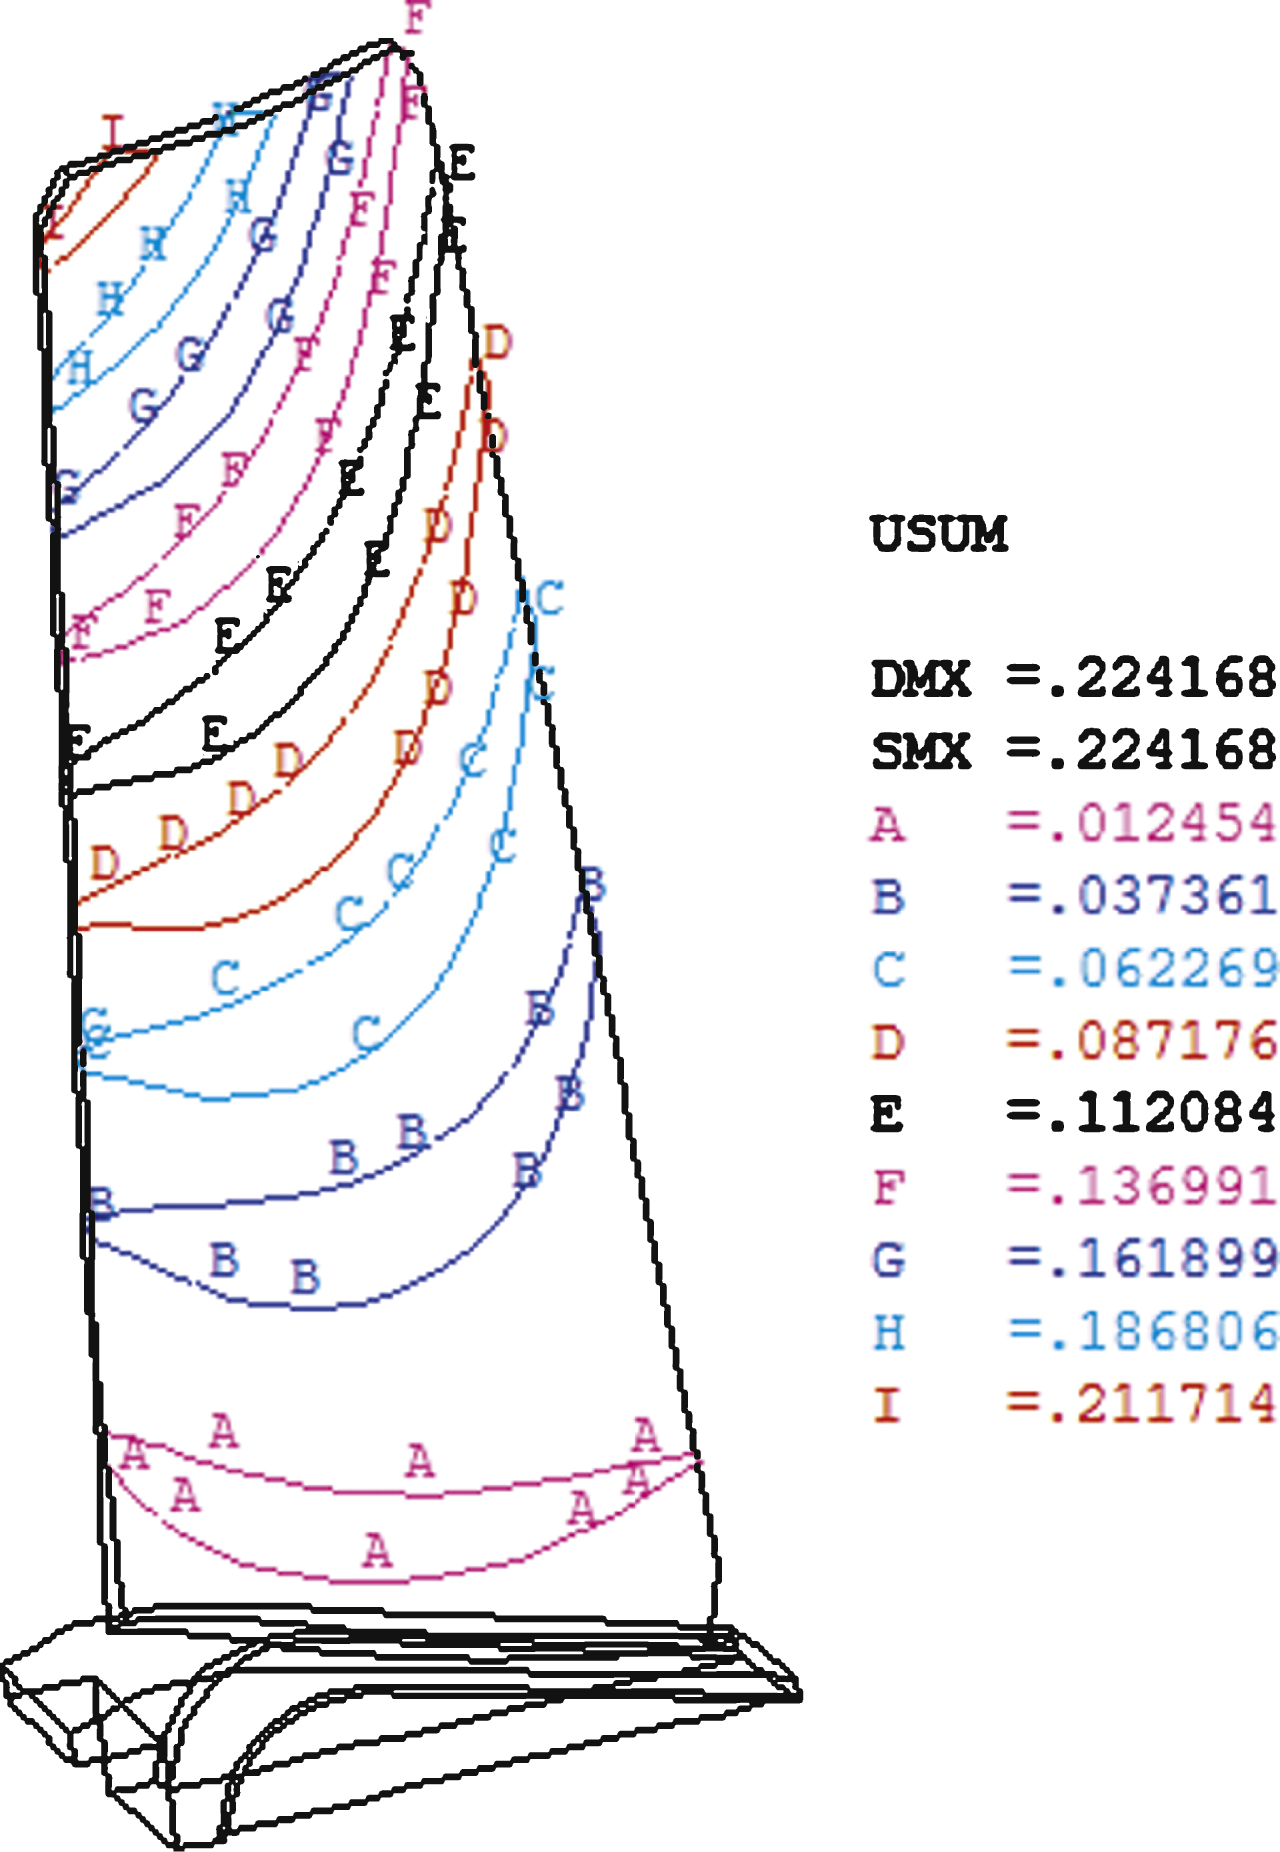
Fig.5
Blade deformation histogram.
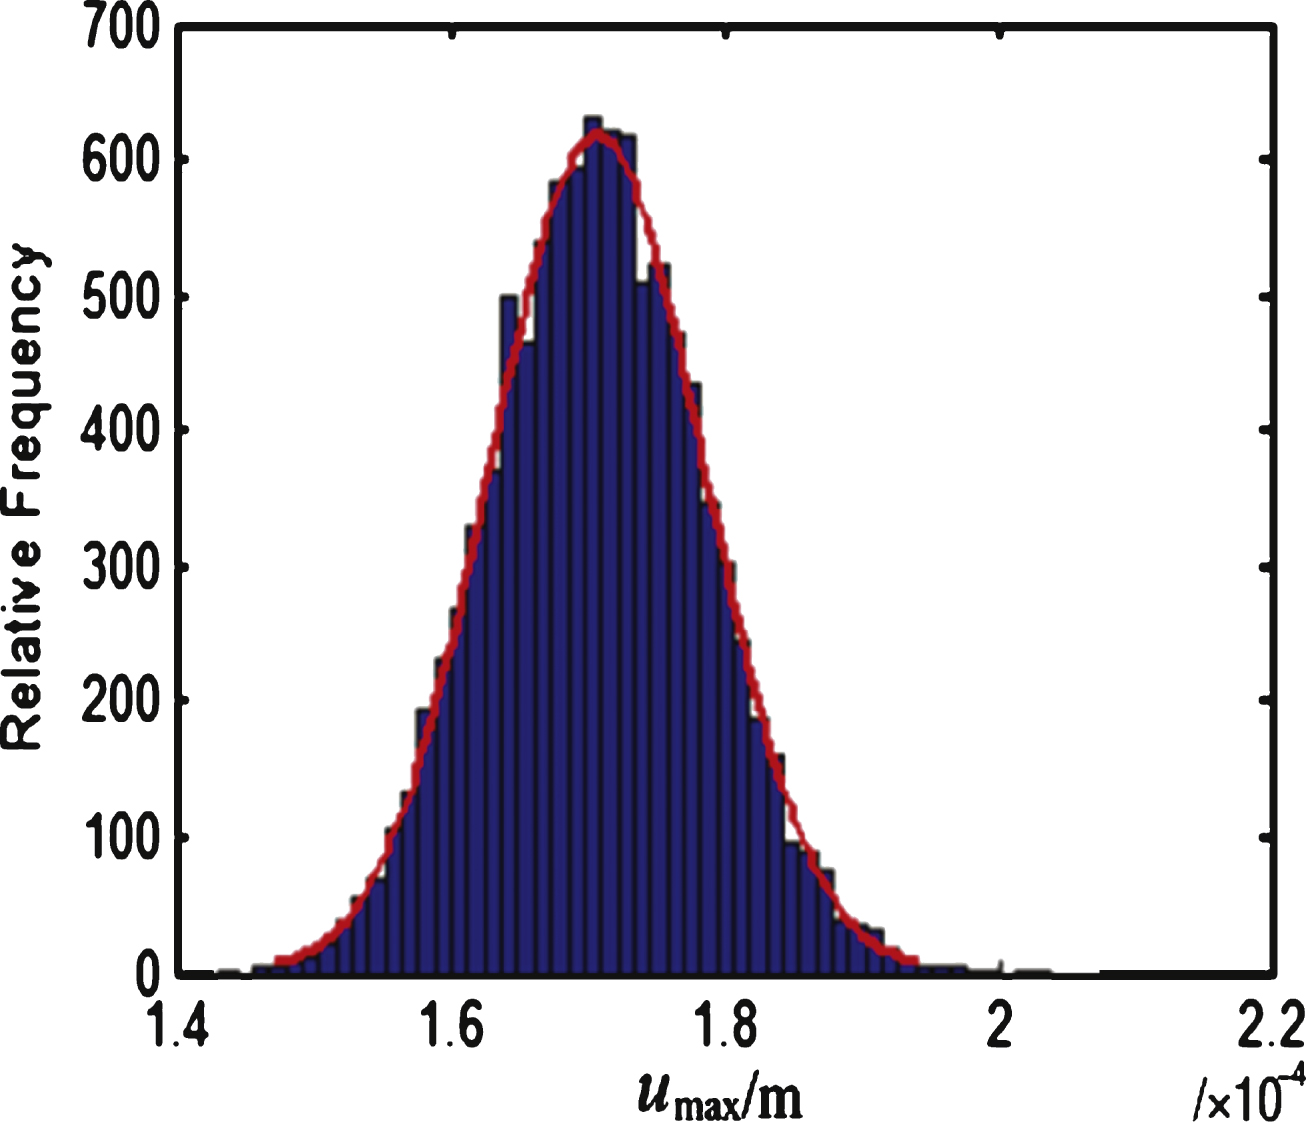
Fig.6
Blade stress histogram.
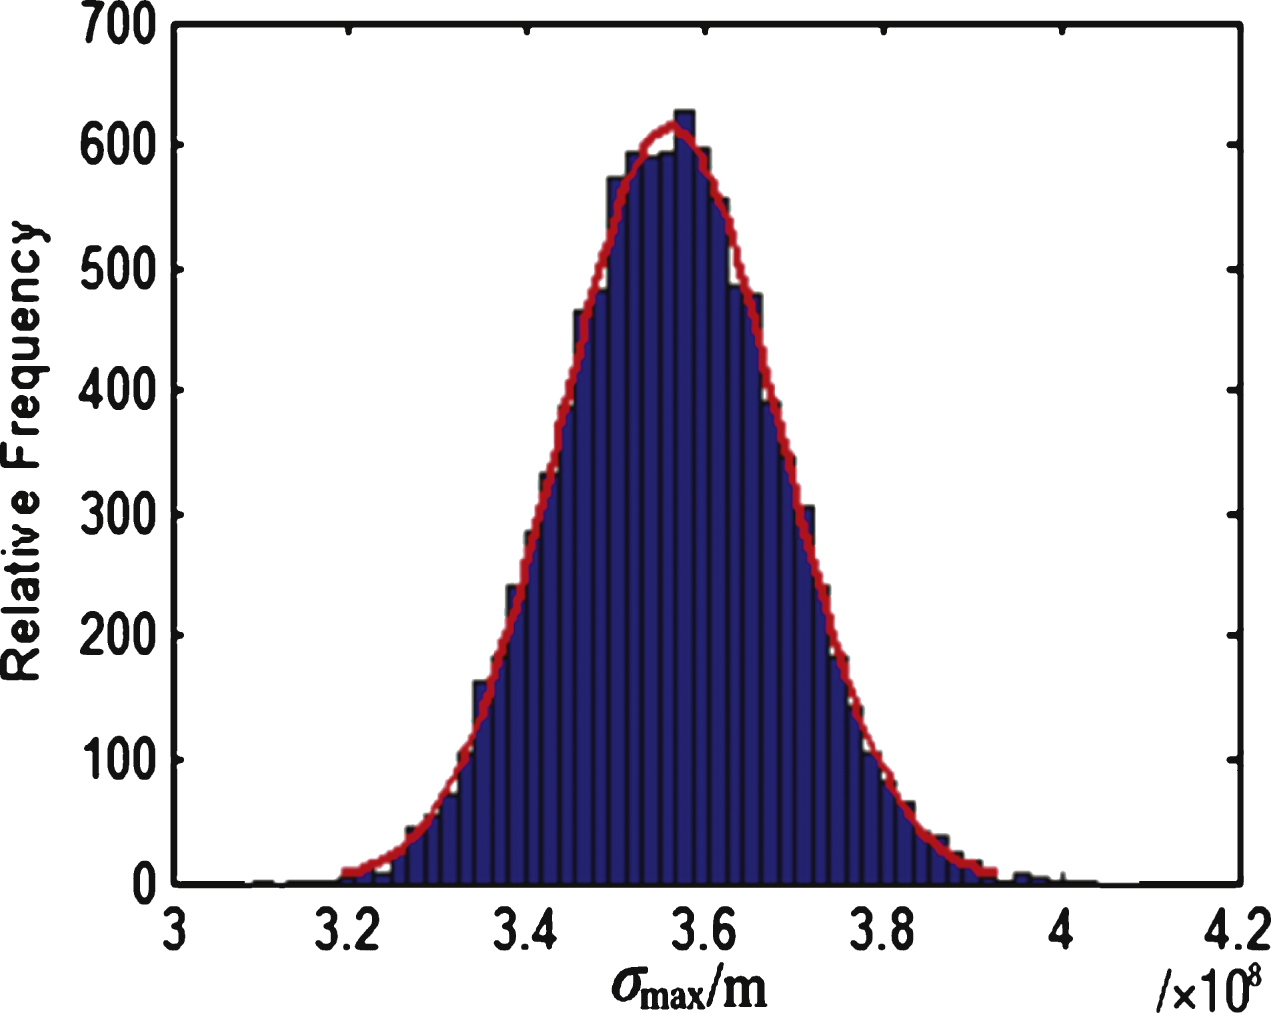
Fig.7
Fuzzy range effect on the reliability index.
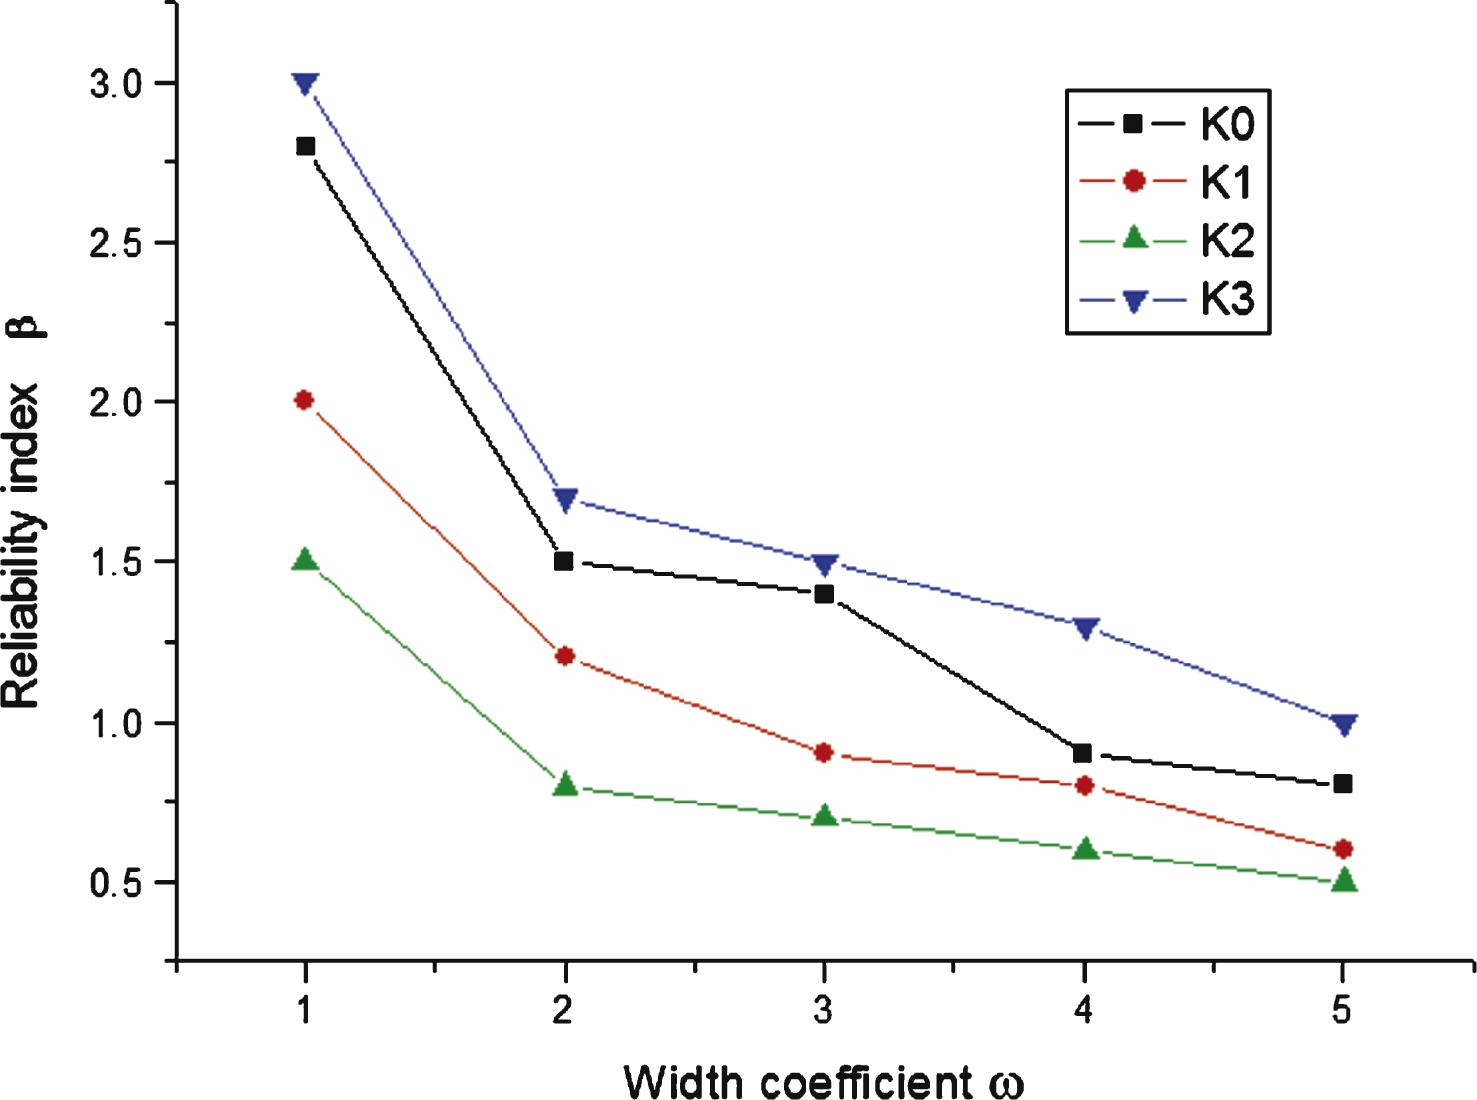
Table 1
Input variables for fuzzy reliability analysis of blade
| Variable | Distribution | Median x m | fuzzy zone d |
| Temperature, T/°C | Normal | 1200 | 600 |
| Rotation speed, ω/(r/s) | Normal | 1168 | 584 |
| Dencity, ρ/(kg/m3) | Normal | 8210 | 4105 |
| Acceleration, g/(m/s2) | Normal | 9.806 | 4.903 |
Table 2
Reliability analysis results
| Variable | Distribution | Mean | Variance |
| Tem, T/°C | Normal | 1200 | 24 |
| Speed, w/(r/s) | Normal | 1168 | 23.36 |
| Den, ρ/(kg/m3) | Normal | 8210 | 164.2 |
| Acc, g/m/s2 | Normal | 9.806 | 0.196 |
Table 3
Blade stress failure and reliability probability
|
| N failure | Probability (%) |
| 4.0 | 14 | 99.864 |
| 3.9 | 43 | 97.680 |
| 3.8 | 456 | 95.447 |
| 3.7 | 1611 | 83.849 |
| 3.6 | 3865 | 61.365 |
Table 4
Blade displacement failure and reliability probability
|
| N failure | Probability (%) |
| 2.00 | 11 | 99.897 |
| 1.95 | 39 | 98.136 |
| 1.90 | 165 | 96.375 |
| 1.85 | 604 | 93.976 |
| 1.80 | 1456 | 85.454 |
| 1.75 | 3079 | 69.217 |
Table 5
Reliability analysis result
| P r1 | P r2 | |
| R | 97.68 | 98.136 |
|
| 97.665 | 98.130 |


