
A prospective analysis of the engineering design discipline evolution based on key influencing trends
Abstract
Design and manufacturing sectors are vital agents of an economy. However, multiple challenges influence product designs such as the predicted scarcity of energy and primary materials, the ubiquitous integration of electronic components and computing science in systems’ architectures, the pervasive production of data by most systems, the emphasis given to CO2 free energy solutions, recycling, and reuse, the transformation of the consumption model from product ownership to product as a service, as well as the geopolitical conflicts. Major technological advancements leading to transformation in socio-economic practices would be required to address these challenges which can have a profound effect on design and manufacturing activities. This research aims to evaluate the potential impact and modification induced by such transformations on product design process. The research identifies that early design automation can enable coping with unmanageable cognitive load generated by cascading changes. A list of modifications to current design practices is proposed to enable the development of a new generation of design tools. The article provides an initial prospective effort to discuss the potential services and functionality that will be offered by future design tools’.
1Introduction
Herbert Simon introduced two concepts remaining relevant for the entire design and manufacturing disciplines. First, the concept of bounded rationality, which was initially introduced in an economic context as a criticism of the classical economic theory and asserting the existence of a purely rational decision-maker, the homo economicus (Moon, 2007). Research in fields such as economy or psychology has demonstrated that rationality, is often the exception more than the norm in human decision processes. Hypothesising a purely rational behaviour is detrimental to understanding the complexity of the human decision processes and consequently its branch of design decision making. The second important concept is the concept of satisficing (Simon, 1956). The term satisficing is a combination of satisfying and suffice. This concept is important for practical reasons. Indeed, the design activity is a problem-solving activity, where solutions to problems are found in form of tangible or non-tangible artefacts. An artefact is an artificially created object. A satisficing solution to a design problem is a feasible solution produced within specified time limits and using specified and constrained bounded resources.
Designers, in all application fields of the design discipline, are facing the problem of finding feasible and satisficing solutions. When working on solutions, certain stages of design can have a higher influence and induce constraints on the final performances of the designed artefacts. For example, design decisions taken at the early stages of the process are less costly but concurrently, can also heavily constrain later decisions. Therefore, the early design stage is a strategic phase of the design activity, but also a challenging one, due to the limited availability of early knowledge combined with a high level of associated uncertainty. Early design decisions combine the potential for high added value and high risk due to the ill-defined nature of the early knowledge. Early knowledge combines characteristics such as fuzziness, scarcity, and qualitative nature. Despite the inherent uncertainty, early knowledge can provide crucial information during product development and the potential of this resource is rarely fully exploited in current design practices.
Two key types of information are available at an early stage. First, information in form of natural language and diagrams and second, numerical data collected. Natural language and diagrams are knowledge that is used in all system and product development frameworks, and they form the basic initial engineering material that fuels the design process. Nevertheless, a fundamental change in the requirements of a design is affecting this first source of knowledge. The scope and volume of requirements that are considered by designers have increased drastically over the years based on factors such as choice of feasible manufacturing alternatives, meeting market expectations, government regulations, sustainability performance of the product, and broader consideration of life cycle phases for instance recycling or remanufacturing. Simultaneously, there is also an increase in the complexity and number of standards and norms to be fulfilled, resulting in a tighter containment of the design solution space. An example of this can be seen in the automotive industry where the push from governmental organizations for a fossil-fuel-free mode of transportation combined with modified business strategies of automotive manufacturers has resulted in making electric vehicles equally appealing for both consumers and automotive manufacturers. The above-mentioned elements imply that a larger number of requirements need to be considered and integrated into a classical product development process. Conjointly, this increases the complexity of the design process due to the significant increase in the number of requirements and their couplings. Changes in individual requirements can lead to a cascading chain of modifications on connected requirements and design solutions, that are quickly becoming impossible to track and manage for human designers. Our cognitive capabilities are becoming truly challenged by the scale of the design problems to be solved.
The limitations of human cognitive capabilities in handling these extensive design problems call for the development of efficient methods for design automation in the form of support tools. Such tools can help overcome the complexity levels generated by the increasing number of requirements and the fundamental linguistic and diagrammatic nature of modern requirements engineering. Nevertheless, a shift to design automation would require preliminary research that can address the following challenges; First, how to automatically extract requirements and analyse their interconnections and quality? Second, how to model the massive number of interconnections between them and simulate the effects of changes? and third, how to support design synthesis, design concept evaluations, and design decision making in a fuzzy qualitative context where massive amount of decision criteria need to be considered? To address these challenges, leveraging the second type of information (collected data) in the classical design process can provide benefits.
Data collection is integrated into most last generation systems. This source of information results from the systematic integration of sensors and computer devices on the latest generation of manufactured artefacts. This is a paradigm shift both technologically and from a business model point of view. The traditional form of design, named in this article the forward design paradigm, is flowing from requirements to final artefact. A second design paradigm is emerging, the data-enabled engineering design paradigm, where new types of needs and requirements can be extracted in almost real-time from the mass of collected information on an artefacts’ usage. The data-enabled engineering design paradigm presented in this section is more commonly named data-driven engineering (Brunton et al., 2019). From the combination of the traditional and data-enabled design processes, a more dynamic and looped design process is emerging which enables rapid development of services or artefacts tailored to customers’ needs. Thus, a new design process would need to integrate data analysis for new requirement extraction, as an additional stage in the classical design process, along with supplementary evolutionary factors to be considered in a prospective effort. They are the changes in the engineering design working practices and organization. The engineering design discipline increasingly relies on simulations to replace expensive prototyping. In addition to simulation models, multidisciplinary design optimisation (MDO) is being used in the different design phases (such as early conceptual phase, detailed design phase, design optimization) to find optimum solutions that satisfy the multidisciplinary constraints (product-process-structure and performance criterion). Consequently, the nature of the skills required in the engineering design discipline is expanding and the role played by systems’ modelling languages as a common language is growing in importance. Simultaneously the role played by systems engineers to orchestrate a complexified design process is becoming central.
The radical changes affecting the design practices summarized above are generating massive challenges for the engineering design and manufacturing communities. The trend toward the complexification of the design activity is pushing the human cognitive capabilities toward their limits. Emerging patterns and interactions might appear in such type of complex environment and should be detected beforehand to be able to mitigate or remove their possible negative impacts. Even without the presence of emerging behaviours, the systemic impacts of requirements or design modifications in present-day products are already difficult or often impossible to predict and manage without the use of advanced engineering support tools. Few novel tools have been developed partly in favour of design advancements and the purpose of this article is to demonstrate the development and use of a future design tool. This effort should be part of a more global automation design support system (DSS) for the early design phases integrating, requirement engineering, design synthesis, as well as design concepts analysis and evaluation. Computer support tools are very hard to create for such types of tasks due to the fuzzy and vague nature of early design knowledge.
The present article provides a roadmap that would help discuss and answer questions related to the technologies that can be used in the development of a DSS and the possible benefits and challenges of implementation of DSS for improving the early design stage process. The remainder of this manuscript is organized as follows. Section 2 presents an overview of disciplines spanning from design methodologies, natural language processing, causal ordering, and knowledge graphs. Those fields of research are the key enablers for the future of engineering design activity. Section 3 presents two prototyping tools already existing and that can serve as examples of the direction to be followed. Section 4 concludes with a discussion on the findings.
2Background
In the background section, we aim to present potential key disciplines supporting the development of design automation and solving the associated challenges. The focus in this section is specifically oriented toward early design tasks for the reasons presented above. The section starts with a brief overview of the existing engineering design process and the evolutionary transformation that the discipline must assimilate to keep up with data-driven methodologies. Similarly, to fractal structures, the early design process is on a smaller scale repetition of engineering design tasks such as problem description, solution generation and evaluation, decision making. A similar pattern is repeated for the embodiment and detail design stages.
Problem formulation in form of needs and requirements is very important for the success of the design activity. Specific focus should be given in the engineering design discipline to natural language processing (NLP) methods because needs and requirements are mainly captured in form of natural language sentences often associated with diagrams and tables. Being aware of the state-of-the-art in NLP methods is important to support automation of the requirement engineering phase. Knowledge and causal graphs are also potentially useful approaches for requirement engineering because requirements themselves exhibit interconnections and cross-influences. The spectrum of application for graphs is going far beyond requirements engineering and covers the entire design process. Graph modelling capabilities will play most certainly a significant role in the future of the engineering design discipline because they provide capabilities for supporting automatic reasoning and possibilities to generate new design architectures in a qualitative and quantitative context. To play this role, graphs need to be connected to other concepts and approaches too. Those concepts are briefly introduced in subsection 2.3. In subsection 2.1, we describe some transformations affecting the design process itself and try to evaluate the consequences and opportunities provided by those changes.
2.1Forward and data-enabled design process
Problem-solving via the creation of new artefacts is not only a human capability but also a skill shared by multiple other species such as dolphins, crows, and primates. New surprising occurrences of that capabilities are regularly discovered by scientists, showing its prevalence within living species. The formalization of the problem-solving aspects associated with the engineering design discipline started progressively during the 19th century in Germany with theorists and practitioners such as Ferdinand Redtenbacher and Franz Reuleaux (Moon, 2007). The same intellectual movement was taking place also in parallel in other European countries such as England and France but with a less developed engineering focus. Nowadays, the design discipline is covering a large spectrum of application domains from civil engineering to clothing design. This article does not aim at developing a thorough analysis of all those branches, but instead, want to extract a few key general drivers covering the engineering design discipline. One important driver is the role played by creativity in design in opposition to a design process seen as an integration process using predesigned components or sub-systems. An important validation method for the design process is the possibility to generate cheap tangible prototypes or to require simulation. A third, characteristic to consider is the recursive nature of the design process. Finally, the design process is also an activity, where design space exploration and design solutions selection and evaluation are taking place.
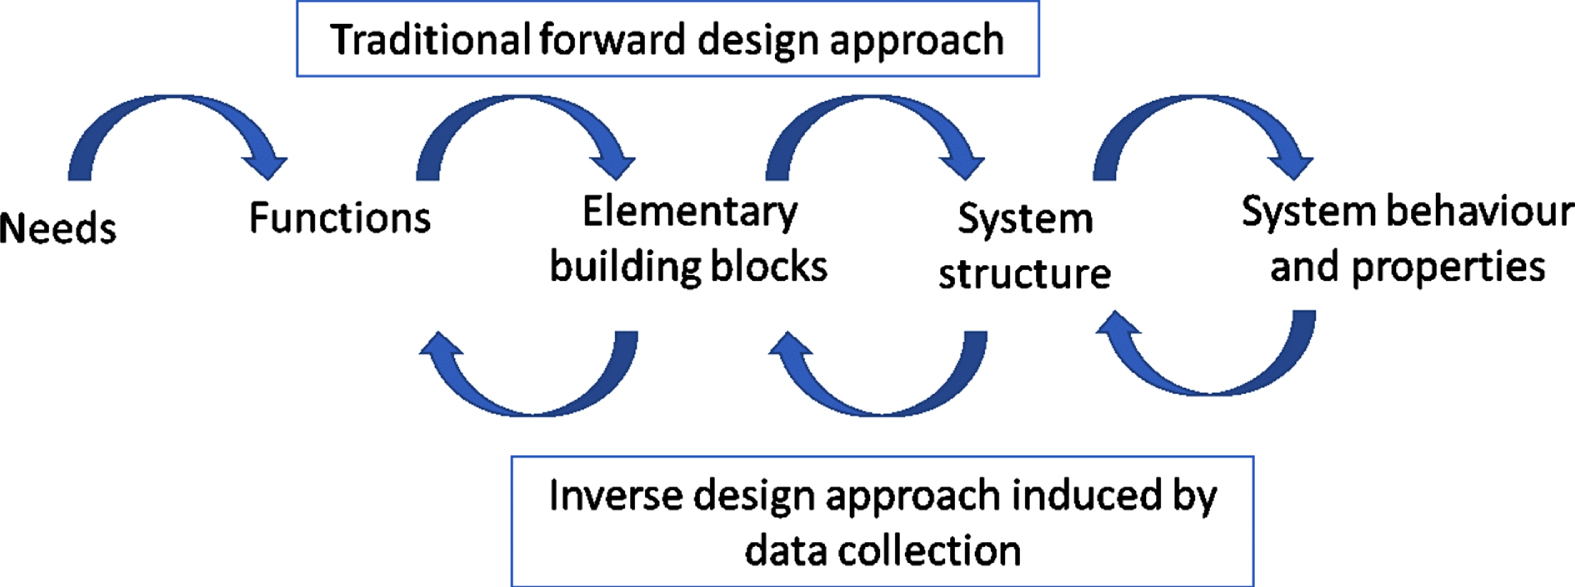
Different socio-economic trends are affecting the design factors and leading to a certain types of design features. First, novelty, innovation, and differentiation are favoured by most product and system designs. Second, the growing complexity of systems and products are favouring design strategies relying on models and simulations. Third, the recursive character of the design process is reinforced by the continuous collection and production of data by artefacts and the possibility to use them to refine or generate rapidly new requirements. This is visible in the design process presented in Fig. 1 and integrating the collection of data and their analyses to generate new needs and functions. Fourth, the growing number of dimensions of any design space is making the exploration more challenging and costly from a computational point of view. Simultaneously, the integration of multiple disciplines and the discontinuous nature of the design space is making the multidisciplinary design optimizations (MDO), a necessary approach for design in multiple cases.
Fig. 1
Evolution of the engineering design process.
The following sections developed a small state of the art of different approaches and research directions that can be considered for the automation of the design process.
2.2Overview of Design Decision Support (DSS) systems
With the engineering design and manufacturing disciplines moving towards more automated processes, solutions have been developed leading to intelligent Decision Support Systems (DSS) and cyber-physical production systems (CPPS). DSS can serve as passive, active, or cooperative systems depending upon their functionality. The available literature categorizes DSS into five types, namely, model-driven, data-driven, knowledge-driven, document-driven, and communication-driven systems (Felsberger et al., 2016). A model-driven DSS is typically not data-intensive, rather it uses analytical models, simulation tools, and optimization methods to generate multiple experiments depicting the effects of alternative decisions. Monte Carlo simulation, discrete event simulation, probabilistic forecasting, agent-based and multi-agent simulation, system dynamics, and visual simulation are some of the common simulation methods used in model-driven DSS (Hilletofth et al., 2016; Li et al., 2016; F. Zhang et al., 2016). Data-driven DSS, on the other hand, utilizes structured data (e.g., machine learning using neural networks), such as internal and external company data, time-series data, and real-time data (Power 2001). Business intelligence systems or online analytical processing (OLAP) are examples of data driven DSS that enable better decision support by formulating decisions through triggering, manipulating, and/or analysing data. However, accurate and structured data are a key requirement in developing data-driven solutions and thus, efficient data processing could enable fast and accurate decision making (Chaudhuri et al. 2011; Pillai 1990).
Knowledge-based DSS methods of today (e.g., fuzzy logic, Bayesian networks, and genetic algorithms) have evolved from their predecessors, known as rule-based expert systems. Such rule-based expert systems use heuristics to solve problems with the help of human expert knowledge stored in databases. In the age of big data, the challenges about the properties of data (i.e., volume, variety, velocity, veracity, validity, and value) need to be addressed to improve the process of decision making (Kaiser et al 2013; Berman 2013; Zhang 2014).
All the approaches presented in this short review are confirmatory, requiring a pre-existing structured knowledge. This is implying the existence of approaches to structure the pre-existing knowledge. Currently, this process is done manually by humans. Automatically extracting and structuring, this initial knowledge using automatic approaches is a central research problem if the goal is the automation of DSS. To move in that direction, the next section is exploring a possible enabler by scratching the surface of a broad domain, the knowledge graphs.
2.3Knowledge Graphs (KG) applications in modelling, simulation, and decision making
Briefly presented, a knowledge graph is a type of modelling approach extracting and graphically encoding knowledge. In its most elementary form, a knowledge graph only models the relationships between variables of a system of interest and does not explain the inner workings of the system of interest. Different forms of knowledge exist, but a key attribute of this approach is to determine the relationships between entities, such as between the variables describing a system. Knowledge graphs are typically created from different forms of datasets. Those datasets can vary in their structures and nature, making knowledge graphs a rather broad concept. Knowledge graphs can represent words, sentences, and their relationships. They can also be created from numerical datasets and represent for examples variables. Or they can combine also diagrams, words and numbers for example in requirement engineering.
Knowledge graphs are often associated with ontologies, and it is debated in some communities if knowledge graphs are ontologies or another type of object. In this article, we decided to separate the broad domain of knowledge graphs into some fundamental properties that we need for graphs to be useful to support the adaption of the design and manufacturing process. First, we need graphs able to process natural language. Second, we need also graphs able to structure initial knowledge, an activity usually done by humans. For this reason, we need to deal with the concept of causality and causal reasoning, central to human reasoning. Third, the design process is implying more and more decision making and optimization. For this reason, a section of this article has been reserved for surrogate modelling and multidisciplinary optimization. Surrogate modelling is useful in this context as a confirmatory method as well as an approach required for multidisciplinary optimization methods.
2.3.1Natural language processing and KG
As far as needs or requirements are expressed in natural language, computational linguistics methods form a technique of choice to analyse and manage them. Natural Language Processing (NLP) approaches have been utilized to highlight different relationships between pieces of language. The NLP methods are used in three main specific contexts, first for comparison between pieces of language, second for classification of pieces of language into predefined or dynamically defined categories. Finally, the most challenging task for NLP methods is understanding language meaning. This can be used for example for detecting errors in requirements or detecting contradictions between requirements. To summarize, the purpose of NLP methods can be separated between labelling part of speech, extracting meaning from sentences, comparing language parts. The algorithms employed to achieve those tasks belong to the three fundamental categories of supervised, semi-supervised or unsupervised algorithms. The key techniques used in the literature currently are transformers, SVD decomposition applied to the frequency of terms. This technique is also named Latent Semantic Analysis (LSA). Different adaptations of LSA methods are also available in the literature (Landauer et al., 2008).
To be more precise, the classification tasks can be handled via a broad variety of methods belonging to the field of machine learning (ML). The labels or clusters can be predefined or learned via clustering algorithms. Classical algorithms such as Kmeans or DBscan can be interesting for each specific situation (Pelleg et al., 1999) (Ester et al., 1996). For comparison purposes, the comparison between pieces of language can be used for example similarity metrics. Semantic similarity measures can be provided by using vector space measures or probabilistic measures (Lamar, 2009). If probabilistic data are not present, then vector space measures can be used for similarity analysis. One common vector space measure is the cosine similarity method, which is widely used for measuring the distance between documents or sentences (Lamar et al., 2010). In their research work (Christophe et al., 2014), Christophe et al. used the cosine metric together with a logistic function to find out the similarity between requirements. Lash used a computational linguistic approach to identify the relationships between requirements. Along with this, he compared different requirements analysis methods (Lash, 2013). Among the computational linguistic methods, Singular Value Decomposition (SVD) or one of its variants is commonly used to identify and relate the semantics of requirements. SVD is used to develop an NLP approach called Latent Semantic Analysis (LSA) (Landauer et al., 2008). LSA can also be seen as a dimension reduction technique. It takes a set of semantic objects that exist in a high-dimensional space and represents them in a lower-dimensional space (Lamar, 2009) in which the main dimensions are represented. LSA is widely used to find out the relations between sentences. This approach is applied, for example, in software industries to propose titles for books that are related to the keywords used in a search query. LSA and SVD are also commonly used in collaborative filtering. This is a method of choice employed for example to suggest tv programs on some well-known online platforms. This method has been validated for its accuracy in different applications (Landauer et al., 2008). Four key features of LSA are listed below.
1. Latent meaning: the truncated result of SVD analysis (low-dimensional matrix); the correspondence between words and contexts indicates similarities between contexts (in our case sentences).
2. Noise reduction: truncated SVD mostly captures information rather than noise.
3. High-order co-occurrence: when two words appear in the same context, it is called first-order co-occurrence, and when two words appear in different contexts, it is called high-order co-occurrence. SVD can discover the high-order co-occurrences.
4. Sparsity reduction: Normally, an input matrix (word to sentence) is very sparse (most contain only zeroes), but the truncated SVD produces denser matrices. This quality increases the efficiency of the computing method.
In the context of comparing and analysing requirements, the work of J. Misra is significant. He used LSA to prioritize requirements within clusters (Misra et al., 2014). Although this helps engineers to prioritize requirements, it does not provide an understanding of the interactions between requirements. Presenting those interactions will lead to easier requirements management for engineers.
One type of interaction important for requirement engineering is the ability to understand and detect contradictions. For a large and complex project, identifying the interaction (or relations) between requirements texts is a key issue to consider because it can provide significant benefits when later developing causal ordering and early reasoning.
Apart from requirements, contradictions can occur in a normal text, when two sentences are extremely unlikely to be true at the same time. In this area, the works of (Harabagiu et al, 2006) and (de Maneffe et al., 2008) are significant. Compared to Harabagiu’s work, de Marneffe’s refinement method for finding contradictions between texts is easier to implement in computer systems. Table 1 below summarizes different types of contradictions that are listed in those works.
Table 1
Contradictions
| Type | Description |
| Antonym | Contradiction exists due to the existence of antonym words. Example Catalyst, Deterrent. Example: The number of personnel should be decreased in the factory. The number of personnel should be increased in the factory. |
| Negation | Contradiction exists due to negative words. Example: have not, do not. Example: The temperature of the room should not be more than 25 degrees Celsius. The temperature of the room should be more than 25 degrees Celsius. |
| Numeric | Contradiction exists due to imposing different numerical specifications for some systems. Example: The weight of the handset should be less than 113 grams. The weight of the handset should be less than 200 grams. |
| Structure | Considering the physical structure of a system, a contradiction exists with the requirements. Example: Internet submarine cable links should be built between the Czech Republic and Finland. Explanation: it is impossible because the Czech Republic does not have any coastal border with Finland. |
| Lexical | Contradiction due to lexical or semantic discrepancy. For example, all the components of the system should be manufactured locally. Battery and power supply should be imported from Germany. |
| Factive, World knowledge | Contradiction exists due to facts of established or previous knowledge. Example: Sand from the Sahara Desert should be used for constructing the building. Explanation: This requirement refers to an impossible fact because desert sand is not suitable for construction work. |
De Marneffe mentioned that some of the contradictions could be detected using computational linguistic approaches. Other contradictions, for example, factive world knowledge structure-related contradictions, are difficult to detect using NLP approaches and the results are error-prone.
More advanced methods such as transformers can become potential solutions to detect the most challenging types of contradictions present in the text (Vaswani et al., 2017).
Requirement’s quality metrics are also covered by NLP methods. Table 2 from Mokammel et al. 2018, summarizes different metrics considered in the requirement engineering literature.
Table 2
Natural language quality metrics for requirements
| Developed metrics | Lexical (Word choice) | Syntactical (Requirement structure) | Semantic (Requirement meaning) | Source |
| Vagueness | X | QuARS (Lami, 2005) | ||
| Subjectivity | X | |||
| Optionality | X | |||
| Implicitness | X | |||
| Weakness | X | |||
| Under-specification | X | |||
| Multiplicity | X | |||
| Readability | X | |||
| Completeness | X | X | (Lamar, 2009) | |
| Atomicity | X | X | (Ott, 2012) | |
| Unambiguity | X | |||
| Conciseness | X | |||
| Testability | X | |||
| Traceability | X | |||
| Consistency | X | |||
| Correctness | X | |||
| Completeness | X | X |
Such type of contradiction detection approach was developed for a general text corpus. Applying this approach to requirements texts was proposed by Mokammel et al. in (Mokammel et al., 2018). This generic overview of different uses of NLP methods has highlighted three types of possible knowledge that can be extracted from text. In an engineering context, requirements can be directly and automatically extracted from text. The quality of those requirements can be evaluated, and automatic corrections can be proposed to requirement structures. Last, it is possible to detect links between requirements and to detect potential contradictions between requirements. Those requirements can also be classified into specific predefined or automatically defined categories. The natural move from the requirements’ network is causal relations and causal reasoning. This is the topic of the next section.
2.3.2Causal relationships and causal reasoning
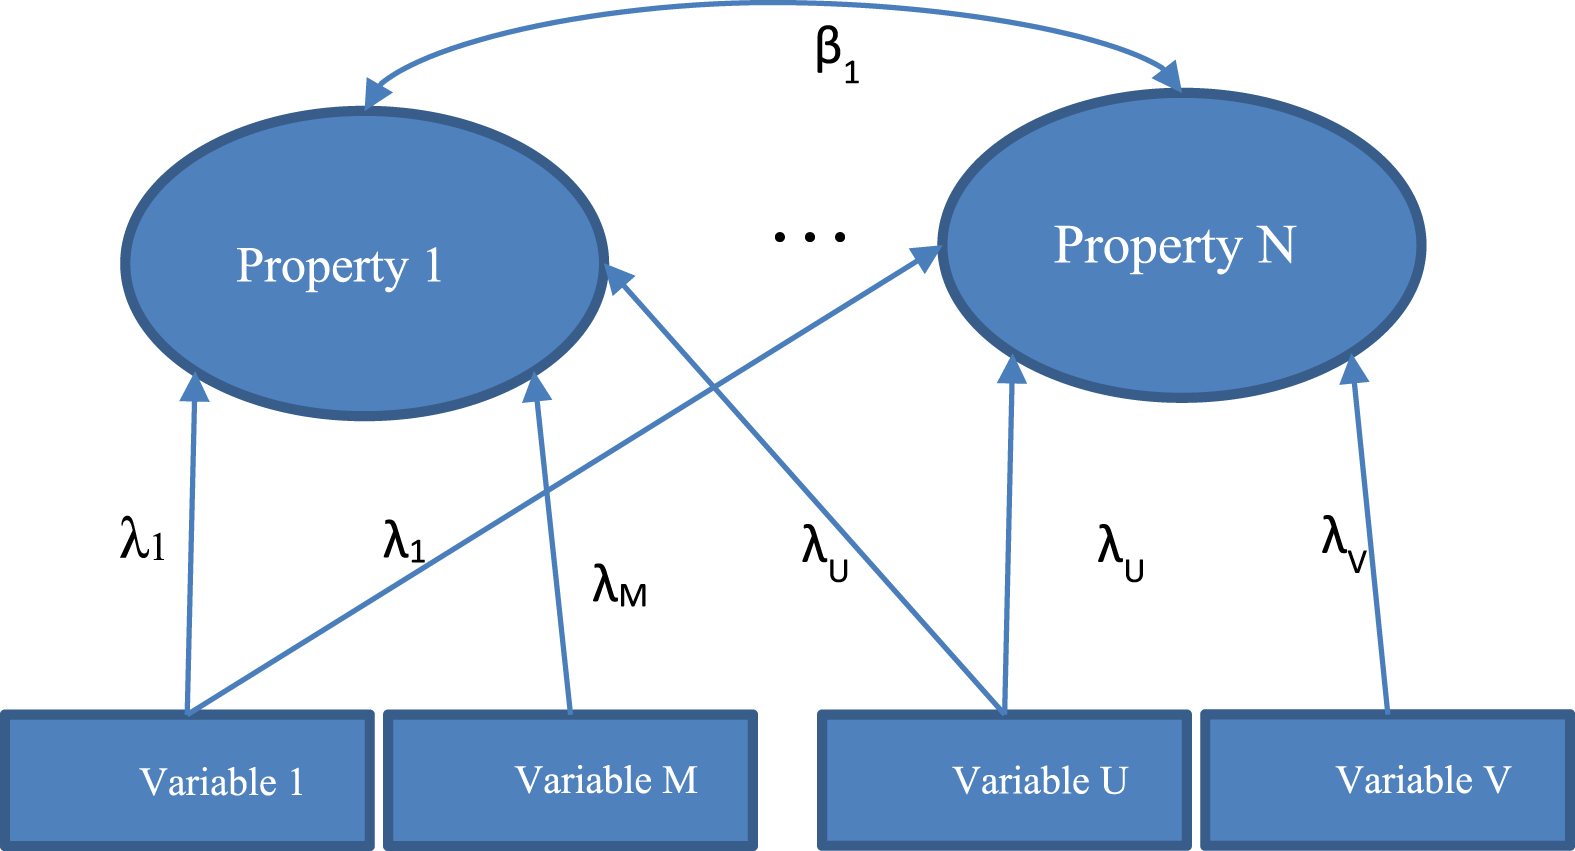
A central aim of the scientific activity is to develop methods to systematically unveil cause-effect relationships between variables of a problem. This is also particularly relevant to the engineering design and manufacturing discipline. The discovery of potential confounding variables has been a major source of investigation (VanderWeele et al., 2013). In statistics, a confounding variable is a variable that influences both the dependent and independent variables. This is the source of a false association between variables. Confounding is a concept related to cause-effect relationships and this should not be mixed with the concepts of correlations or relations. The existence of confounders is explaining why correlation does not imply always a causal relationship. An important variety of approaches have been developed to generate causal ordering, but for this article, the focus of the authors is on methods using graphs and equations directly coming from physics or other scientific disciplines. Those approaches are limiting the scope of the analysis, but they have demonstrated their effectiveness and robustness in several practical engineering contexts and problems. They can become particularly relevant for the future of the engineering design disciplines as presented later in this article. Methods such as Bond graph causal ordering (Gawthrop et al., 1996) or causal ordering of equations via the direct use of Iwasaki and Simon algorithm (Iwasaki et al., 1994) or its extensions (Travé-Massuyès et al., 1997), as well as work done in qualitative physics (Bhashkar et al., 1990), are few examples of causal ordering methods belonging to such a classification. Another approach applied more specifically to the social science context is also interesting for this limited literature review. This is a method searching causes and effects relationships via models using structural equations modelling (SEM) (Pearl, 2000; Spirtes et al., 2000). SEM derives from path analysis which was developed by the biologist S. Wright in the 1920 s and has been often applied to analyse causal relations of non-experimental data using an empirical approach. Path analysis extends regression analysis by analysing simultaneously many endogenous and exogenous variables of a system or problem. Path analysis was combined with factor analysis and latent variables to form the SEM approach to causal analysis. In path analysis, variables can be endogenous or exogenous. Relations between variables can be represented by a one-sided arrow when a relationship exists between variables and a two-sided arrow when a correlation exists between variables as presented in Fig. 2. Different path tracing rules have been defined in the path analysis approach such as the following key rules. It is possible to trace the following type of relations between arrowheads, heads-tails, or tails-heads, but not heads-heads. It is possible to pass through each variable only once in a chain of paths and finally no more than one bi-directional arrow can be included in each path chain. Factor analysis is integrated with latent variables in the SEM approach. Factor analysis is a statistical method used to describe variability among observed, correlated variables with the central idea that the variation of observed variables can also be reflecting the variations of unobserved variables name latent variables. The observed variables are modelled as linear combinations of the potential factors plus “error” terms. Factor analysis may help to deal with data sets where there are large numbers of observed variables that are thought to reflect a smaller number of underlying/latent variables (Harmann, 1976). However, SEM is of confirmatory nature and researchers have first to model the true causal relationships based on other background knowledge before collecting or analysing data (Goldberger, 1972). This task is difficult, especially at the beginning of a design process because of the lack of background initial knowledge. A method presented below and named DACM for Dimensional Analysis Conceptual Modelling (Coatanéa, 2014) aims at building initial causal relationships from the available background knowledge using a framework integrating engineering design concepts such as functions, organs, elementary organs laws, variables’ classification, and dimensional analysis theory.
Fig. 2
Example of SEM diagram.
Consequently, using SEM alone, it is often difficult to unveil the initial causal structure. Additionally, SEM suffers from another limitation because SEM assumes normality of the statistical distribution and only uses the covariance structure and cannot find causal direction between two highly correlated variables because the models produced will be equivalent using the SEM approach. Nevertheless, the SEM method constitutes the conceptual basis of several algorithms that are successful in the discovery of causal structure, especially in complex systems studied by sciences such as economics and sociology. This has also been used in medicine and more specifically in epidemiology.
The fundamental concepts of formalism are summarized in the following manner by Halpern (Halpern, 2000). The construction of structural equations (SE) models requires three key steps. First, the problem being studied is represented by a finite set of variables, corresponding to the features of the problem. This can also be the function of a system to be designed as a solution for a specific design problem. There are two sorts of variables. Endogenous variables are such that their values are determined by other variables within the model, whereas the values of exogenous variables are determined in a way that is independent of other variables of the system. The structural equations describe the functional dependence of the endogenous variables on other variables (endogenous and exogenous) in the model (Kaplan, 2008).
SEM use graphs to represent relations between observed variables and latent variables. Latent variables are not observed. Latent variables can be also residues or errors in the modelling and measurement process. Software specifically developed for SEM modelling are existing to form the model. An SEM model can take the following form presented in Fig. 2. Each of the generic situations presented above must form each time a specific model. The β is the element of a correlation matrix. The λ is the coefficient allowing to model quantitatively the different properties in Fig. 2.
The dimensional homogeneity of models is one property required to support reasoning. A second property is the right causal ordering of the variables. This was discussed above.
The DACM method is merging SEM with Dimensional Analysis (DA) and qualitative physics and reasoning (Mokhtarian et al., 2017). This is an approach of choice for bringing automatic reasoning capabilities to the early design stages. Additionally, discovering contradictions as defined in TRIZ (Savransky, 2000) and especially physical contradictions can be computed automatically using DACM. When physical contradictions are detected, it is becoming possible to apply transformation rules to the causal graphs in DACM implementing in simple terms the separation principles of TRIZ. The graph transformations are separation of nodes, change of node types for expansion or limitation of systems scope, addition, or removal of links between nodes. Causal graphs can find usage in surrogate modelling too. This is the purpose of the next section.
2.3.3Surrogate Modelling and Multidisciplinary optimization (MDO) using knowledge graphs
Surrogate modelling and MDO are two disciplines of great importance for the engineering design process. Usually, they take place during the embodiment and detail design stages and consequently their initial role in early design stages is limited. Nevertheless, with the changes affecting the design process and especially the availability of massive data collection presented in a previous section, it is possible to also consider the early use of surrogate modelling and MDO in a design process.
Traditionally surrogate modelling has been seen as a solution to cope with the fundamental contradiction in requirements imposing on one side to explore the design space to find optimal solutions and on the other side the prohibitive exploration time associated with different high-fidelity simulations. This has been coupled with MDO strategies to gain time by exploring not the entire design space but only some zones of potentially bigger interest. A significant effort has been dedicated in the MDO discipline to the resolution of the fundamental contradiction between exploration of design space and exploitation in terms of global optimization search. Usually, a trade-off is considered between those two criteria, but a potential paradigm shift due to the future introduction of Quantum computing might provide a change since both objectives might become compatible.
Models and simulations, from different fidelity levels, are an important part of product design used to evaluate the product performance for different design parameters. Product performance evaluation through high fidelity model simulations is a shared approach across various engineering fields ranging from automobile, aerospace to civil engineering and medical engineering. Since prototyping is not always a viable approach for product development, due to potentially unacceptable costs, simulations are providing an alternative in form of virtual prototyping. Simulations play an important role in facilitating an efficient design process through sensitivity analysis, multi-domain optimizations and at early design stages, analysis of risk and uncertainty resulting from limited knowledge. However, evaluating product performance using high fidelity models are time-intensive and require costly computer simulations. Thus, the development of surrogate models also known as metamodels can facilitate design space exploration via fast simulations and scenario analyses.
Surrogate or metamodels are approximation models with a measurable level of accuracy that closely model the outputs of a system of interest. The approximation of the model from a high-fidelity physics-based simulation model to a simpler input-output behaviour of the system alleviates the burden of complex computations and enables cheaper simulations. Metamodels are often black-box models as they do not model the inner workings of the system and are developed solely based on data. Several surrogate and metamodeling methods have been developed ranging from traditional approaches such as polynomial regression, kriging, and radial basis functions to name a few, to more data advanced methods such as spatial mapping, artificial neural networks, and Bayesian networks. The development of a surrogate model can be streamlined to the following steps, 1) data sampling through the design of experiments, 2) assembling of the training dataset, 3) surrogate model selection, choosing the right type of model to represent the input-output relationships of the collected dataset, 4) model construction, development of the model using the chosen modelling approach, and 5) active learning through data enrichment, i.e., adding more data to retrain the model to achieve the required accuracy. All surrogate models do not contain all of those five steps. Active learning is in our viewpoint specific to models that can be qualified as machine learning models. This active learning can also take place during steps 1, 2, 3 and 4 described above.
In recent years, metamodels have been used to facilitate fast simulations for various fields and applications. Cai et al., 2021 studied three ML-based surrogate modelling approaches for parameter estimation of left ventricular myocardium from clinical data. The authors investigated the use of K-nearest neighbour (KNN), XGBoost, and multi-layer perceptron (MLP) approaches to perform modelling. Their research showed that the three ML approaches were able to learn the relationships between the properties of interest and found that parameter estimation could be performed in a matter of minutes. They found that XGBoost and MLP approaches performed better with lesser uncertainties than KNN. The authors concluded that ML-based surrogate modelling was able to predict left ventricular diagnostic dynamics and estimate passive parameters with an acceptable level of accuracy with future work focusing on emulating cardiac pump function in a multi-physics and multi-scale framework. Zhang et al., 2017 evaluated the effectiveness of advanced hybrid surrogate modelling with different sampling techniques and sizes for four different complex engineering systems namely, wind farm power generation, product platform planning, three-pane window eat transfer, and onshore wind farm cost estimation. They found that the sampling techniques had a higher impact on the accuracy of the surrogate modelling approach. Increasing sample size alone did not present a higher level of accuracy rather choosing the right sampling technique alongside increasing sampling size was better suited for improving model accuracy. The authors concluded that adaptive hybrid surrogate modelling provided good accuracy in representing complex system behaviour and that choosing the right sampling method and the sample size was essential in improving the accuracy of the models. Kuya et al., 2011 presented a multi-fidelity surrogate modelling approach combining experimental and computational aerodynamics datasets. A multi-fidelity cokriging regression model was used for the study. The study showed that low fidelity computation data can contribute to improving the surrogate model with limited high-fidelity data from experiments. The authors also examined the impact of characteristics of the sampling design for low fidelity data on the final surrogate models. They found that the low fidelity data provided a priori reduce the need for a large quantity of high-fidelity data.
Metamodeling has been increasingly used as a solution to the long-standing problem of developing fast methods to estimate the properties of a system from data. However, despite their vast advantages, metamodels can be limited by their accuracy, inability to generalize over a large design data space, and inability to accommodate data deviating from the modelled limits. The black-box nature of metamodels makes it difficult to generalize a phenomenon observed in the model, and high-fidelity data from costly simulations are required to enrich the training dataset to facilitate active learning and to improve model accuracy. Thus, it is advantageous to focus on the development of a modelling approach that can combine knowledge from different forms to facilitate a grey box modelling approach in the form of oriented knowledge graphs. The knowledge graphs integrate knowledge from functional and non-functional requirements of the design combined with collected data to develop an accurate model of the system. The use of knowledge graphs in future design tools is discussed next.
3Vision of future design support systems
As developed in previous chapters, engineering design is confronted with the growing complexity of systems and system of systems but also with the extension of its scope but simultaneously the cognitive aptitudes of human designers remain stable. How do we solve this paradox where constant cognitive capabilities should be used to solve more complex systemic problems?
A simple answer will be by providing better support tools and in TRIZ words, by separating the tasks allocated to humans and the tasks allocated to machines. Some answers can be found in literature, for example, improved support tools can be developed such as approaches favouring system-oriented thinking (Mobus et al., 2015), or a more radical use and operationalization of analytical concepts coming from different engineering traditions such as the concepts of ideality or contradictions (Jordan, 1967) (Dunham et al., 2011) (Savransky, 2000). Those concepts are useful at the conceptual design level to generate innovative solutions and to overcome solutions’ limitations.
This should be combined with the creation of efficient design companions in form of a new type of intuitive computer tools, automating the processing of increasing mundane tasks and unmanageable expansion of design problems scope and complexity. Those tools should be capable of learning from a few examples, which is like how humans learn. They should support designers efficiently by providing insights in the form of prescriptions or analyses, using cognition modes that are human-friendly. As an example, those methods should be able to reason using qualitative reasoning and provides analyses in form of cause-effect relationships. Such methods are implying the development of novel machine learning methods and approaches inspired by qualitative reasoning methods (Bhashkar et al., 1990) using very small data samples potentially containing imprecisions and uncertainties. In an ideal context, those future tools and methods should also interact using different senses and communication modes. In this paper, we only describe in more detail a possible user interface representation integrating graphs and causal relationships as the key communication means. A significant effort will nevertheless be required to develop those human-machine interfaces. This is not part of the scope of this article, but this is a topic of great importance, especially the visualisation aspects that require extensive efforts.
The focus is given in this article to the early phases with a special emphasis on early modelling, early simulation, early detection of solutions weaknesses and early removal of solution weaknesses. The central goal is to favour fast scanning and discovery of weak points in design requirements and design space as well as design architectures. The next section is exemplifying two types of semi automatized prototypes design support systems, corresponding to that vision.
3.1Exemplification
The first software support tool presented in this section is a tool exemplified in the work of Mokammel et al., 2018. Different screenshots coming from the article published in 2018 are reproduced in this section. The software tool aims to achieve the following tasks. First, automatically extracting requirements from different sources of texts. The texts can be standards, descriptions of needs, initial specifications and descriptions of the capabilities expected from the system.
The second, task is the automatic analysis of the quality of the extracted requirements following a set of different quality metrics implemented in the tool. The final objective of the software is to automatically detect connections and interactions between requirements. The interactions can be presented in form of contradictions between requirements. The software can detect three of the most common types of contradictions existing between requirements. They are the antonym, negation, and numeric contradictions. Three more challenging types of contradictions are requiring the use of more advanced NLP methods. They are the structure, lexical and factive contradictions (Mokammel et al., 2018). NLP methods used in that software to detect requirements links and contradictions can reach similar level of performance than machine learning methods such as transformers integrating the mechanism of self-attention (Vaswani et al., 2017). The major advantage of NLP methods developed in that research work is that they do not require the use of pre-training datasets.
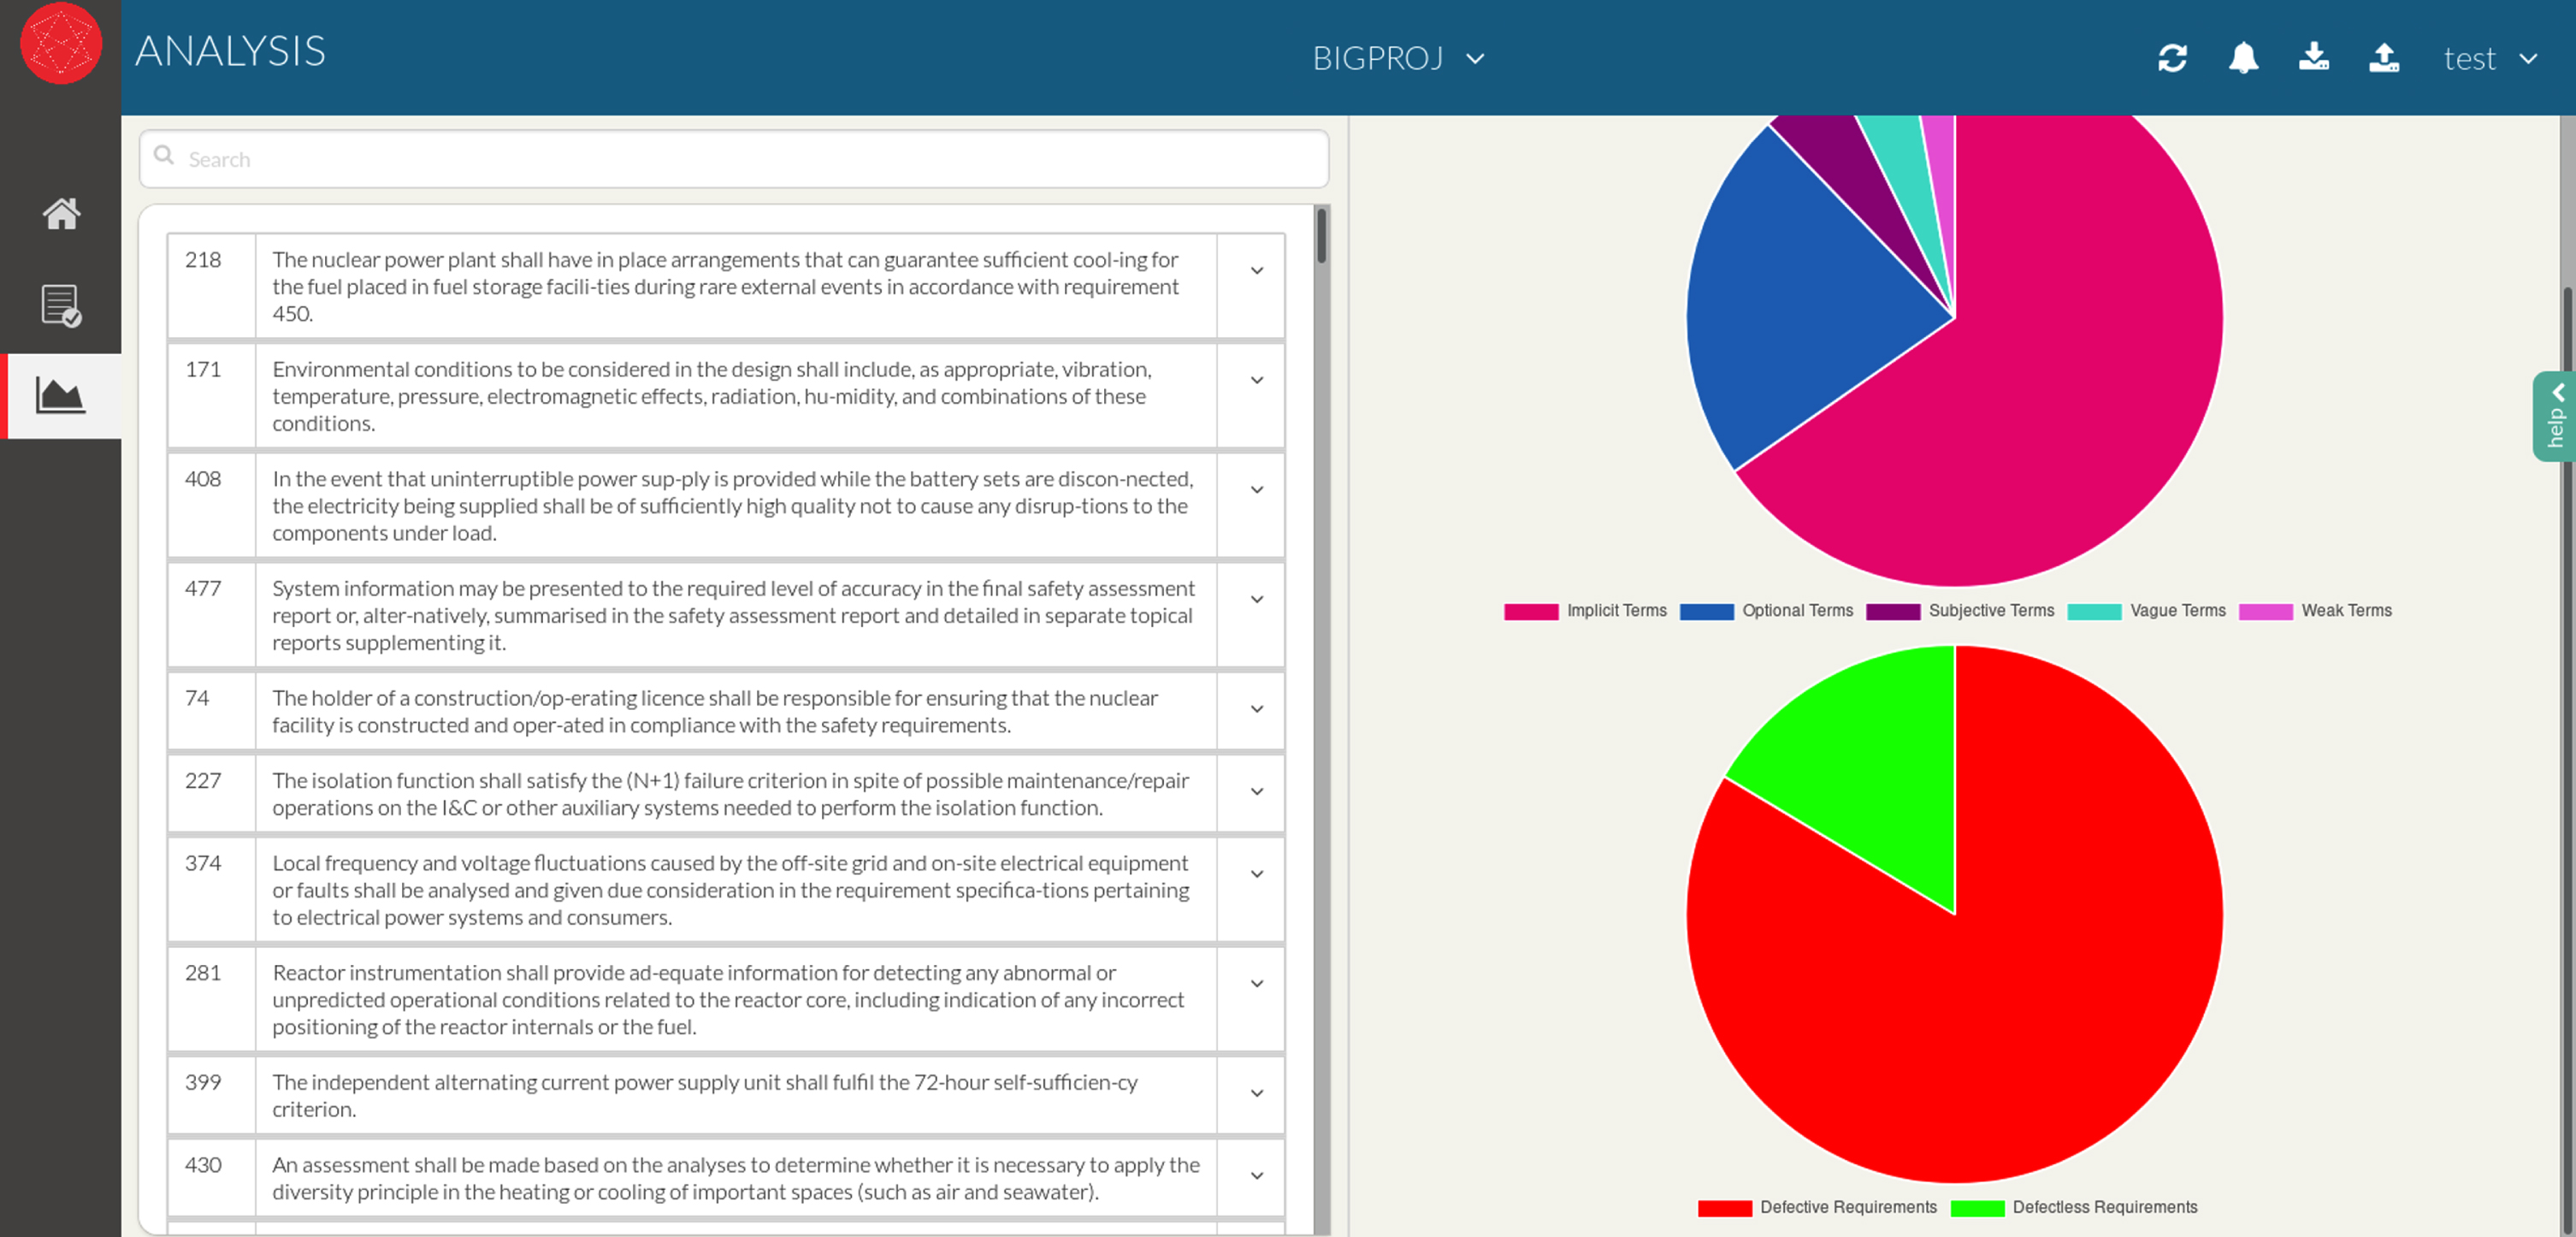
The Figures below present, by following the order of the requirement extraction and analysis, the different steps present in this new type of tool. Figure 3 shows on the left the initial pdf text. On the right part of the figure, the parced requirements are presented. Figure 4 presents the individual requirements with the different defects detected for each of them on the left and on the right a summary of the defects per categories.
Fig. 3
Initial source document with highlighted extracted document on the left and list of extracted requirements on the right with the text extracted from the source document highlighted. (Mokammel et al., 2018).

Fig. 4
List of individual requirements with defects on the left and, on the right, a summary in form of pie chart of the types of defects detected on requirements. (Mokammel et al., 2018).
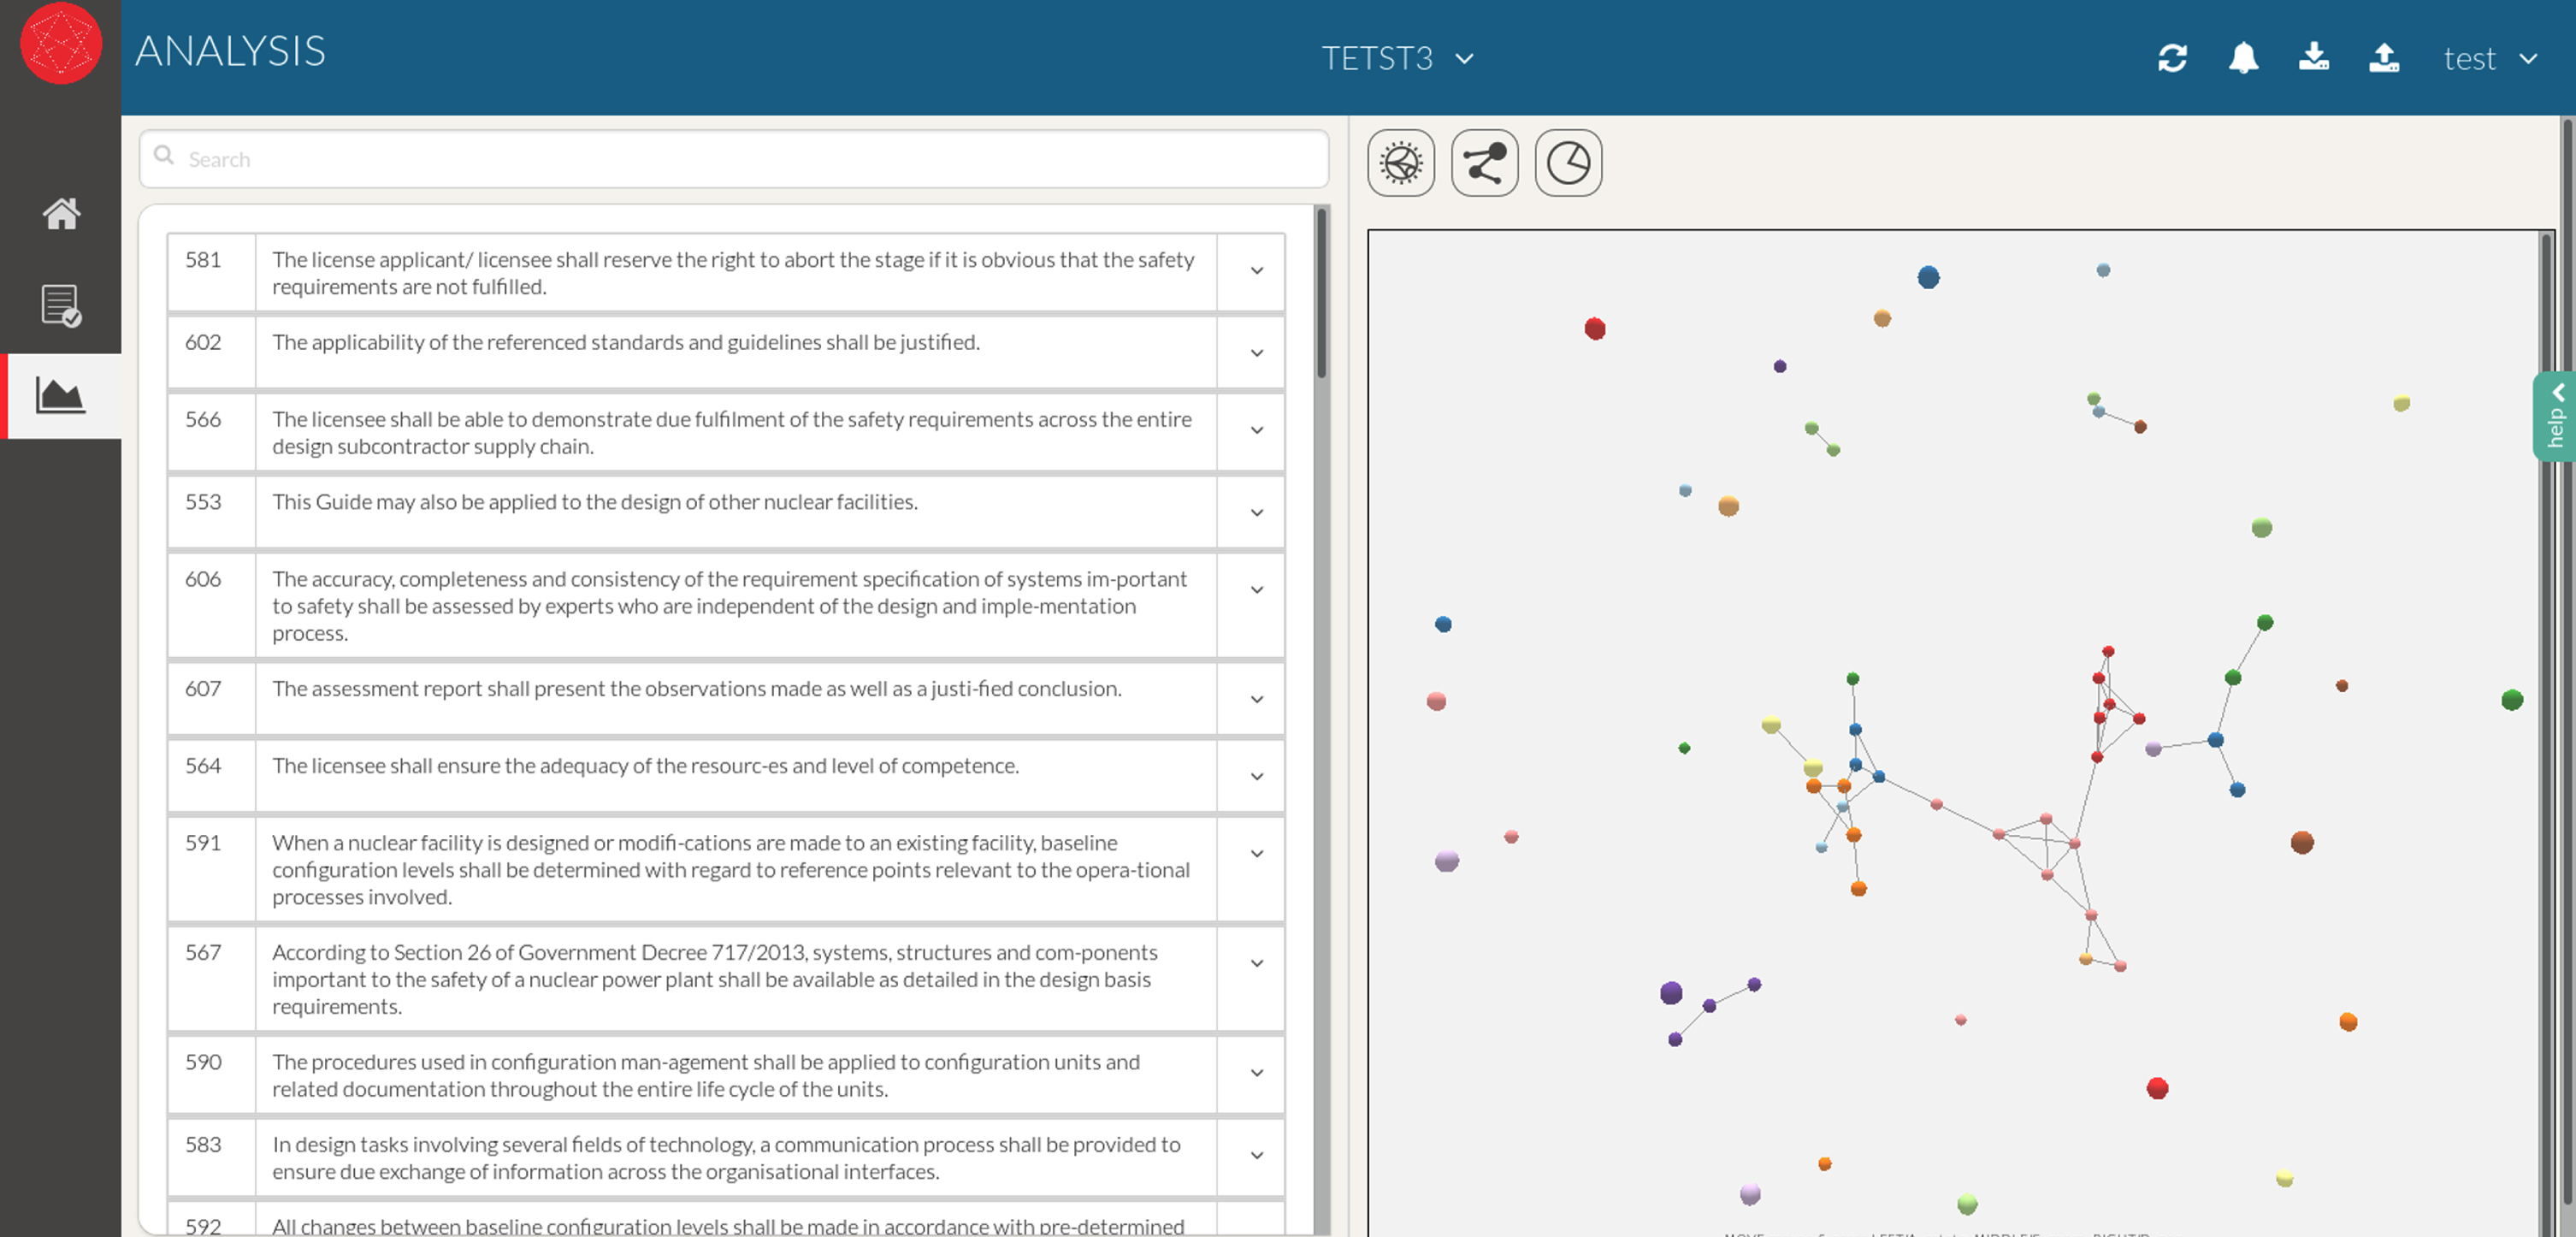
The requirements graphs presented above in Figs. 5 and 6 are a form of a knowledge graph. In that case, they inform about the clusters found, the links between clusters, and the links between individual requirements. The approach used to detect connections between requirements in Figs. 5 and 6 is presented in the work of Mokammel et al. (Mokammel et al., 2018).
Fig. 5
On the left, a list of requirements belonging to a specific cluster. On the right a dendrogram presenting the different clusters (with a color per cluster and list of requirements IDs per cluster of requirements. The relationships between clusters in presented in blue connections in the middle of the dendrogram. (Mokammel et al., 2018).
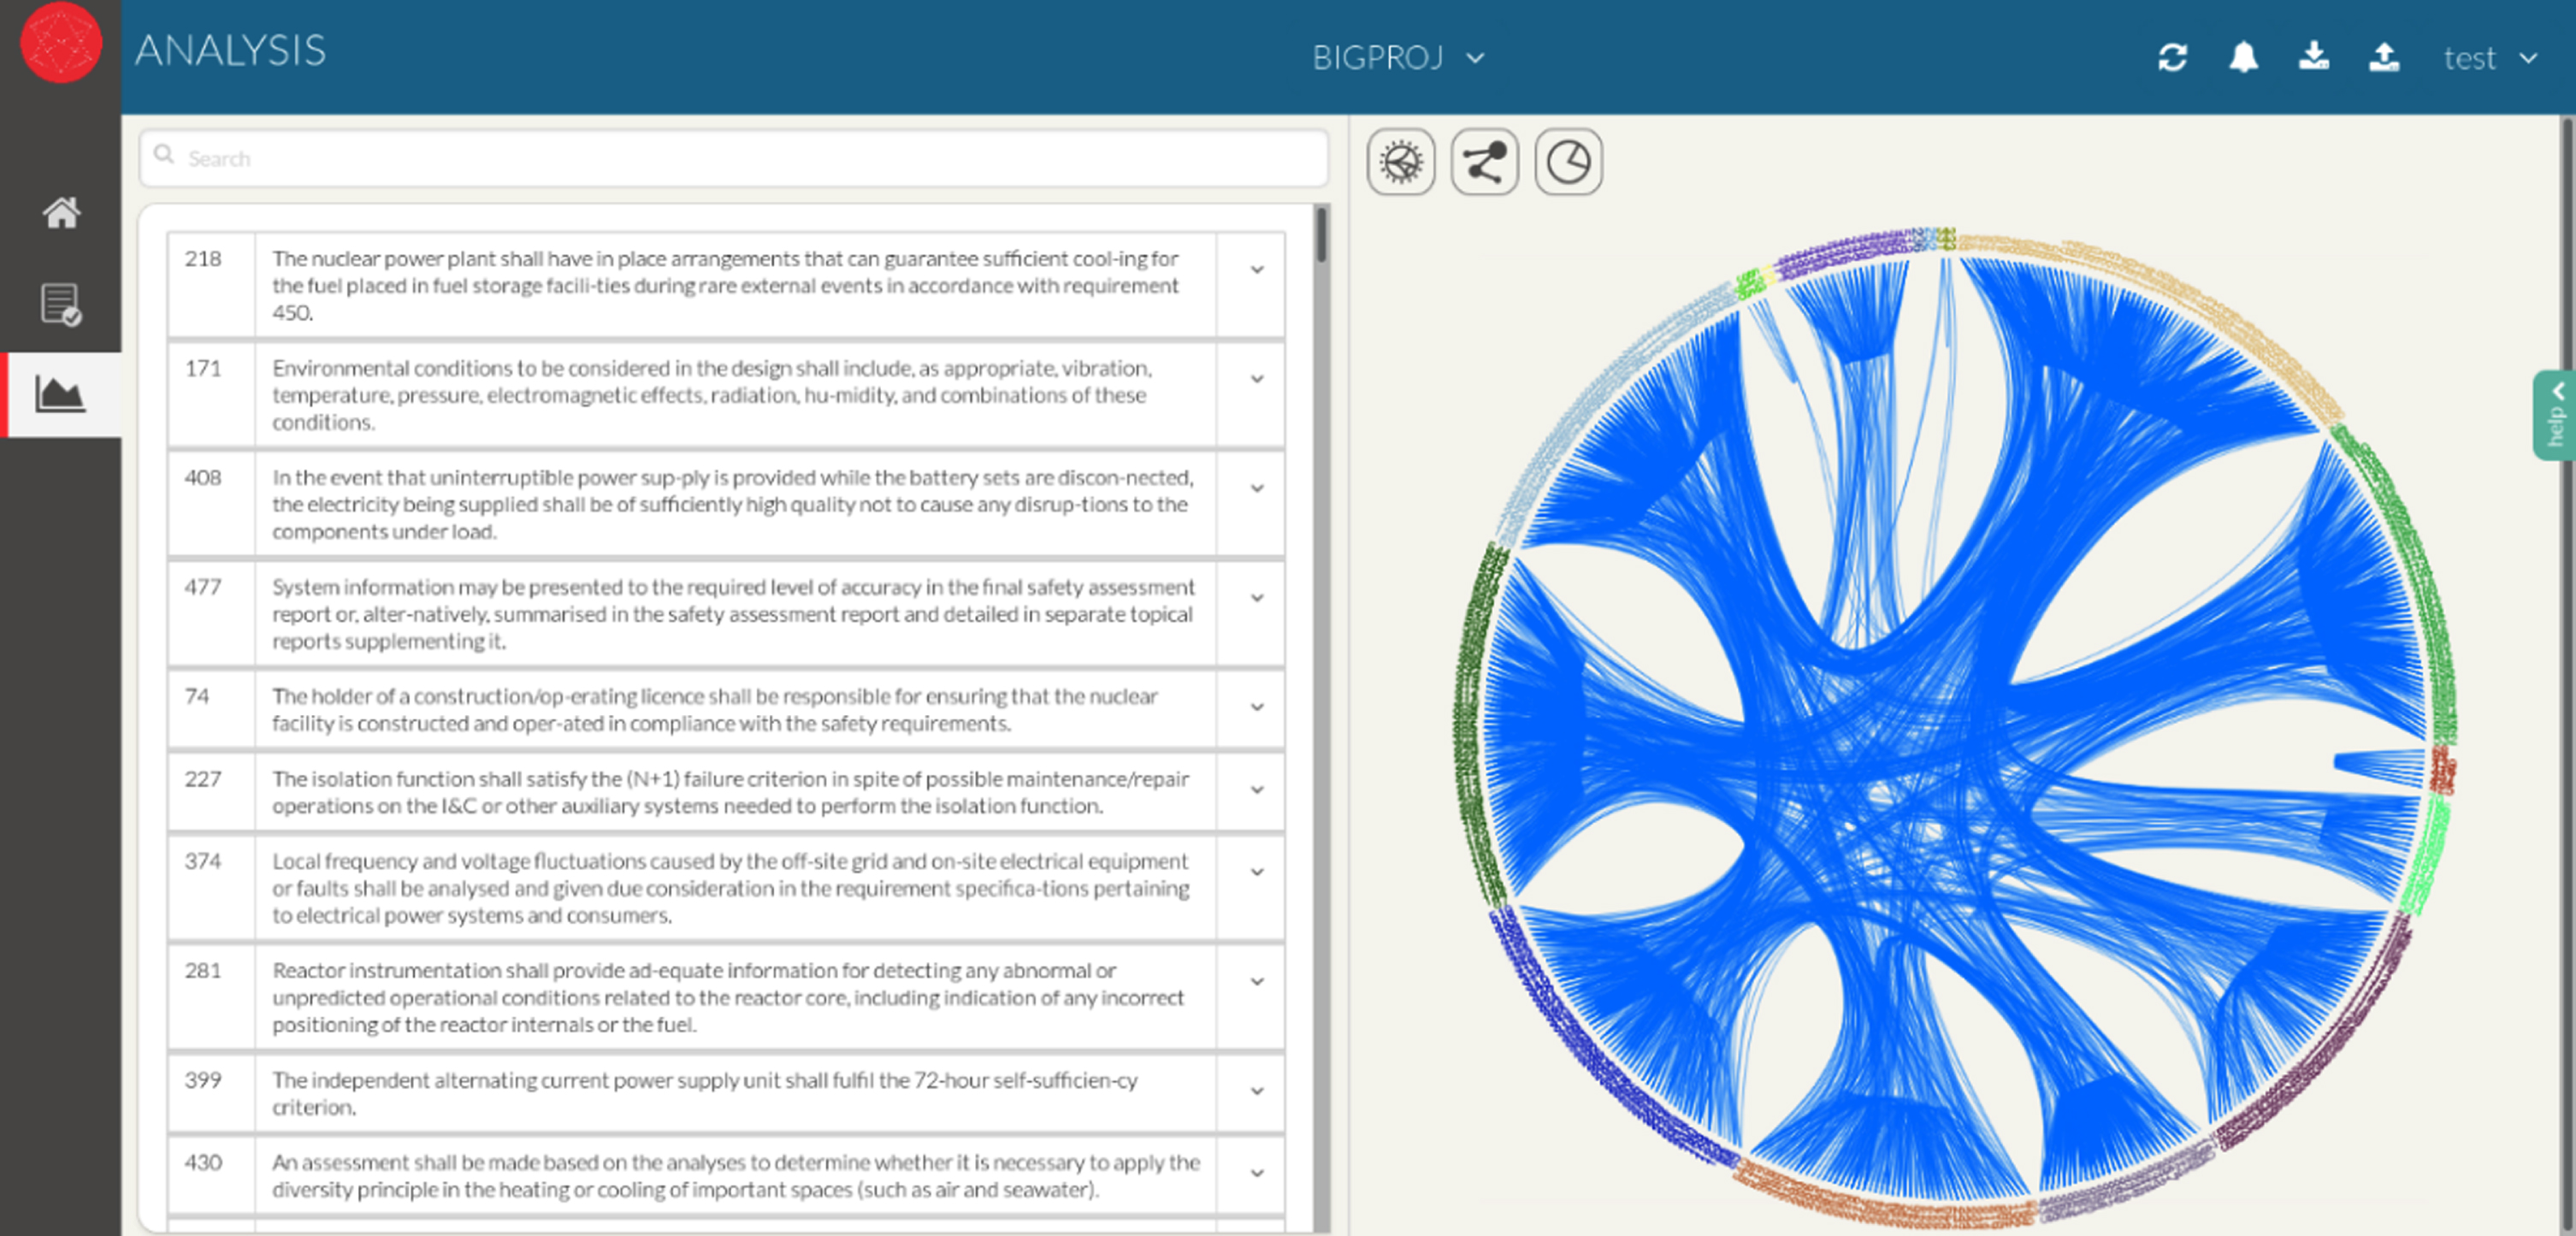
Fig. 6
On the left, a list of individual requirements associated with each other’s and, on the right, a 3D visualization of links existing between requirements. The nodes of different colours represent different individual requirements IDs belonging to different clusters. (Mokammel et al., 2018).
Another benefit of knowledge graphs is to support reasoning as well as more classical modelling and simulations. The second exemplification, presented below, shows a tool aiming at generating causal graphs at a very early stage of development for reasoning purposes and detection of physical contradictions (Savransky, 2000). The graphs generated by the tool can be used also for systems’ dynamic modelling and other applications.
The figures below are presenting a tool under development and follow three key routes for the modelling starting point. This is summarized in Fig. 7. Figure 7 presents also different usages of the causal graphs.
Fig. 7
Presentation of the different modelling and usages routes of the prototype modelling, simulation and analytical tool for early design. Three modelling starting points are presented on the left, modelling from a fonctional model, from datasets or from equations. This is leading to a common intermediate result in form of a causal graph in the middle of the figure. This causal graph can be used for contradiction detections in a qualitative manner, for Bayesian network simulation, or for quantitative simulation like in Systems dynamic.
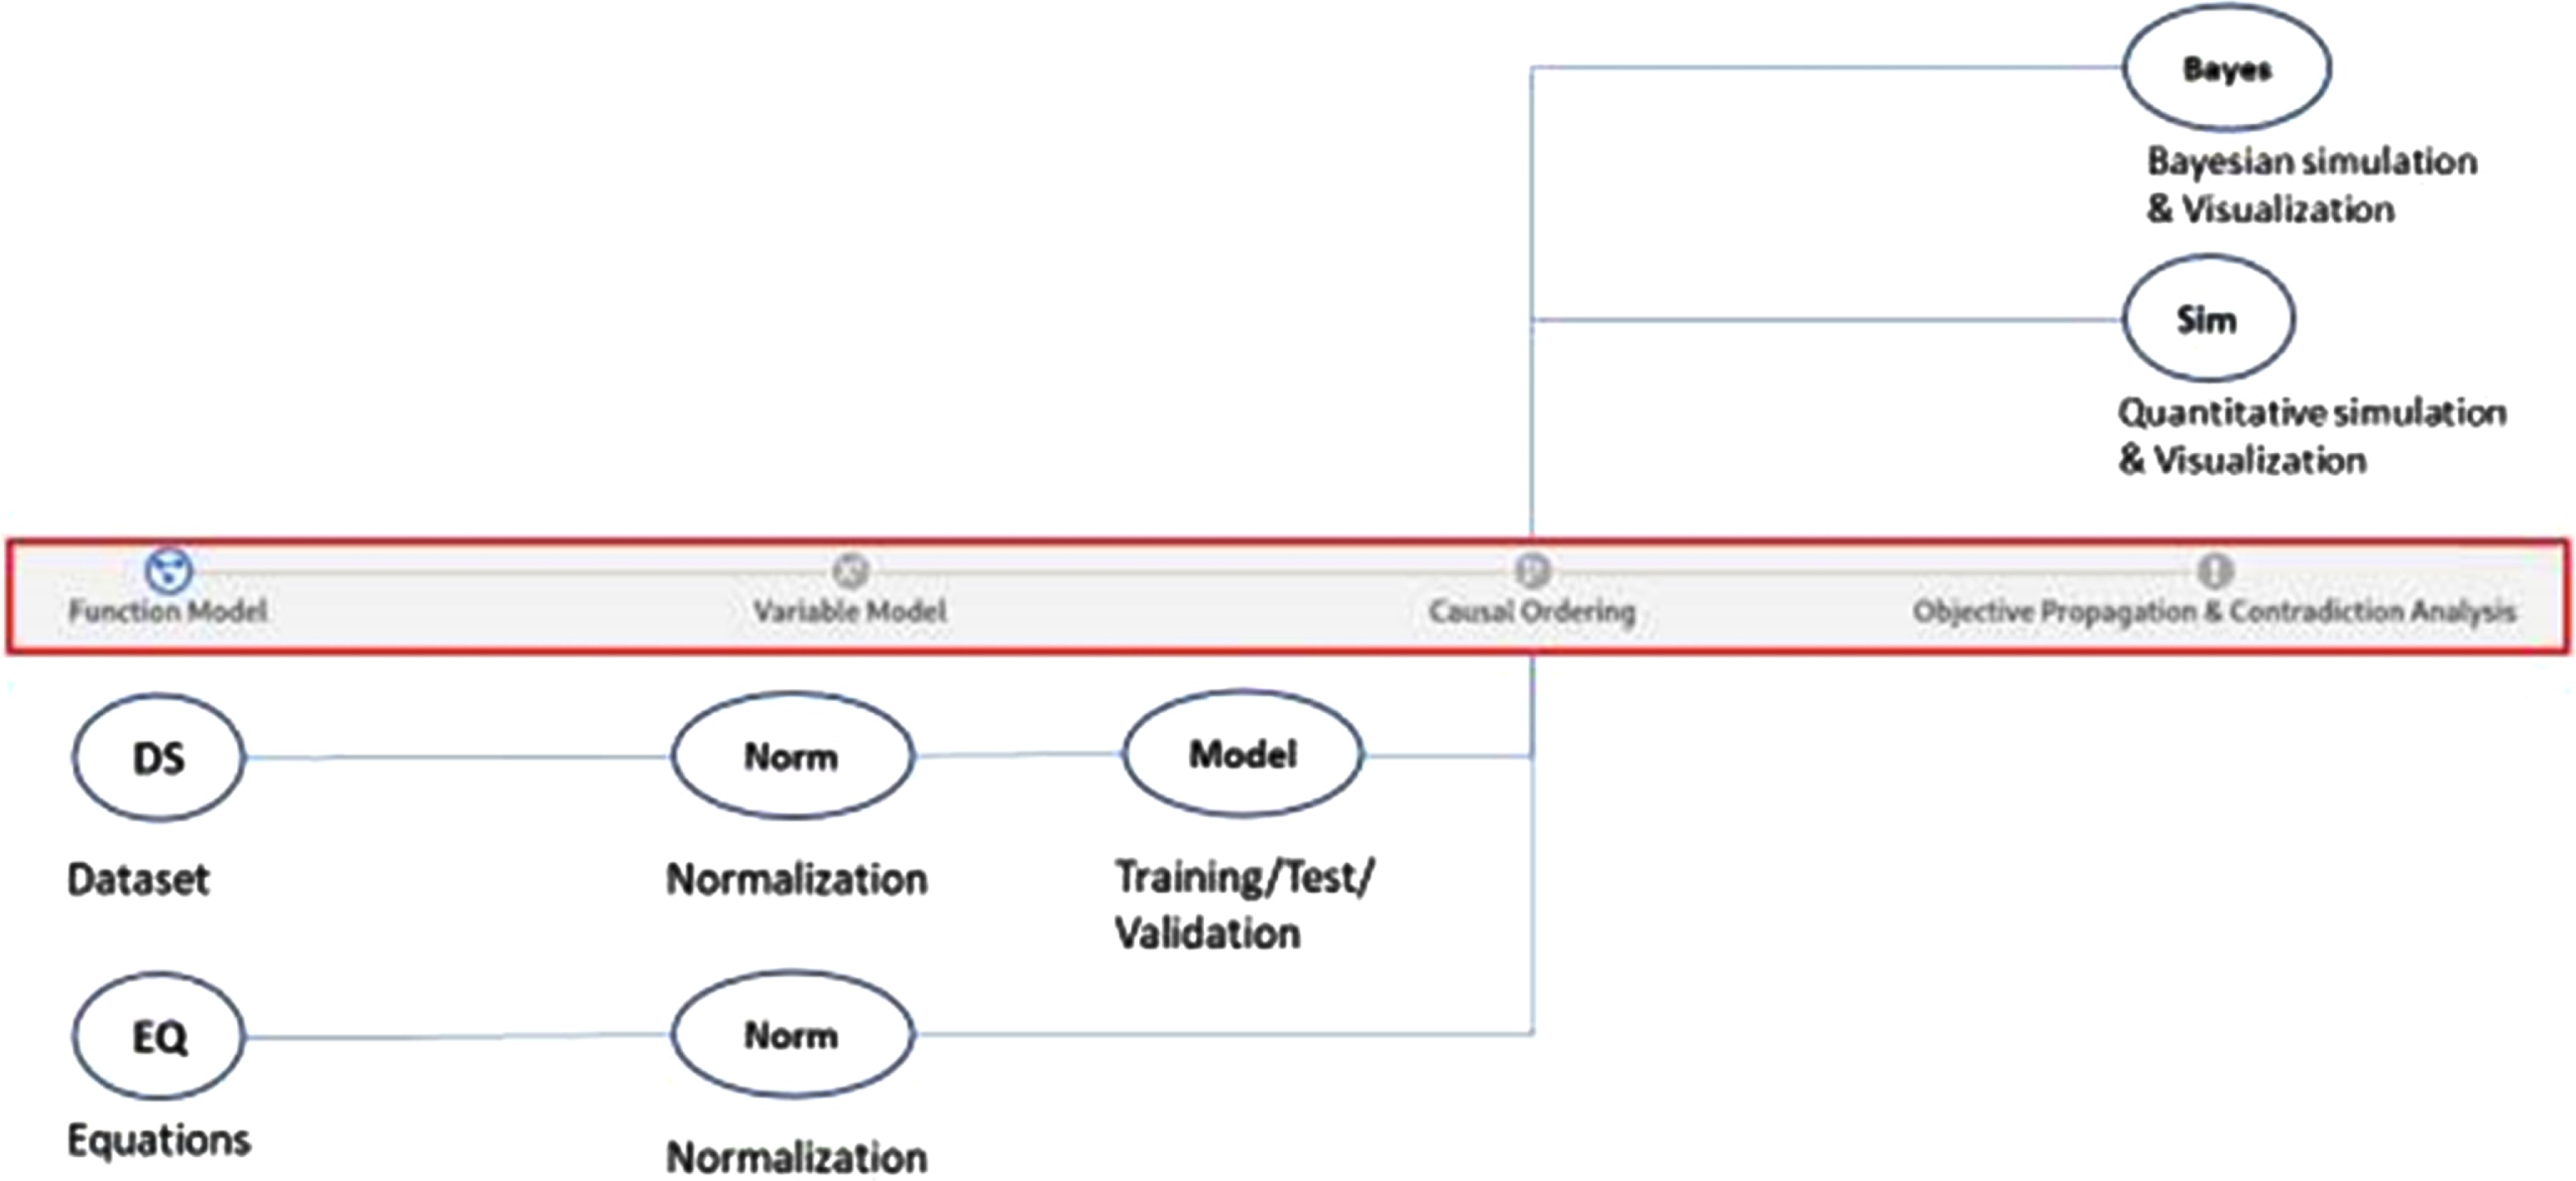
Fig. 8
Functional/organ modelling phase presenting one of the routes for generating a causal graph.
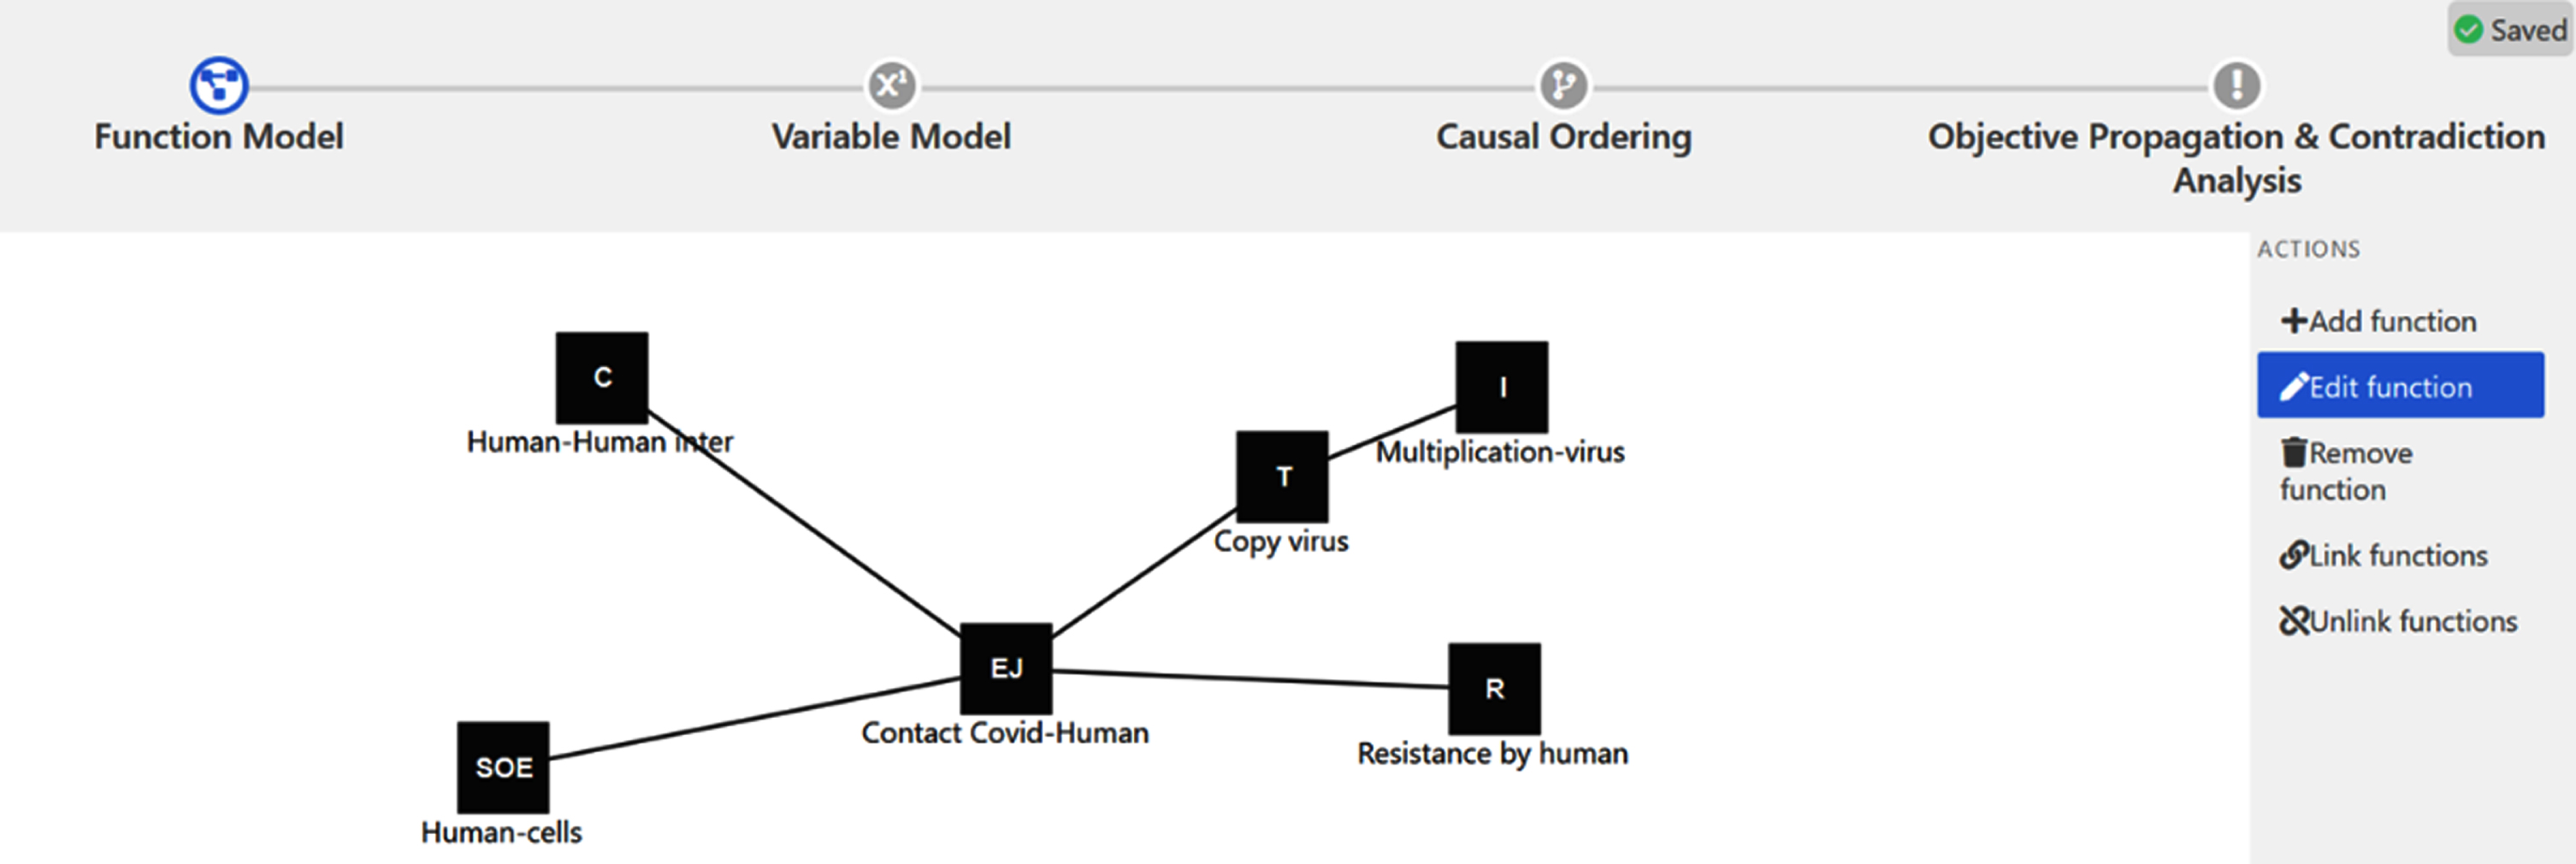
From a modelling starting point, a causal model can be generated first, using a functional representation. This route is already implemented and tested and summarized in Figs. 7 and 8. Second, it is envisioned to produce, a model generated directly from collected data and following the data-enabled engineering paradigm change presented above in the article. The third route envisioned uses as a starting point a set of available equations.
In this vision, a common intermediate product is always a causal graph presented in Fig. 9. From this intermediate result, three different possible applications and usages are presented in Fig. 7. Firstly, the detection of physical contradictions when the graph is associated with qualitative objectives. This route is already implemented, tested, and validated. Second, the use of the causal graph model for systems dynamics analysis associating quantitative data to the causal model. Third, the use of the causal graph as a precursor for Bayesian networks and the dynamic simulation and design space exploration using a Bayesian approach. Both of those last routes have been tested and validated. The software implementation is still an ongoing effort.
Fig. 9
Causal graph resulting from the functional modelling route. This is theintermediate result of the modelling process.
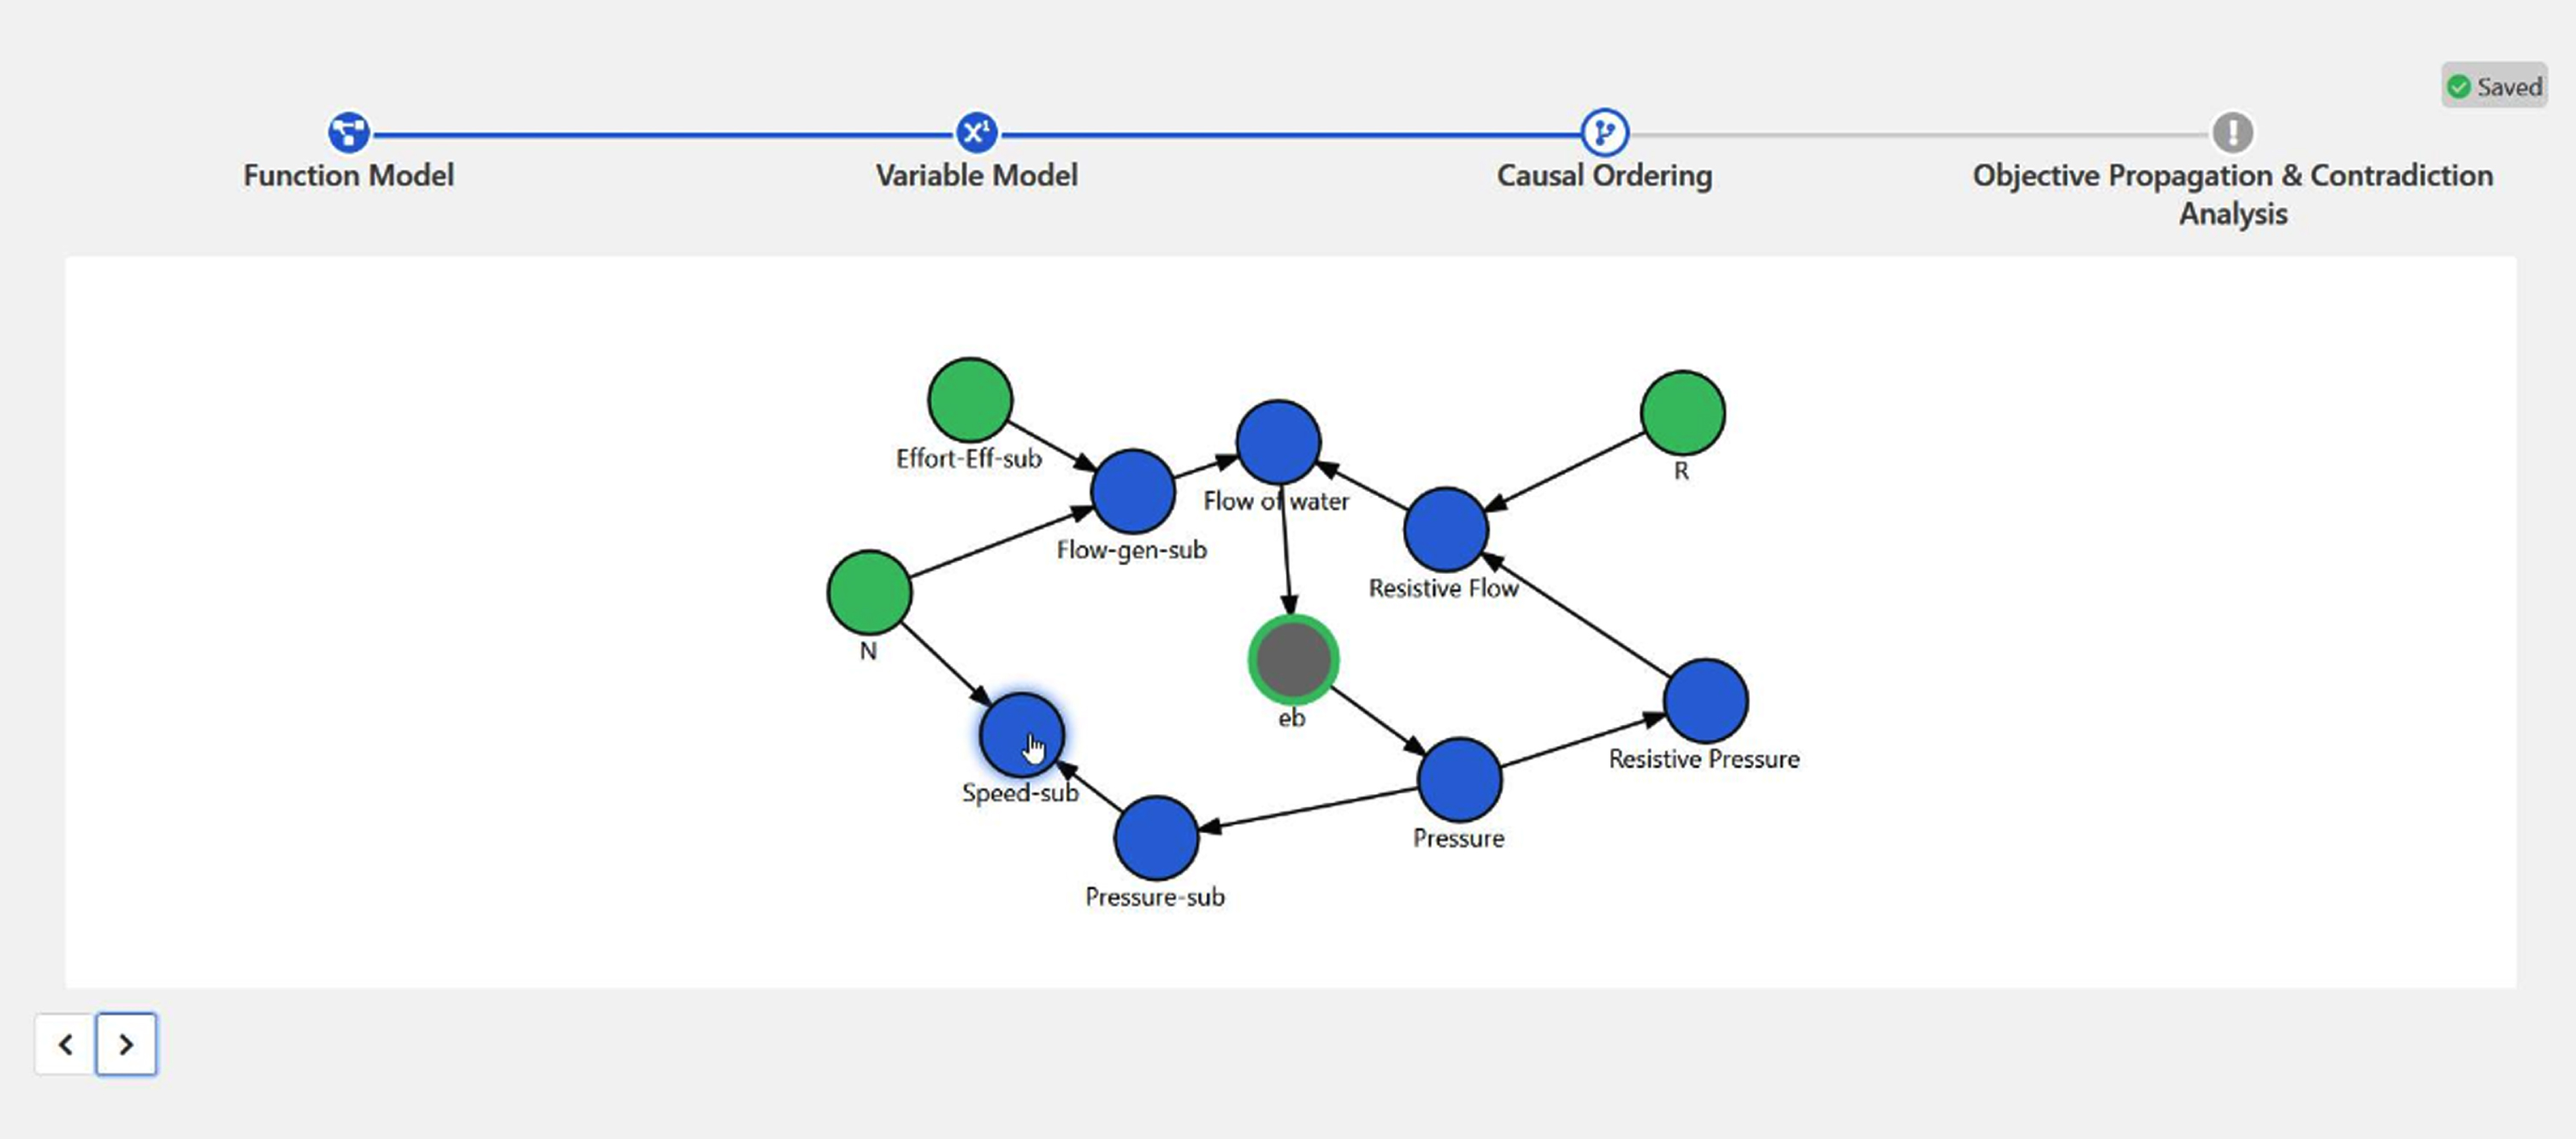
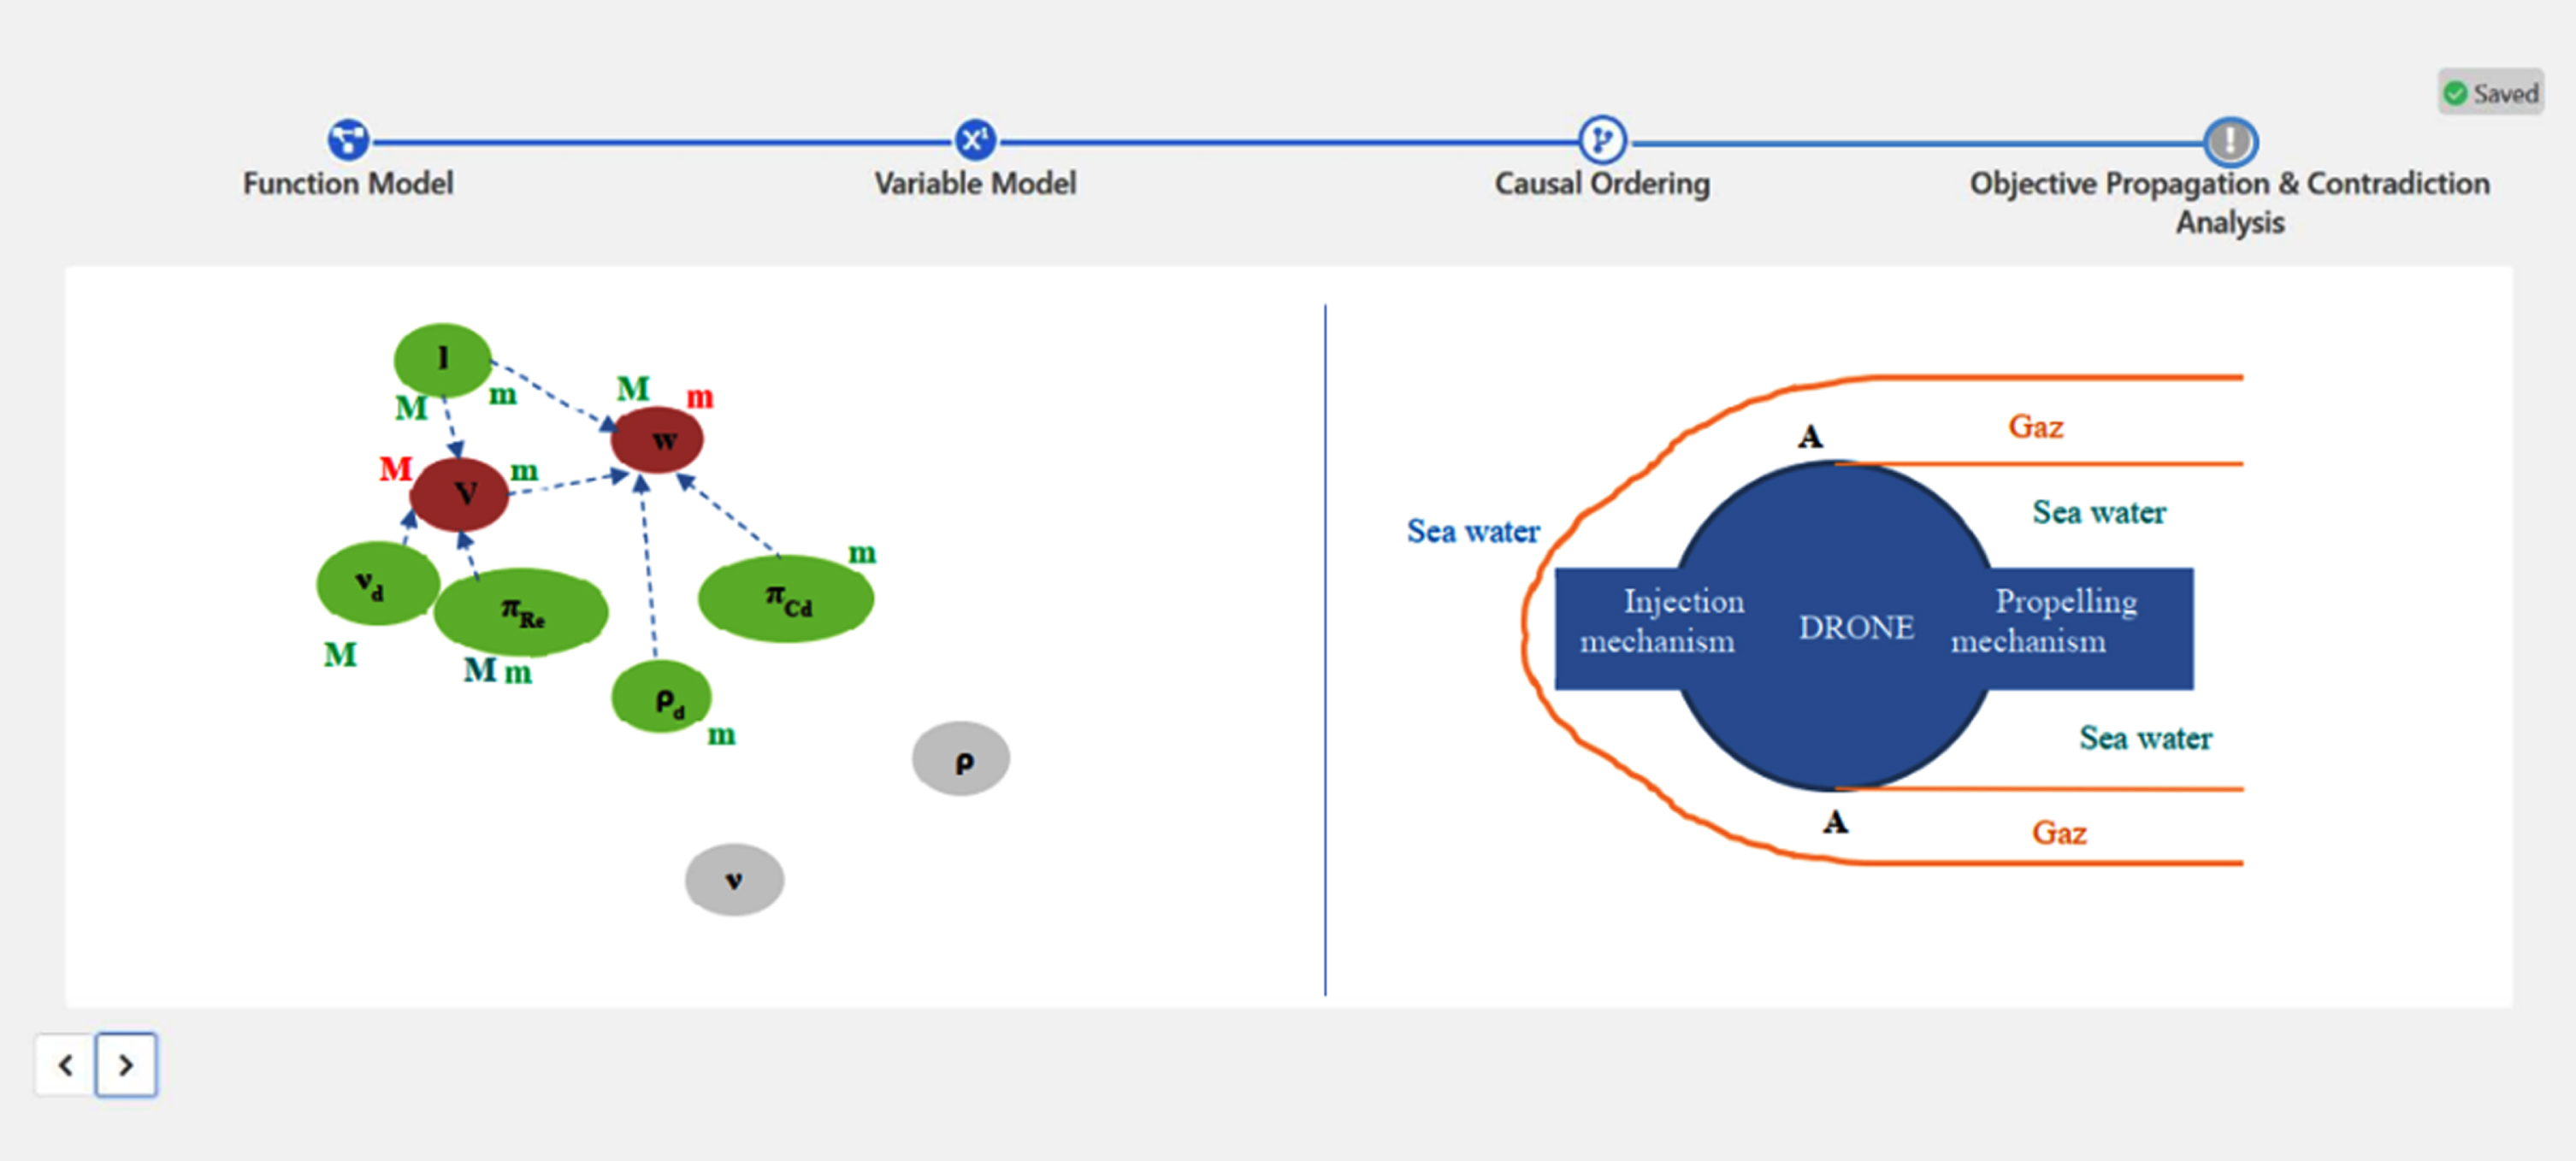
Figure 10 visualize on the left detected contradictions in form of capital M and small m associated with variables. The graph in the left part can be modified to reduce or remove the contradictions. In the context of the example presented, the causal graph of an underwater drone was generated of the left part of the Fig. 10. Qualitative objectives in form of red m and M were associated with two key design objectives. First, maximizing (capital red M) the speed V of the drone and also minimizing (small red m) the drag force w generated by the drone. Using backward and frontward propagations of those objectives in the graph, it was found two primary physical contradictions (Savransky, 2000) on V and w. To reduce those contradictions, the originally exogenous variables ρ and ν (i.e., grey bubbles in left part of Fig. 10) representing the density and viscosity of sea water have been modified to add two controllable independent design variables ρd and νd ((i.e., green bubbles in left part of Fig. 10). The TRIZ principle of physical contradiction is employed in this modelling method. The resolution of the contradiction presented in Fig. 10, expand the initial borders of the drone by incorporating a gas under pressure released in front of the drone. The effect is to have a drone moving in a bubble of gas instead than being in direct contact with water. On the right side of the figure, a solution resulting from the graph evolution on the left side is described. The solution is using the separation principle from TRIZ between the properties of viscosity and density of the sea water and the drone itself. This is done via a new fluid (i.e., a gas) carried in the underwater drone. In the software development, a graph can be changed automatically to apply different invention principles, used to solve or reduce contradictions, but the transformation of the graph into an initial design solution (i.e., right part of Fig. 10) is requiring a human intervention to generate the concept of solution emerging from the causal graph evolutionary process.
Fig. 10
Example of an underwater drone modeling with two key design objectives, maximizing the speed V and minimizing the drag w. Left: Objective propagation, contradictions detection and contradiction reduction. The contradictions detected are the physical contradictions from TRIZ (Savransky, 2000). The causal graph is the result of an evolution of the initial causal graph. Right: Translation of the causal graph evolution into a concept of solution for the underwater drone.
This section briefly exemplified tools already existing to support early design activities. In that case, the common denominator is the use of oriented graphs as a design tool. This is not the only approach that can be considered to support design. This article aimed at presenting some fundamental challenges and some possible solutions supporting the evolution of the design discipline.
4Conclusion
The article has analysed fundamental changes affecting the design and manufacturing activities. The most important envisioned changes are the scarcity of energy and primary materials, the ubiquitous integration of electronic components and computing science in systems, the pervasive production of data by systems, the emphasis given to CO2 free energy production, recycling and reuse, and the transformation of the consumption model from product ownership to product as a service. Those changes are increasing the number, the couplings and ultimately the complexity of requirements and the entire complexity of the design process. Those socio-economic and technological transformations have been analysed and effects on the phases and the nature of the design process have also been described. More specifically, this position paper aimed at analysing the impact and modifications induced by those transformations on the designers’ activities and see how the design activity can be supported to cope with those changes.
Specifically, the changes are transforming the design process from a classical forward design process to a looped design process integrating classical forward design with massive data-driven engineering using data generated during different phases of design and manufacturing as well as the usage phase. The article claimed that early design automation is becoming a necessity to cope with the unmanageable cognitive load generated by this cascade of changes. The article also presented an overview of transformations needed in the design process and design practices. The article provided a prospective attempt to imagine what can be the services provided by a new generation of design tools. Some tools exploiting graphs, existing at a prototype stage or under development have been unveiled and briefly presented to the readers.
This article is a modest attempt to highlight the effects of changes induced by technological developments and socio-economic trends on the design and manufacturing activity.
5Author Biographies
Dr Eric Coatanéa received his BS degree in mechanical engineering in 1990 from the University of West Brittany, France, his MSc in mechanical engineering from INSA Toulouse, France in 1993, and his teaching certification from Ecole Normale Supérieure of Cachan, France in 1994. Professor Coatanéa worked for 11 years as a teacher of manufacturing engineering at the University of West Brittany while in parallel being very active in track and field. He embarked on joint doctoral studies in 2002 and received his joint PhD degree in mechanical engineering from Helsinki University of Technology, Finland (nowadays Aalto University) and the University of West Brittany, France in 2005. Dr Coatanéa is currently heading the Additive Manufacturing systems research group at Tampere University. His research interests include engineering design theories, systems engineering, and manufacturing methodologies.
Hari Nagarajan is a doctoral student at Tampere University. He received his BS degree in Production Engineering in 2014 from Anna University, Chennai, India and his MS degree in Industrial Engineering from Oregon State University, USA in 2017. His research interests include advanced joining and forming processes, engineering design and sustainable manufacturing.
Suraj Panicker is a doctoral student at Tampere University. He has received his BS in Mechanical Engineering in 2014 from University of Mumbai, India. He went on to complete MS in Industrial Engineering from Oregon State University, USA in 2018. Research areas of interest include metal additive manufacturing, engineering design, and sustainable manufacturing.
Dr Hossein Mokhtarian is a researcher and lecturer at Tampere University. Hossein has received his master’s degree in mechanical engineering from University of Joseph Fourier in 2015. He has done his Ph.D. studies in a joint-Ph.D. program among Tampere University in Finland and Université Grenoble Alpes in France. He has received his Ph.D. degree in Industrial engineering from Université Grenoble Alpes and in mechanical engineering from Tampere University in 2019. Hossein is passionate about teaching, and he has pedagogical background. His research interests include the intersection of mechanical design and manufacturing technologies.
References
1 | Berman, J. J. (2013). Principles of big data: preparing, sharing, and analyzing complex information. Newnes.. |
2 | Bhashkar R. , Nigam A. Qualitative physics using dimensional analysis, Artificial Intelligence ((1990) ) 45: , 73–111. |
3 | Brunton, S. , Kutz, J. (2019). Data-Driven Science and Engineering: Machine Learning, Dynamical Systems, and Control. Cambridge: Cambridge University Press. doi:10.1017/9781108380690. |
4 | Cai, L. , Ren, L. , Wang, Y. , Xie, W. , Zhu, G. , Gao, H. ((2021) ) Surrogate models based on machine learning methods for parameter estimation of the left ventricular myocardium, Royal Society Open Science 8: (1), 201121. |
5 | Chaudhuri, S. , Dayal, U. , Narasayya, V. ((2011) ) An overview of business intelligence technology, Communications of the ACM 54: (8), 88–98. |
6 | Coatanéa E. (2014), Dimensional Analysis Conceptual Modelling (DACM): a comprehensive framework for specifying, validating, and analysing system models from aModel-based System Engineering perspective, US Department of Defence, NAWCTSD office, Contract Reference: SOW 4.5, 4.5.1, 2015 (Confidential). |
7 | Christophe, F. , Mokammel, F. , Coatanéa, E. , Nguyen, A. , Bakhouya, M. , Bernard, A. ((2014) ) A methodology supportingsyntactic, lexical and semantic clarification of requirements insystems engineering., Int J Prod Dev 19: (4), 173. http://www.inderscienceonline.com/doi/abs/10.1504/IJPD.2014.062973. |
8 | De Marneffe M. , Rafferty, A. , Manning, C. ((2008) ) Finding contradictions in the text, ACL 8: , 10391047. |
9 | Dunham, J. , Grant, I. H. , Watson, S. (2011). Idealism: A History of a Philosophy, Durham: McGill-Queen’gs University Press. p. 303 n. 4. |
10 | Ester, M. , Kriegel, H.-P. , Sander, J. , Xu, X. 1996). Simoudis, E., Han, J., Fayyad, U. M. (eds.). A density-based algorithm for discovering clusters in large spatial databases with noise. Proceedings of the Second International onference on Knowledge Discovery and Data Mining (KDD-96). AAAI Press. pp. 226–231. CiteSeerX 10.1.1.121.9220. ISBN 1-57735-004-9. |
11 | Felsberger, A. , Oberegger, B. , Reiner, G. (2016). A Review of Decision Support Systems for Manufacturing Systems. |
12 | Gawthrop, P. J. , Smith, L. P. S. (1996). Metamodelling: bond graphs and dynamic systems. London: Prentice Hall. ISBN 0-13-489824-9. |
13 | Goldberger, A. S. ((1972) ) Structural equation models in the social sciences, Econometrica 40: , 979–1001. |
14 | Halpern, J. ((2000) ) Axiomatizing causal intelligence research, Journal of Artificial Intelligence Research 12: , 317–337. |
15 | Harabagiu, S. , Hickl, A. , Lacatusu, F. ((2006) ) Negation, contrast and contradiction in text processing, AAAI 6: , 755–762. |
16 | Harman, H. H. (1976). Modern Factor Analysis. University of Chicago Press. pp. 175, 176. ISBN 978-0-226-31652-9. |
17 | Iwasaki, Y. , Simon, H.A. ((1994) ) Causality and model abstraction, Artif. Intell 67: (1), 143–194. |
18 | Jordan, Z. A. (1967) The Evolution of Dialectical Materialism, London: Macmillan. |
19 | Kaplan, D. (2008). Structural Equation Modeling: Foundations and Extensions (2nd ed.). SAGE. ISBN 978-1412916240. |
20 | Lamar C. (2009). Linguistic Analysis of Natural Language Engineering Requirements https://tigerprints.clemson.edu/alltheses/671. |
21 | Lamar C,. , Mocko GM. (2010). Linguistic Analysis of Natural Language Engineering Requirement Statements. In: Horvath I, ed. Ancona: Tools and Methods for Competitive Engineering; 97–111. |
22 | Lami G. (2005). QuARS: a tool for analyzing requirement | SEI Digital Library. |
23 | Landauer Thomas, K. , Dumais Susan, T. ((2008) ) Latent semantic analysis, Scholarpedia 3: (11), 4356. |
24 | Lash, A. (2013) Computational Representation of Linguistic Semantics for Requirement Analysis in Engineering Design. Clemson, SC: Clemson University. |
25 | Mobus, G. E. , Kalton, M. C. (2015). Principles of Systems Science, Springer-Verlag New York, DOI: 10.1007/978-1-4939-1920-8. |
26 | Misra, J. , Sengupta, S. , Das, S. (2014). Latent semantic centrality based automated requirements prioritization. In: Proceedings of the ISEC’14 7th India Software Engineering Conference, pp. 1–10; Chennai, India. |
27 | Mokammel, F. , Coatanea, E. , Blanco, E. , Pietola, M. (2018). Analysis and graph representation of requirements models using computational linguistics methods, Systems Engineering, INCOSE, pp. 1–21, Wiley Periodicals, Inc., DOI: 10.1002/sys.21461. |
28 | Mokhtarian, H. , Coatanéa, E. , Paris, H. (2017). Function modelling combined with physics-based reasoning for assessing design options and supporting innovative ideation, Artificial Intelligence for Engineering Design, Analysis and Manufacturing (AIEDAM), Cambridge University Press, Volume 31, Issue 4 (Function Modeling: Benchmark Models, Problems, and Approaches), https://doi.org/10.1017/S0890060417000403. |
29 | Moon Francis, C. (2007). The Machines of Leonardo Da Vinci and Franz Reuleaux, Kinematics of Machines from the Renaissance to the 20th Century. Springer. ISBN 978-1-4020-5598-0. |
30 | Ott, D. (2012). Defects in natural language requirement specifications at Mercedes-Benz: an investigation using a combination of legacy data and expert opinion. In: Proceedings of the 2012 20th IEEE International Requirements Engineering Conference (RE), 2012, pp. 291-296; Chicago, IL. |
31 | Pearl, J. (2000). Causality: Models, Reasoning, and Inference, Cambridge University Press. |
32 | Pelleg, D. , Moore, A. A. (1999). Accelerating exact k -means algorithms with geometric reasoning. Proceedings of the Fifth ACM SIGKDD International Conference on Knowledge Discovery and Data Mining - KDD ’99. San Diego, California, United States: ACM Press: 277-281. doi:10.1145/312129.312248. ISBN 9781581131437. |
33 | Savransky, S. D. (2000). Engineering of Creativity: Introduction to TRIZ Methodology of Inventive Problem Solving, CRC Press, 408 Pages, ISBN 9780849322556. |
34 | Simon Herbert, A. ((1956) ) Rational choice and the structure of the environment.. CiteSeerX, Psychological Review 63: (2), 5116. doi: 10.1037/h0042769. |
35 | Spirtes, P. , Glymour, C. , Scheines, R. (2000). Causation, Prediction and Search, Second edition, Cambridge (Mass.), MIT Press. |
36 | Travé-Massuyès, L. , Pons, R. (1997). Causal ordering for multiple mode systems, 11th Int. Workshop on Qualitative Reasoning about Physical Systems QR’97, Cortona, Italy. |
37 | VanderWeele, T. J. , Shpitser, I. ((2013) ) On the definition of a confounder, Annals of Statistics 41: (1), 196–220, doi: 10.1214/12-aos1058. |
38 | Vaswani, A. , Shazeer, N. , Parmar, N. , Uszkoreit, J. , Jones, L. , Gomez Aidan, N. , Kaiser, L. , Polosukhin, I. (2017). Attention Is All You Need. arXiv:1706.03762. |


