
An investigation of the design process’s effect on a high-performance building’s actual energy system performance
Abstract
The design intent and the performance targets of projects may sometimes fail to match a building’s actual post-occupancy performance. The mismatch of intended and actual building performance can be attributed to multifarious reasons. This study focuses on the role of project decisions made during design as one of the reasons of shortfall. The aim of the study is to unveil the design decision-making process of a state-of-the-art research building through the analysis of project’s available set of IDP (Integrated Design Process) documentation. To understand the relationship and correlation between the energy performance gap and the decision-making process of the case building, we investigated the design decisions’ effect on the actual performance. The particular emphasis is on the decisions that were based on assumptions rather than measured actual test data for the proposed innovative building systems. The designed heat recovery system, which was dependent on recovered heat from the neighboring research building, had a significant effect on the building’s poor energy performance. We investigated collected project data from coordination meetings, thoroughly analyzed project documentation, and quantified the building’s actual energy performance data. The analysis of the project information shows the ripple effect of decisions that were made based on assumptions, that triggered shortfalls in the building’s overall actual performance. Our qualitative analysis indicates that the poor system performance during operations was related with the design decisions that were not based on the measurement of the actual performance of the existing systems in the neighboring building. The performance of the heat recovery from the neighboring building as a highly dependent Energy Conservation Measure (ECM) analyzed through collected documents and data. The ambiguity of the available heat potential from the neighboring building and related testing issues defined on an explanatory timeline of process coding. The conclusion includes recommendations for the design decision-making process for innovative system integrations for high-performance buildings, and underlines the importance of IDP for complex buildings.
1Introduction
High performance buildings (HPB) are equipped with complex mechanical systems that aim to reach standards such as net-zero carbon and net-positive energy. However, buildings that are designed with such energy goals sometimes under perform during the operational phase and fail to meet the energy goals. The difference between the design intend and the actual performance is known as the performance gap. The energy ‘performance gap’ between design predictions and actual performance of LEED certified buildings has been emphasized in a number of studies (Mallory-Hill & Gorgolewski, 2018; Gorgolewski et al., 2016; Salehi et al., 2015a; 2015b; Fedoruk et al., 2015; Terim Cavka et al., 2014; Scofield, 2013; Attia, 2013; Newsham et al., 2009; Perez-Lombart et al., 2008; Turner & Frankel, 2008; Diamond et al., 2006; Turner, 2006; Torcellini et al., 2004). To overcome such challenges, project teams adopt collaborative design approaches like Integrated Design Process (IDP) for improvement of information exchange, and design coordination amongst project team and stakeholders. IDP is a process that aims to maximize the opportunity for integration and collaboration between building systems early in the design process with major design decisions being made by a broad team of experts (Lu, 2020; Cole, 2015; Reed & Gordon, 2014; N.G., 2011; Pope & Tardiff, 2011; Larson, 2009; Zimmerman, 2006). “Much of a building’s energy performance is related to decisions made by stakeholders (e.g. architects, engineers, contractors) during planning, design, and construction, yet the influence of cognitive biases on these pre-occupancy decisions is underexplored” (Gillingham et al. 2009 in Klatz 2011). Specifically, HPB better to be designed through the IDP to increase energy efficiency and decrease potential learning curve on available new technologies/systems to acquire top-level targets. Practical HPB project processes are more complex, multifaceted, and less linear than the conceptual processes. “Designers often move through some phases in parallel and occasionally both forward and backwards. Different stakeholders during the decision-making process share the responsibilities. Trade-offs among functions, goals, and costs are continually weighed against one another, options are considered, and decisions are made” (Waage, 2007). According to related literature review on design decision-making and energy performance of buildings, most of the studies are about the investigation of using Building Energy Assessment (BEA) tools for better green or HPB buildings design decision-making processes (Kim & Nam, 2020; Gupta et al., 2019; Stevenson & Bobarsky-Narozny, 2018; Østergård et al., 2016; Preiser et al., 2015; Göçer et al., 2015; Batueva et al., 2014; Attia et al., 2013; Attia, 2012; Georgiadou et al., 2012; Attia & De Herde, 2011). The importance of using interdisciplinary modeling tools that enable communication on the same platform through IDP, such as Building Information Modeling (BIM), is the other upmost topic evaluated especially after 2010 for design decision-making processes of Net-zero or HPB projects (Zanni et al., 2019; Lim et al., 2018; Cemesova et al., 2015; Akın, 2015; Iordanova, 2011; Forgues & Iordonova, 2010; Thuesen et al., 2010; Larson, 2009). Applying energy performance-based or net zero carbon based early design tools have the same vision to follow predictions in the intuitive design-decision making processes.
The use of BEA or BIM tools cannot always end up with best solutions due to assumptions and some estimative presumptions made through the design processes, whereas performance gap still may occur. As stated in related literature, there are multifarious studies looking into technical details causing the performance gap; such as discrepancy in occupancy predictions, weather dataset changes, energy modeling simplification errors, new technology failures, personal habits/ human factor etc. However, there are no studies investigating the main design decisions’ effect through IDP given by design leaders on the actual performance. As design evolves fast, it is possible to forget how some decisions were made on the road, or trade-offs occurred based on such decisions. It is often challenging to trace down the main design decisions, if the documentation and the design process data is limited. The case study presented in this paper is a part of a research project that aimed to document and analyse the design process, and it is one of the first trials of IDP in Canada. Our study uses the advantage of having vast documentation through the project’s design process, and aims to track down the design decision information, which triggered the shortfall of targeted energy goals.
The data for this study was collected from a high-tech research-building project located within a Canadian University campus. The Centre for Interactive Research on Sustainability (CIRS) building project is a sustainable building certified with LEED Platinum in 2013. Design process documented in detail in all stages. Twenty-nine design coordination meetings from schematic design to ninety-percent construction drawings phase were attended, recorded, transcribed, and analysed. The building is equipped with monitoring equipment, and data collection over 3000 points has been ongoing since 2012. To achieve the aggressive energy performance goals, the building design incorporates the neighbouring Earth and Ocean Sciences (EOS) lab building as a heat source as well as a heat sink. Complex building project had net-positive building, net zero carbon building targets and aimed to be a living lab for sustainability education. There are multiple publications in literature about the building project, questioning the technical reasons of energy performance gap (Mallory-Hill & Gorgolewski, 2018; Gorgolewski et al., 2016; Salehi et al., 2015a; 2015b; 2013; Fedoruk et al., 2015; Terim Cavka et al., 2014), and social/behavioural reasons questioned by post-occupancy evaluation studies and other social tests (Yamagata et al., 2020; Coleman & Robinson, 2017; Cole et al., 2013). Since the CIRS project is defined as a learning project, all the lessons learned on building performance and Campus as a Living Lab program are stated multiple times (Save et al., 2021; Pilon et al., 2020; Fedoruk et al., 2015; Salehi et al., 2015a). However, this study has a different perspective as creating a quantitative content analysis method from qualitative meetings’ documentation dataset, to be able to investigate the bigger picture of reasons on the quantitative performance gap given in previous studies specifically (Gorgolewski et al., 2016; Salehi et al., 2015a; 2015b; 2013; Fedoruk et al., 2015; Terim Cavka et al., 2014).
The objective of this paper is to demonstrate how the investigation of design decisions’ effect made possible through a well-documented high-performance building design process from schematic design to construction drawings phase. The full set of documentation and building performance details data provide us the opportunity to dig into details for investigation of design decisions’ effect on actual energy performance of a case project. Therefore, the two research questions of this study are: (1) Can we understand the reasons behind an underperforming building through an investigation of the design decision-making process? (2) What methods can be used for evaluating the design process to answer the previous question? These research questions are important since they target a gap in the literature of real case HPB projects for unveiling, understanding, and evaluating the ripple effect of design decision-making in design processes that trigger a performance gap.
2Methodology
This study reveals an investigation of the design process’s effect on the actual performance of a net-positive targeted building. The data is extracted from a well-documented design decision-making process document set. We can justify the well-documented set since multiple resources shared the same set of information, all related documents were collected, all coordination meetings were recorded and transcribed. The Integrated Design Process (IDP) documentation of the CIRS research building aimed to collect valuable data for future IDP of High Performance Buildings (HPB). Availability of information makes this research a unique opportunity for design decision-making process evaluation. The research team gathered project related information from multiple sources. These sources were:
- Charrette Reports for design, water, energy, daylighting design from 2006 to 2008,
- LEED Reports from 2009 and 2011,
- Post Tender energy modeling study report from 2010,
- Heat exchange energy modeling study,
- Project’s retrospective study (Fedoruk et al., 2012),
- Recording and transcription of 35 weekly meeting videos of the IDP from 2008 and 2009, and
- A semi-structured and a structured interview with the head energy modeler.
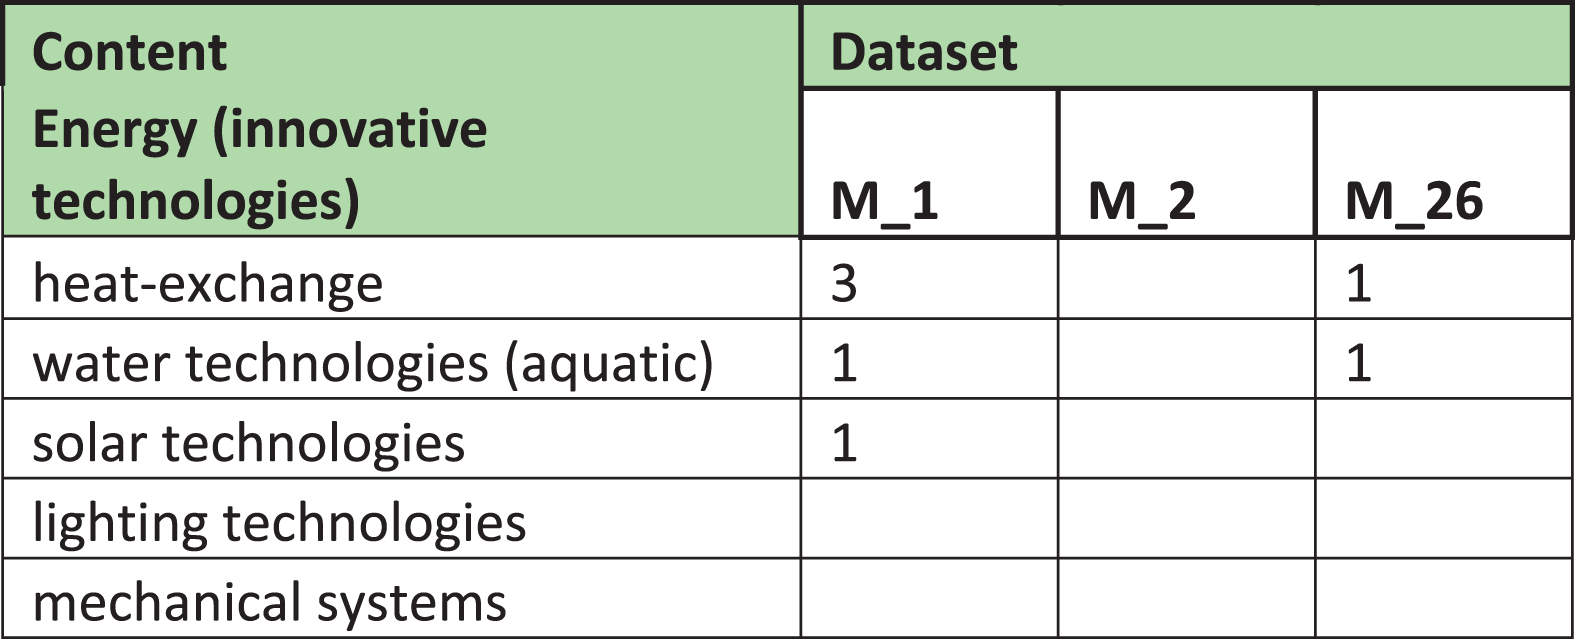
Main source of this specific case is the transcribed meeting minutes of the design process until the early construction phase, and detailed data analysis of the first and second year of occupancy. Observed meetings were from the schematic design (SD) and construction documentation (CD) phases. The transcription and coding of 35 weekly meeting videos of the IDP Meetings from 2008 and 2009 are revisited looking into energy related conversations and decisions. A number of new and innovative building related energy technologies, such as the heat exchange technology, were addressed and questioned during the evaluation process. Based on the transcribed minutes and the researchers’ field notes, the items discussed in the meetings were coded to classify the discussion topics. Coding of qualitative study done by content analysis1 by text base qualitative data. The framework given in Fig. 1 is a partial example of the quantified text base qualitative data. Figure 1 shows a sample the coding framework (content) in the matrix rows, and three columns representing three of the IDP meetings. The number of instances, where content keyword discussed in each meeting is represented with number of occurrence in the matrix cells. Then the total number of instances were summed. The objective of the task of coding the meeting content was to classify the meeting items with respect to energy, water, solar, lighting system and mechanical system technology, whereas construction and design issues neglected. The results of this analysis allowed the researchers to identify the content of IDP meetings with some degree of their relative importance, and the general sequencing. When we analyze the overall transcription by coding process, we observed that heat exchange and related energy modeling exercise has been discussed in only five of the meetings. And in only one of these meetings over 50% of meeting time was dedicated for the details of the heat exchange system, where in average total time dedicated to the subject is calculated as 3% of meeting time. After expressing the total time spent on the innovative net-positive promising energy technology, we wanted to investigate and evaluate the outcomes of the energy modeling and actual performance.
Fig. 1
Example of plotting data points framework of transcribed IDP meeting minutes.
For energy performance data analysis part, the processed building energy system data that was collected over one year which enabled understanding the actual energy performance of the building in high level of detail, as well as the performance of the innovative heat exchange system. The energy performance data previously been shared in different formats in other studies by the research team (Salehi et al., 2015a; 2015b; 2013; Fedoruk et al., 2015; Terim Cavka et al., 2014). The data is used in this study to explain the innovative system and the related performance results. The LEED, the Living Building Challenge, and BC Hydro High Performance Buildings Program were chosen by the design leaders as benchmarking standards for building rating options. All the energy modeling exercises conducted for benchmarking in different platforms are also included for evaluation of energy related decisions. The design team performed whole building energy-modeling studies, in order to benchmark energy performance results that are stated in related reports (Salehi et al., 2015a). The consultants shared all previous energy models and reports with the research team. Since energy performance prediction exercise is crucial to address the actual performance, a structured (2015) as well as an additional semi-structured interview with the head energy modeler has been conducted in 2013 about the energy modeler’s involvement in the IDP process. The head energy modeler mentioned during the interviews that she was involved in the energy modeling process starting June 2008, with partial energy model studies prepared for daylighting and energy Charrettes. She also mentioned that “ . . . when you look at the BC Hydro study and also the LEED compliance model, none of those really address the benefits of the energy sharing. They only look at the boundary of the building itself . . . ”. Therefore, the energy modeling exercise of the out of the “boundary” heat exchange system was added later in the process (indicated in Fig. 2).
Fig. 2
Project timeline with Analysis Period Defined (Interpreted from the project’s retrospective report and a slide about energy modeling progress timeline from Energy Modeler’s (Soderlund, 2012) Power Smart Forum Presentation.
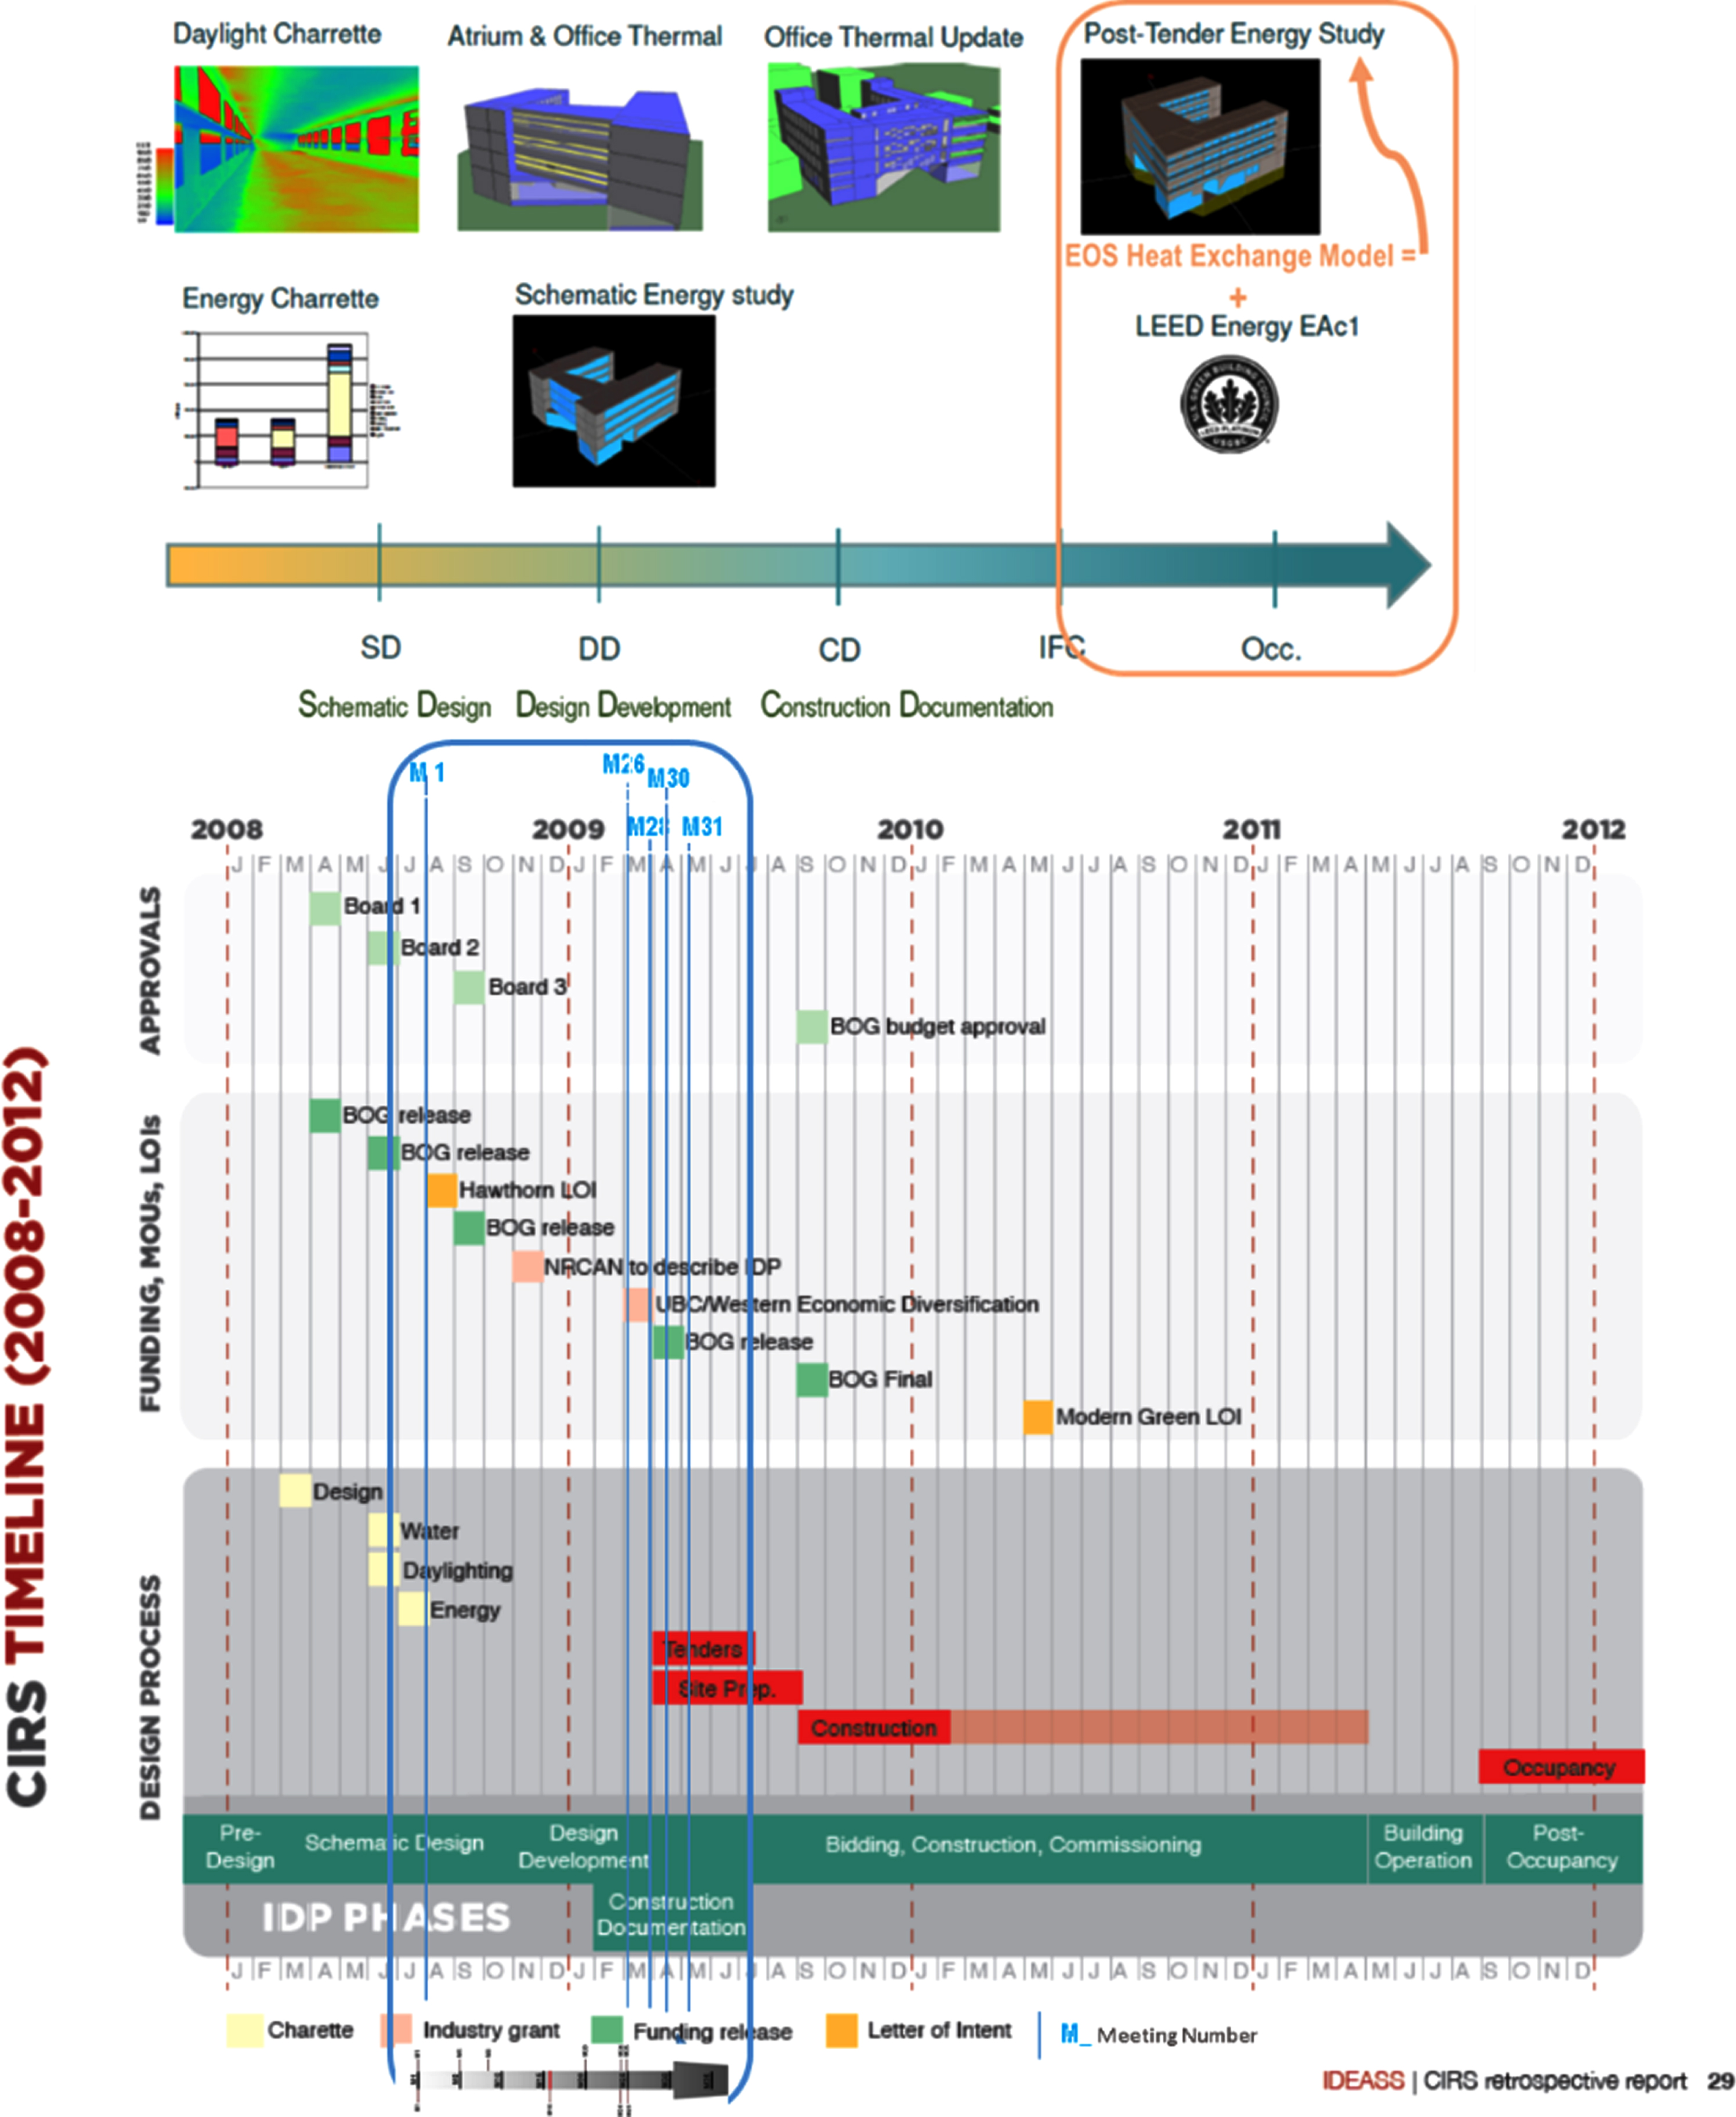
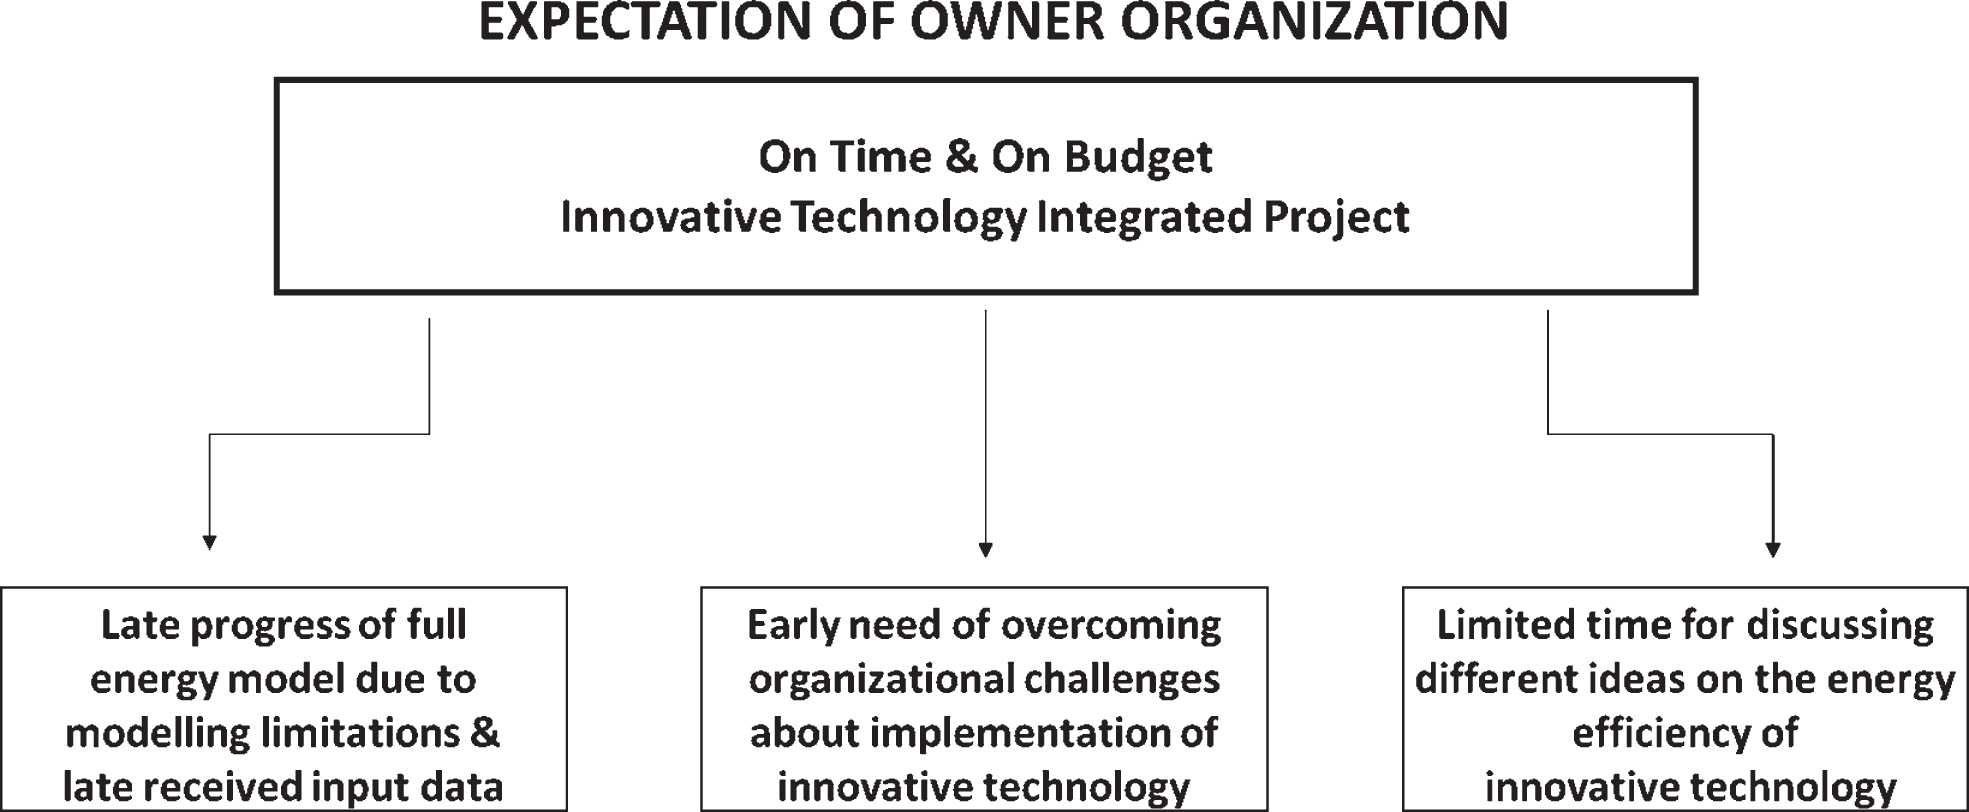
The steps of the investigation are Step 1. Depicting the IDP meetings through design on the timeline of grant and funding releases (where LEED and Post-Tender Modeling studies submitted); Step 2. Identifying the transcribed meetings (Fig. 1) related to energy goals and main energy innovation system about heat exchange (by big blue box in Fig. 2); Step 3. Identifying when the energy modeling exercise of innovative heat exchange has been included in energy modeling progress timeline (by small orange box in Fig. 2); Step 4. Juxtaposing the timeline graphs of energy modeling process with EOS heat exchange addition and project timeline with design decision discussions about EOS heat exchange identified (Section 3.3); Step 5. Summarizing the performance gap in the first year of operation in CIRS building and defining the underperformance score of innovative heat exchange with neighbouring EOS building (Section 4); Step 6. Digging into meeting minutes for discovering the shortfall of innovative system (realizing lack of testing and depending on assumptions cause shortfalls, the design evolves in a way that leads to mechanical system performance problems) (Section 5); Step 7. Mismatching goals about IDP process of owner organization and idea/concept owners (Fig. 8); Step 8. Concluding remarks related to the project’s IDP process, which can be transferred to future high-tech innovative building projects (Section 6).
Fig. 8
IDP expectation of the owner organization versus real IDP case details triggering performance gap.
3The case project
The CIRS building is located on the campus of the University of British Columbia (UBC). CIRS is a research center for sustainable design, products, systems and decision-making. The building itself has been a research project since the beginning of the design process by implementing the collaborative and innovative works of different teams in the process, in order to come up with sustainable solutions by studying advanced technologies. With a gross floor area of 4,607 m2, the structure has a pair of 4-storey office/ lab blocks running east-west, linked by an atrium which acts as a building lobby and entry to a 500-seat lecture theatre for general campus use.
3.1The project organization
The CIRS project organization model differs from other sustainable office building projects with its unique building ownership definition. Structure of project’s financial resources is composed of multiple partners as funding and/or supporting partners/ stakeholders. As supporting partners, some of these companies contributed to the project as subcontractors as well. The project participants targeted high sustainability and performance related project goals from the concept stage to occupancy stage of the case building. The decision leaders can be grouped into three main groups; policy field (the university), process field (design team), and technology field (building operating system providers) (Fig. 3). Initial goal of the project was to get all decision leaders on board early in the project. However, during the design process only two main consultant firms, as the leaders of process field, had representatives to contribute to the collaborative decision-making process. Along the design process, the design team members from the main consultancy groups (architecture, electrical, mechanical) changed. The subcontractors were not a part of the IDP process. Since the project idea started before 2008 and the building was occupied in 2012, some decision leaders changed through the time, and vague ownership model caused challenges in adapting few decisions made by the four main actors from the two main consultant firms.
Fig. 3
CIRS project specific organization model consisting of multiple partners as decision leaders in three main fields (Fedoruk et al., 2012).
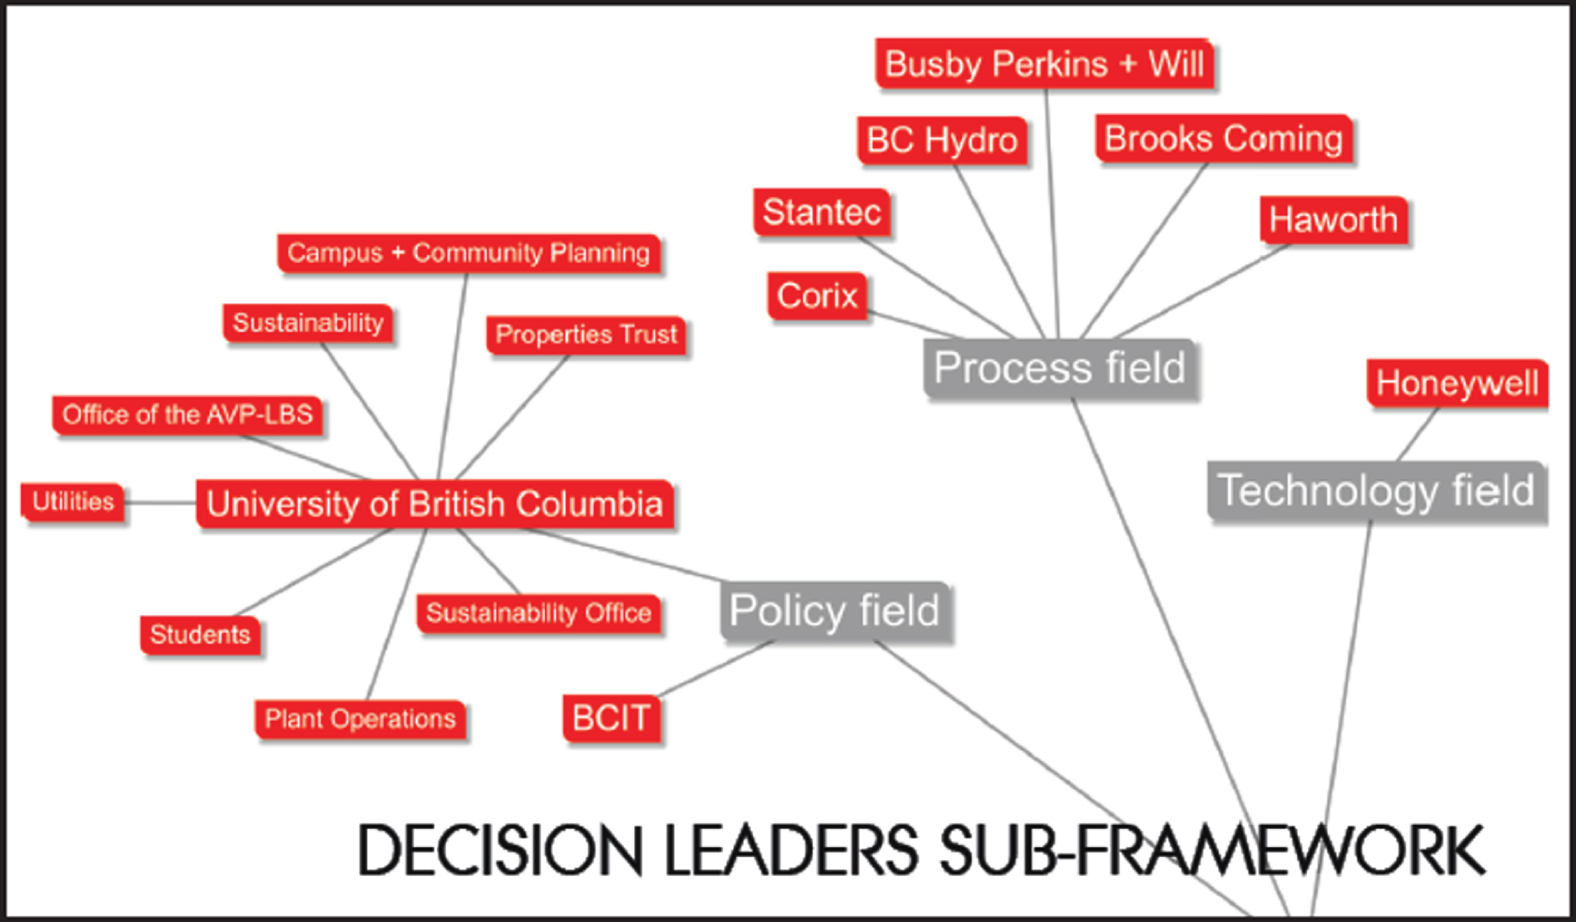
Figure 2 represents CIRS building project timeline in relation to the decision-making charrettes (Design, Water, Daylight, and Energy), industry grant opportunities and funding releases specific to CIRS retrospective case study. This case study analysis period defined by the big blue box Fig. 2, referencing the documented and evaluated IDP meetings. Using IDP was a requirement from the start of the project idea to operations in all phases of the project.. However, with limited time and budget constraints dictated by the owner organization, the possibility of integrating over net-zero targeting innovative technology and related systems missed the opportunity to be tested or optimized at the early design stage phase or in further phases. Keeping the CIRS project within the budget and timeline of a conventional market baseline construction example (MNECB - the Model National Energy code for Buildings) was also what has been tried through the project’s IDP process and life-cycle as a main goal. Yet an innovative living lab building may need more testing than a conventional market baseline construction equivalent one even in the pre-design stage.
3.2Design Decision Making Process - The building energy system design
CIRS building is designed and constructed aiming to be one of the greenest buildings in North America since the beginning of design. Half of 22 goals defined in Design Charrette (March, 2008) are identified as energy related goals. Thus, the energy performance of the building targeted to be over net-zero as a pioneering example of regenerative/net-positive building (Fedoruk et al., 2015). To be a net-positive energy producer and a net zero carbon building, renewable energy sources available at the time are all integrated in the building’s design, however potential renewable sources were not enough to offset the energy consumption. Therefore, another source of energy was introduced in the Design Charrette, and this new source was the heat exchange from the neighbouring Earth and Ocean Sciences (EOS) lab building. As described by the mechanical design leader, who is one of four design decision leaders (Miller et al. 2012), heat exchange system is one of the most important Energy Conservation Measure (ECM) features to fulfil the project’s energy vision. Initially calculated as providing a 42% energy saving compared to market baseline example (MNECB - the Model National Energy code for Buildings) for the project case study. As quoted from mechanical design leader: “Well we had, on the table...the usual suspects. We had building integrated PV, we had the solar thermal, and we had the geo-exchange. We had the daylighting strategy and efficient, you know all the efficiency stuff. So that was already there, but that didn’t get us to net-positive, right. So [the heat exchange] was a breakthrough in allowing us to make a huge step in the direction of regenerative sustainability. So it was an exciting moment.” (Fedoruk et al., 2012, p. 15).
3.3Evaluation of project timeline, energy modeling and design decisions
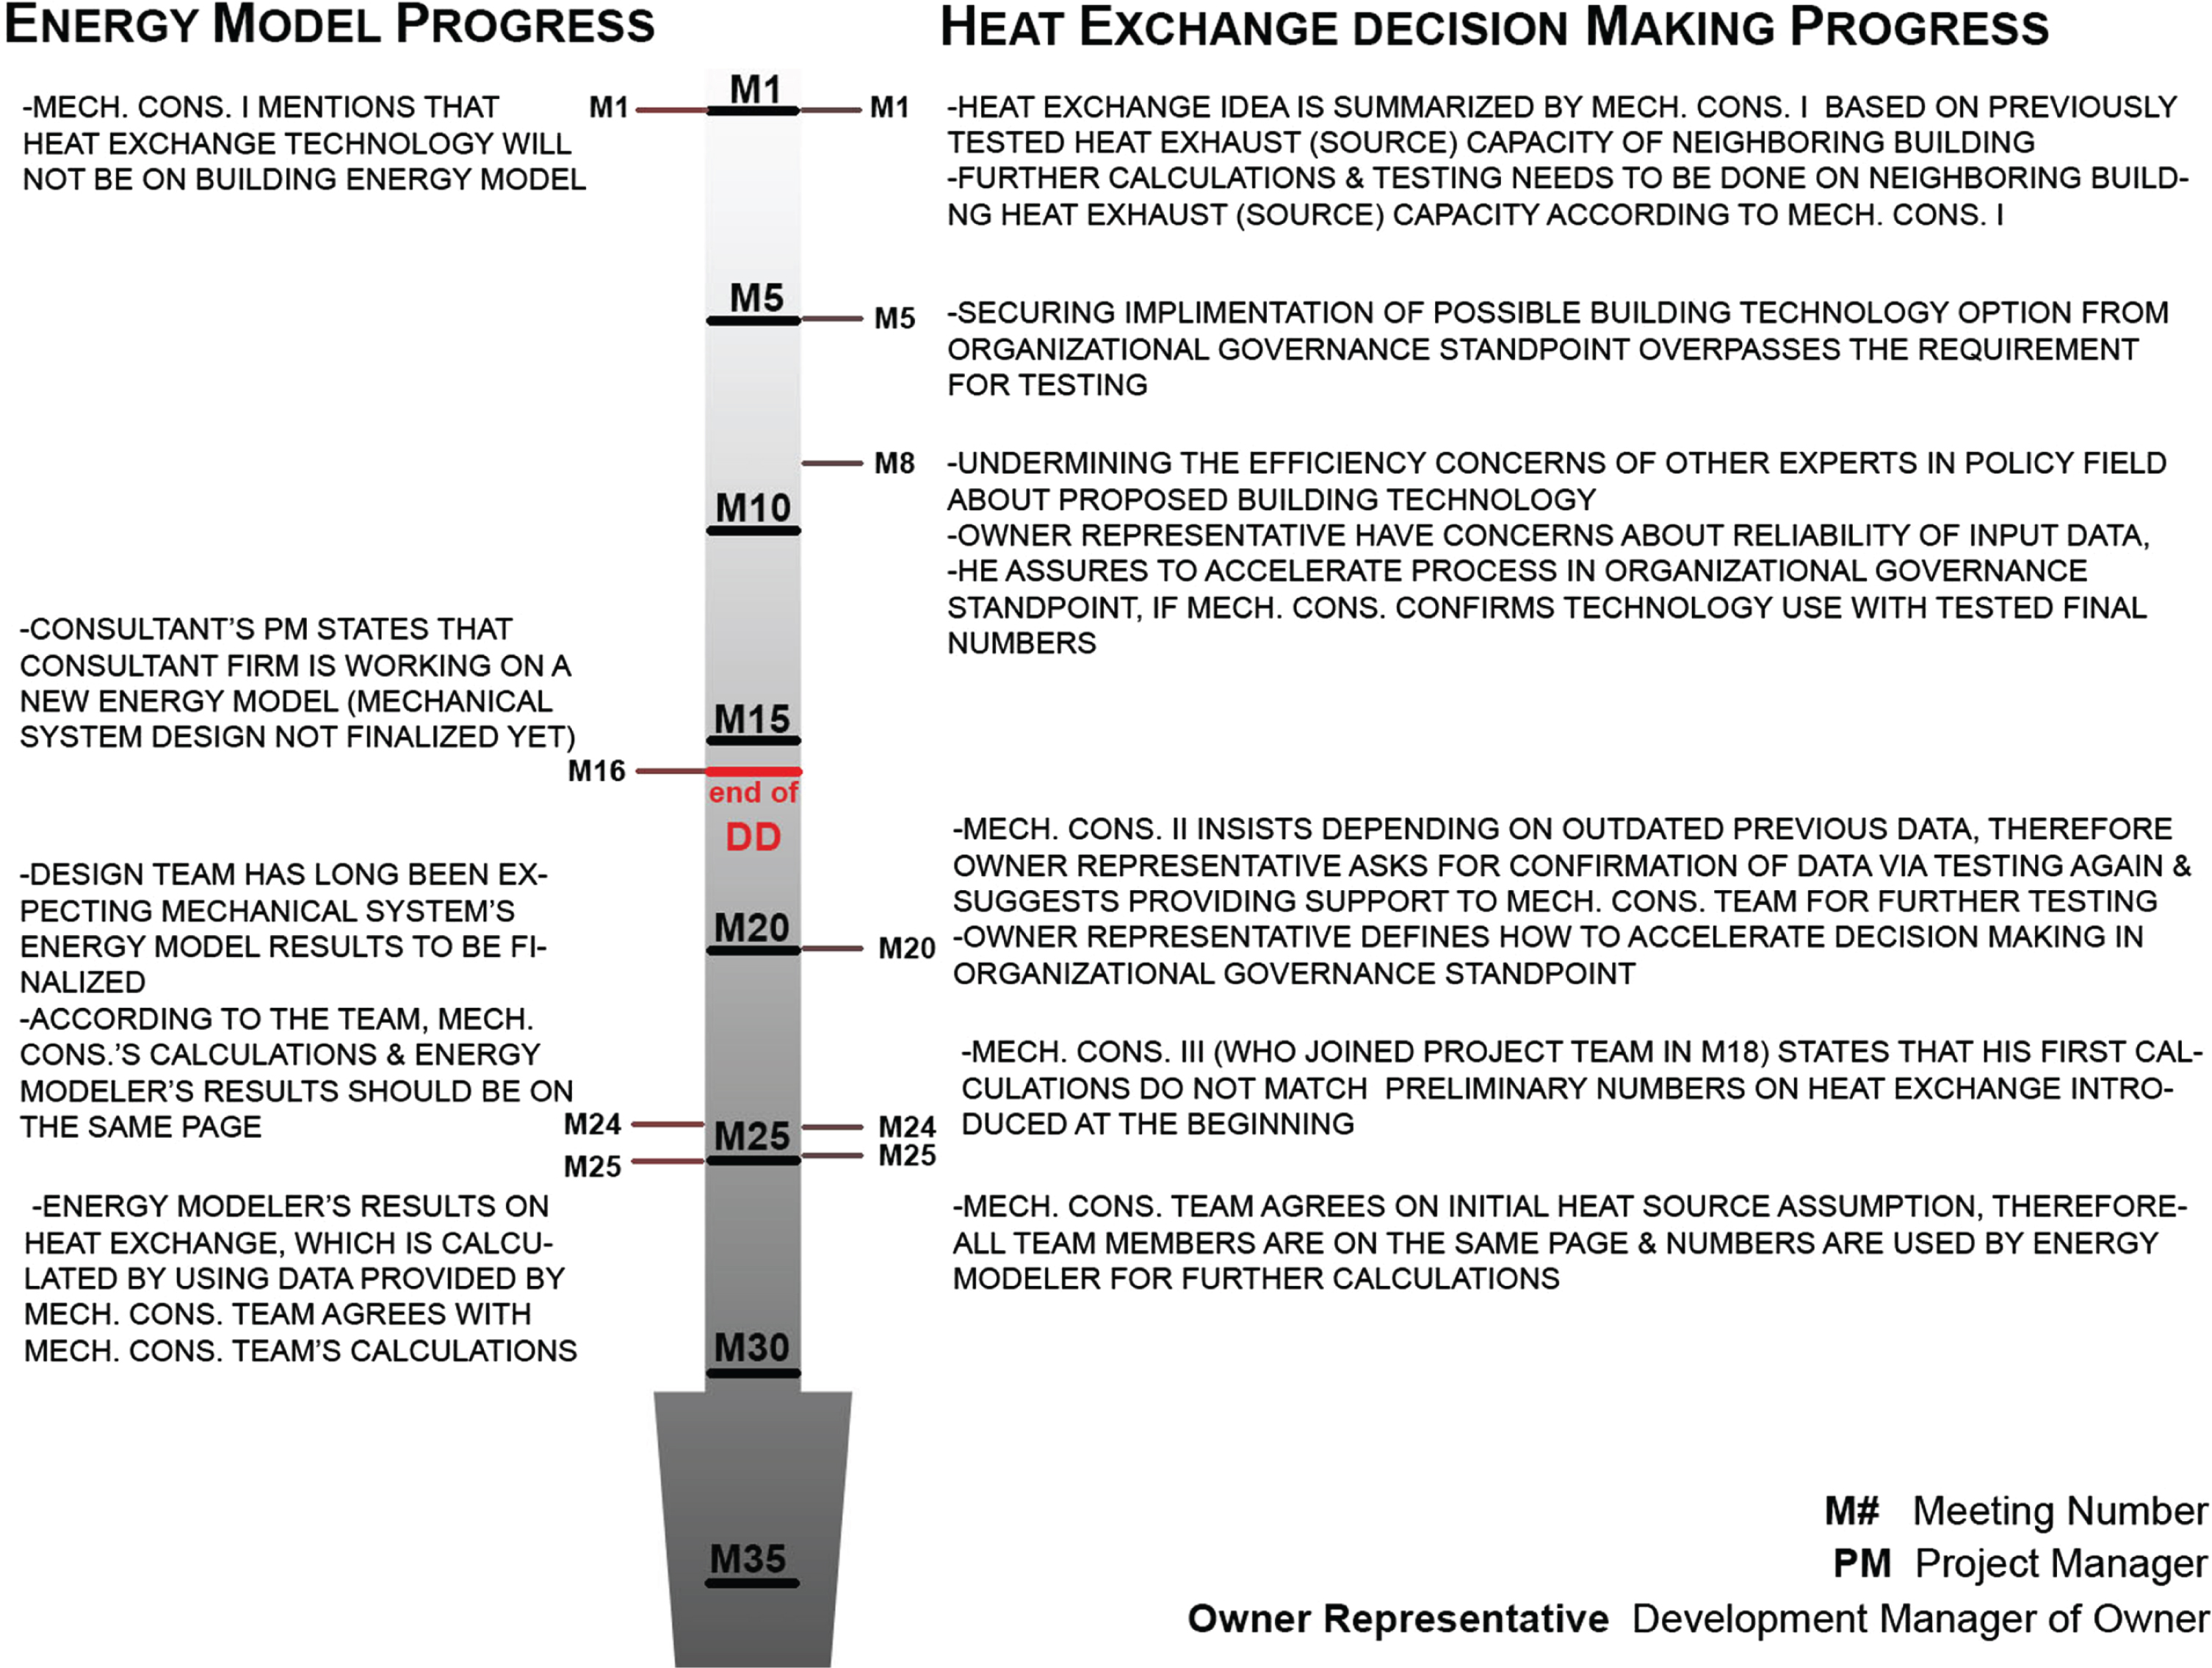
This section juxtaposes the timeline graphs of energy modeling process with EOS heat exchange addition, and project timeline with design decision discussions about EOS heat exchange. Transcribed meetings through schematic design and construction documentation stages were given by big blue box Fig. 2. The meetings related to energy goals and main energy innovation system about heat exchange are given with M1, M26, M28, M30, and M31 indicated in blue in Fig. 2. CIRS Building project timeline parallel to energy modeling progress timeline is also included in Fig. 2. In the upper part of Fig. 2, the timing of the inclusion of the energy modeling exercise of the innovative heat exchange in energy modeling progress is also indicated with an orange box on the timeline. The synchronization problem between energy modeling exercise and energy decisions made is also shown in accordance with the energy modeling progress timeline. Timelines are similar for energy modeling and IDP processes, where the small orange box defines the heat-exchange mechanical energy modeling process, and the big blue box representing the design decisions made on process timeline with all IDP roundtable meetings analysed. In the ideal IDP process, big blue and small orange timeline boxes are expected to align. Energy related quotes stated in the graphic representation given in Fig. 6, which is the detailed representation of the arrow drawn on CIRS IDP phase’s timeline. This arrow drawn resembles the relationship between Energy Modeling and Heat Exchange Decision Making Processes, through selected quotes from meetings revisited related to EOS heat exchange main design decisions and will be explained in Section 5.
Fig. 6
Graphical Representation of Project’s Heat Exchange Decision Making Process.
4Performance gap analysis
As mentioned before, buildings that are designed with high performance goals sometimes under perform during the operational phase and fail to meet their energy goals, and CIRS building was no exception. The building’s performance gap, difference between the designs intend and the actual performance, was questioned after the first year of operation (Terim Cavka, 2014). The research team compared the building’s designed/modeled and actual annual energy consumption in the first year of operation to identify the performance. The building is equipped with over 3000 points of measurement. The available data enabled researchers to do an in depth analysis (Salehi et al., 2015; Terim Cavka et al., 2014). Measurement and verification are also required steps for LEED rating system.When the research team compared the building’s designed versus its actual annual energy consumption in the first year of operation, the analysis indicated a significant difference in performance. According to overall annual energy performance analysis results, the performance gap in overall electricity consumption, which is the main energy source, is 23% over what was predicted (Fig. 4). According to Fig. 4a, the closest performance prediction is the mechanical system energy consumption. Although the mechanical consumption is 4% lower than predicted, the monthly gap variation is ranging between 7% and 62% in average deviation of 42% (see Fig. 4b). Analysed actual performance data indicates that from February through June the actual HVAC energy consumption is less than the predicted energy consumption, and the actual performance from July through January the actual energy consumption is higher than predicted HVAC energy consumption.
Fig. 4
(a) The building’s overall annual (March 2012-2013) performance results versus predicted performance from 2010 BC Hydro model. (b) The building’s monthly performance results between (March 2012-2013), versus predicted HVAC performance from 2010 BC Hydro model.
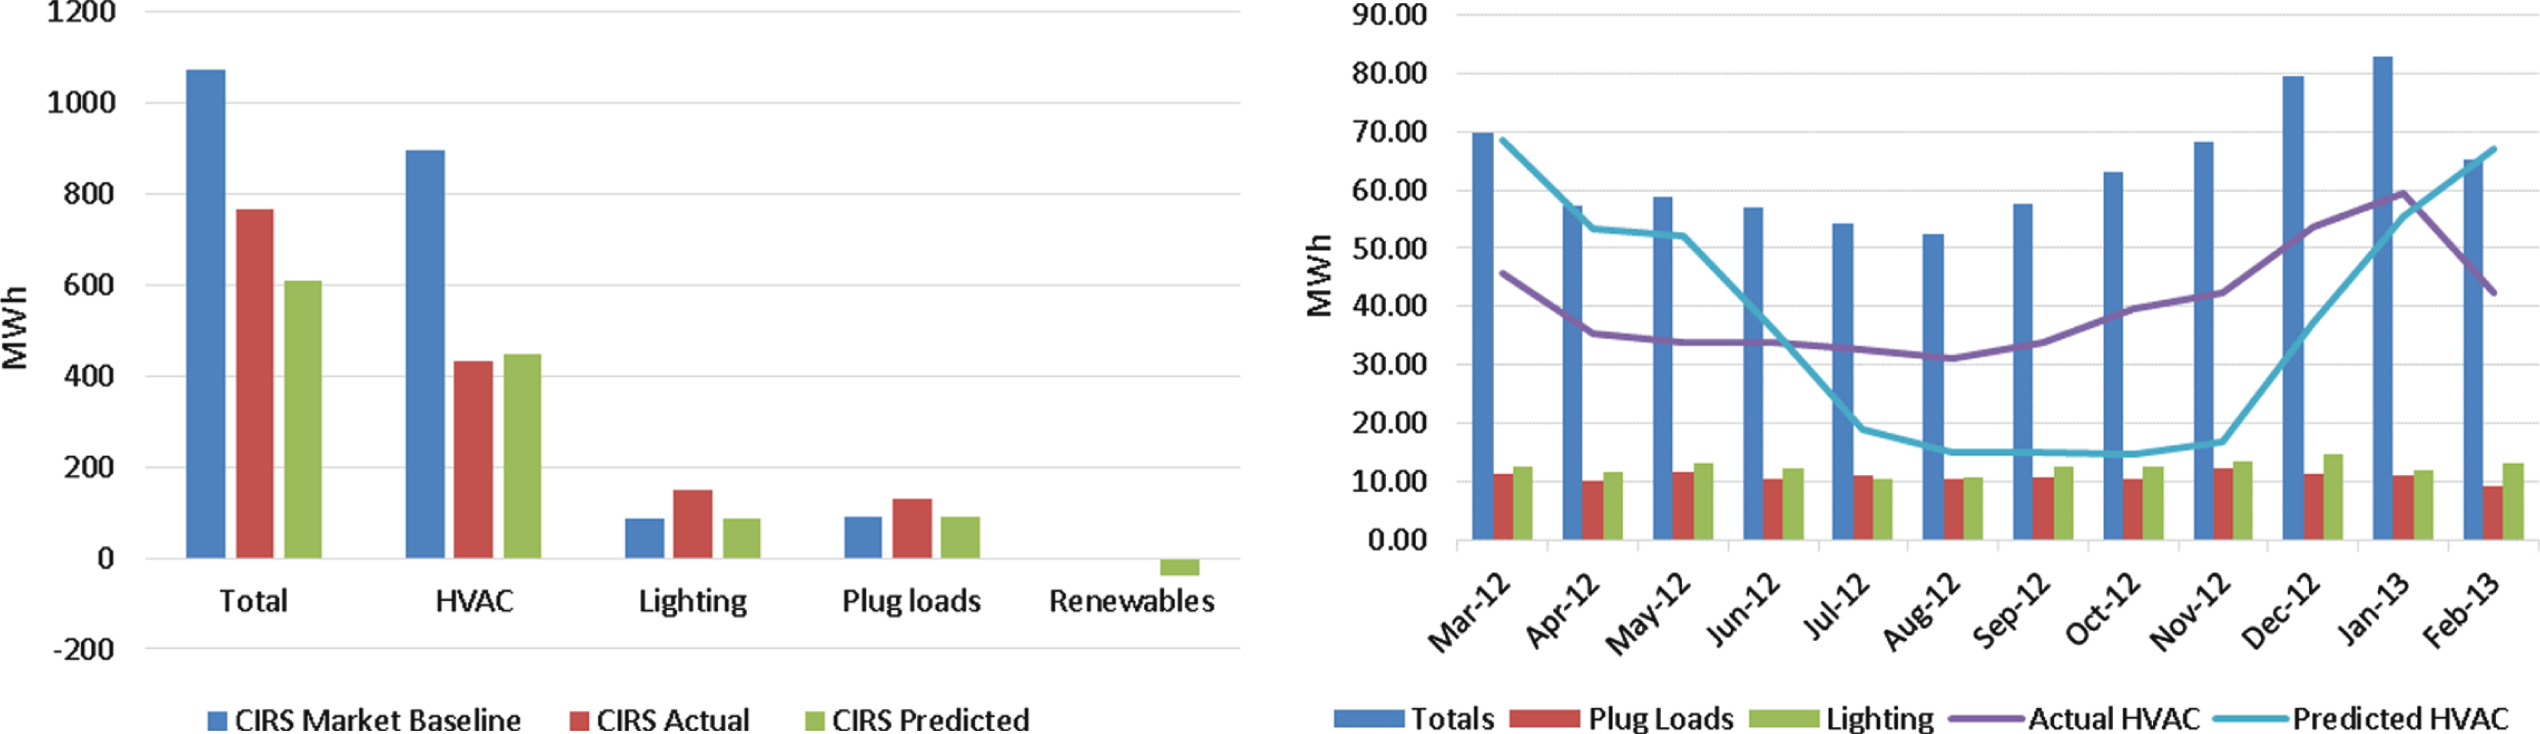
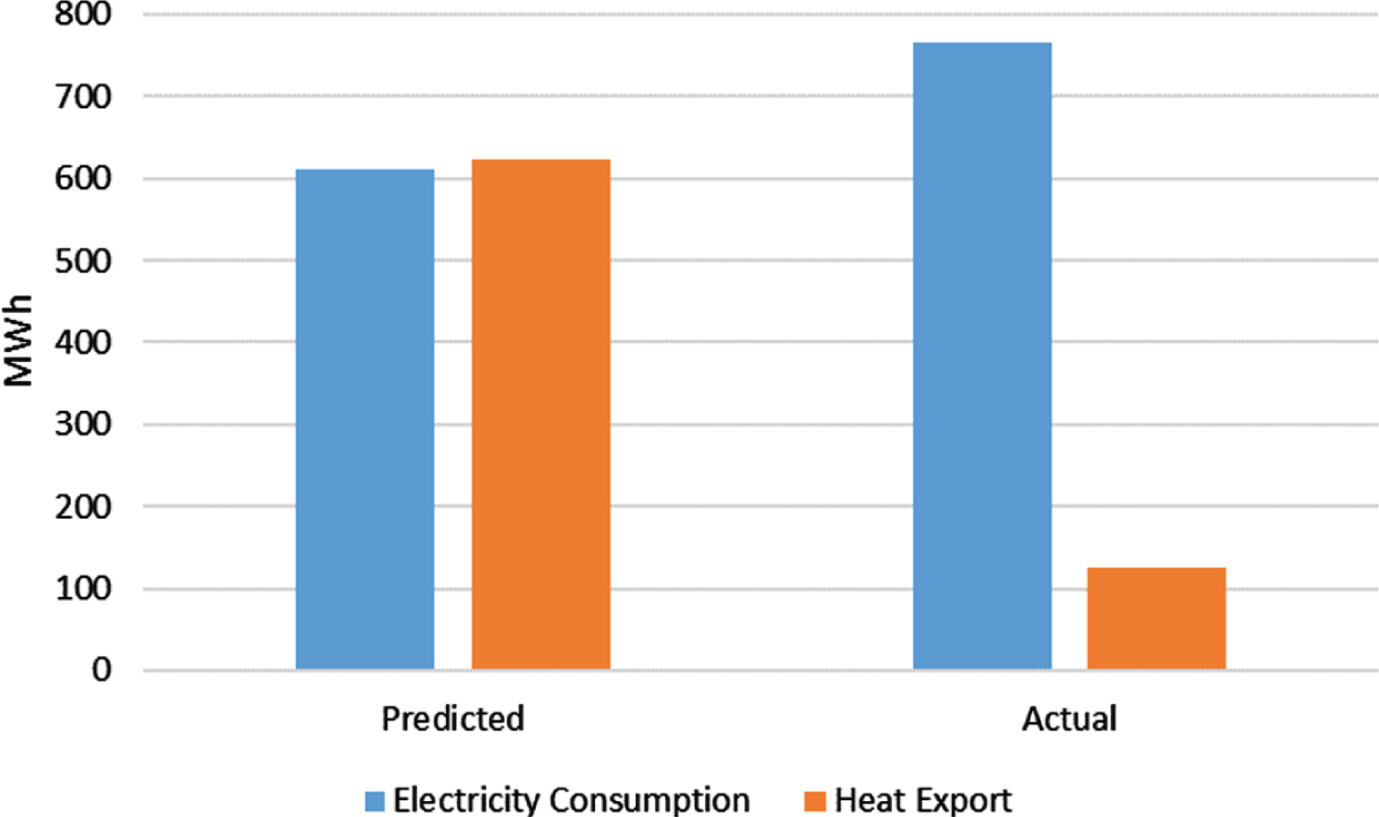
After the overall results are investigated, the reason behind this gap was unveiled through the available data measured from over 3000 points. In order to analyse the detailed building performance accurately in the initial years of operation, the researchers collaborated with the Building Monitoring Technical specialist, and accessed all dataset of performance information of the building for one full year. Further analysis of the building systems’ actual performance indicates that the heat exchange did not work as intended in the energy model predictions during the first year of operation (Fig. 5). Although actual annual energy consumed by mechanical systems is close to estimations with 612 MWh, the heat export is only 20% (125 MWh) of the estimated value 600 MWh. Building’s detailed performance analysis indicates that the heat exchange between the project and the neighbouring building do not work efficiently (Terim Cavka et al., 2014). Building’s innovative heat exchange system faced two main problematic issues. First one is the neighbouring building’s average yearly (from 2012 to 2013) exhaust heat temperature, which is calculated as 17.8°C from actual data, is less than what the consultants previously accepted as the exhaust temperature, which was taken from in the energy modeling spreadsheets as 23.4°C during the design phase. Second one is the designed Make Up Air Handling Units (MUAs) are not functioning as intended because of the communication problem between the existing equipment on neighbouring building’s rooftop and the newly introduced equipment. As indicated by Fedoruk (2013, 2015) the problems related with the commissioning also contributed to the outcome. The absence of the sub-contractors in the integrated design process potentially led to issues in detailed design and identification of performance requirements. There were also challenges related with metering equipment in monitoring systems during prediction testing. The heat exchange challenge from the neighbouring building was overlooked during commissioning.
Fig. 5
From the building project to the neighbouring building Heat Export Annual Performance Results (Mar 2012-2013) (redrawn from Salehi et al., 2015).
5Discussion
In this study, we identify a performance gap, and pinpointed the main reasons behind it. As defined in the methodology section, all the available documented IDP data revisited, including the 35 meeting recordings watched, transcribed, and encoded. Once the main issue that led to the performance gap was identified, analysis was focused on specifically the heat exchange and related energy modeling exercise. In order to bring more insight, a structured and a semi-structured interview with the energy modeler was conducted in 2015 and 2013 respectively about energy performance gap problem, and to understand the energy modeler’s involvement in the IDP process. During these interviews energy modeler explains the process as “we started exploring at the schematic stage BIPVs (Building Integrated Photovoltaic) and shading devices and things like that, and exploring different HVAC options which is really important . . . here are some of the results for the different design strategies...So we found at this stage that we were around 56% reduction compared to market-based line in this particular study. Which is quite good, it doesn’t address the net zero energy or net positive carbon storage, because that all of sudden involves the adjacent building, so that is not captured here . . . so there is no modeling software really that can, or at the time that we did the modeling, can handle modeling that energy sharing. So there’s an energy model that deals with the building and getting the loads from CIRS, but all that energy sharing with EOS is developed in hourly spreadsheets and modeled each hour of the year just to get a sense of how that sharing will happen”.
The analysis of the collected information indicates reliability issues about the innovative heat exchange system’s (1) heat source potential to offset energy consumption, and (2) need for retesting to get actual heat potential data. These facts affected the energy modeling decisions and the construction of the energy conservation measure that aimed to contribute 42% saving to overall energy.
The analysis of the project information done by the juxtaposition of project timeline, energy modeling timeline, and meeting encoding field notes with quotes (Fig. 2 & Fig. 6). The transcribed data shown in Fig. 6 illustrates the types of interactions related to heat exchange technology took place through the analyzed meeting timeline from field notes. According to Fig. 6, the emergence of the noted problem can be followed as the new Mec. Cons. III (mechanical consultant joined the team in M_18) declares that his calculations do not match with the previous assumption in M 25 and explains the details. Quotes also formatted into field notes on this graph shows how the left side (Energy Modeling Progress) worked independently from the right side (Heat Exchange Decision Making Progress). As seen, the data about heat-exchange source potential is only delivered to the energy modeler by the end of DD process.
According to the coordination meeting video coding summary with quotes in Fig. 6, energy model including mechanical system heat exchange representations was not a part of the early design process (see also Fig. 2 non-synchronized SD and DD). Whereas Design Documentation (DD) officially ends in Meeting M16, and the building energy model with mechanical systems representation’ results shared with the team in Meeting M25 at the beginning of the construction documentation (CD) phase. Between M16 and M25 there is only a two month period, where no full testing for identification of the EOS Building fume hood heat potential. According to the interview with the energy modeler, final energy model of overall systems was finalized after the production of Issued for Construction (IFC) drawings. Therefore, the use of energy model for mechanical systems could not be rationalized earlier in the project’s IDP process so it is obvious that main decisions given on assumptions rather than facts. The building energy modelingof mechanical systems was done with eQuest 3.61 that only enabled to model the airside of the system after DD, while waterside had to be modeled with manual spreadsheet calculations, dependent on neighboring building assumptions given to energy modeler by the mechanical consultancy team. Although energy modeling of mechanical systems is always a topic in the early IDP meetings, no tangible progress done in the field before Construction Documentation CD. In the Heat Exchange Decision Making Progress column, it can be observed that although the exhaust heat source potential testing need is stated in the first and 20th meetings, the implementation of the innovative system in the organization standpoint dominated over the need for testing the potential heat exhausted out of the neighboring EOS Lab Building.
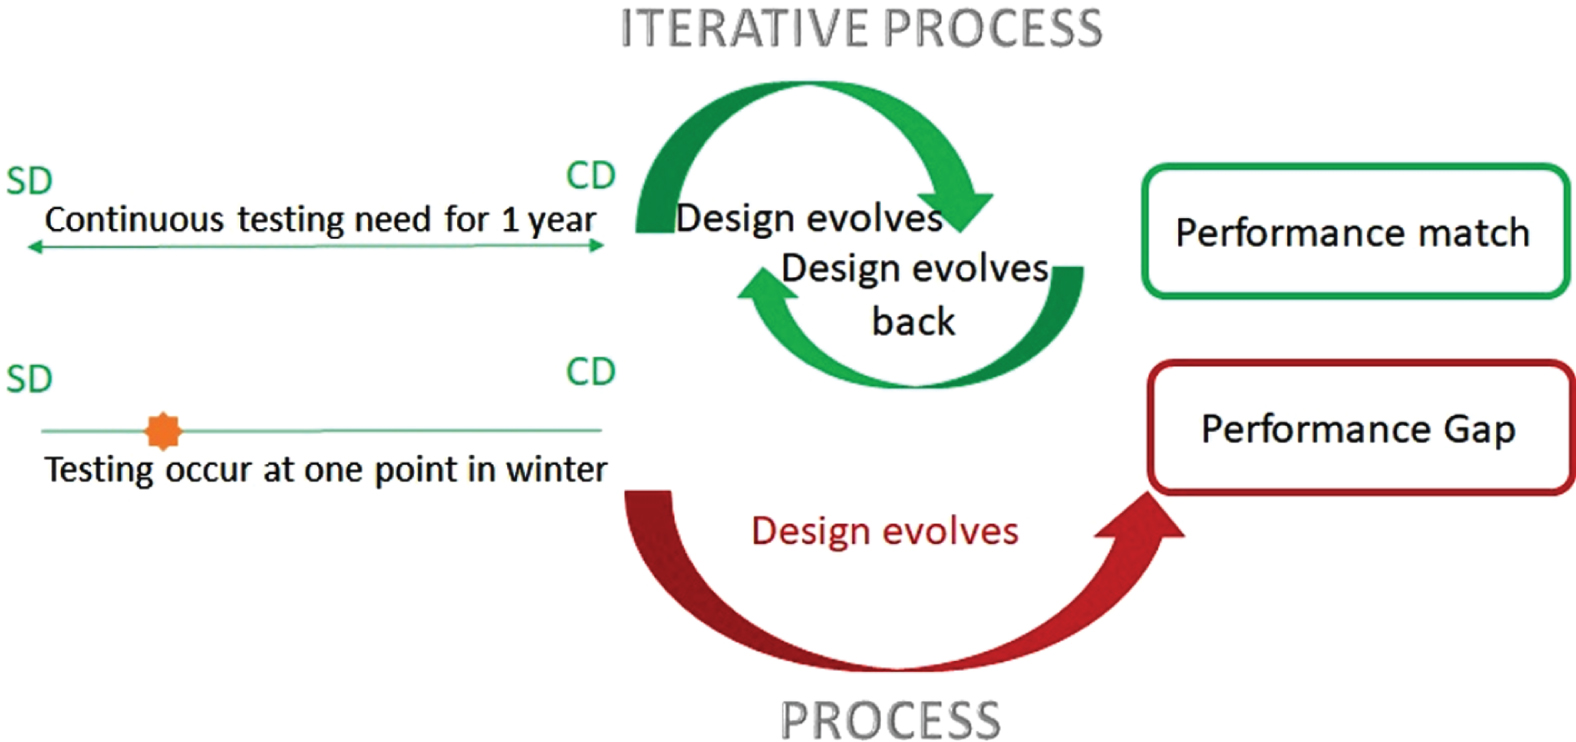
Analysis of energy charrette report, meeting documents, and recorded IDP meeting minutes in parallel, gave an insight about critical decisions that lead to identified performance gap (See Fig. 4 & Fig. 5). The ambiguity in critical technical information lead to a slippery ground. The project team based the initial decisions of heat-exchange system on assumptions (questioned even in between team members in M24 and M25) with lack of full year testing through process, which caused the design to evolve system’s mechanical performance problem (Fig. 7). Project’s energy model based on innovative system calculations that used numbers provided by the mechanical consultancy team rather than actual measured heat data from the neighboring building. At the time, exhausted heat potential from EOS lab building fume hoods was not measured and no testing ground enabled until CIRS building has been commissioned.
Fig. 7
Diagram of -Mechanical Performance Problem Caused by Inadequate Assumptions Made through Process.
Not having the sub trades always on board as part of design team during the decision-making process and inadequate commissioning practice also contributed to the technical problems related with the mechanical systems. In order to compensate the poorly made design and commissioning decisions, additional Make-Up Air Handling Units (MUAs) were required, which caused the building to go through a retrofit process three years after the project completion.
The investigation of the coordination meeting videos indicates that due to the time and budget constraints of building project, there was not enough time to conduct a detailed testing on energy source from the neighboring building. Such testing should preferably have happened a year prior to design. Organizational governance challenges overpassed testing requirements (Fig. 8). With limited time and budget constraints dictated by the owner organization, the possibility of integrating innovative technology and related systems missed the opportunity to test and optimize these technologies at the early design stage.
For benefiting from cross-disciplinary design opinions and surpass conventional pre-design processes, time and budget constraints believed to be stretched for future innovative cases. An innovative living lab building may need more testing even in the pre-design stage, since it is not a market baseline building example. The researchers initiated required testing after the building occupancy.
6Conclusion
The conclusion includes recommendations for design decision-making process for innovative system integrations for similar future high performance buildings. The goal of this paper is to learn from decision-making process of CIRS project, and transfer knowledge about this process to other high performance project examples. Through this study, we demonstrated how the investigation of design decisions’ effect on energy performance gap became possible with a well-documented, real case HPB’s IDP. The study is unique in terms of the set of available information, and it is a real-case IDP adaptation showcase. Meanwhile it introduces a method to pragmatically understanding the factors and relationships that affect the actual net positive building project performance. The two research questions asked in this study can be addressed as: (1) analysis of coordination meeting recordings and project documentation has the potential to bring insights on buildings’ actual performance, (2) the evaluation methods such as analysis of transcribed and encoded meetings, evaluation of design documentation, and content analysis of meeting minutes are adaptable for future real case projects, if the documentation and collected data of these projects are available and can be made accessible. These research questions are important since there is a gap in literature of real case HPB projects unveiling the ripple effect of design decision-making failures in practical design processes triggering the performance gap. Digging into meeting minutes for discovering the shortfall of innovative system clarified the picture in this case, by helping to realize the lack of testing led to shortfalls in design, and designing based on assumptions triggered a performance gap, which was linked to under performance of the main mechanical system. Retrofits to the building’s mechanical system needed to overcome the challenges about heat-exchange system, main Energy Conservation Measure, to achieve regenerative design idea and performance goals for future.
The main contribution of this specific study to the set of studies done on the CIRS building, is its investigation on all the available project dataset and documentation, and clarification of the assumptions made about the main source of net-positive innovative heat exchange system. Building’s energy system was designed to use a neighboring building for the heat exchange. During this study, this project decision has been identified as built on false performance assumptions. Energy modeling of heat exchange systems also failed to predict the actual performance scenario since built on given assumed number. Investigation of the collected project IDP data indicated that the decision making process related with the system design contributed to the identified problems, where the owner organization insisted on on-time, on-budget project delivery. Although everyone in the IDP process agreed for long-time testing of available heat source at first, we could not identify why the project team did not follow this decision through. Meanwhile, we should also mention that there are decisions made in-between decision-making leaders, which are not shared during the IDP meetings (Fedoruk, 2015; Miller, 2013) and therefore not documented. The lessons learned in this study can potentially be transferred to IDPs of similar high performance building projects:
∘ Well-documented integrated design processes are needed for the development of a knowledge base for future similar design processes
∘ Measurement and verification of details of sub-systems is essential when comparing design intend and actual performance
∘ Better scheduling of energy modeling timeline, with better defined modeling requirements are needed early in the design
∘ Missed opportunities on mechanical system design (such as solar collector heat recovery or EOS exhaust heat potential) are mainly caused by oversight, and can be avoided by accurate testing
∘ Knowledge and expertise in expected high tech systems should be mandatory/pre-requisite for the consultant teams from the start of a project, and consultants design representatives with expertise should be involved in the IDP process
∘ Sub trades and technical specialists should be always part of the IDP process
∘ BIM processes and technologies, and their effective usage have the potential to improve the IDP process, and communication about innovative systems
∘ On-time and on-budget constraints forced a limitation on the innovative technology testing in the investigated case project. Other structured IDPs that are introduced to the field may be followed to eliminate this (see Koch et al., 2013 for a different perspective)
Decisions made in the design process have an effect on construction, commissioning, and operations. Although some issues may remain unnoticed during design, others may be evaluated and neglected, or intentionally ignored or covered by the team, in order to fulfill the main mandate of the industry “on time and on budget” requirement. For innovative buildings and innovative mechanical systems to be introduced to industry, the overall understanding of design process needs to be shifted to incorporate performance analyses during design to make informed decisions, and research in new processes and technologies such as BIM plays an important role to achieve this goal. This paper is the first study that illustrates the opportunity to investigate certain design decisions’ effect on an actual performance. The mixed methods used in this study are applicable to other well-documented real case projects. We anticipate that this study may lead future projects to collect more detailed information about IDP processes, to enable conducting similar analyses about actual building performance.
Acknowledgements
The authors would like to acknowledge Building Management Technician Scott Yonkman for providing building information, Stantec Consulting, and Martina Soderlund for sharing design energy model information. Also, the help of Laura Fedoruk, and Alberto Cayuela throughout the study is appreciated. The study is funded by University Sustainability Initiative and Sustainable Building Science Program of UBC and Modern Green.
References
1 | AboulNaga, M.M. , & Elsheshtawy, Y.H. ((2001) ). Environmental sustainability assessment of buildings in hot climates: the case of the UAE. Renewable Energy, 24: (3-4), 553–563. |
2 | Akin, Ö. (2015). Necessity of cognitive modeling in BIM’s future. Building information modeling: BIM in current and future practice, 17-27. |
3 | Attia, S. , Hamdy, M. , O’Brien, W. , & Carlucci, S. ((2013) ). Assessing gaps and needs for integrating building performance optimization tools in net zero energy buildings design. Energy and Buildings, 60: , 110–124. |
4 | Attia, S. ((2012) ). A tool for design decision making: zero energy residential buildings in hot humid climates. Presses univ. de Louvain. |
5 | Attia, S. , Gratia, E. , De Herde, A. , & Hensen, J.L. ((2012) ). Simulation-based decision support tool for early stages of zero-energy building design. Energy and Buildings, 49: , 2–15. |
6 | Batueva, E. , & Mahdavi, A. ((2014) ). Assessment of a computational design environment with embedded simulation capability. EWork and EBusiness in Architecture, Engineering and Construction: ECPPM, 2014: , 197. |
7 | Brown, Z. , Cole, R.J. , & O’SHEA, M.E.G. , Robinson, J. (2009). New Expectations in Delivering Sustainable Buildings. Proceedings of PLEA 2009, 15-20. |
8 | Busby Perkins + Will Stantec Consulting. 2007. Roadmap for integrated design process. BC Green Building Roundtable. http://www.greenspacencr.org/events/IDProadmap.pdf. [Google Scholar] |
9 | Cavka, H.B. ((2010) ). Characterizing bottlenecks in building design coordination meetings, Master of Science Thesis in the Faculty of Graduate and Postdoctoral Studies (Civil Engineering), The University of British Columbia, Vancouver, BC, Canada. [Online] (accessed on May 28th, 2014). |
10 | Cavka, H.B. (2008-2009). CIRS IDP Meeting Minutes. |
11 | Cemesova, A. , Hopfe, C.J. , & McLeod, R.S. ((2015) ). PassivBIM: Enhancing interoperability between BIM and low energy design software. Automation in Construction, 57: , 17–32. |
12 | Chu, A.M. ((2016) ). Understanding the performance gap: an evaluation of the energy efficiency of three high-performance buildings in British Columbia (Doctoral dissertation, University of British Columbia) [Online] (accessed on Jun 15th, 2020). |
13 | CIRS IDP Report (12/27/08). |
14 | Centre for Interactive Research on Sustainability (CIRS) Energy Modeling Charrette Report (2008), Jul 2008. |
15 | Centre for Interactive Research on Sustainability (CIRS) Design Charrette Report (2008), Mar 2008. |
16 | Centre for Interactive Research on Sustainability (CIRS) Daylighting Charrette Report (2008), Jun 2008. |
17 | Centre for Interactive Research on Sustainability (CIRS) Water Charrette Report (2008), Jun 2008. |
18 | CIRS, Centre for interactive research on sustainability, University of British Columbia, Technical report, available at: www.cirs.ubc.ca/building/building-manual (accessed on May 28, 2014) |
19 | Cole, R.J. ((2015) ). Net-zero and net-positive design: a question of value. Building Research and Information, 43: , 1–6. |
20 | Cole, R.J. , Oliver, A. , & Robinson, J. ((2013) ). Regenerative design, socio-ecological systems and co-evolution. Building Research & Information, 41: (2), 237–247. |
21 | Coleman, S. , & Robinson, J.B. ((2018) ). Introducing the qualitative performance gap: stories about a sustainable building. Building Research & Information, 46: (5), 485–500. |
22 | Fedoruk, L. , Miller, D. , & Van Der Laan, M. (2012). CIRS Retrospective. IDEASS (Integrative Data-Enabled Approaches to Sustainability across Scales) Report, p. 15. |
23 | Fedoruk, L. , & Cole, R.J. ((2015) ). Shifting from net-zero tonet-positive energy buildings. Building Research andInformation, 43: , 111–120. |
24 | Fedoruk, L.E. ((2013) ), ‘Smart’ Energy Systems and Networked Buildings: Examining the Integrations, Controls, and Experience of Design through Operation, Master of Science Thesis in the Faculty of Graduate and Postdoctoral Studies (Resource Management and Environmental Studies), the University of British Columbia, Vancouver, BC, Canada. [Online] (accessed on May 28th, 2014) |
25 | Forgues, D. , & Iordanova, I. (2010). An IDP-BIM framework for reshaping professional design practices. In Construction Research Congress 2010: Innovation for Reshaping Construction Practice (pp. 172-182). |
26 | Georgiadou, M.C. , Hacking, T. , & Guthrie, P. ((2012) ). A conceptual framework for future-proofing the energy performance of buildings. Energy Policy, 47: , 145–155. |
27 | Gorgolewski, M. , Brown, C. , Chu, A.M. , Turcato, A. , Bartlett, K. , Ebrahimi, G. , ... Scannell, L. ((2016) ). Performance of sustainable buildings in colder climates. Journal of Green Building, 11: (4), 131–153. |
28 | Göçer, Ö. , Hua, Y. , & Göçer, K. ((2015) ). Completing the missing link in building design process: Enhancing post-occupancy evaluation method for effective feedback for building performance. Building and Environment, 89: , 14–27. |
29 | Gupta, R. , Gregg, M. , & Cherian, R. (2019). Developing a new framework to bring consistency and flexibility in evaluating actual building performance. International Journal of Building Pathology and Adaptation. |
30 | Iordanova, I. , & Forgues Daniel, C.F. (2011). Creation of an evolutive conceptual know-how framework for integrative building design. |
31 | Larsson, N. (2009). The integrated design process; history and analysis. International initiative for a sustainable built environment. |
32 | Kim, S.H. , & Nam, J. ((2020) ). Can both the economic value and energy performance of small-and mid-sized buildings be satisfied? development of a design expert system in the context of Korea. Sustainability, 12: (12), 4946. |
33 | Koch, C. , & Buhl, H. ((2013) ). Integrated Design Process” a Concept for Green Energy Engineering. Engineering, 5: , 292–298. |
34 | Landrum, N.E. , & Ohsowski, B. ((2018) ). Identifying worldviews on corporate sustainability: A content analysis of corporate sustainability reports. Business Strategy and the Environment, 27: (1), 128–151. |
35 | Lewis, M. (2004). Integrated Design for Sustainable Buildings. Building for the Future/ a Supplement to ASHRAE Journal, Sep 2004:22-30. |
36 | Lim, Y.W. , Majid, H.A. , Samah, A.A. , Ahmad, M.H. , & Ossen, D.R. ((2018) ). BIM and Genetic Algorithm optimisation for sustainable building envelope design. Building Information Systems in the Construction Industry, 159: . |
37 | Lu, Y. , Sood, T. , Chang, R. , & Liao, L. (2020). Factors impacting integrated design process of net zero energy buildings: an integrated framework. International Journal of Construction Management, 1-13. |
38 | Mallory-Hill, S. , & Gorgolewski, M. ((2018) ). Mind the Gap: Studying actual versus predicted performance of green buildings in Canada. In Building Performance Evaluation (pp. 261–274). Springer, Cham. |
39 | Miller, D. ((2012) ). Regenerative Design, An exploration of Process Practice and the Role of Planners, Master’s Graduating Project in SCARP (School of Community and Regional Planning), The University of British Columbia, Vancouver, BC, Canada. [Online] (accessed on May 28th, 2014) |
40 | Newsham, G.R. , Mancini, S. , & Birt, B.J. ((2009) ). Do LEED-certified buildings save energy? Yes, but”. Energy and Buildings, 41: (8), 897–905. |
41 | Ng, K.L.R. , Liao, Z. , Gorgolewski, M. , & Gurunlian, L. ((2011) ). Design of a Low-Energy Envelope System for An Apartment BuildingThrough an Integrated Design Process: A Case Study. Journal of Green Building, 6: (3), 106–132. |
42 | Østergård, T. , Jensen, R.L. , & Maagaard, S.E. ((2016) ). Building simulations supporting decision making in earlydesign–A review. Renewable and Sustainable EnergyReviews, 61: , 187–201. |
43 | Pearl, D. ((2004) ). An Integrated Design Process (IDP)”. The Canadian Architect, 49: (36), 32–35. |
44 | Perez-Lombart, L. , Ortiz, J. , & Pout, C. ((2008) ). A review on buildings energy consumption information”. Energy and Buildings, 40: (3), 394–398. |
45 | Pilon, A. , Madden, J. , Tansey, J. , & Metras, J. ((2020) ). Campus as a Living Lab: Creating a Culture of Research and Learning in Sustainable Development. In Teaching and Learning Strategies for Sustainable Development. Emerald Publishing Limited. |
46 | Pope, S. , & Tardif, M. (2011). Integrated Design Process: Planning and Team Engagement. (Report): An article from: ASHRAE Transactions. |
47 | Preiser, W.F. , White, E. , & Rabinowitz, H. ((2015) ), Post-Occupancy Evaluation (Routledge Revivals). Routledge. |
48 | Reed, W.G. , & Gordon, E.B. ((2010) ). Integrated design and building process: what research and methodologies are needed? Building Research & Information, 28: (5/6), 325–337. |
49 | Salehi, M.M. , Terim Cavka, B. , Frisque, A. , Whitehead, D. , & Bushe, W.K. , ((2015) a). A Case Study: the Energy Performance Gap of theCenter for Interactive Research on Sustainability at the Universityof British Columbia. Journal of Building Engineering, 4: , 127–139. |
50 | Salehi, M.M. , Frisque, A. , & Bushe, W.K. , (2015b) DID PURSUING LEED MAKE THE CIRS BUILDING MORE ENERGY EFFICIENT? Proceedings of BS2015 14th Conference of International Building Performance Simulation Association 2015, Hyderabad, India, Dec. 7-9, 2015. [Online] (accessed on Dec 27th, 2021). |
51 | Salehi, M.M. , Terim Cavka, B. , Fedoruk, L. , Frisque, A. , & Bushe, W.K. (2013), “Improving the Performance of a Whole-Building energy modeling tool by using post-occupancy measured data”, Proceedings of the 13th Conference of International Building Performance Simulation Association 2013, France. [Online] (accessed on Jun 15th, 2020). |
52 | Sanvido, V.E. , & Norton, K.J. ((1994) ). Integrated Design-Process Model. Journal of Management Engineering, 10: , 55–62. |
53 | Save, P. , Terim Cavka, B. , & Froese, T. ((2021) ). Evaluation and Lessons Learned from a Campus as a Living Lab Program to Promote Sustainable Practices. Sustainability, 13: (4), 1739. |
54 | Scofield, J.H. ((2013) ). Efficacy of LEED-certification in reducing energy consumption and greenhouse gas emission for large New York City office buildings. Energy and Buildings, 67: , 517–524. |
55 | Scofield, J.H. ((2009) ). Do LEED-certified buildings save energy, Notreally. . .. Energy and Buildings, 41: , 1386–1390. |
56 | Soderlund, M. , & Terim Cavka, B. (UBC, Vancouver, Canada). Personal communication, 2013. |
57 | Soderlund, M. , & Chu, A.M. (UBC, Vancouver, Canada). Personal communication/Interview, 2015. |
58 | Stevenson, F. , & Baborska-Narozny, M. ((2018) ). Housing performance evaluation: challenges for internationalknowledge exchange. Building Research & Information, 46: (5), 501–512. |
59 | Terim Cavka, B. , Salehi, M.M. , Frisque, A. , & Bushe, W.K. ((2014) ). “Comparing Design and As-Built Simulations with Actual Measurements for a Large, Multi-Use University Building” Proceedings of the Esim 2014 Conference of the International Building Performance Simulation Association Canada Chapter, Ottawa, Canada. [Online] (accessed on Jun 15th, 2020). |
60 | Thuesen, N. , Kirkegaard, P.H. , & Jensen, R.L. ((2010) ). Evalution of BIM and Ecotect for conceptual architectural design analysis. In Computing in Civil and Building Engineering, Proceedings of the International Conference: 30 June-2 July, Nottingham, UK. University of Nottingham. |
61 | Todesco, G. (2004). Integrated Designs and HVAC Equipment Sizing. Building for the Future/ a Supplement to ASHRAE Journal, Sep 2004:42-46. |
62 | Torcellini, P. , et al. ((2004) ), “Lessons learned from the field evaluation of six high-performance buildings” Proceedings of the 2004 ACEEE Summer Study, Washington DC: ACEEE. |
63 | Turner, C. , & Frankel, M. ((2008) ). “Energy Performance of LEED for New Construction Buildings”, New Buildings Institute. |
64 | Turner, C. ((2006) ). “LEED Building Performance in the Cascadia Region: A Post Occupancy Evaluation Report”. Cascadia Green Building Council. |
65 | Waage, S.A. ((2007) ). Re-considering product design: a practical “road-map” for integration of sustainability issues. Journal of Cleaner production, 15: (7), 638–649. |
66 | Yamagata, Y. , Yoshida, T. , Chang, S. , Jittrapirom, P. , Coleman, S. , Robinson, J.B. , ... Neumann, D. ((2020) ). Case studies toward smart communities. In Urban Systems Design (pp. 257–288). Elsevier. |
67 | Zanni, M. , Sharpe, T. , Lammers, P. , Arnold, L. , & Pickard, J. ((2019) ). Standardization of whole life cost estimation for early design decision making utilizing BIM. In Advances in Informatics and Computing in Civil and Construction Engineering (pp. 773–779). Springer, Cham. |
68 | Zimmerman, A. , & Eng, P. ((2006) ), Integrated design process guide. Ottawa, ON: Canada Mortgage and Housing Corporation. |
Author Biographies
Dr. Belgin Terim Cavka is an Assistant Professor at Interior Architecture and Environmental Design Department, Yaşar University, Izmir Turkey since 2018. She is a sustainability specialist has a background on energy efficient design and building physics. She worked as a data analyst for as-built energy models for high-performance sustainable buildings through her post-doctoral research career at UBC, Mechanical Engineering as a Sustainable Building Science (SBSP) trainee. Her research interests vary in the field of sustainability and energy efficient design from passive design strategies (Natural Ventilation & Adaptive Thermal Comfort) to data analysis, Measurement and Verification (M&V) of actual performance, energy modeling, CFD modeling, Integrated Design Process (IDP) subjects.
Dr. Hasan B. Cavka is an Assistant Professor at Izmir Institute of Technology, Izmir Turkey. He is a BIM and construction management specialist. His research interests are Building Information Modeling (BIM), Virtual Design and Construction (VDC), Integrated Project Delivery (IPD), design and construction coordination, 4D construction simulation, BIM requirements identification, BIM compliance review.
Dr. M. Mahdi Salehi is an Assistant Professor at Sharif University, Tehran, Iran. He is an aerospace engineer, who worked on high performance buildings energy analysis through his post-doc career. His research interests are combustion modeling, turbulent flows, computational fluid dynamics (CFD), and energy modeling of complex high performance systems.
Notes
1 Content analysis is a type of textual analysis that studies the messages or characteristics of a text to interpret meaning. This conceptual analysis approach identifies the frequency of concepts, such as words or phrases. Content analysis is a methodology that has been used by others to study corporate sustainability and CSR reports (Landrum et al., 2018)

