
Listener Detection of Objectively Validated Acoustic Features of Speech in Huntington’s Disease
Abstract
Background:
Subtle progressive changes in speech motor function and cognition begin prior to diagnosis of Huntington’s disease (HD).
Objective:
To determine the nature of listener-rated speech differences in premanifest and early-stage HD (i.e., PreHD and EarlyHD), compared to neurologically healthy controls.
Methods:
We administered a speech battery to 60 adults (16 people with PreHD, 14 with EarlyHD, and 30 neurologically healthy controls), and conducted a cognitive test of processing speed/visual attention, the Symbol Digit Modalities Test (SDMT) on participants with HD. Voice recordings were rated by expert listeners and analyzed for acoustic and perceptual speech features.
Results:
Listeners perceived subtle differences in the speech of PreHD compared to controls, including abnormal pitch level and speech rate, reduced loudness and loudness inflection, altered voice quality, hypernasality, imprecise articulation, and reduced naturalness of speech. Listeners detected abnormal speech rate in PreHD compared to healthy speakers on a reading task, which correlated with slower speech rate from acoustic analysis and a lower cognitive performance score. In early-stage HD, continuous speech was characterized by longer pauses, a higher proportion of silence, and slower rate.
Conclusion:
Differences in speech and voice acoustic features are detectable in PreHD by expert listeners and align with some acoustically-derived objective speech measures. Slower speech rate in PreHD suggests altered oral motor control and/or subtle cognitive deficits that begin prior to diagnosis. Speakers with EarlyHD exhibited more silences compared to the PreHD and control groups, raising the likelihood of a link between speech and cognition that is not yet well characterized in HD.
INTRODUCTION
Huntington’s disease (HD) is a hereditary neurodegenerative disorder characterized by motor dysfunction, cognitive dementia, and psychiatric disturbances [1, 2]. Dysarthria is common in people with HD [3]. Subtle changes in speech can be detected prior to a clinical diagnosis of HD, which are thought to be subtle and so far have only been detected using computational acoustic analysis software [4–6]. Objective acoustic variables to measure slight deviations in speech performance [7]. Whether speech differences in the premanifest phase of HD (PreHD) can be detected by human listeners has not yet been studied [8]. Given that voice and speech production is multi-dimensional, a more complete account of vocal functions requires a combination of subjective auditory-perceptual evaluation (i.e., listener ratings) and objective acoustic analysis [9–11].
An auditory-perceptual assessment is a formalized method used by expert listeners (i.e., speech pathologists) to describe the nature and degree of deviation of a speaker’s speech and voice quality from expected norms. Perceptual reports of symptomatic HD indicate deficits in phonatory, prosody, respiratory, and resonance subsystems of speech production [3, 12–15]. Findings regarding the nature and degree of speech impairment at each symptomatic HD stage (i.e., early, middle, late HD) are varied and inconsistent due to mixed study design and methods [8]. It should be noted that auditory-perceptual evaluation is commonly used as a clinical voice assessment method and for documentation of voice disorders, but the perceptual and subjective nature of voice quality can limit inter- and intra-listener reliability [11]. Auditory-perceptual assessment, therefore, is often accompanied with computational acoustic speech analysis when evaluating voice samples.
The acoustic properties and perceptual features of speech in HD have been examined with other clinical measures such as cognition [4, 5, 16]. Deterioration in cognitive functions, most commonly processing speed and attentional deficits, have been recognized as a reliable clinical sign of disease onset in PreHD [17–20]. Irregularity in vocal fold vibration patterns correlate with lower cognitive scores derived from subtests in the Unified Huntington’s Disease Rating Scale (UHDRS) [21], including the phonemic verbal fluency test, Symbol Digit Modalities Test (SDMT), Stroop color, Stroop word, and Stroop interference subtests [22]. There is, however, no information on how these cognitive scores relate to speech measures that require relatively greater cognitive-linguistic processing (e.g., speech rate and pauses).
The primary goal of this study was to determine whether subtle speech changes in PreHD were audible to expert listeners, by comparing speech in PreHD to healthy controls and people with EarlyHD. Our analysis included perceptual domains, rated by listeners, specifically articulation, voice quality, resonance, prosody, naturalness, and intelligibility, as well as speech-timing measures, which we analyzed acoustically. Finally, we examined the relationship between speech and cognitive performances.
MATERIALS AND METHODS
Subjects
Sixty participants were recruited (30 people with HD CAG expansion and 30 age-matched healthy controls). Potential controls were excluded if they reported a history of neurological, speech or language disorder. Potential HD participants were excluded if they presented with: any other neurological disease other than HD; clinical symptoms other than that resulting from HD; a history of communication disorder; a history of alcohol or drug abuse; or a history of learning disability and/or intellectual impairment. Two groups of participants with the HD CAG expansion (16 people with PreHD and 14 people with EarlyHD) were recruited from Monash University Huntington’s Disease Registry, St George’s Health Service Huntington’s Disease Clinic and Huntington’s Victoria, Australia. Due to differences in average age in the PreHD and EarlyHD groups, from our overall control sample, we divided controls into two age-matched groups (Control-A and Control-B). We computed disease burden scores (DBS) using a formula (age x [CAG repeat –35.5]) for CAG-expanded participants, which correlates pathological progression and striatal damage [23] (see Table 1 for clinical characteristics of HD participants).
Table 1
Characteristics of participants with PreHD and EarlyHD
| PreHD (n = 16) | EarlyHD (n = 14) | |
| Male (%) | 6 (38%) | 8 (57%) |
| Age range, mean (SD) | 25–71 (42.1, 11.5) | 43–73 (56.9, 10.4) |
| Education –ISCED, mean (SD) | 4.08 (0.31) | 3.44 (0.33) |
| CAG repeat number, mean (SD) | 42.9 (2.8) | 42.6 (2.1) |
| DBS, mean (SD) | 300.4 (103.4) | 389.3 (62.7) |
| UHDRS-TMS, mean (SD) | 5.6 (7.2) | 34.9 (13.4) |
| UHDRS-TMS (range, median) | 0–25 (3.5) | 11–61 (31) |
| UHDRS DCL mean (SD) | 0.8 (0.8) | 4.0 (0) |
| UHDRS DCL (range, median) | 0–2 (1) | 4-4 (4) |
| Oral Symbol Digit Modalities Test correct, mean, (SD) | 52.6 (16.5) | 44.1 (18.5) |
ISCED, International Standard Classification of Education; DBS, disease burden scores; UHDRS-TMS, United Huntington’s Disease Rating Scale total motor score; SD, standard deviation; DCL, Diagnostic confidence level.
The PreHD group consisted of people who were genetically confirmed to have the HD CAG expansion (39 repeats or more), but had not yet displayed motor signs sufficient to warrant a clinical diagnosis of HD. Diagnostic confidence levels (DCLs) are based on administration of the United Huntington’s Disease Rating Scale (UHDRS) and are aligned with the confidence a clinician has in diagnosing HD in a particular participant (0 = no abnormalities; 1 = non-specific motor abnormalities; 2 = motor abnormalities that may be signs of HD (50–89% confidence); 3 = motor abnormalities that are likely signs of HD (90–98% confidence); and 4 = motor abnormalities that are unequivocal signs of HD) [21]. Classification of PreHD was based on DCL≤3. The PreHD group was age-matched to 16 healthy participants without neurological disorders in Control-A group (age range 25 to 72 years, mean = 42.38, SD = 12.09, male = 44%) for comparison (Table 1). PreHD and Control-A groups were similar in age (p = 0.98). The EarlyHD group included 14 symptomatic participants with DCL of 4 as assessed by a neurologist specialized in movement disorders. EarlyHD group was age-matched to 14 neurologically healthy individuals in Control-B group (Control-B: age range 41 to 71, mean age = 56.29, SD = 10.32, male = 64%) (Table 1). The EarlyHD and Control-B groups were also similar in age (p = 0.95). The International Standard Classification of Education (ISCED) was used to compare educational levels and related qualification levels between participant groups (PreHD: mean = 4.08, SE = 0.31; EarlyHD: mean = 3.44, SE = 0.33; Control: mean = 4.36, SE = 0.25) [24]. There was no significant difference on ISCED mean values be-tween participant groups.
Materials and stimuli
A formalized speech battery was administered with each participant individually in a quiet setting. All participants were asked to (i) sustain a vowel sound /a/, (ii) read aloud a phonetically balanced passage –The Grandfather passage [25], and (iii) produce a monologue. The order of the speech tasks administered was consistent across all participants. The three speech tasks and corresponding acoustic measures have known stability, reliability and sensitivity with repeated exposure and application of the stimuli (i.e., practice effects) [26]. Speech samples were recorded using a laptop computer (PC) (Hewlett-Packard, Palo Alto, CA) with basic factory settings and a Sennheiser PC 135 USB unidirectional head-mounted microphone (Sennheiser Communications, Solrød Strand, Denmark) (minimum sensitivity of –38 dB and a frequency range of 80 Hz–15 kHz), which was positioned at a 45 angle, 8 cm from the mouth [27]. All the data were sampled at 44.1 kHz, coupled with quantization at 16 bits. Data were recorded and segmented using Audacity software (version 1.2.6). In addition to perceptual evaluation of speech and voice, we used an automated script to conduct acoustic analysis, including speech-timing measures for the reading and monologue tasks (See Table 2 for Descriptions of speech-timing measures). The automated script identified the silence intensity contour using a modified version of techniques published previously [28, 29]. Pause sections that were shorter than 15 ms were classified as speech and concatenated with the adjacent speech sections. Speech sections that were shorter than 30 ms were classed as pauses and concatenated with the adjacent pauses [29]. We also removed interjections (i.e., throat clearing, fillers) as part of the pre-processing procedure of speech samples. Detailed explanation of the specific acoustic methodologies adopted in this study can be sourced from previous published papers [26, 28–30].
Table 2
Descriptions of speech-timing measures in connected speech tasks
| Speech -timing measures | Description | |
| Mean silence length | Pause (mean) | Average length of silence in sample in milliseconds (ms) |
| Variation of silence length | Pause (SD) | Standard deviation or variance of mean pause or silence length |
| Percentage of silence | Silence (%) | Proportion of silence in relation to amount of speech within a sample: total speech time/total silence time x100; silence removed from start and end of samples prior to analysis |
| Speech rate | Syllable/second | Rate of speech calculated by the number of syllables per second divided by duration of sample |
Blinded expert listeners (perceptual) ratings of speech
Three speech-language pathologists rated speech samples of sustained vowel and reading tasks perceptually. These raters were practicing speech pathologists with Masters qualification and/or PhDs, with more than 8 years of clinical experience. The raters were blinded to participant group clinical status, age of participants, and other rater’s scores. Raters evaluated speech samples using a five-point scale modified from the Mayo Dysarthria Rating Scale (0, normal; 1, subclinical; 2, mild; 3, moderate; 4, severe impairment) across 22 perceptual speech features across pitch, loudness, voice quality, resonance, prosody and articulation sub-systems [31, 32]. Summative measures of intelligibility (ability to be understood) and naturalness (deviation from healthy norm) were also rated using the same scale. Each participant’s speech was given a rating based on all their speech samples. Where there was disagreement between raters, a consensus was reached through discussion.
Cognitive assessment
All participants with the expanded HD gene completed the oral version of the Symbol Digit Modalities Test (SDMT) [33] for an assessment of attention, executive function, visual scanning, tracking, and processing speed. Participants were given a 90 second limit to say the number corresponding to a series of abstract symbols, as rapidly as possible, as per the coding key. Scoring was based on the number of correct responses out 110.
Statistical analysis
The degree of agreement was calculated between raters using a Two-Way Random Consistency intraclass correlation coefficient (ICC 2, 1). Listener-based perceptual speech ratings were analyzed by a nonparametric test of gamma coefficient, which investigated the link between groups (PreHD, EarlyHD, Control-A, Control-B) and judgements of speech impairment severity (normal, sub-clinical, mild, moderate, severe). We used the Spearman Rank method to examine the degree of association between perceptual ratings and acoustic outcomes.
For the statistical analysis of acoustic data, we used the Levene’s test to assess equality of variances between groups in their acoustic speech outcomes. Results from the Levene’s test revealed equal variances between groups. A one-way analysis of variance (ANOVA) was then used to evaluate speech-timing differences between the three independent groups (PreHD vs. Control-A, EarlyHD vs. Control-B, PreHD vs. EarlyHD). All statistical analyses were performed using Statistical Package for the Social Science (SPSS Statistics 26).
RESULTS
Auditory-perceptual profile of speech in PreHD and EarlyHD
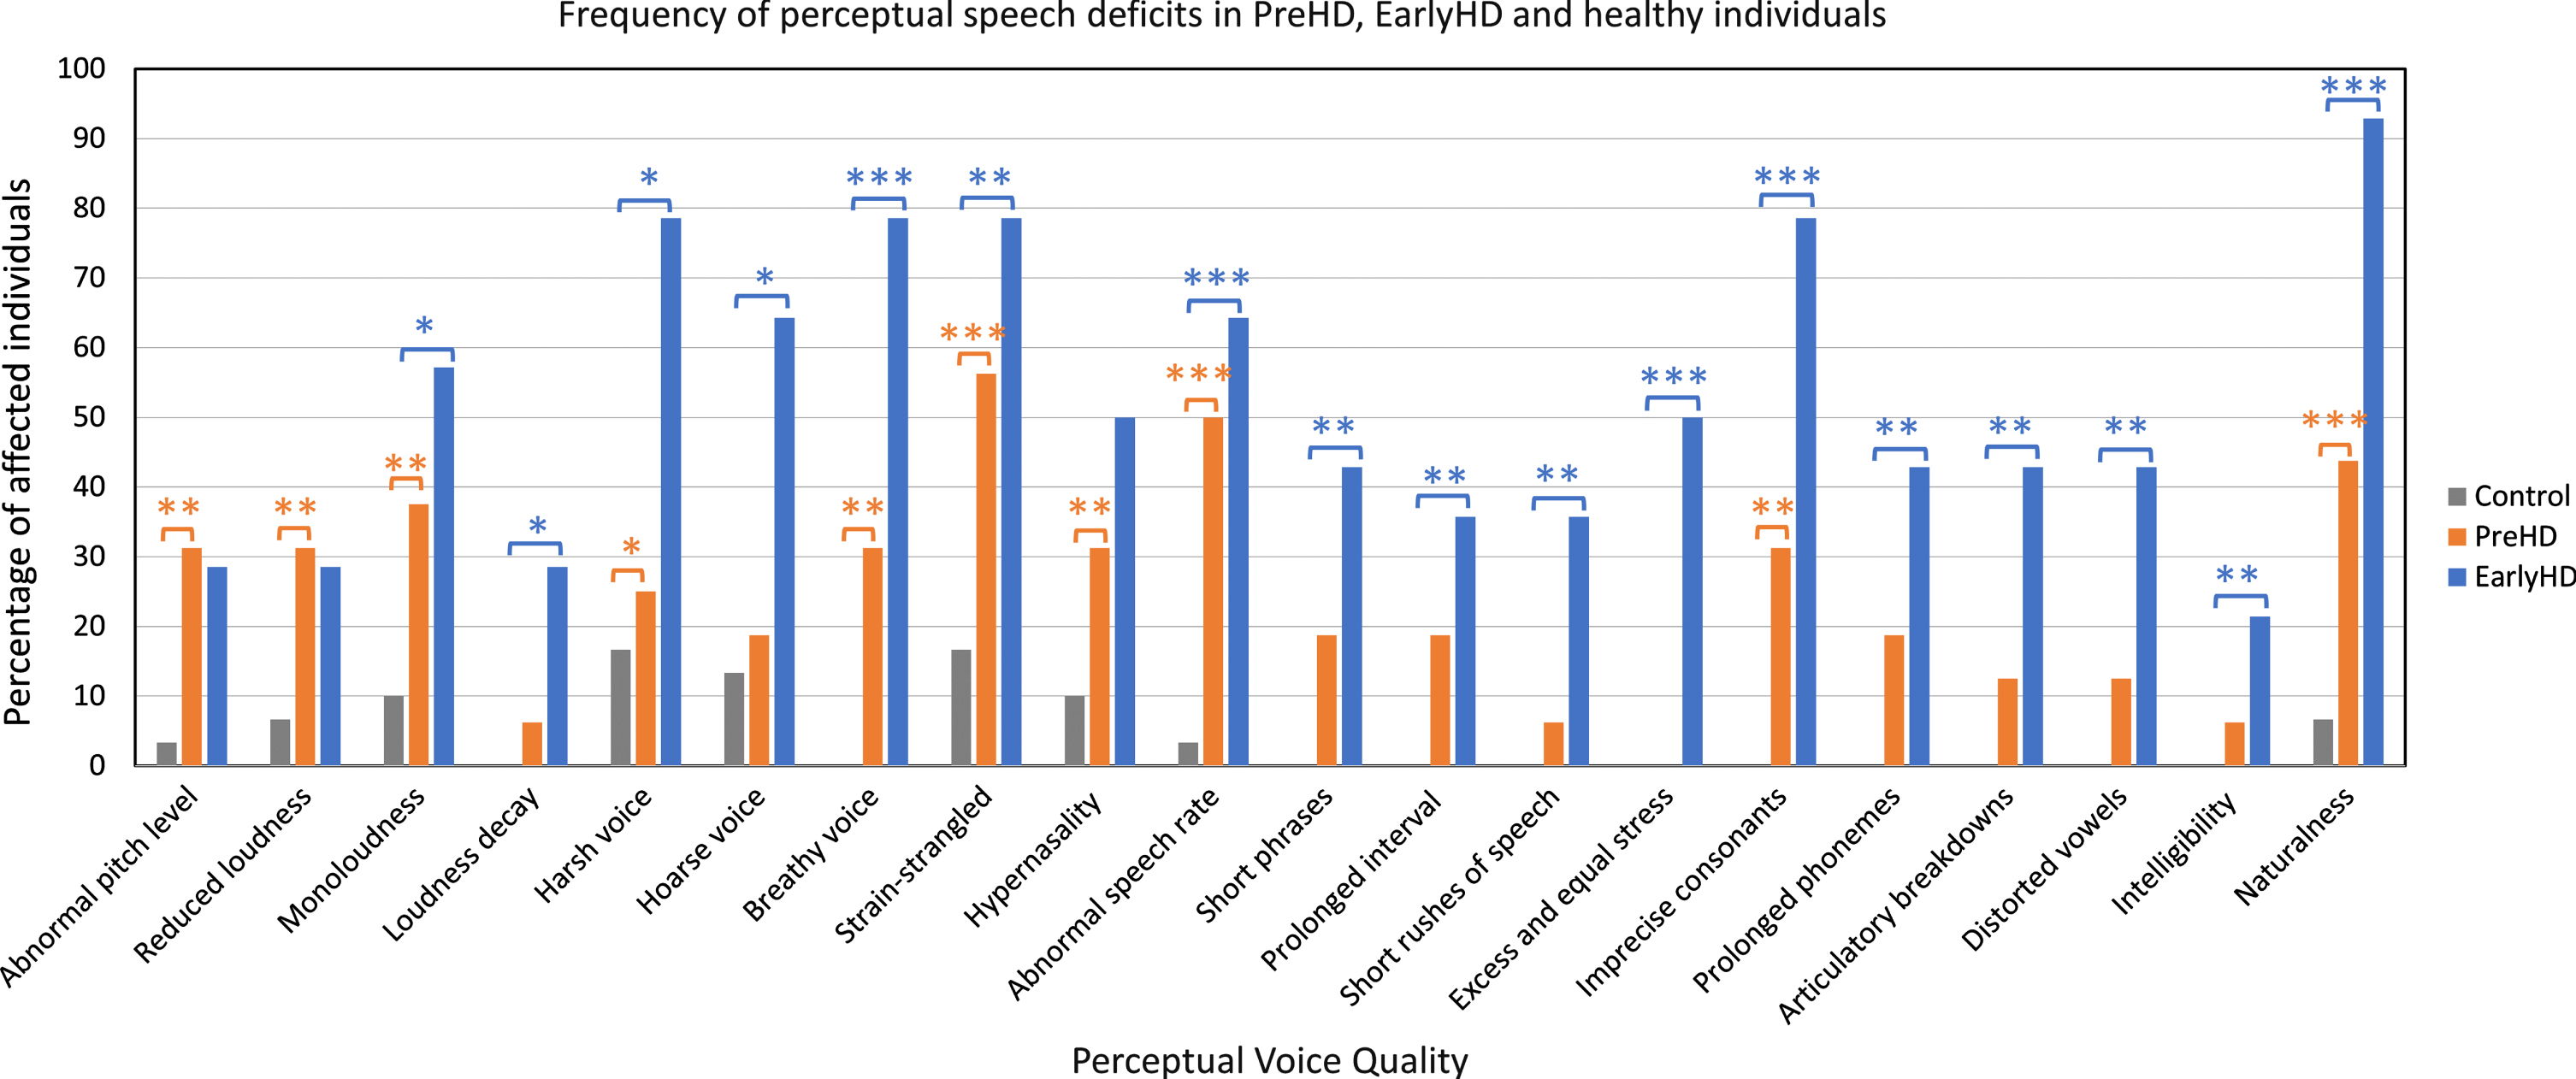
Agreement between raters was 72.2% (ICC =0.72). Perceptually, speakers in the PreHD group exhibited abnormal pitch level (p = 0.007), reduced loudness (p = 0.007), dysphonic voice quality (p < 0.05), hypernasality (p = 0.007), abnormal speech rate (p < 0.001), imprecise articulation (p = 0.007), and reduced naturalness of speech (p = 0.004) compared to their age-matched control group (Table 3). Most of these speech deviations were perceived at the sub-clinical level rather than clinically dysarthric (i.e., mild to severe). Speakers in the EarlyHD group demonstrated mild-to-moderate dysarthric features in their speech, including unchanged or gradual reduction in loudness (p < 0.01), dysphonic voice quality such as harsh, hoarse, breathy, and strained voice quality (p < 0.05), abnormal prosody (p < 0.01), and articulatory breakdowns and speech-sound distortions (p≤0.001) compared to their matched-control group (Table 3). Overall, speech in EarlyHD was less intelligible (p = 0.005) and less natural (p < 0.001) compared to PreHD and healthy control groups (see Fig. 1). Table 3 shows statistical comparison outcomes and Supplementary Table 1 presents raw data on listener-based speech rating.
Table 3
Comparison of perceptual characteristics between HD and controls groups
| Gamma test for significance | |||
| Perceptual feature | Control-A vs. PreHD | Control-B vs. EarlyHD | PreHD vs. EarlyHD |
| Pitch | |||
| Abnormal pitch level | 0.007** | 0.12 | 0.87 |
| Pitch break | 0.54 | 0.25 | 0.48 |
| Voice tremor | 0.13 | 0.35 | 0.27 |
| Loudness | |||
| Increased loudness | 1.00a | 0.13 | 0.13 |
| Reduced loudness | 0.007** | 0.35 | 0.87 |
| Monoloudness | 0.002** | 0.02* | 0.25 |
| Loudness decay | 0.30 | 0.02* | 0.09 |
| Voice quality | |||
| Harsh voice | 0.02* | 0.04* | < 0.001*** |
| Hoarse voice | 0.06 | 0.03* | 0.003** |
| Breathy voice | 0.007** | < 0.001*** | 0.001** |
| Strain voice | < 0.001*** | 0.002** | 0.06 |
| Resonance | |||
| Hypernasality | 0.007** | 0.05 | 0.16 |
| Hyponasality | 0.28 | 0.05 | 0.79 |
| Prosody | |||
| Abnormal speech rate | < 0.001*** | < 0.001*** | 0.24 |
| Short phrases | 0.06 | 0.001** | 0.12 |
| Prolonged interval | 0.06 | 0.005** | 0.32 |
| Short rushes of speech | 0.30 | 0.005** | 0.03* |
| Excess and equal stress | 1.00a | < 0.001*** | < 0.001*** |
| Articulation | |||
| Imprecise consonants | 0.007** | < 0.001*** | 0.003** |
| Prolonged phonemes | 0.06 | 0.001** | 0.09 |
| Articulatory breakdowns | 0.13 | 0.001** | 0.03* |
| Distorted vowels | 0.13 | 0.001** | 0.05 |
| Intelligibility | 0.30 | 0.005** | 0.21 |
| Naturalness | < 0.001*** | < 0.001*** | < 0.001*** |
aStatistical significance could not be calculated because perceptual ratings between groups were the same or constant, therefore, the comparison between groups were not significantly different from each other. *p < 0.05; **p≤0.01; ***p≤0.001 at α= 0.05 level.
Fig. 1
Frequency of speech deficits (in percentages) across PreHD, EarlyHD, and control participants based on perceptual assessment. aParticipants from Control-A and Control-B were combined in Fig. 1 (n = 30). Significant difference between PreHD and control groups: *p < 0.05; **p≤0.01; ***p≤0.001. Significant difference between EarlyHD and control groups: *p < 0.05; **p≤0.01; ***p≤0.001.
Computational acoustic analysis indicated the rate of speech on reading tasks significantly differed between the PreHD group and healthy control group. The effect of group on speech rate in PreHD suggested that the reduced rate of speech was related to disease stage (p < 0.001) (Table 4). In addition to reduced speech rates, people with EarlyHD demonstrated longer pauses and a higher proportion of silence compared to the PreHD and control groups on reading and monologue tasks (p > 0.05) (Table 4). PreHD and control groups performed better than EarlyHD group on oral SDMT (p < 0.001). Faster speech rate on the reading task correlated with higher oral SDMT score (PreHD: r = 0.72, p = 0.01; EarlyHD: r = 0.54, p = 0.04). The relationships between perceptual and acoustic features of speech-timing, and between SDMT and acoustic speech outcomes are described in Supplementary Tables 2 and 3.
Table 4
Group comparisons on speech-timing measures in reading and monologue tasks
| Measure | Task | Mean (SD) | ANOVA | ||||||||
| Control-Aa | PreHD | Control-Bb | EarlyHD | Control-A vs. PreHD | Control-B vs. EarlyHD | PreHD vs. EarlyHD | |||||
| MD (SE) | p (CI) | MD (SE) | p (CI) | MD (SE) | p (CI) | ||||||
| Pause (mean) | Reading | 0.12 (0.02) | 0.14 (0.05) | 0.15 (0.07) | 0.20 (0.05) | –0.03 (0.02) | 0.12 (–0.06, 0.01) | –0.05 (0.02) | 0.011 (–0.09, –0.01) | –0.06 (0.02) | 0.003 (–0.09, –0.02) |
| Pause (SD) | Reading | 0.16 (0.04) | 0.17 (0.08) | 0.19 (0.09) | 0.23 (0.08) | –0.01 (0.03) | 0.62 (–0.07, 0.04) | –0.05 (0.03) | 0.09 (–0.10, 0.01) | –0.06 (0.03) | 0.03 (–0.11, –0.01) |
| % Silence | Reading | 23.25 (5.07) | 22.28 (5.04) | 23.12 (5.14) | 27.95 (5.63) | 0.97 (1.84) | 0.60 (–2.72, 4.66) | –4.83 (1.97) | 0.02 (–8.77, –0.88) | –5.67 (1.91) | 0.004 (–9.49, –1.85) |
| Speech rate | Reading | 5.02 (0.59) | 3.61 (0.65) | 4.32 (0.93) | 2.87 (0.66) | 1.41 (0.25) | < 0.001 (0.9, 1.91) | 1.45 (0.27) | < 0.001 (0.91, 1.99) | 0.74 (0.26) | 0.006 (0.22, 1.26) |
| Pause (mean) | Monologue | 0.14 (0.10) | 0.19 (0.15) | 0.16 (0.06) | 0.23 (0.08) | –0.04 (0.04) | 0.28 (–0.11, 0.03) | –0.07 (0.04) | 0.08 (–0.15, 0.01) | –0.04 (0.04) | 0.26 (–0.12, 0.03) |
| Pause (SD) | Monologue | 0.17 (0.12) | 0.27 (0.30) | 0.20 (0.07) | 0.26 (0.10) | –0.10 (0.06) | 0.13 (–0.22, 0.03) | –0.07 (0.07) | 0.31 (–0.20, 0.07) | 0.01 (0.07) | 0.94 (–0.13, 0.14) |
| % Silence | Monologue | 24.31 (10.77) | 27.27 (10.46) | 21.90 (6.31) | 32.31 (8.85) | –2.95 (3.31) | 0.38 (–9.59, 3.68) | –10.42 (3.54) | 0.005 (–17.51, –3.32) | –5.05 (3.43) | 0.15 (–11.92, 1.82) |
MD, mean difference; SE, standard error; 95% CI, 95% confidence interval. aPreHD group: age range 25 to 71 (mean = 42.06, SD = 11.50). Control-A group: age range 25 to 72 (mean = 42.38, SD = 12.09). bEarlyHD group: Age range 43 to 73 (mean = 56.86, SD = 10.2). Control-B group: age range 41 to 71 ((mean = 56.29, SD = 10.32).
DISCUSSION
Subtle but perceptible differences in speech were detected by expert listeners in PreHD. Most of the speech differences detected in PreHD were not severe enough to warrant a diagnosis of dysarthria and were considered subclinical. Subclinical differences were observed across the phonation, resonance, and prosody speech domains. Perceptually, speech in PreHD was characterized by subtle reductions and less variation in pitch and loudness, abnormal speech rate, changes in voice quality, hypernasality, and imprecise articulation. Subjective observations of slowed speech rate were in line with objective speech-timing outcomes from acoustic analytics.
Speech in EarlyHD was characterized by sub-clinical to mild deficits across most perceptual features of speech production, including loudness, voice quality, resonance, articulation, speech intelligibility, and naturalness. Subjective observations of slowed speech were in line with objective speech-timing outcomes from acoustic analytics. On the monologue task, the EarlyHD group also demonstrated a higher percentage of silence compared to the control group. Acoustic findings in our study were consistent with results from a previous study investigating speech rate and silence ratio on a reading task [34]. It is notable that some perceptual speech features were rated as more severely impacted in the PreHD group compared to the EarlyHD group (e.g., reduced loudness, abnormal pitch level). In these instances, the variability in severity ratings may reflect individual differences in the HD population. It may also indicate that difference domains of performance may progress differently in participants with PreHD and Early HD. For example, motor deficits and decline in daily living skills are present in participants with EarlyHD, but speech might not have progressed linearly to these other symptoms or domains in some participants. Overall, findings from the current study showed that the occurrence of dysarthric features was much lower in the PreHD group compared to the EarlyHD.
The link between cognition and speech-timing in HD
Slower speech rate in participants with the HD gene expansion is associated with a common cognitive measure known for its sensitivity in HD, the SDMT, suggesting that speech rate declines in parallel with cognitive decline in HD. Another study investigating people with multiple sclerosis have also reported similar association between cognitive functions and variances in speech-timing using the Minimal Assessment of Cognitive Function [35]. Slower speech rate is also observed in prodromal idiopathic rapid eye movement (REM) sleep behavior disorder, which is associated with a higher risk of cognitive impairment [36]. In the HD population, PreHD can manifest in deficits of executive function, involving working memory and cognitive control [19, 37, 38]. Data from the PREDICT-HD study suggests that several cognitive measures track disease progression in PreHD [37]. Speech production involves various cognitive-linguistic processes such as lexical (word) processing, syntax system (grammar) processing, and phonemes (speech sounds) encoding [39, 40]. Cognitive decline, specifically cognitive processes theorized to be involved in linguistic planning and formulation such as verbal working memory and attention [41–43], may negatively compromise speech-timing performance in speakers with PreHD and EarlyHD.
Limitations
Future research is needed in HD to distinguish how speech production relates independently to the motor and cognitive changes occurring in HD. The procedure for eliciting responses in the oral SDMT presents a challenge for individuals with a real or potential speech impairment, as they are required to respond to a timed test orally which in turn is likely to influence their performance [44, 45]. Given that performance on oral cognitive tasks is thought to be independent from oral motor control, the precise impact of cognition versus oral motor execution on cognitive task performance requires further delineation. Future studies should mitigate the impact of oral motor control in neuropsychological testing, as well as designing a more comprehensive test battery to measure specific cognitive domains other than attention and processing speed from the oral SDMT, such as executive function. Other cognitive tools that include both accuracy and speed of performance might be beneficial, accuracy of performance should not be impacted by oral motor or fine motor control in upper limb movement. Future studies can also evaluate the relationship between speech and cognition in healthy controls which could present differently compared to the HD population.
Another limitation of the study relates to the potential effect of mental health disorders on speech rate. Depression is one of the most common psychiatric symptoms in HD and it can occur in the premanifest phase of HD [46–48]. Individuals with depression and anxiety have shown to display slower speech rate and increased pauses [49], yet prevalence of depression was not measured in this study.
CONCLUSION
The present study provides a comprehensive listener-based description of speech and voice characteristics of individuals with PreHD. Early changes in speech are detectable by expert listeners and these subtle differences could present potential treatment targets. Early speech intervention may include compensatory approaches such as communication partner training or implementation of communication strategies for people with PreHD. Treatments may aim to maintain or improve intelligibility, naturalness of speech characteristics, and maximize the effectiveness of the individual’s communication. Our findings of audible, premanifest speech changes also highlight the sensitivity of some cognitive-linguistic processes and/or motor speech control to disease stage. Researchers and clinicians may become more aware of specific audible signs in people with PreHD and consider speech as multidimensional marker of disease. Future investigations on the link between cognition and speech production may provide insight into the etiology of speech symptom in PreHD, differentiating deficits arising from cognitive-linguistic processes versus motor speech constraints.
ACKNOWLEDGMENTS
Prof Vogel is funded by National Health and Medical Research Council, Australia Dementia Fellowship (#1135683). Prof Julie Stout is funded by a National Health and Medical Research Council, Australia, Investigator Grant (#1173472)
CONFLICT OF INTEREST
Prof. Vogel is the Chief Science Officer of Redenlab, speech biomarker company. No other authors have any conflicts of interest to report
SUPPLEMENTARY MATERIAL
[1] The supplementary material is available in the electronic version of this article: https://dx.doi.org/10.3233/JHD-210501.
REFERENCES
[1] | Kremer B , Goldberg P , Andrew SE , Theilmann J , Telenius H , Zeisler J , et al. A worldwide study of the Huntington’s disease mutation: The sensitivity and specificity of measuring CAG repeats. N Engl J Med. (1994) ;330: (20):1401–6. |
[2] | MacDonald ME , Ambrose CM , Duyao MP , Myers RH , Lin C , Srinidhi L , et al. A novel gene containing a trinucleotide repeat that is expanded and unstable on Huntington’s disease chromosomes. Cell. (1993) ;72: :971–83. |
[3] | Hartelius L , Carlstedt A , Ytterberg M , Lillvik M , Laakso K . Speech disorders in mild and moderate Huntington disease: Results of dysarthria assessments of 19 individuals. J Med Speech Lang Pathol. (2003) ;11: (1):1–14. |
[4] | Kaploun LR , Saxman JH , Wasserman P , Marder K . Acoustic analysis of voice and speech characteristics in presymptomatic gene carriers of Huntington’s disease: Biomarkers for preclinical sign onset? J Med Speech Lang Pathol. (2011) ;19: (2):49–63. |
[5] | Vogel AP , Shirbin C , Churchyard AJ , Stout JC . Speech acoustic markers of early stage and prodromal Huntington’s disease: A marker of disease onset? Neuropsychologia (2012) ;50: (14):3273–8. |
[6] | Skodda S , Grönheit W , Lukas C , Bellenberg B , von Hein SM , Hoffmann R , et al. Two different phenomena in basic motor speech performance in premanifest Huntington disease. Neurology. (2016) ;86: (14):1329. |
[7] | Kreiman J , Gerratt BR , Kempster GB , Erman A , Berke GS . Kreiman Perceptual Evaluation of Voice Quality: Review, tutorial, and a framework for future research. J Speech Hear Res. (1993) ;36: (1):21–40. |
[8] | Chan JCS , Stout JC , Vogel AP . Speech in prodromal and symptomatic Huntington’s disease as a model of measuring onset and progression in dominantly inherited neurodegenerative diseases. Neurosci Biobehav Rev. (2019) ;107: :450–60. |
[9] | Bhuta T , Patrick L , Garnett JD . Perceptual evaluation of voice quality and its correlation with acoustic measurements. J Voice. (2004) ;18: (3):299–304. |
[10] | Piccirillo JF , Painter C , Haiduk A , Fuller D , Fredrickson JM . Assessment of two objective voice function indices. Ann Otol Rhinol Laryngol. (1998) ;107: (5):396–400. |
[11] | Oates J . Auditory-perceptual evaluation of disordered voice quality: Pros, cons and future directions. Folia Phoniatr Logop. (2009) ;61: :49–56. |
[12] | Zwirner P , Murry T , Woodson GE . Phonatory function of neurologically impaired patients. J Commun Disord. (1991) ;24: :287–300. |
[13] | Novotny M , Rusz J , Cmejla R , Ruzickova H , Klempir J , Ruzicka E . Hypernasality associated with basal ganglia dysfunction: Evidence from Parkinson’s disease and Huntington’s disease. PeerJ. (2016) ;4: :2530. |
[14] | Zwirner P , Barnes GJ . Vocal tract steadiness: A measure of phonatory and upper airway motor control during phonation in dysarthria. J Speech Lang Hear Res. (1992) ;35: (4):761–8. |
[15] | Diehl SK , Mefferd AS , Lin YC , Sellers J , McDonell KE , de Riesthal M , et al. Motor speech patterns in Huntington disease. Neurology. (2019) ;93: (22):e2042–e52. |
[16] | Rusz J , Klempir J , Tykalova T , Baborova E , Cmejla R , Ruzicka E , et al. Characteristics and occurrence of speech impairment in Huntington’s disease: Possible influence of antipsychotic medication. J Neural Transm. (2014) ;121: (12):1529–39. |
[17] | Stout JC , Jones R , Labuschagne I , O’Regan AM , Say MJ , Dumas EM , et al. Evaluation of longitudinal 12 and 24 month cognitive outcomes in premanifest and early Huntington’s disease. J Neurol Neurosurg Psychiatry. (2012) ;83: (7):687–94. |
[18] | Tabrizi SJ , Reilmann R , Roos RAC , Durr A , Leavitt B , Owen G , et al. Potential endpoints for clinical trials in premanifest and early Huntington’s disease in the TRACK-HD study: Analysis of 24 month observational data. Lancet Neurol. (2012) ;11: (1):42–53. |
[19] | Stout JC , Paulsen JS , Queller S , Solomon AC , Whitlock KB , Campbell JC , et al. Neurocognitive signs in prodromal Huntington disease. Neuropsychology. (2011) ;25: (1):1–14. |
[20] | Lemiere J , Decruyenaere M , Evers-Kiebooms G , Vandenbussche E , Dom R . Cognitive changes in patients with Huntington’s disease (HD) and asymptomatic carriers of the HD mutation - A longitudinal follow-up study. J Neurol. (2004) ;251: (8):935–42. |
[21] | Huntington Study Group. Unified Huntington’s Disease Rating Scale: Reliability and consistency. Mov Disord (1996) ;2: (2):136–42. |
[22] | Rusz J , Saft C , Schlegel U , Hoffman R , Skodda S . Phonatory dysfunction as a preclinical symptom of Huntington disease. PLoS One. (2014) ;9: (11):e113412. |
[23] | Penney JB , Vonsattel JP , MacDonald ME , Gusella JF , Myers RH . CAG repeat number governs the development rate of pathology in Huntington’s disease. Ann Neurol. (1997) ;41: (5):689–92. |
[24] | UNESCO. International Standard Classification of Education. Montréal: UNESCO Institute for Statistics; (2011) . |
[25] | Van Riper C . The Grandfather Passage. 4th ed. Englewood Cliffs, NJ: Prentice Hall; (1963) . |
[26] | Vogel AP , Fletcher J , Snyder PJ , Fredrickson A , Maruff P . Reliability, stability, and sensitivity to change and impairment in acoustic measures of timing and frequency. J Voice. (2011) ;25: (2):137–49. |
[27] | Vogel AP , Morgan AT . Factors affecting the quality of sound recording for speech and voice analysis. Int J Speech Lang Pathol. (2009) ;11: (6):431–7. |
[28] | Rosen K , Murdoch B , Folker J , Vogel A , Cahill L , Delatycki M , et al. Automatic method of pause measurement for normal and dysarthric speech. Clin Linguist Phon. (2010) ;24: (2):141–54. |
[29] | Vogel AP , Fletcher J , Maruff P . Acoustic analysis of the effects of sustained wakefulness on speech. J Acoust Soc Am. (2010) ;128: (6):3747–56. |
[30] | Vogel AP , Maruff P , Snyder PJ , Mundt JC . Standardization of pitch-range settings in voice acoustic analysis. Behav Res Methods. (2009) ;41: (2):318–24. |
[31] | Duffy JR . Speech disorders: Clinical evaluation and diagnosis. Mayo Clinic Proc. (1986) ;61: (1):83–4. |
[32] | Simmons K , Mayo R . (1997) ;The use of the Mayo Clinic system for differential diagnosis of dysarthria. J Commun Disord. 30: :117–31; quiz 31. |
[33] | Smith A . Symbol Digit Modalities Test. In: Chissom BS, Reed JC, ed.SDMT:Western Psychological Services; 1973. |
[34] | Skodda S , Schlegel U , Hoffmann R , Saft C . Impaired motor speech performance in Huntington’s disease. J Neural Transm. (2014) ;121: (4):399–407. |
[35] | Rodgers JD , Tjaden K , Feenaughty L , Weinstock-Guttman B , Benedict RH . Influence of cognitive function on speech and articulation rate in multiple sclerosis. J Int Neuropsychol Soc. (2013) ;19: (2):173–80. |
[36] | Rusz J , Hlavnicka J , Novotny M , Tykalova T , Pelletier A , Montplaisir J , et al. Speech biomarkers in rapid eye movement sleep behavior disorder and Parkinson disease. Ann Neurol. (2021) ;90: (1):62–75. |
[37] | Paulsen JS , Smith MM , Long JD , Huntington Study Group. Cognitive decline in prodromal Huntington disease: Implications for clinical trials. J Neurol Neurosurg Psychiatry. (2013) ;84: (11):1233–9. |
[38] | Misiura MB , Lourens S , Calhoun VD , Long J , Bockholt J , Johnson H , et al. Cognitive control, learning, and clinical motor ratings are most highly associated with basal ganglia brain volumes in the premanifest Huntington’s disease phenotype. J Int Neuropsychol Soc. (2017) ;23: (2):159–70. |
[39] | Levelt WJMs . Speaking: From intention to articulation. Cambridge, MA: The MIT Press; (1989) . |
[40] | Dell GS , Chang F , Griffin ZM . Connectionist models of language production: Lexical access and grammatical encoding. Cogn Sci. (1999) ;23: (4):517–42. |
[41] | Acheson DJ , MacDonald MC . Verbal working memory and language production: Common approaches to the serial ordering of verbal information. Psychol Bull. (2009) ;135: (1):50–68. |
[42] | Timmers I , van den Hurk J , Di Salle F , Rubio-Gozalbo ME , Jansma BM . Language production and working memory in classic galactosemia from a cognitive neuroscience perspective: Future research directions. J Inherit Metab Dis. (2011) ;34: (2):367–76. |
[43] | Jongman SR , Roelofs A , Meyer AS . Sustained attention in language production: An individual differences investigation. Q J Exp Psychol (Hove). (2015) ;68: (4):710–30. |
[44] | Smith MM , Arnett PA . Dysarthria predicts poorer performance on cognitive tasks requiring a speeded oral response in an MS population. J Clin Exp Neuropsychol. (2007) ;29: (8):804–12. |
[45] | Arnett PA , Smith MM , Barwick FH , Benedict RHB , Ahlstrom BP . Oralmotor slowing in multiple sclerosis: Relationship to neuropsychological tasks requiring an oral response. Int Neuropsychol Soc. (2008) ;14: (3):454–62. |
[46] | Epping EA , Paulsen JS . Depression in the early stages of Huntington disease. Neurodegener Dis Manag. (2011) ;1: (5):407. |
[47] | Duff K , Paulsen JS , Beglinger LJ , Langbehn DR , Stout JC . Psychiatric symptoms in Huntington’s disease before diagnosis: The Predict-HD Study. Biol Psychiatry. (2007) ;62: (12):1341–6. |
[48] | Aziz NA , Anguelova GV , Marinus J , Lammers GJ , Roos RAC . Sleep and circadian rhythm alterations correlate with depression and cognitive impairment in Huntington’s disease. Parkinsonism Relat Disord. (2010) ;16: (5):345–50. |
[49] | Mundt JC , Vogel AP , Feltner DE , Lenderking WR . Vocal acoustic biomarkers of depression severity and treatment response. Biol Psychiatry. (2012) ;72: (7):580–7. |

