
Generation and Characterization of Knock-in Mouse Models Expressing Versions of Huntingtin with Either an N17 or a Combined PolyQ and Proline-Rich Region Deletion
Abstract
Background: The polyglutamine (polyQ) stretch of the Huntingtin protein (HTT) in mammals is flanked by a highly conserved 17 amino acid N-terminal domain (N17), and a proline-rich region (PRR). The PRR is a binding site for many HTT-interacting proteins, and the N17 domain regulates several normal HTT functions, including HTT’s ability to associate with membranes and organelles.
Objective: This study investigates the consequence of deleting mouse Huntingtin’s (Htt’s) N17 domain or a combination of its polyQ stretch and PRR (QP) on normal Htt function in mice.
Methods: Knock-in mice expressing versions of Htt lacking either the N17 domain (HttΔN17) or both the polyQ and PRR domains (HttΔQP) were generated, and their behavior, autophagy function, and neuropathology were evaluated.
Results: Homozygous and hemizygous HttΔQP/ΔQP, HttΔN17/ΔN17, HttΔQP/–, and HttΔN17/– mice were generated at the expected Mendelian frequency. HttΔQP/ΔQP mutants exhibit improvements in motor coordination compared to controls (Htt+/+). In contrast, HttΔN17/ΔN17 mutants do not exhibit any changes in motor coordination, but they do display variable changes in spatial learning that are dependent on their age at testing. Neither mutant exhibited any changes in basal autophagy in comparison to controls, but thalamostriatal synapses in the dorsal striatum of 24-month-old HttΔN17/ΔN17 mice were decreased compared to controls.
Conclusions: These findings support the hypothesis that Htt’s N17 and QP domains are dispensable for its critical functions during early embryonic development, but are likely more important for Htt functions in CNS development or maintenance.
INTRODUCTION
Huntington’s disease (HD) is one of nine neurodegenerative disorders that involve polyglutamine (polyQ) expansions [1]. Although each of these disorders exhibit common features, different neuronal populations are affected in each disease [1]. Thus, the protein context surrounding the polyQ expansion could be important in determining the mechanism of pathogenesis for each disorder.
The mutation that causes HD is an expansion of CAG nucleotide repeats encoding a polyQ stretch in the Huntingtin (HTT) protein. HTT is a large scaffolding protein (∼350 kD) that is involved in multiple cellular functions, including selective macroautophagy. It is hypothesized that HTT may have evolved through the fusion of 3 yeast cytoplasm to vacuole targeting (Cvt) autophagy genes (Atg23, Vac8, and Atg11), which regulate selective autophagy [2, 3]. HTT has been shown to promote selective macroautophagy through interaction with several autophagy pathway members including p62/SQSTM1 (p62), Ubiquitin (Ub) and microtubule associated protein 1A/1B-light chain 3 (LC3) [4]. “Bulk” non-selective autophagy (a.k.a. starvation-induced autophagy) is regulated by mTORC1 association with and repression of ULK1 [4–7]. Under cellular stress, however, HTT can compete with mTORC1 for binding to ULK1 [4]. The subsequent interaction of the HTT-ULK1 complex with p62, LC3, and Ub leads to the assembly of autophagosomes around specific cargo [4]. In addition to the initiation of selective macroautophagy, HTT’s interaction with p62 and ubiquitinated substrates enhances binding of p62 to its cargo and increases the efficiency of autophagosome assembly [4].
During autophagosome formation, LC3-I (diffusely localized in the cytosol) is conjugated to phosphatidylethanolamine (becoming LC3-II) and associates with the autophagosomal double membrane as it forms around its cargo [8–11]. p62 is an adaptor protein that has a C-terminal Ub-binding domain and a short LC3-interacting region [12, 13]. These two domains allow p62 to recognize and target ubiquitinated cargo for degradation by selective macroautophagy [12–14]. Recent studies have suggested that the PB1 domain in p62 that allows for its self-aggregation may also influence the aggregation of ubiquitinated cargoes and subsequently serve as a nucleation point for autophagosome formation [14]. Because LC3-II and p62 are both degraded by autophagy, the number of autophagosomes and the steady-state levels of LC3-II and p62 can be affected by alterations in the autophagy pathway.
HTT is also involved in the regulation of synaptic development and maintenance. When Htt is conditionally deleted in cortical neurons, an increased number of Vglut1+PSD-95+ corticostriatal synapses can be detected in the dorsal striatum of 21-day-old mice, while an increase in both corticostriatal synapses and Vglut2+PSD-95+ thalamostriatal synapses were observed in 5-week-old mice [15]. Additionally, Q140 HD knock-in mice have reduced numbers of thalamostriatal synapses at 1 month of age, while decreases in corticostriatal synapse numbers were not observed until 12 months of age [16, 17]. These data suggest that there is a role for HTT in synaptic development/maintenance, particularly for thalamostriatal projections.
In mammals, the polyQ stretch of HTT is flanked by two domains that can modulate polyQ structure and toxicity: a highly conserved 17 amino acid N-terminal domain (N17) and a proline-rich region (PRR) adjacent to the C-terminus of the polyQ stretch [18–22]. Because these 3 domains, encoded by the first exon of HTT, appear to have evolved coincidentally with new neuronal functions in deuterostomes, it is thought that they may contribute to HTT’s function in the nervous system, while the C-terminus of HTT confers a more primordial function [23]. As HTT evolved in mammals, the PRR increased in length while the polyQ stretch expanded from 7Q in rodents to an average of 20Q in humans [23], suggesting that the PRR may have a role in modulating the structure and function of the polyQ stretch inmammals [23].
Previous studies have shown that the HTT N17 domain forms an amphipathic helix capable of associating with organelle membranes, and is critical for HTT’s function in stress response [24–28]. The N17 domain is also a target for multiple post-translational modifications that can influence HTT subcellular localization and stability [1, 23–27]. The HTT PRR interacts with both WW domain- and Src homology 3 (SH3)-containing proteins, and can influence post-translational modifications of the HTT N17 domain [29–33]. Additionally, the HTT N17 and PRR domains can interact with each other[34, 35].
To study the roles of the N17, polyQ, and PRR domains in HTT’s function in mice, we have been deleting these domains in endogenous mouse HTT (Htt) either individually or in combination. Our previous results show that the polyQ stretch itself does not contribute to essential Htt functions, as deletion of this stretch in mice does not perturb embryonic development or result in neuropathological deficits in adults [36]. However, HttΔQ/ΔQ mice perform better on the accelerating rotarod and they have an extended lifespan compared to Htt+/+ controls [36, 37]. Deletion of the PRR in Htt also has no impact on embryonic development; however, it does result in spatial learning and memory deficits in 18-month-old male mice [29].
Here, we report the generation and characterization of two additional knock-in mouse models expressing a version of Htt lacking amino acids 2-17 of the N17 domain (HttΔN17), and a version of Htt lacking both the polyQ and PRR domains (HttΔQP).
MATERIALS AND METHODS
Generation of HttΔN17 and HttΔQP mouse alleles
To delete the N17 domain from the endogenous Htt locus in mice (HttΔN17), two partially complementary oligonucleotides were annealed and filled in with the Klenow fragment of DNA polymerase I:5'-CTTCAGGGTCTG TCCCATCGGGCAGGAAGCCGTCATGCAGCAGCA ACAG-3' and 5'-G GCGGCGCCTGCGGCGGTGGCTGCTGCTGCTGTTGCTGCTGCAT GACGG-3' (the AlwN1 site is in bold and underlined, the Nar1 site is underlined). The synthetic double-stranded DNA was then digested with AlwN1 and Nar1 to generate a DNA fragment that was used to replace the wild type AlwN1 – Nar1 fragment in Htt exon 1.
To delete both the polyQ stretch and PRR from Htt exon 1 (HttΔQP), two partially complementary oligonucleotides were annealed and filled in with the Klenow fragment of DNA polymerase I. 5'-GATGAAGGCTTTC GAGTCGCTCAAGTCGTTTCTGCCAGGTCCGGCAGAGGAACCGCTGCACCGACCGTGAGTCCGGTACCTCC-3'and 5'-GGAGGTACCGGACTCACGGT-3' (the Xmn1site is in bold and underlined, the Kpn1 site is underlined). The synthetic double-stranded DNA was then digested with Xmn1 and Kpn1 to generate a DNA fragment that was used to replace the wild type Xmn1 – Kpn1 fragment in Htt exon 1/intron 1. The 3xFLAG sequence was also synthesized using two oligonucleotides and inserted into HttΔQP exon 1 as described [38].
Target vector assembly, embryonic stem (ES) cell electroporation, and blastocyst injections were performed as described [36]. Germ line transmitters were obtained from two independent ES clones for both HttΔN17 and HttΔQP, and there were no phenotypic differences observed between the progeny of both clones within each genotype.
PCR genotyping
The following primers were used to detect modifications made in the Htt locus:
For the ΔN17 mutation: HdEpi-1:5’-GCGTAGTGCCAGTAGGCTCCAAG-3’ and N2-17R2:5’-GGCGGTGGCTGCTGCTGCTGT-3’ (Htt+: 135 bp; HttΔN17: 87 bp).
For the ΔQP mutation: HdEpi-1 and 140Reverse: 5'-GAAGGCACTGGAGTCGTGAC-3' (Htt+ allele produces no product due to the high G/C content in the PRR region; HttΔQP: 347 bp).
For the 3xFLAG epitope: HdEpi-1 and HdEpi-2:5'-CTGAAACGACTTGAGCGACTC GAAAG-3' (Htt+: 112bp; HttΔQP: 178 bp).
For detection of the 84 bp intronic deletion present in both HttΔN17 and HttΔQP: 140Forward: 5'-CTGCACCGACCGTGAGTCC-3' and 140Reverse (Htt+: 236 bp; HttΔN17 or HttΔQP: 152 bp).
Mouse husbandry and behavioral analyses
Mice were maintained on a 12-hour light-dark schedule in humidity- and temperature-controlled rooms. Food and water were provided ad libitum. All experiments with the mice were approved by the ACUC at the University of Virginia. Mice were examined, weighed, and then subjected to accelerating rotarod, open field, and Morris water maze testing at 3, 6, 12, 18 and 24 months of age as described [29], except that Morris water maze testing was performed 1 hour after the beginning of the dark cycle. Male progeny from F1 (129Sv X C57BL/6J) intercrosses were used in all behavioral tests to eliminate the potential effects of the estrus cycle on behavior (N = 10–30/genotype, see Supplementary Table 1 for specific numbers used for each genotype at different ages).
Protein lysate preparation and subcellular fractionation
To initially confirm Htt expression in the F1 HttΔQP/ΔQP and HttΔN17/ΔN17 mice (Fig. 1), whole brain lysates were prepared from 1-month-old homozygous mice as described [29]. The lysates were centrifuged at 800xg for 20 min at 4°C to obtain a crude cytoplasmic fraction (supernatant) for western analysis.
To examine autophagy markers and Htt’s subcellular distribution, subcellular fractionation of whole brain lysates into enriched nuclear, microsomal, and cytosolic fractions was performed as described with minor modifications [39]. Briefly, brains from 6-month-old Htt+/+, HttΔQ/ΔQ, HttΔQP/ΔQP, and HttΔN17/ΔN17 mice (all congenic in the C57BL/6J genetic background) were homogenized in 250 mM sucrose, 20 mM HEPES (pH7.3), 1 mM MgCl2, 25μg/ml spermine, 25μg/ml spermidine, 1 mM DTT, 5 mM NaF and Halt protease inhibitor (Thermo Scientific 78425) and centrifuged at 800xg for 20 min at 4°C. The pellet was resuspended in the same buffer and centrifuged again. The supernatants from both centrifugations were combined and centrifuged for 75 min at 100,000xg to separate the supernatant (cytosolic fraction) from the pellet consisting of all remaining cytoplasmic organelles/vesicles. The pellet was resuspended in RIPA buffer with 1% SDS, 5 mM NaF, and Halt protease inhibitor, then centrifuged at 15,000xg for 15 min to obtain the microsomal fraction (supernatant).
The pellet of the 800xg spin was resuspended in 2 M sucrose, 20 mM HEPES (pH7.3), 1 mM MgCl2, 25μg/ml spermine, 25μg/ml spermidine, 1 mM DTT, 5 mM NaF and Halt protease inhibitor and then layered over a cushion of the same buffer and centrifuged at 80,000xg for 40 min to obtain purified nuclei. The nuclei were resuspended in RIPA buffer with 500 mM NaCl, 5 mM NaF, and Halt protease inhibitor, then sonicated for 5 min (with 10 seconds on/20 seconds off) using a Fisher Scientific Sonic Dismembrator (FB-505) with a cup horn attachment at 4°C, followed by centrifugation for 15 min at 15,000xg to obtain the nuclear fraction (supernatant).
Western blotting
Protein concentrations were estimated using a Pierce BCA Protein Assay Kit (23227). To verify ΔN17-Htt and ΔQP-Htt expression (Fig. 1), 60μg of the protein lysates were fractionated on 4.4% SDS-PAGE and electrophoretically transferred onto 0.45μm PVDF membranes (Millipore, Immobilon-P) at 30 V overnight. To verify the purity of the fractions from the subcellular fractionation, 40μg of the protein lysates were fractionated on TGX stain-free 4–15% gradient gels and electrophoretically transferred onto Immobilon-P membranes using the Bio-Rad Transblot Turbo transfer system. Blots were blocked and probed with: Calnexin (Abcam 22595; 1:1000), Lamin B1 (Cell Signaling 12586; 1:1000), LC3 (Novus NB100-2220; 1:1000), MAB2166 (Millipore; 1:3000), H7540 (Sigma-Aldrich; 1:3000), and FLAGM2 (Sigma-Aldrich F1804; 1:3000) antibodies as described [29]. HRP-conjugated secondary antibody (Jackson ImmunoResearch 715-036-151 and 111-036-003) and SuperSignal WestDura chemiluminescent substrate (Pierce 34076) were used for detection in a ChemiDoc XRS+imager (BioRad).
To evaluate autophagy and synaptic marker expression, 40μg of the microsomal lysates were heated for 5 min at 95°C and then fractionated on Bio-Rad Mini-PROTEAN TGX stain-free 4–15% gradient gels (except for LC3-I and LC3-II lysates that were heated for 15 min at 37°C and then fractionated on 15% SDS-PAGE), followed by electrophoretic transfer onto nitrocellulose membranes using a Bio-Rad Transblot Turbo transfer system. Blots were blocked in Odyssey TBS blocking buffer (LiCor 927-50000) for 1 hour, and then incubated with primary antibody at 4°C overnight, followed by detection with near-infrared emitting fluorophore-labeled secondary antibodies according to instructions by the manufacturer (Li-Cor). Primary antibodies used were: LC3, p62 (American Research products 03-GP62-C; 1:1000), Actin (Cell Signaling 3700; 1:1000), Vglut1 (Millipore AB5905 1:3750), PSD-95 (Cell Signaling 3409; 1:800), and Vglut2 (Millipore AB2251; 1:5000). IRDye 800CW and IRDye 680RD conjugated secondary antibodies were purchased from Li-Cor (926-32212, 926-68073, 925-68070, 925-32211), and Alexa Fluor 680 conjugated secondary antibody was purchased from Jackson ImmunoResearch (706-625-148). Images were obtained with a Li-Cor Odyssey Fc imager and Image Studio software.
To quantify Htt levels, a salt active nuclease (SAN, ArcticZymes 70900) was added to the nuclear fraction at 6.425U/100μg protein with spermine and spermidine (25μg/ml each), MgCl2 (2 mM), and HALT protease inhibitor for 15 min at room temperature to remove DNA prior to SDS-PAGE. 50μg protein from cytosolic and microsomal fractions and 100μg protein from nuclear fractions were run on 4.4% SDS-PAGE and electrophoretically transferred onto 0.45μm low-fluorescence PVDF membranes (Bio-Rad) at 30 V overnight. Blots were probed with MAB2166 (Millipore; 1:1000), mTOR (Cell Signaling 2972; 1:1000) and Lamin B1 antibodies, and imaged as described above.
Primary neuronal cultures and autophagic flux analysis
Primary cortical and striatal neuronal cultures were generated from postnatal day 5 (P5) pups as described [40] with modifications. Briefly, brains were removed from P5 pups and placed in a dish containing F12:DMEM (Gibco 11330-032) supplemented with gentamycin (Gibco 15710-064). The cortex and striatum were isolated and cut into 0.5 mm pieces in Hibernate-A media (Gibco 12475-01) with GlutaMAX (Gibco 35050-061) and gentamycin (HAG), and then digested with 40 units/ml papain in HAG for 25 min at 30°C with shaking at 40 rpm.
Following digestion, the tissues were rinsed twice with HAG containing B27 (Gibco 17504-001) (HABG), and then triturated gently with a flame polished, silicone-coated glass Pasteur pipette. The cell suspension was centrifuged for 4 min at 200xg, and the cell pellet was then resuspended in culture medium consisting of Neurobasal-A (Gibco 10888-022), B27, GlutaMAX, and gentamycin at 5.0 x10⁵ cells/ml. 80μl of cell suspension (4.0×10⁴ cells) were plated on a poly-D-lysine coated glass coverslip (Carolina Biologicals 633009) and incubated at 37°C in 5% CO2. Coverslips were gently washed after 1 hr incubation and placed in a 24-well tissue culture plate containing 800μl of prewarmed culture medium/well; half of the medium was replaced on the third and seventh day in vitro (DIV).
On DIV8, chloroquine was diluted to 30μM in conditioned medium removed from the cultures. Cells were then incubated in 300μl/well of the chloroquine conditioned medium for 4 or 8 hours before fixation and immunocytochemistry to assess autophagic flux.
Immunohistochemistry and immunocytochemistry
For immunohistochemical analyses, 18-month-old mice were anesthetized and perfused with 10% sucrose in 0.1M phosphate buffer for 2 min (5 ml/min) using a peristaltic pump (Cole-Parmer Master flex L/S pump equipped with a model 77200-60 pump head), and their brains were then removed and frozen in O.C.T. compound (Tissue-Tek 4583). Frozen brains were sectioned at 20μm and processed as described [29], with the following modification: sections were fixed in 4% paraformaldehyde in 0.1M phosphate buffer for 10 min and then incubated for 5 min with 0.125M glycine in PBS before washing 3 times in PBS. For synapse quantification, 24-month-old mice were perfused with 10% sucrose in 0.1M phosphate buffer for 2 min, followed by 4% paraformaldehyde/10% sucrose in 0.1M phosphate buffer for 5 min, and then 10% sucrose in 0.1M phosphate buffer for 5 min. Brains were removed and processed as described above except the post-fixation step was eliminated. Progeny from F1 (129Sv X C57BL/6J) intercrosses were used in these studies.
For immunocytochemistry, cells on coverslips were fixed at 37°C, washed, and then processed as described above, except the coverslips were mounted in Vectashield (Vector Laboratories, H-1000) immediately after PBS washes following the secondary antibody incubation without being treated with autofluorescence eliminator (Millipore, 2160).
Primary antibodies used are: p62 (American Research products 03-GP62-C; 1:200), LC3 (Cell signaling 12741; 1:100), Tuj1 (gift from A. Frankfurter, University of Virginia; 1:1000), Vglut1 (Millipore AB5905 1:3750), Vglut2 (Millipore AB2251; 1:5000), PSD-95 (Cell Signaling 3409; 1:800), GFAP (Millipore AB5804; 1:1000), and CD68 (Serotech FA-11; 1:400). Secondary antibodies were purchased from Jackson ImmunoResearch Laboratories (715-175-151, 706-166-148, 712-096-153, and 711-546-152). To-Pro-3 iodide (Invitrogen T3605; 1:1000) was used to stain nuclei.
Image acquisition and image analyses
Images of brain sections and primary neuronal cultures were obtained using a Nikon C1 confocal system with a Nikon TE2000 inverted microscope. Confocal images were taken every 0.5μm in the Z plane to generate an image stack for analysis. For immunocytochemistry, images of 30 neurons/dissection were taken from each quadrant of 2-3 coverslips. 3 dissections were performed per genotype. βIII tubulin immunostaining was used to identify healthy cells for imaging. 40 neurons/genotype were randomly selected for quantification. Image analysis and quantification were performed using NIS-Nikon Elements AR software. Maximum intensity projections were generated from the image stacks for image processing. To identify LC3+p62+ autophagosomes, thresholds were set for each marker and the pixel area of LC3+p62+ puncta was determined. To quantify LC3+p62+ autophagosomes in primary neuronal cell bodies, total LC3+p62+ pixel area in a cell body was divided by the pixel area of the entire cell body. To quantify LC3+p62+ autophagosomes in neurites, total LC3+p62+ pixel area in all neurites of the same neuron was divided by the total lengths of these neurites.
Images of brain sections for synaptic quantification (Vglut1/PSD-95, Vglut2/PSD-95) were obtained using a Zeiss LSM 880 confocal system and Zen software from bregma – 0.555 mm to 1.245 mm (dorsal striatum) and bregma – 1.155 mm to 1.245 mm (primary motor cortex layers I and II) at 200μm intervals. To identify PSD-95+Vglut2+ synapses, thresholds were set for each marker and the total pixel area of PSD-95+Vglut2+ puncta in an image was determined, then divided by the sum of the PSD-95+ pixel area and the Vglut2+ pixel area of the same image. PSD-95+Vglut1+ synapses were quantified in the same way.
Statistical analyses
Data was analyzed using Prism 6 (Graphpad software), and statistical significance determined by ANOVA was set at p < 0.05. Post hoc tests used to compare groups to one another were Tukey’s multiple comparison test for 2-way ANOVA, and Dunnett’s multiple comparison test for 1-way ANOVA.
RESULTS
Generation of the HttΔN17 and HttΔQP mice
The HttΔN17 knock-in mice, lacking amino acids (aa) 2-17, were generated by replacing the wild type Htt exon 1 sequence with a sequence containing the aa 2-17 deletion by gene targeting in ES cells. The HttΔQP knock-in mice were generated by replacing the wild type Htt exon 1 sequence with a sequence lacking the 7Q and PRR domains using a similar gene targeting strategy. A 3xFLAG epitope tag was also inserted into the HttΔQP gene-targeting vector between Htt aa 1 and 2 (Fig. 1A andMethods).
Targeted ES cell clones were injected into C57BL/6J blastocysts to generate chimeric mice using standard procedures [36, 41], and male chimeras were bred to female C57BL/6J mice to generate heterozygous F1 progeny. Western blot analyses of whole brain lysates obtained from 1-month-old mice were used to verify the expression of ΔQP-Htt and ΔN17-Htt. The 3xFLAG N-terminal epitope tag in HttΔQP mice was detected with a FLAGM2 antibody (Fig. 1C), and absence of the N17 domain in ΔN17-Htt was confirmed using an antibody recognizing aa 3-16 in the N17 domain (H7540) (Fig. 1B). All versions of Htt are detected using the MAB2166 antibody recognizing an epitope within aa 181-810 of Htt (Fig. 1B, C).
Heterozygous intercrosses of F1 mice were used to generate cohorts of homozygous, heterozygous and wild type control mice for each domain deletion mutation (HttΔQP/ΔQP, HttΔQP/+, HttΔN17/ΔN17, HttΔN17/+, and Htt+/+ mice). Of 261 mice born from the HttΔQP/+ intercross, 74 (28.35%) were Htt+/+ mice, 113 (43.30%) were heterozygous (HttΔQP/+) mice, and 74 (28.35%) were homozygous (HttΔQP/ΔQP) (Table 1). This distribution is not significantly different from the expected Mendelian frequency (χ2 = 4.693, p = 0.096, DF = 3). Among the 162 mice generated from the HttΔN17/+ intercross, 40 (24.69%) were Htt+/+, 86 (53.09%) were heterozygous (HttΔN17/+), and 36 (22.22%) were homozygous (HttΔN17/ΔN17) (Table 1). Despite the conservation of the N17 domain in all vertebrates, mice homozygous for the N17 deletion (HttΔN17/ΔN17) were also born at the normal Mendelian frequency (χ2 = 0.815, p = 0.665, DF = 3), suggesting that, like the PRR and the polyQ stretch [29, 36], the N17 domain is not required for Htt’s essential functions during embryonic development. HttΔQP/+ and HttΔN17/+ mice were also crossed with Htt+/– mice to determine if absence of normal Htt expression had any effect on the numbers of hemizygous HttΔQP/– and HttΔN17/– mice that were obtained. Both HttΔQP/– and HttΔN17/– mice were born at the normal Mendelian frequency (HttΔQP/–: χ2 = 2.923, p = 0.404, DF = 3) (HttΔN17/–: χ2 = 2.800, p = 0.424, DF = 3) (Table 1), suggesting that expression of ΔQP-Htt or ΔN17-Htt at 50% of the normal Htt level is sufficient for embryonic development. This finding is in agreement with previous work showing that when BAC transgenic mice expressing a full-length human HTT construct lacking the N17 domain (BAC-Wt-ΔN17-Htt+/– tg mice) were crossed with Htt+/– mice, BAC-Wt-ΔN17-Htt-/- mice were generated at the expected Mendelian frequency [42]. Additionally, the homozygous HttΔQP/ΔQP and HttΔN17/ΔN17 mutants appeared normal and their weights were not significantly different from controls throughout their lifetime (data notshown).
Behavioral analyses of HttΔN17/ΔN17 and HttΔQP/ΔQP mice
HttΔN17/ΔN17 and HttΔQP/ΔQP mice were subjected to longitudinal behavioral testing at 3, 6, 12, 18, and 24 months of age to determine if the domain deletions affected activity, motor coordination, or spatial learning and memory. No differences in total horizontal movement, total vertical movement, or total distance traveled were observed between the mutants and controls at all ages examined (data not shown). However, HttΔQP/ΔQP mice consistently out-performed Htt+/+ littermates on the accelerating rotarod as shown by their increased latency to fall at 3 (p < 0.0001, F = 13.61, DF = 2), 6 (p = 0.0103, F = 4.701, DF = 2), 12 (p = 0.0079, F = 4.974, DF = 2), 18 (p = 0.0156, F = 4.269, DF = 2), and 24 months of age (p = 0.0077, F = 5.052, DF = 2, 2-way ANOVA) (Fig. 2A). HttΔN17/ΔN17 mice, in contrast, did not exhibit any consistent improvements on the rotarod when compared to controls other than an increased latency to fall during the last day of testing at 6 months of age (Fig. 2A).
In the Morris water maze, HttΔQP/ΔQP and HttΔN17/ΔN17 mice were able to navigate to the hidden platform more quickly than controls during the initial acquisition (learning) phase of testing at 3 months of age (Fig. 2B; p = 0.0003, F = 8.194, DF = 2, 2-way ANOVA). HttΔQP/ΔQP mice were no different from controls at any other ages tested. HttΔN17/ΔN17 mice were also able to find the platform more quickly than controls at 6 months of age (p < 0.0001, F = 22.44, DF = 2, 2-way ANOVA), but they took longer to find the platform during the acquisition phase in comparison to the controls by 12 months of age (Fig. 2B; p < 0.0001, F = 12.53, DF = 2, 2-way ANOVA) and at 24 months of age (Fig. 2B; p = 0.0085, F = 4.797, DF = 2, 2-way ANOVA). However, no significant differences from controls were detected in the ability of the homozygous mutants to remember the position of the escape platform during the probe trials (Supplementary Figure 1B). Additionally, the ability of homozygous mutants to re-learn the platform location during the reversal trials was similar to controls (Supplementary Figure 1A), suggesting that neither memory recall nor memory extinction was affected by the QP or N17 deletions. No changes were seen during the visible platform trial (data not shown). To determine if the differences observed could be due to genotype-specific effects on swim speed, velocities recorded during the probe trial were compared. No significant differences were found between different genotypes at all the ages tested (Supplementary Figure 1C).
Subcellular localization of ΔQP-Htt or ΔN17-Htt is not significantly different from wild type Htt in the mouse brain
The N17 domain, in addition to having a membrane-association function, also contains a nuclear export signal. Therefore, Δ N17-Htt could exhibit altered subcellular localization in comparison to wild type Htt, ΔQ-Htt, or ΔQP-Htt [43, 44]. Whole brain protein lysates from 6-month-old mice (n = 3-4/genotype) were separated into nuclear, cytosolic, and microsomal fractions. Western blotting was first performed to confirm the identity of the fractions using subcellular markers (Supplementary Figure 2), and then Htt levels in each fraction were quantified. Htt levels were first normalized to mTOR levels in the microsomal and cytosolic fractions and to Lamin B1 levels in the nuclear fractions. The normalized Htt levels in the HttΔQ/ΔQ, HttΔQP/ΔQP, and HttΔN17/ΔN17 samples were then compared to normalized wild type Htt levels. There were no significant differences in nuclear Htt levels in the brains of HttΔN17/ΔN17, HttΔQP/ΔQP, and HttΔQ/ΔQ mice compared to the Htt+/+ controls (Fig. 3; p = 0.6421, F = 0.5769, DF = 3, 1-way ANOVA). There were also no significant differences in Htt levels in the cytosolic (Fig. 3; p = 0.0781, F = 3.310, DF = 3, 1-way ANOVA) or microsomal fractions (Fig. 3; p = 0.1591, F = 2.094, DF = 3, 1-way ANOVA).
Basal neuronal autophagy is not affected by the Htt N17 or QP deletion
To determine if neuronal autophagy was affected in the HttΔQP/ΔQP and HttΔN17/ΔN17 mice, we first examined the steady-state levels of the autophagy markers LC3 and p62 in comparison to Htt+/+and HttΔQ/ΔQ controls in the microsomal fractions (enriched in autophagosomes) obtained from 6-month-old Htt+/+, HttΔQP/ΔQP, HttΔN17/ΔN17, and HttΔQ/ΔQ mice. No significant differences in the ratio of LC3-II to LC3-I in the microsomal fractions were detected between Htt homozygous deletion mutants and Htt+/+ controls (Fig. 4A; p = 0.6581, F = 0.5568, DF = 3, n = 3/genotype, 1-way ANOVA). p62 was also quantified in the cytosol, microsomal, and nuclear fractions since it can be detected in all three fractions. No difference in p62 levels between the homozygous mutants and the controls was observed in any fraction (data not shown). Consistent with these results, we could not detect any changes in the number of LC3+p62+ autophagosomes or any differences in p62 immunostaining in the cortex or striatum of 18-month-old HttΔQP/ΔQP and HttΔN17/ΔN17 mice compared to Htt+/+ controls (n = 3/genotype, data not shown).
Because basal neuronal autophagy in vivo is very efficient, small changes in autophagy can be difficult to detect in the brain [45]. To better characterize autophagy in the deletion mutants, autophagic flux assays were performed in primary neuronal cultures generated from Htt+/+, HttΔQ/ΔQ, HttΔQP/ΔQP and HttΔN17/ΔN17 mice. Primary cortical and striatal neurons were isolated from P5 pups and grown on Poly-D-lysine coated coverslips in serum-free medium for 8 DIV. To assess the formation of autophagosomes within these neurons, cultures were treated with chloroquine. Chloroquine is a membrane-permeable compound that accumulates in acidic compartments within cells (e.g. lysosomes) and neutralizes their pH, thus inhibiting the degradation of autophagosomes [8, 46]. Therefore, an increase or decrease in autophagosome accumulation during the chloroquine treatment could reflect an increase or decrease in their formation. Neurons were fixed either without chloroquine treatment (no treatment), or after a 4- or 8-hour incubation in medium containing 30μM chloroquine. Immunocytochemistry was then performed with LC3, p62 and βIII-tubulin antibodies to quantify cargo-containing autophagosomes (LC3+p62+ puncta) within neuronal cell bodies or processes (βIII tubulin+).
Incubation of neuronal cultures with 30μM chloroquine resulted in an increase in total LC3+p62+ autophagosomes in the cell bodies of both striatal (Fig. 4B, C; p < 0.0001, F = 235.1, DF = 2, 2-way ANOVA) and cortical neurons (Supplementary Figure 3; p < 0.0001, F = 200.1, DF = 2, 2-way ANOVA) compared to cultures that did not receive chloroquine treatment. An increase in the amount of LC3+p62+ autophagosomes could also be observed in neurites (Fig. 4B, D; p < 0.0001, F = 33.92, DF = 2, 2-way ANOVA). However, in both striatal and cortical neuronal cultures, no differences in the amount of LC3+p62+ autophagosomes were detected between genotypes either in the cell bodies (Fig. 4C; p = 0.4350, F = 0.9154, DF = 3, 2-way ANOVA) (Supplementary Figure 3; p = 0.1063, F = 2.071, DF = 3, 2-way ANOVA) or in the neurites (Fig. 4D; p = 0.8792, F = 0.2245, DF = 3, 2-way ANOVA), with or without chloroquine treatment.
Lipofuscin is autofluorescent cell debris that consists predominantly of oxidized lipids and cross-linked proteins from organelles that are not fully digested by the lysosome during autophagy [47, 48]. Oxidative stress and inefficient autophagy both lead to an increase in lipofuscin accumulation in post-mitotic cells, and several studies have reported increased lipofuscin in HD mouse models [37, 49]. We therefore investigated whether lipofuscin accumulation in HttΔQP/ΔQP and HttΔN17/ΔN17 mice was enhanced in comparison to controls. No significant differences in lipofuscin accumulation were found in the brains of 18-month-old HttΔQP/ΔQP, HttΔN17/ΔN17, and Htt+/+mice (data not shown). We also did not detect any differences in reactive astrocytes (GFAP+) or activated microglia (CD68+) in brain sections from 18-month-old HttΔQP/ΔQP, HttΔN17/ΔN17, and Htt+/+ mice (data not shown).
Thalamostriatal synapses are reduced in HttΔN17/ΔN17 mice
The dorsal striatum is innervated by projections from the cortex and several different thalamic nuclei [50]. These cortical and thalamic projections account for a majority of the excitatory synaptic input into the striatum [50]. To determine if changes in synapse numbers could be detected in the HttΔQP/ΔQP and HttΔN17/ΔN17 mice in comparison to Htt+/+ controls, brain sections from 24-month-old mice were stained with a post-synaptic marker (PSD-95) and pre-synaptic markers to label either cortical axon terminals (Vglut1) or thalamic axon terminals (Vglut2) in the dorsal striatum as well as in the motor cortex (Fig. 5A-C). No changes in the number of Vglut1+PSD-95+ puncta representing corticostriatal synapses in the dorsal striatum (Supplementary Figure 4A; p = 0.6467, F = 0.4380, DF = 2, 1-way ANOVA) or in the number of Vglut1+PSD-95+ puncta representing cortico-cortical synapses in the primary motor cortex (Supplementary Figure 4B; p = 0.1129, F = 2.231, DF = 2, 1-way ANOVA) were observed in deletion mutants compared to controls.
In contrast, a significant reduction in the number of Vglut2+PSD-95+ puncta representing thalamostriatal synapses in the dorsal striatum of HttΔN17/ΔN17 mice was observed in comparison to controls (Fig. 5A, 5D; p = 0.0013, F = 7.294, DF = 2, 1-way ANOVA). Additionally, we observed a significant decrease in the number of Vglut2+PSD-95+ puncta in the primary motor cortex (thalamocortical synapses) in HttΔN17/ΔN17 mice compared to HttΔQP/ΔQP mice (Fig. 5B, E; p = 0.0324, F = 3.602, DF = 2, 1-way ANOVA), and a trend towards a decrease in HttΔN17/ΔN17 mice in comparison to controls.
Vglut1 and Vglut2 are expressed widely throughout the brain in largely complementary expression patterns, and together they account for nearly all excitatory synaptic inputs [50–52]. To determine if there was a change in Vglut1, Vglut2, or PSD-95 expression in the HttΔQ/ΔQ, HttΔQP/ΔQP, HttΔN17/ΔN17, and Htt+/+ mice, we quantified their levels by western blotting of whole brain microsomal fractions (containing synaptosomes) isolated from 6-month-old mice (n = 3/genotype). No changes in the amount of total PSD-95 or total Vglut1 were detected in a comparison of the deletion mutants and controls (Fig. 6). However, we did observe a small but significant increase in the level of Vglut2 in both HttΔQP/ΔQP and HttΔN17/ΔN17 mice compared to controls (Fig. 6; p = 0.008, F = 6.655, DF = 3, 1-way ANOVA).
DISCUSSION
Homozygous and hemizygous domain deletion mice (HttΔQP/ΔQP, HttΔQP/–, HttΔN17/ΔN17, and HttΔN17/–) were born at normal Mendelian frequencies in agreement with previous studies, suggesting that the N17, polyQ, and PRR domains are not required for Htt’s essential functions during embryonic development [29, 36, 42, 53]. These results are also consistent with the hypothesis that the N-terminal domains of vertebrate HTT evolved more recently and likely modulate its functions in higher organisms, while the HTT C-terminus contributes to essential functions that are conserved throughout evolution [23].
Several previous studies have proposed a role for HTT in selective macroautophagy [2–4, 24]. The C-terminal portion of HTT (with structural similarity to Atg11) interacts with both LC3 and p62, and thus, may be essential for HTT’s role in selective autophagy. Additionally, deletion of the Htt polyQ stretch enhances autophagy in vitro and extends lifespan in mice [37]. However, we did not observe any changes in autophagic flux in primary neuronal cultures or in steady-state LC3-II levels in whole brain microsomal fractions obtained from 6-month-old Htt+/+, HttΔQ/ΔQ, HttΔQP/ΔQP, and HttΔN17/ΔN17 mice. We note that a recent study investigating the consequence of Htt inactivation in the brains of adult mice also did not detect significant changes in LC3 or p62 protein levels [54]. Because stress can induce selective macroautophagy [24], and recent in vitro studies have identified N17 domain-dependent roles for HTT in cellular stress and DNA damage responses [43, 55–57], it is possible that the contribution of the HTT N-terminus in these pathways may not be apparent until homeostasis is perturbed, such as under chronic stress. For example, the expression of 140Q-Htt was needed to elicit more robust autophagy phenotypes in Htt140Q/ΔQ mice [37]. Therefore, similar studies in Htt140Q/ΔQP and Htt140Q/ΔN17 mice may be required to evaluate the potential contributions of the Htt N17 or QP domains to these cellular mechanisms in vivo.
We did not detect a significant change in the steady-state subcellular localization of ΔN17-Htt in the cytosolic, microsomal, or nuclear fractions. This may be due to the presence of an additional nuclear export signal in the C-terminus of Htt [58] and a second membrane association domain located at Htt aa 229-246 [59] that could compensate for the loss of the N17 domain. However, our results do not exclude the possibility that small changes in ΔN17-Htt subcellular localization that cannot be detected reliably by western blotting do occur in the brains of HttΔN17/ΔN17 mice.
No differences between the homozygous mutants and controls were observed in activity levels, but HttΔQP/ΔQP mice exhibited a consistent improvement in motor coordination on the accelerating rotarod throughout their lifespan, a result that is similar to the improved motor coordination phenotype exhibited by HttΔQ/ΔQ mice [36]. In contrast, neither HttΔP/ΔP nor HttΔN17/ΔN17 mice exhibit any differences on the rotarod in comparison to controls. HttΔN17/ΔN17 mice displayed an improvement in the acquisition (learning) phase of the Morris water maze test in comparison to controls at 3 and 6 months of age, but began to exhibit deficits as they aged. HttΔQP/ΔQP mice also exhibited an initial improvement in the acquisition phase of the Morris water maze at 3 months of age, but no differences were detected in comparison to the controls at older ages. Male HttΔP/ΔP mice exhibit significant deficits in the Morris water maze at 18 months of age, but behaved similarly to controls at younger ages [29]. Although HttΔQ/ΔQ mice have not been tested in the Morris water maze, they have been tested in the analogous Barnes maze, and they exhibited deficits at 5 months of age [36]. The differences in learning and memory phenotypes between these mice suggest that the polyQ and the PRR could potentially modulate each other’s effects on spatial learning and memory. A deletion of all three domains encoded by Htt’s exon 1 may be needed to further evaluate theirinteractions.
Although the cause of the behavioral phenotypes in the homozygous Htt N-terminal domain deletion mice has yet to be identified, we did observe a significant decrease in thalamostriatal synapses in 24-month-old HttΔN17/ΔN17 mice. HttΔN17/ΔN17 mice had fewer Vglut2+PSD-95+ thalamostriatal synapses in the dorsal striatum and a trend towards decreased Vglut2+PSD-95+ thalamocortical synapses in the primary motor cortex. Previous studies have identified a role for normal Htt in the development of corticostriatal and thalamostriatal synapses in mice, and have also shown an effect of mutant Htt expression on age-related synapse loss in HD mouse models [15–17]. Conditional loss of Htt expression using Emx1-Cre in the developing CNS results in an initial increase in corticostriatal and thalamostriatal synapses [15]. However, synapse numbers in older Htt conditional knock-out brains were not examined; therefore, it is not known if early increases in synaptogenesis could result in later age-related phenotypes. The behavioral impact of decreased thalamic innervation of the striatum is difficult to determine because the striatum receives input from several different thalamic nuclei [50]. Nevertheless, thalamic volumetric decline is associated with more severe cognitive symptoms in HD patients [60, 61]. Our observation that HttΔN17/ΔN17 mice exhibited an increase in whole-brain Vglut2 levels at 6 months of age together with a decrease in Vglut2+PSD-95+ puncta in the dorsal striatum at 24 months of age suggests that synaptogenesis and/or maintenance could be altered in these mice. Future studies will be needed to determine if the synaptic phenotypes we observe are due to a developmental defect, or if they appear as mice age. Nevertheless, the effect of the N17 domain deletion on thalamostriatal synapses lends support to the hypothesis that during evolution, the N-terminus of HTT may have evolved to contribute to specific neuronal functions in vertebrates in addition to its other cellularfunctions.
CONFLICT OF INTEREST
The Authors have no conflicts of interest arising from the publication of this paper.
ACKNOWLEDGMENTS
We thank Jonathan Kipnis, Noel Derecki, and Alban Gaultier for sharing essential equipment. We also thank Stephen Grado for his help collecting activity cage data. This work was supported by NIH/NINDS F31NS083289 (E. Andre), NS043466, and NS077926 (S. Zeitlin).
Appendices
The supplementary material is available in the electronic version of this article: http://dx.doi.org/10.3233/JHD-160231.
REFERENCES
[1] | Zuccato C , Valenza M , Cattaneo E . Molecular mechanisms and potential therapeutical targets in Huntington’s disease. Physiol Rev. (2010) ;90: (3):905–81. doi: 10.1152/physrev.00041.2009 |
[2] | Steffan JS . Does Huntingtin play a role in selective macroautophagy? Cell Cycle (2010) ;9: (17):3401–13. doi: 10.4161/cc.9.17.12671 |
[3] | Ochaba J , Lukacsovich T , Csikos G , Zheng S , Margulis J , Salazar L , et al. Potential function for the Huntingtin protein as a scaffold for selective autophagy. Proc Natl Acad Sci U S A. (2014) ;111: (47):16889–94. doi: 10.1073/pnas.1420103111 |
[4] | Rui YN , Xu Z , Patel B , Chen Z , Chen D , Tito A , et al. Huntingtin functions as a scaffold for selective macroautophagy. Nat Cell Biol. (2015) ;17: (3):262–75. doi: 10.1038/ncb3101 |
[5] | Jung CH , Jun CB , Ro SH , Kim YM , Otto NM , Cao J ,et al. ULK-Atg13-FIP200 complexes mediate mTOR signaling to the autophagy machinery. Mol Biol Cell. (2009) ;20: (7):1992–2003. doi: 10.1091/mbc.E08-12-1249 |
[6] | Kim J , Kundu M , Viollet B , Guan KL . AMPK and mTOR regulate autophagy through direct phosphorylation of Ulk1. Nat Cell Biol. (2011) ;13: (2):132–41. doi: 10.1038/ncb2152 |
[7] | Ganley IG , Lam du H , Wang J , Ding X , Chen S , Jiang X . ULK1.ATG13.FIP200 complex mediates mTOR signaling and is essential for autophagy. J Biol Chem. (2009) ;284: (18):12297–305. doi: 10.1074/jbc.M900573200 |
[8] | Klionsky D , Abdalla FC , Abeliovich H , Abraham RT , Acevedo-Arozena A , Adeli K , et al. Guidelines for the use and interpretation of assays for monitoring autophagy. Autophagy. (2012) ;8: (4):445–544. doi: 10.4161/auto.19496 |
[9] | Kabeya Y , Mizushima N , Ueno T , Yamamoto A , Kirisako T , Noda T , et al. LC3, a mammalian homologue of yeast Apg8p, is localized in autophagosome membranes after processing. EMBO J. (2000) ;19: (21):5720–8. doi: 10.1093/emboj/19.21.5720 |
[10] | Tanida I , Tanida-Miyake E , Komatsu M , Ueno T , Kominami E . Human Apg3p/Aut1p homologue is an authentic E2 enzyme for multiple substrates, GATE-16, GABARAP, and MAP-LC3, and facilitates the conjugation of hApg12p to hApg5J. Biol Chem. (1373) ;277: (16):9–44. doi: 10.1074/jbc.M200385200 |
[11] | Tanida I , Tanida-Miyake E , Ueno T , Kominami E . The human homolog of Saccharomyces cerevisiae Apg7p is a Protein-activating enzyme for multiple substrates including human Apg12p, GATE-16, GABARAP, and MAP-LC3. J Biol Chem. (2001) ;276: (3):1701–6. doi: 10.1074/jbc.C000752200 |
[12] | Pankiv S , Clausen TH , Lamark T , Brech A , Bruun JA , Outzen H , et al. p62/SQSTM1 binds directly to Atg8/LC3 to facilitate degradation of ubiquitinated protein aggregates by autophagy. J Biol Chem. (2007) ;282: (33):24131–45. doi: 10.1074/jbc.M702824200 |
[13] | Ciani B , Layfield R , Cavey JR , Sheppard PW , Searle MS . Structure of the ubiquitin-associated domain of p62 (SQSTM1) and implications for mutations that cause Paget’s disease of bone. J Biol Chem. (2003) ;278: (39):37409–12. doi: 10.1074/jbc.M307416200 |
[14] | Lippai M , Low P . The role of the selective adaptor p62 and ubiquitin-like proteins in autophagy. BioMed Res Int (2014) :832704. doi: 10.1155/2014/832704 |
[15] | McKinstry SU , Karadeniz YB , Worthington AK , Hayrapetyan VY , Ozlu MI , Serafin-Molina K , et al. Huntingtin is required for normal excitatory synapse development in cortical and striatal circuits. J Neurosci. (2014) ;34: (28):9455–72. doi: 10.1523/jneurosci.4699-13.2014 |
[16] | Deng YP , Wong T , Bricker-Anthony C , Deng B , Reiner A . Loss of corticostriatal and thalamostriatal synaptic terminals precedes striatal projection neuron pathology in heterozygous Q140 Huntington’s disease mice. Neurobiol Dis. (2013) ;60: :89–107. doi: 10.1016/j.nbd.2013.08.009 |
[17] | Deng YP , Wong T , Wan JY , Reiner A . Differential loss of thalamostriatal and corticostriatal input to striatal projection neuron types prior to overt motor symptoms in the Q140 knock-in mouse model of Huntington’s disease. Front Systems Neurosci. (2014) ;8: :198. doi: 10.3389/fnsys.2014.00198 |
[18] | Lakhani VV , Ding F , Dokholyan NV . Polyglutamine induced misfolding of huntingtin exon1 is modulated by the flanking sequences. PLoS Comput Biol. (1000) ;6: (4):e772. doi: 10.1371/journal.pcbi.1000772 |
[19] | Kim MW , Chelliah Y , Kim SW , Otwinowski Z , Bezprozvanny I . Secondary structure of Huntingtin amino-terminal region. Structure. (2009) ;17: (9):1205–12. doi: 10.1016/j.str.2009.08.002 |
[20] | Bhattacharyya A , Thakur AK , Chellgren VM , Thiagarajan G , Williams AD , Chellgren BW , Oligoproline effects on polyglutamine conformation and aggregation. J Mol Biol. (2006) ;355: (3):524–35. doi: 10.1016/j.jmb.2005.10.053 |
[21] | Darnell G , Orgel JP , Pahl R , Meredith SC . Flanking polyproline sequences inhibit beta-sheet structure in polyglutamine segments by inducing PPII-like helix structure. J Mol Biol. (2007) ;374: (3):688–704. doi: 10.1016/j.jmb.2007.09.023 |
[22] | Reumers J , Maurer-Stroh S , Schymkowitz J , Rousseau F . Protein sequences encode safeguards against aggregation. Hum Mutat. (2009) ;30: (3):431–7. doi: 10.1002/humu.20905 |
[23] | Tartari M , Gissi C , Lo Sardo V , Zuccato C , Picardi E , Pesole G , et al. Phylogenetic comparison of huntingtin homologues reveals the appearance of a primitive polyQ in sea urchin. Mol Biol Evol. (2008) ;25: (2):330–8. doi: 10.1093/molbev/msm258 |
[24] | Atwal RS , Truant R . A stress sensitive ER membrane-association domain in Huntingtin protein defines a potential role for Huntingtin in the regulation of autophagy. Autophagy. (2008) ;4: (1):91–3. doi: 10.4161/auto.5201 |
[25] | Atwal RS , Xia J , Pinchev D , Taylor J , Epand RM , Truant R . Huntingtin has a membrane association signal that can modulate huntingtin aggregation, nuclear entry and toxicity. Hum Mol Genet. (2007) ;16: (21):2600–15. doi: 10.1093/hmg/ddm217 |
[26] | Atwal RS , Desmond CR , Caron N , Maiuri T , Xia J , Sipione S , et al. Kinase inhibitors modulate huntingtin cell localization and toxicity. Nat Chem Biol. (2011) ;7: (7):453–60. doi: 10.1038/nchembio.582 |
[27] | Rockabrand E , Slepko N , Pantalone A , Nukala VN , Kazantsev A , Marsh JL , et al. The first 17 amino acids of Huntingtin modulate its sub-cellular localization, aggregation and effects on calcium homeostasis. Hum Mol Genet. (2007) ;16: (1):61–77. doi: 10.1093/hmg/ddl440 |
[28] | Burke KA , Kauffman KJ , Umbaugh CS , Frey SL , Legleiter J . The interaction of polyglutamine peptides with lipid membranes is regulated by flanking sequences associated with huntingtin. J Biol Chem. (2013) ;288: (21):14993–5005. doi: 10.1074/jbc.M112.446237 |
[29] | Neveklovska M , Clabough EBD , Steffan JS , Zeitlin SO . Deletion of the huntingtin proline-rich region does not significantly affect normal huntingtin function in mice. J Huntingtons Dis. (2012) ;1: :71–87. doi: 10.3233/JHD-2012-120016 |
[30] | Gao YG , Yan XZ , Song AX , Chang YG , Gao XC , Jiang N , et al. Structural insights into the specific binding of huntingtin proline-rich region with the SH3 and WW domains. Structure. (2006) ;14: (12):1755–65. doi: 10.1016/j.str.2006.09.014 |
[31] | Liu YF , Deth RC , Devys D . SH3 domain-dependent association of huntingtin with epidermal growth factor receptor signaling complexes. J Biol Chem. (1997) ;272: (13):8121–4. doi: 10.1074/jbc.272.13.8121 |
[32] | Passani LA , Bedford MT , Faber PW , McGinnis KM , Sharp AH , Gusella JF , et al. Huntingtin’s WW domain partners in Huntington’s disease post-mortem brain fulfill genetic criteria for direct involvement in Huntington’s disease pathogenesis. Hum Mol Genet. (2000) ;9: (14):2175–82. |
[33] | Faber PW , Barnes GT , Srinidhi J , Chen J , Gusella JF , MacDonald ME . Huntingtin interacts with a family of WW domain proteins. Hum Mol Genet. (1998) ;7: (9):1463–74. doi: 10.1093/hmg/7.9.1463 |
[34] | Dlugosz M , Trylska J . Secondary structures of native and pathogenic huntingtin N-terminal fragments. J Phys Chem. (2011) ;115: (40):11597–608. doi: 10.1021/jp206373g |
[35] | Caron NS , Desmond CR , Xia J , Truant R . Polyglutamine domain flexibility mediates the proximity between flanking sequences in huntingtin. Proc Natl Acad Sci U S A. (2013) ;110: (36):14610–5. doi: 10.1073/pnas.1301342110 |
[36] | Clabough EB , Zeitlin SO . Deletion of the triplet repeat encoding polyglutamine within the mouse Huntington’s disease gene results in subtle behavioral/motor phenotypes in vivo and elevated levels of ATP with cellular senescence in vitro. Hum Mol Genet. (2006) ;15: (4):.607–23. doi: 10.1093/hmg/ddi477 |
[37] | Zheng S , Clabough EB , Sarkar S , Futter M , Rubinsztein DC , Zeitlin SO . Deletion of the huntingtin polyglutamine stretch enhances neuronal autophagy and longevity in mice. PLoS Genet. (2010) ;6: (2):e1000838. doi: 10.1371/journal.pgen.1000838 |
[38] | Zheng S , Ghitani N , Blackburn JS , Liu JP , Zeitlin SO . A series of N-terminal epitope tagged Hdh knock-in alleles expressing normal and mutant huntingtin: Their application to understanding the effect of increasing the length of normal Huntingtin’s polyglutamine stretch on CAG140 mouse model pathogenesis. Mol Brain. (2012) ;5: :28. doi: 10.1186/1756-6606-5-28 |
[39] | Cox B , Emili A . Tissue subcellular fractionation and protein extraction for use in mass-spectrometry-based proteomics. Nat Protoc. (2006) ;1: (4):1872–8. doi: 10.1038/nprot.2006.273 |
[40] | Brewer GJ , Torricelli JR . Isolation and culture of adult neurons and neurospheres. Nat Protoc. (2006) ;2: (6):1490–8. doi: 10.1038/nprot.2007.207 |
[41] | Bradley A .Production and analysis of chimeric mice. In Teratocarcinomas and Embryonic Stem Cells, a Practical Approach. Robertson EJ , editor: IRL Press, Inc., Oxford; (1987) . |
[42] | Gu X , Cantle JP , Greiner ER , Lee CY , Barth AM , Gao F , et al. N17 Modifies mutant Huntingtin nuclear pathogenesis and severity of disease in HD BAC transgenic mice. Neuron. (2015) ;85: (4):726–41. doi: 10.1016/j.neuron.2015.01.008 |
[43] | Maiuri T , Woloshansky T , Xia J , Truant R . The huntingtin N17 domain is a multifunctional CRM1 and Ran-dependent nuclear and cilial export signal. Hum Mol Genet. (2013) ;22: (7):1383–94. doi: 10.1093/hmg/dds554 |
[44] | Zheng Z , Li A , Holmes BB , Marasa JC , Diamond MI . An N-terminal Nuclear Export Signal Regulates Trafficking and Aggregation of Huntingtin (Htt) Protein Exon 1. J Biol Chem. (2013) ;288: (9):6063–71. doi: 10.1074/jbc.M112.413575 |
[45] | Boland B , Kumar A , Lee S , Platt FM , Wegiel J , Yu WH ,et al. Autophagy induction and autophagosome clearance in neurons: Relationship to autophagic pathology in Alzheimer’s disease. J Neurosci. (2008) ;28: (27):6926–37. doi: 10.1523/jneurosci.0800-08.2008 |
[46] | Mizushima N , Yoshimorim T , Levine B . Methods in mammalian autophagy research. Cell. (2010) ;140: (3):313–26. doi: 10.1016/j.cell.2010.01.028 |
[47] | Gray DA , Woulfe J . Lipofuscin and aging: A matter of toxic waste. Sci Aging Knowledge Environ. (2005) ;2005: (5):re1. doi: 10.1126/sageke.2005.5.re1 |
[48] | Brunk UT , Terman A . Lipofusc: Mechanisms of age related accumulation and influence on cell function. Free Radic Biol Med. (2002) ;33: (5):611–9. doi: 10.1016/S0891-5849(02)00959-0 function |
[49] | Davies SW , Turmaine M , Cozens BA , Raza AS , Mahal A , Mangiarini L , et al. From neuronal inclusions to neurodegeneration: Neuropathological investigation of a transgenic mouse model of Huntington’s disease. Philos Trans R Soc Lond B Biol Sci. (1999) ;354: (1386):981–9. |
[50] | Wall NR , De La Parra M , Callaway EM , Kreitzer AC . Differential innervation of direct- and indirect-pathway striatal projection neurons. Neuron (2013) ;79: (2):347–60. doi: 10.1016/j.neuron.2013.05.014 |
[51] | Fremeau RT Jr , Troyer MD , Pahner I , Nygaard GO , Tran CH , Reimer RJ , et al. The expression of vesicular glutamate transporters defines two classes of excitatory synapse. Neuron (2001) ;31: (2):247–60. doi: 10.1016/S0896-6273(01)00344-0 |
[52] | Herzog E , Bellenchi GC , Gras C , Bernard V , Ravassard P , Bedet C , et al. The existence of a second vesicular glutamate transporter specifies subpopulations of glutamatergic neurons. J Neurosci (2001) ;21: (22):Rc181. |
[53] | Liu X , Wang CE , Hong Y , Zhao T , Wang G , Gaertig MA , et al. N-terminal huntingtin knock-in mice: Implications of removing the N-terminal region of huntingtin for therapy. PLoS Genet (2016) ;12: (5). doi: 10.1371/journal.pgen.1006083 |
[54] | Wang G , Liu X , Gaertig MA , Li S , Li XJ . Ablation of huntingtin in adult neurons is nondeleterious but its depletion in young mice causes acute pancreatitis. Proc Natl Acad Sci U S A (2016) ;113: (12):3359–64. doi: 10.1073/pnas.1524575113 |
[55] | Nath S , Munsie LN , Truant R . A huntingtin-mediated fast stress response halting endosomal trafficking is defective in Huntington’s disease. Hum Mol Genet (2015) ;24: (2):450–62. doi: 10.1093/hmg/ddu460 |
[56] | Maiuri T , Mocle AJ , Hung CL , Xia J , van Roon-Mom WM , Truant R . Huntingtin is a scaffolding protein in the ATM oxidative DNA damage response complex. Hum Mol Genet. 2016 Dec 25 (Epub ahead of print). doi: 10.1093/hmg/ddw395 |
[57] | Munsie L , Caron N , Atwal RS , Marsden I , Wild EJ , Bamburg JR , et al. Mutant huntingtin causes defective actin remodeling during stress: Defining a new role for transglutaminase 2 in neurodegenerative disease. Hum Mol Genet (2011) ;20: (10):1937–51. doi: 10.1093/hmg/ddr075 |
[58] | Xia J , Lee DH , Taylor J , Vandelft M , Truant R . Huntingtin contains a highly conserved nuclear export signal. Hum Mol Genet (2003) ;12: (12):1393–403. doi: 10.1093/hmg/ddg156 |
[59] | Kegel KB , Sapp E , Yoder J , Cuiffo B , Sobin L , Kim YJ , et al. Huntingtin associates with acidic phospholipids at the plasma membrane. J Biol Chem (2005) ;280: (43):36464–73. doi: 10.1074/jbc.M503672200 |
[60] | Kassubek J , Juengling FD , Kioschies T , Henkel K , Karitzky J , Kramer B , et al. Topography of cerebral atrophy in early Huntington’s disease: A voxel based morphometric MRI study. J Neurol Neurosurg Psychiatry (2004) ;75: (2):213–20. doi: 10.1136/jnn2002.009019 |
[61] | Kassubek J , Juengling FD , Ecker D , Landwehrmeyer GB . Thalamic atrophy in Huntington’s disease co-varies with cognitive performance: A morphometric MRI analysis. Cereb Cortex (2005) ;15: (6):846–53. doi: 10.1093/cercor/bhh185 |
Figures and Tables
Fig.1
Htt N-terminal domain deletions. (A) Illustration of Htt exon 1 for wild type Htt+ (+), HttΔN17 (ΔN17), and HttΔQP (ΔQP) alleles. The N17 domain, polyQ stretch, and the mouse PRR are indicated. In the HttΔN17 allele, the first methionine was retained, while amino acids 2-17 were deleted. (B) Htt+/+ (+/+), HttΔN17/+ (ΔN17/+), and HttΔN17/ΔN17 (ΔN17/ΔN17) whole brain lysates probed with H7540 and MAB2166 antibodies. The N17-specific H7540 antibody detects wild type Htt in the+/+and ΔN17/+lane, but does not detect ΔN17-Htt in the ΔN17/ΔN17 lane, as expected. (C) Htt+/+ (+/+), HttΔQP/+ (ΔQP/+), and HttΔQP/ΔQP (ΔQP/ΔQP) lysates probed with FLAGM2 and MAB2166 antibodies. FLAGM2 antibody detects the N-terminal 3xFLAG epitope tag of ΔQP-Htt in the ΔQP/+and ΔQP/ΔQP lanes. MAB2166 detects wild type Htt, ΔQP-Htt and ΔN17-Htt. Note that ΔQP-Htt migrates slightly faster on SDS-PAGE resulting in an Htt doublet in the ΔQP/+lane.
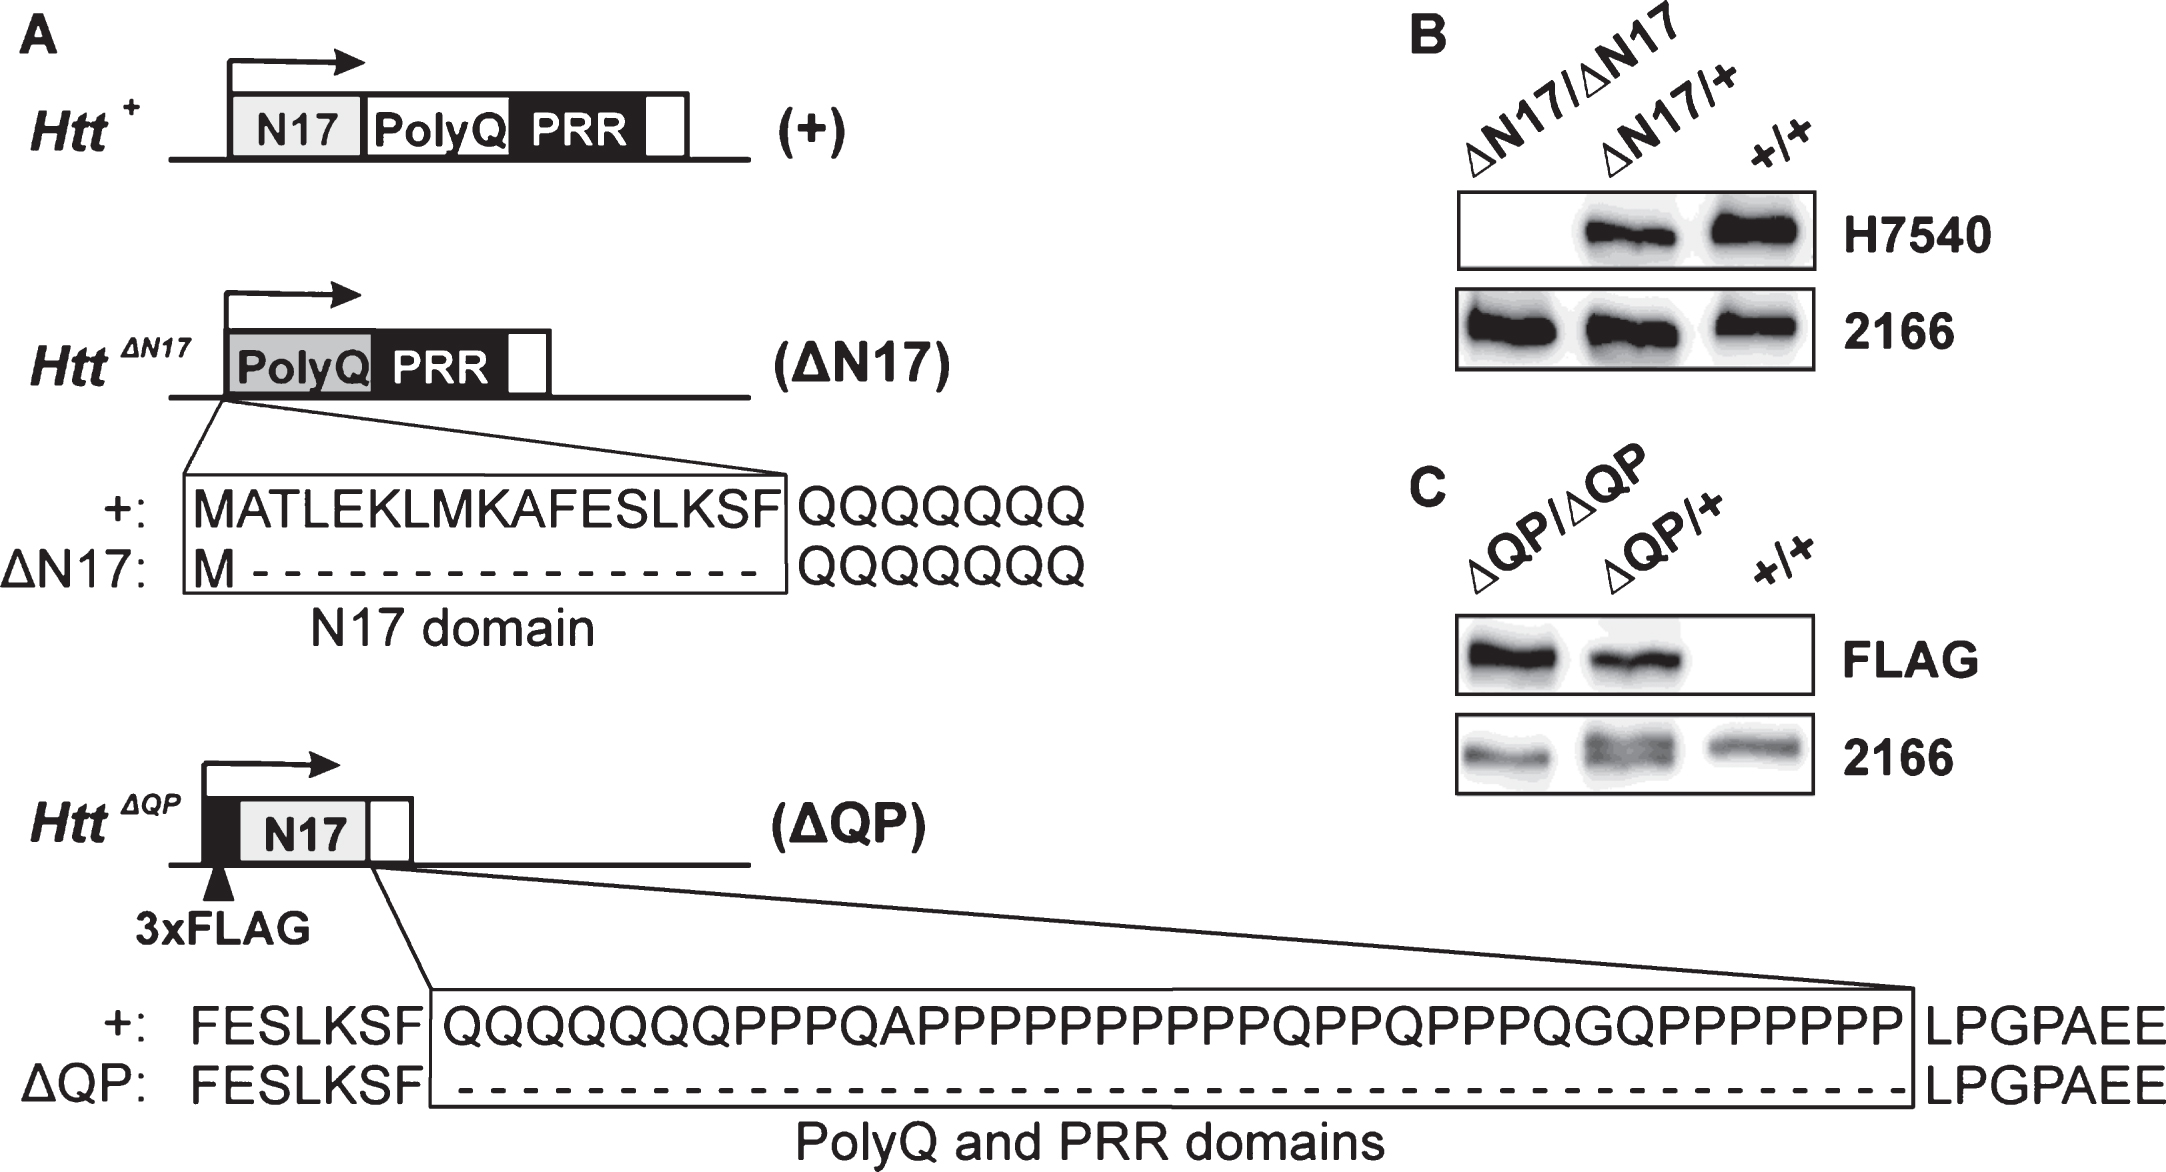
Fig.2
Behavioral analyses of the homozygous domain deletion mice. (A) HttΔQP/ΔQP (ΔQP/ΔQP) mice consistently out-performed Htt+/+ (+/+) littermates on the accelerating rotarod at 3 (p < 0.0001), 6 (p = 0.0103), 12 (p = 0.0079), 18 (p = 0.0156), and 24 months of age (p = 0.0077, 2-way ANOVA). (B) In the acquisition phase of the Morris water maze test, both HttΔQP/ΔQP and HttΔN17/ΔN17 (ΔN17/ΔN17) mice were able to navigate to the platform more quickly than controls at 3 months of age (p = 0.0003, 2-way ANOVA). HttΔN17/ΔN17 mice continued to find the platform more quickly than controls at 6 months (p < 0.0001, 2-way ANOVA), but by 12 months (p < 0.0001, 2-way ANOVA) and 24 months of age (p = 0.0085, 2-way ANOVA) they were slower to learn the location of the platform during the acquisition phase. The numbers of mice tested for each genotype at each specific age are listed in Supplementary Table 1.
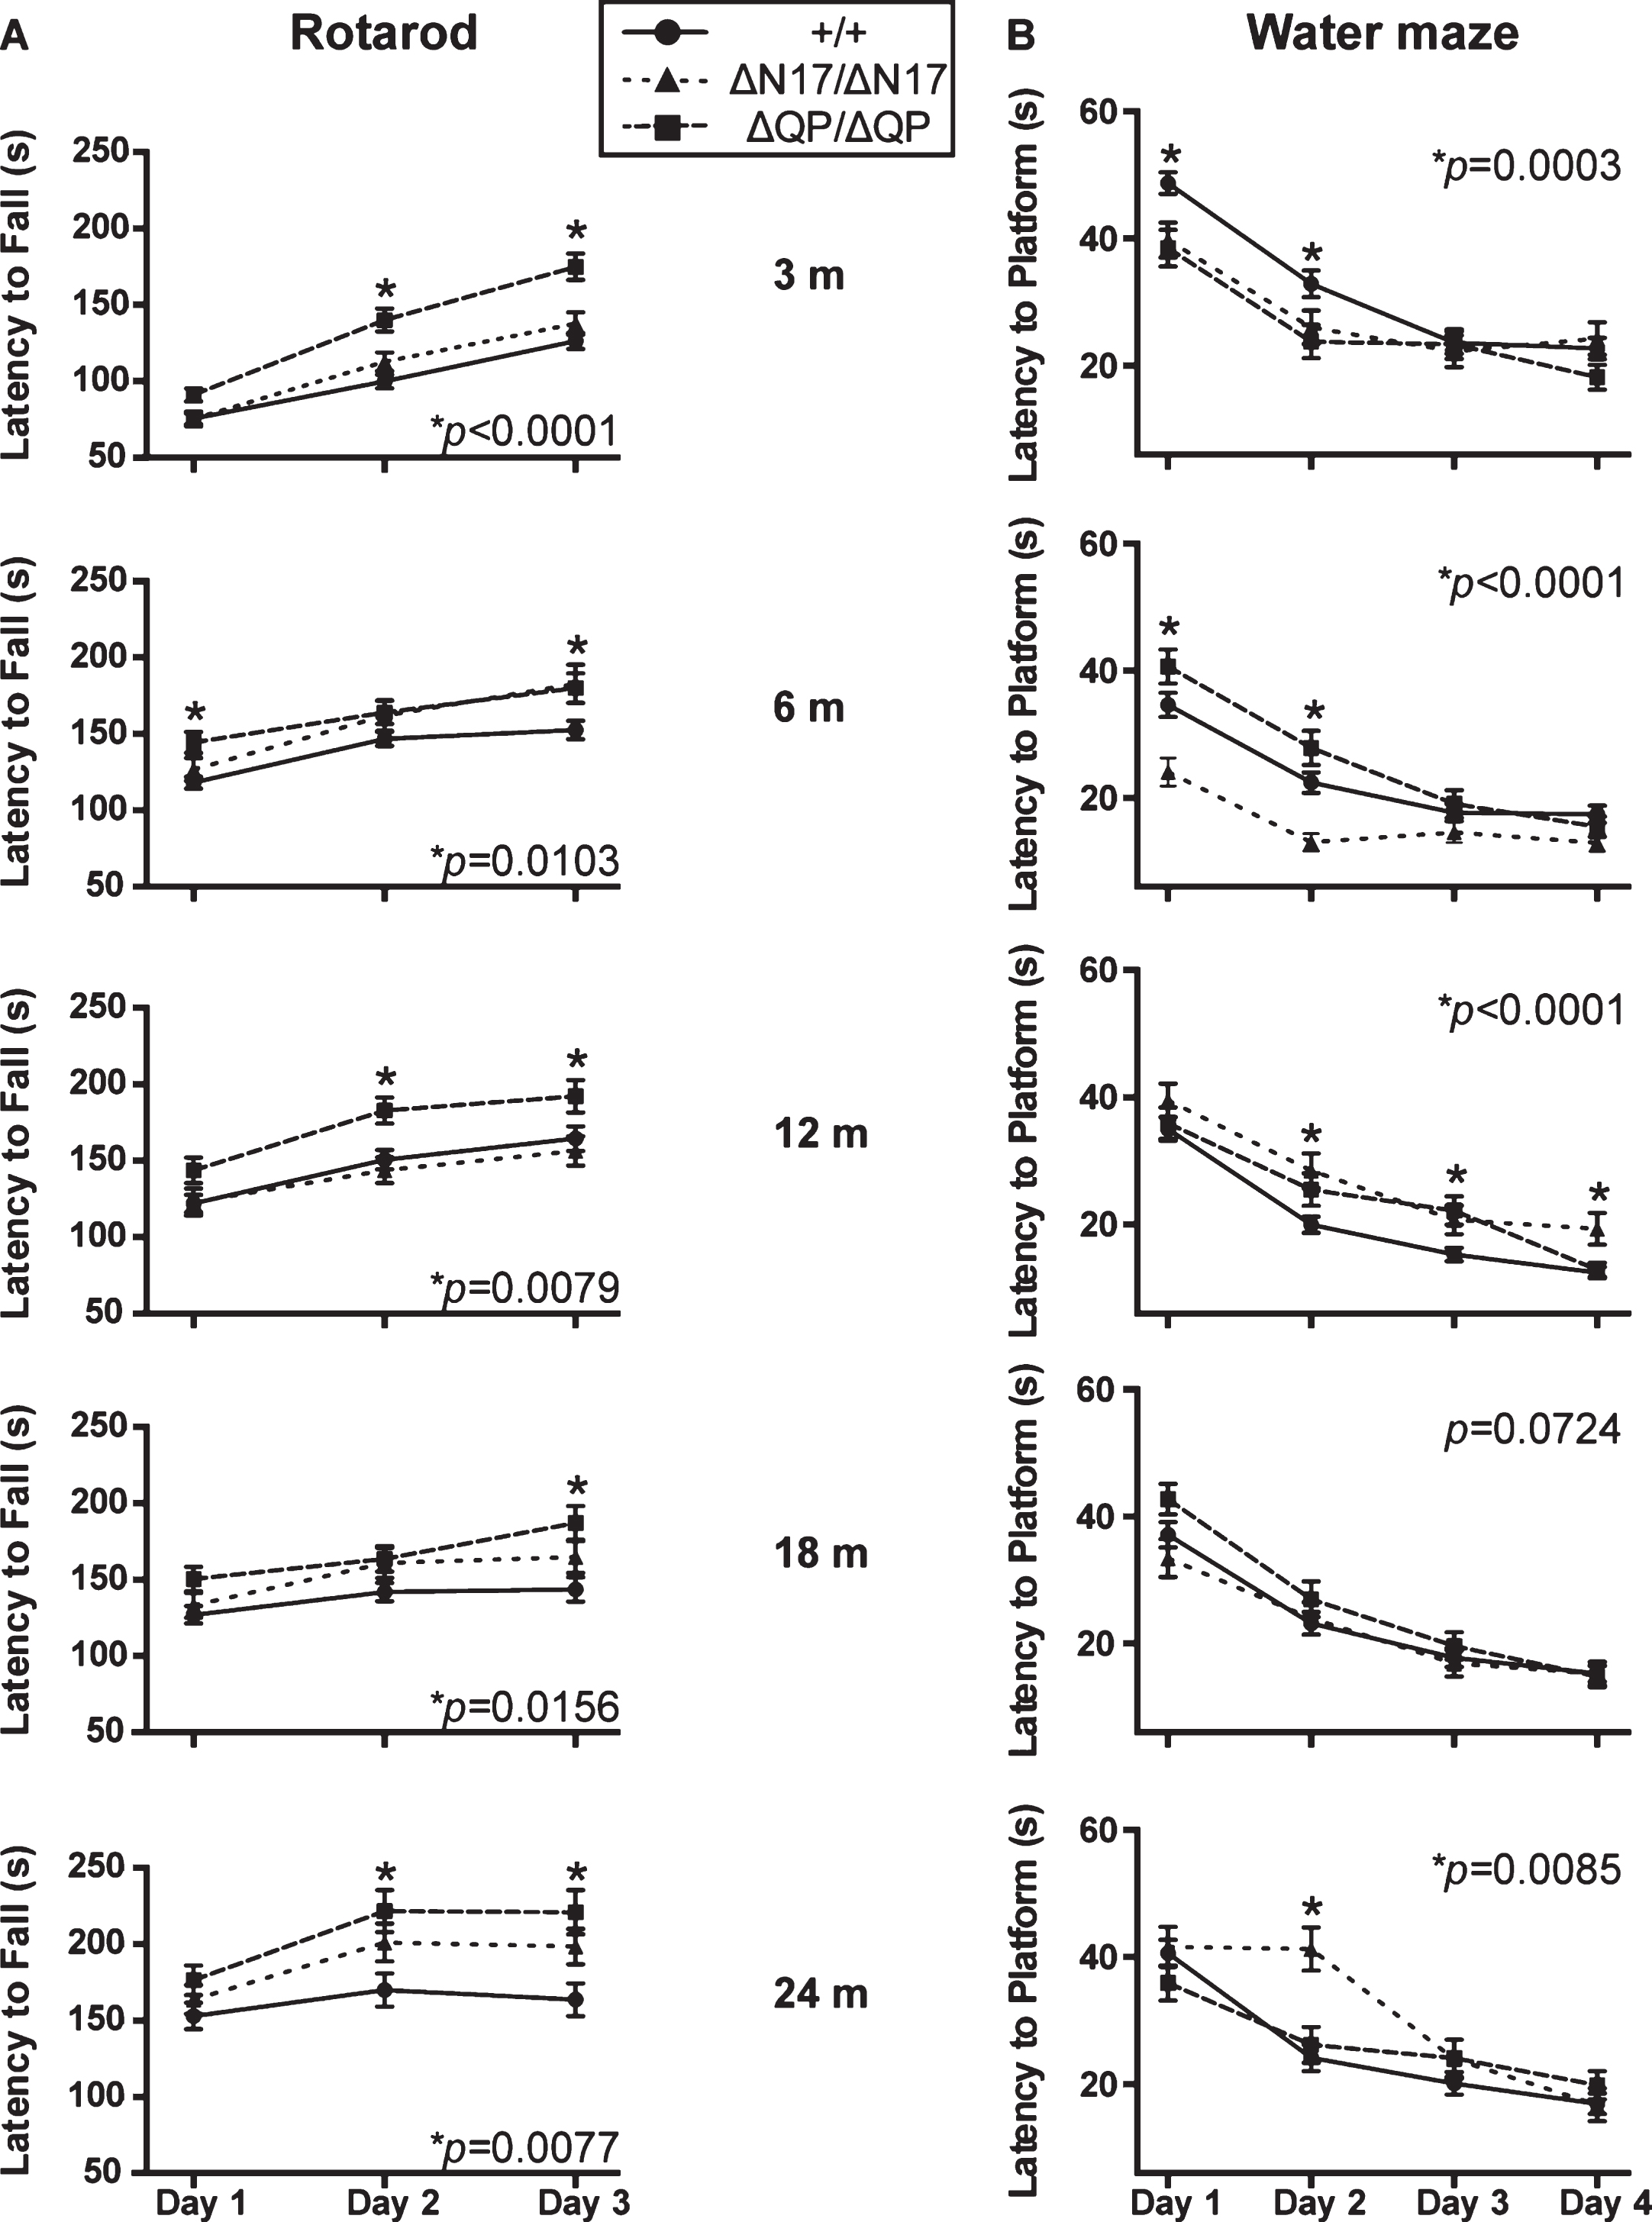
Fig.3
Htt levels in subcellular fractions. Whole brain lysates from 6-month-old Htt+/+ (+/+), HttΔQ/ΔQ (ΔQ/ΔQ), HttΔQP/ΔQP (ΔQP/ΔQP), and HttΔN17/ΔN17 (ΔN17/ΔN17) mice were separated into nuclear, cytosolic, and microsomal fractions. No significant differences in Htt protein levels were observed between the homozygous mutants and wild type controls in any of these fractions. For quantification, Htt (MAB2166) levels were first normalized to mTOR levels in the microsomal and cytosolic fractions, and to Lamin B1 levels in the nuclear fractions. The normalized Htt levels in the HttΔQ/ΔQ, HttΔQP/ΔQP, and HttΔN17/ΔN17 samples were then compared to normalized wild type Htt levels. Nuclear fraction: HttΔQ/ΔQ: 1.062±0.459, HttΔQP/ΔQP: 0.669±0.198, HttΔN17/ΔN17: 0.616±0.208; p = 0.6421. Cytosolic fraction: HttΔQ/ΔQ: 0.999±0.085, HttΔQP/ΔQP: 0.832±0.090, HttΔN17/ΔN17: 0.730±0.078; p = 0.0781. Microsomal fraction: HttΔQ/ΔQ: 0.861±0.166, HttΔQP/ΔQP: 0.505±0.148, HttΔN17/ΔN17: 0.851±0.150; p = 0.1591. (mean±SEM, 1-way ANOVA, n = 3-4/genotype).
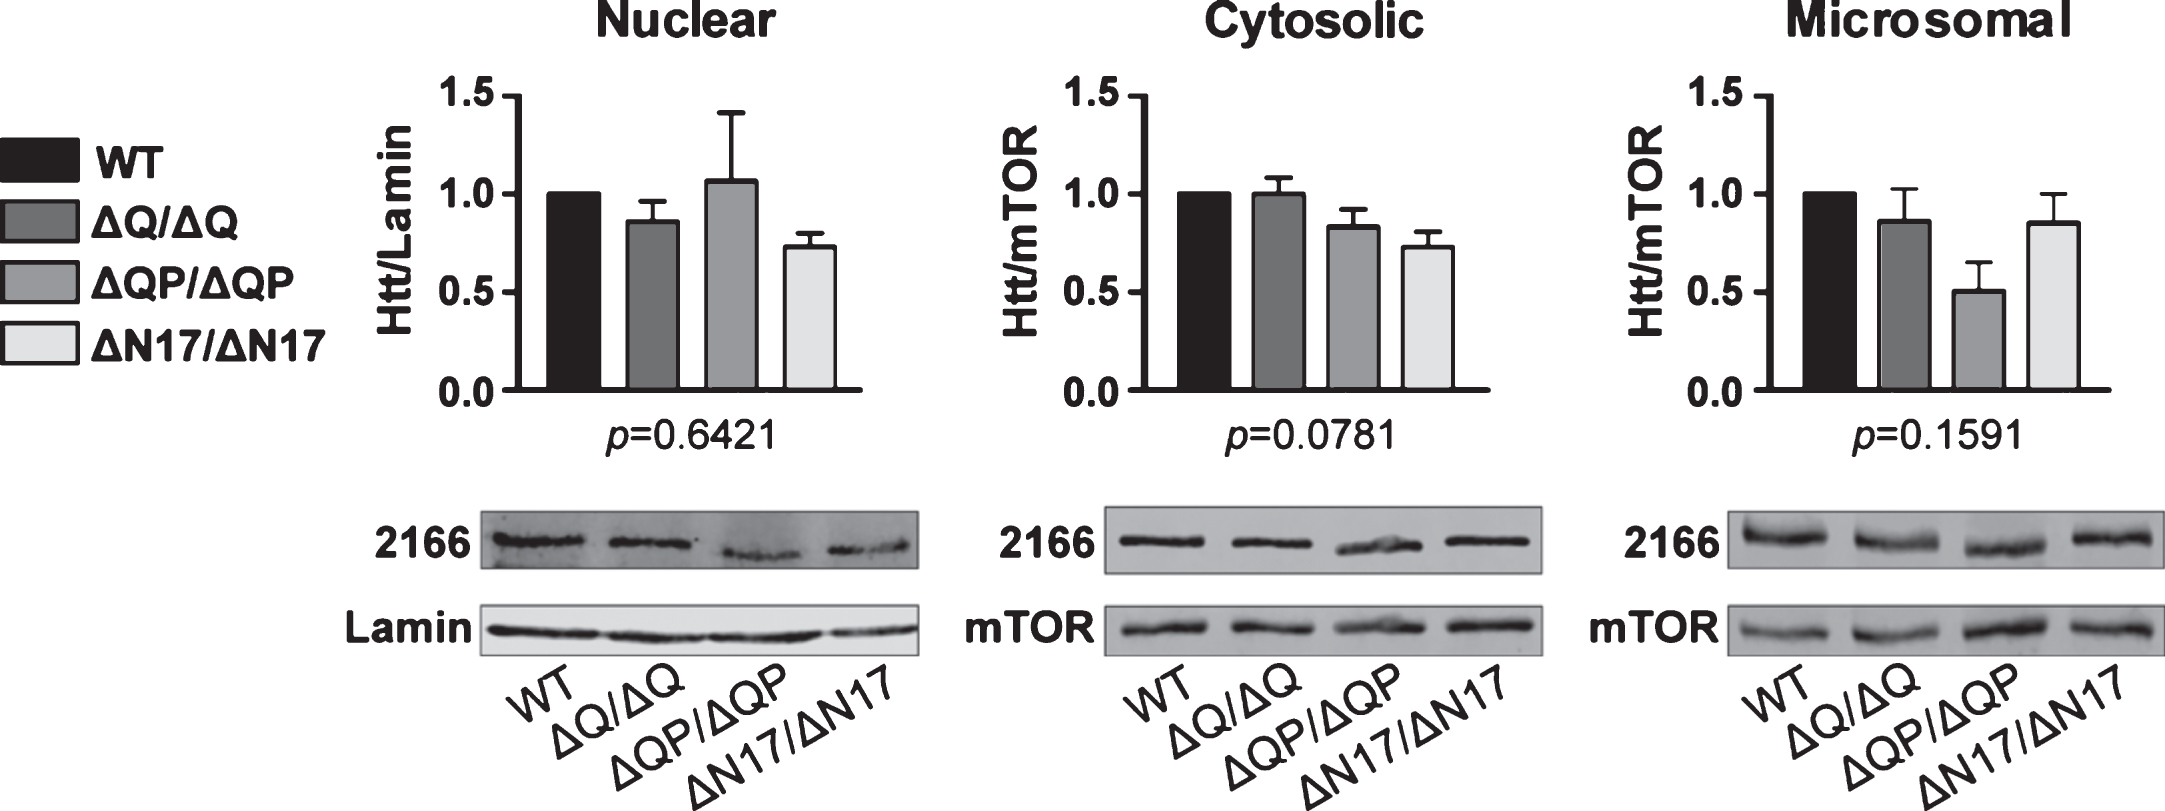
Fig.4
Autophagy analyses. (A) Western blot analysis of LC3 levels in the microsomal fractions from 6-month-old Htt+/+ (+/+), HttΔQ/ΔQ (ΔQ/ΔQ), HttΔQP/ΔQP (ΔQP/ΔQP), and HttΔN17/ΔN17 (ΔN17/ΔN17) mice. No significant differences were detected in the ratio of LC3-II to LC3-I between different genotypes (HttΔN17/ΔN17: 1.222±0.167, HttΔQP/ΔQP: 1.172±0.154, HttΔQ/ΔQ: 1.204±0.152, mean±SEM, n = 3/genotype; p = 0.6581, 1-way ANOVA). (B-D) Primary striatal neurons isolated from the brains of postnatal day 5 Htt+/+, HttΔQ/ΔQ, HttΔQP/ΔQP, and HttΔN17/ΔN17 mice were grown in serum free media for 8 DIV before treating with 30μM chloroquine (CQ) to assess autophagic flux. (B) Fixed cells were immunostained with antibodies recognizing LC3 (green), p62 (red) and βIII tubulin (blue). Scale bar = 10μm for top 8 panels. Arrowheads in the insets indicate LC3+p62+ cargo-containing autophagosomes within neurites. Scale bar = 5μm for 4 inset panels. (C) Quantification of the LC3+p62+ area within the cell bodies of striatal neurons (p = 0.4350, F = 0.9154, DF = 3, 2-way ANOVA). (D) Quantification of the LC3+p62+ area per μm of neurite in the striatal neurons (p = 0.8792, F = 0.2245, DF = 3, 2-way ANOVA). No significant differences were observed between the Htt+/+ controls and all three domain deletion mutants (n = 40 cells/genotype from 3 different dissections/genotype).
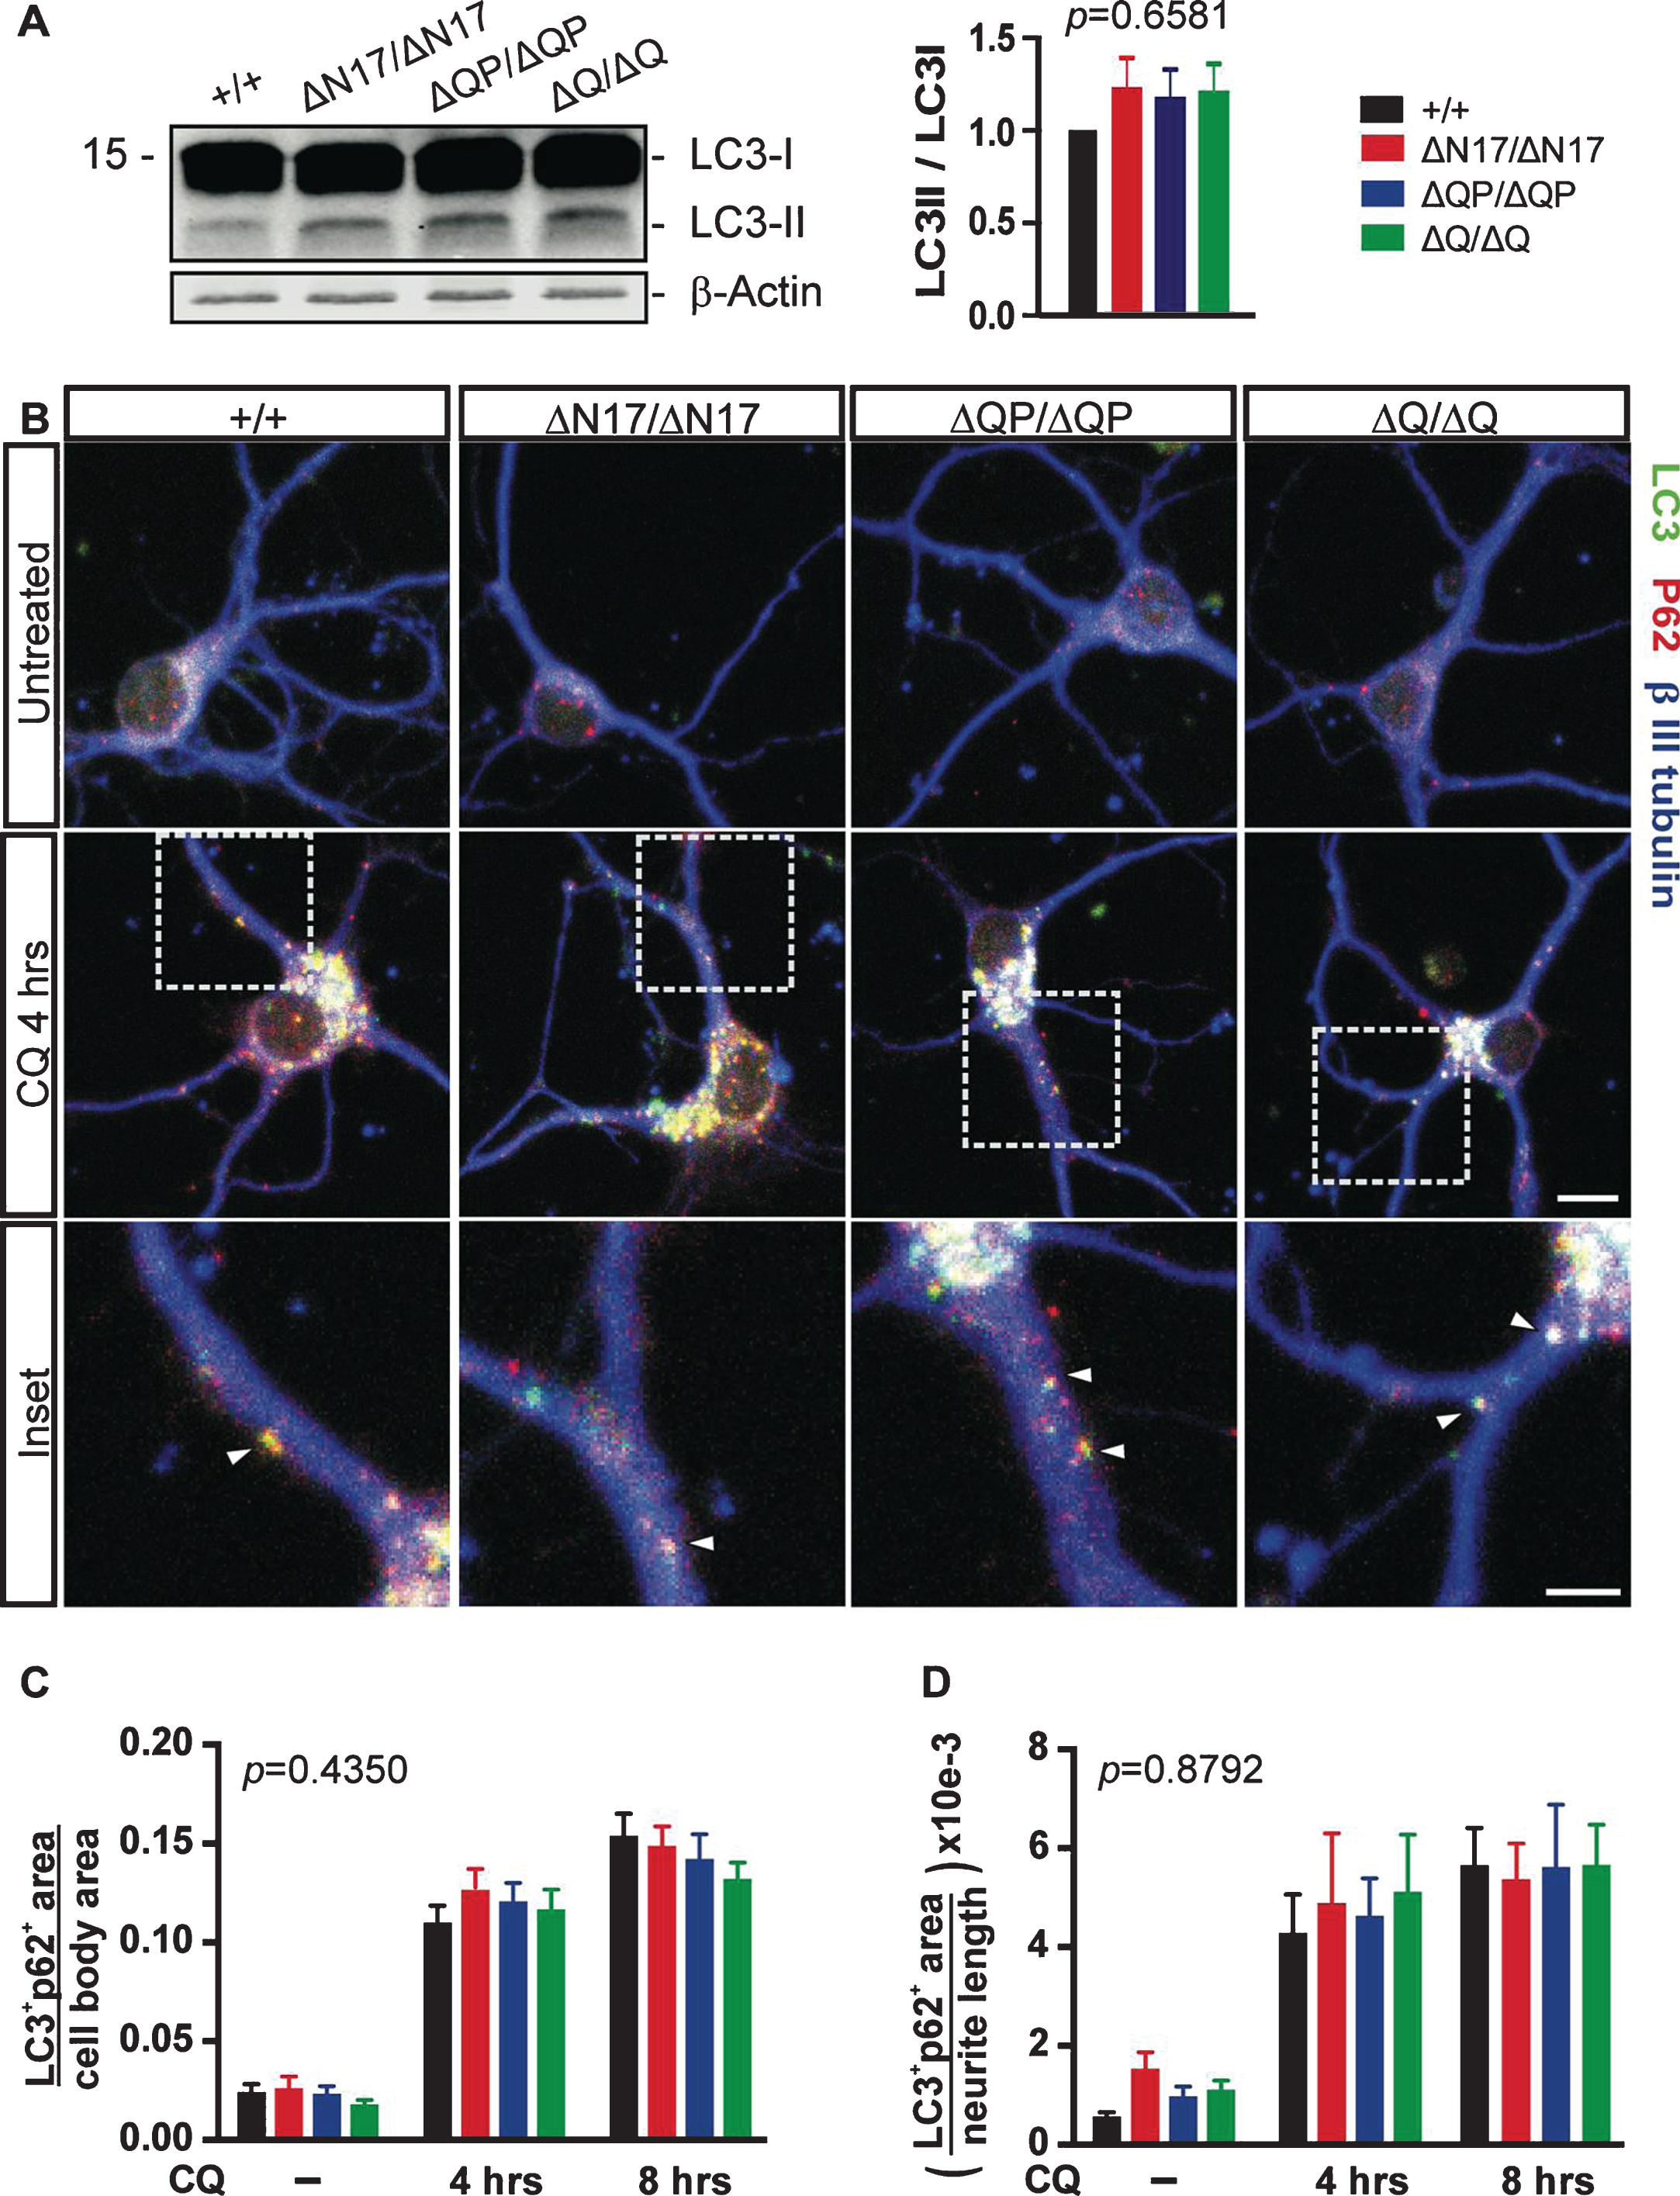
Fig.5
Synapse quantification in the brains of 24-month-old Htt+/+ (+/+), HttΔQP/ΔQP (ΔQP/ΔQP), and HttΔN17/ΔN17 (ΔN17/ΔN17) mice. (A, B) Representative images from brain sections immunostained with PSD-95 (green) and Vglut2 (red). (A) Dorsal striatum. Arrowheads indicate co-localized PSD-95 and Vglut2 (yellow), which represent thalamostriatal synapses. Scale bar = 2μm. (B) Primary motor cortex (layers I/II). Arrowheads indicate co-localized PSD-95 and Vglut2, which represent thalamocortical synapses. Scale bar = 2μm. (C) Diagram illustrating the two brain regions imaged in (A, B). (D, E) Quantification of PSD-95/Vglut2 co-localization in the dorsal striatum (D) and primary motor cortex (E). HttΔN17/ΔN17 mice had reduced PSD-95+Vglut2+ synapses in the striatum compared to Htt+/+ controls (Htt+/+: 0.05887±0.00683, HttΔQP/ΔQP: 0.07323±0.01249, HttΔN17/ΔN17: 0.02940±0.00391, p = 0.0013). HttΔN17/ΔN17 mice also exhibited a trend toward reduced PSD-95+Vglut2+ synapses in the primary motor cortex compared to Htt+/+ controls and a significant reduction compared to HttΔQP/ΔQP mice (Htt+/+: 0.01652±0.0034, HttΔQP/ΔQP: 0.02490±0.00676, HttΔN17/ΔN17: 0.008080±0.00219, p = 0.0324) (mean±SEM, n = 23–25 images from 3 mice/genotype, 1-way ANOVA).
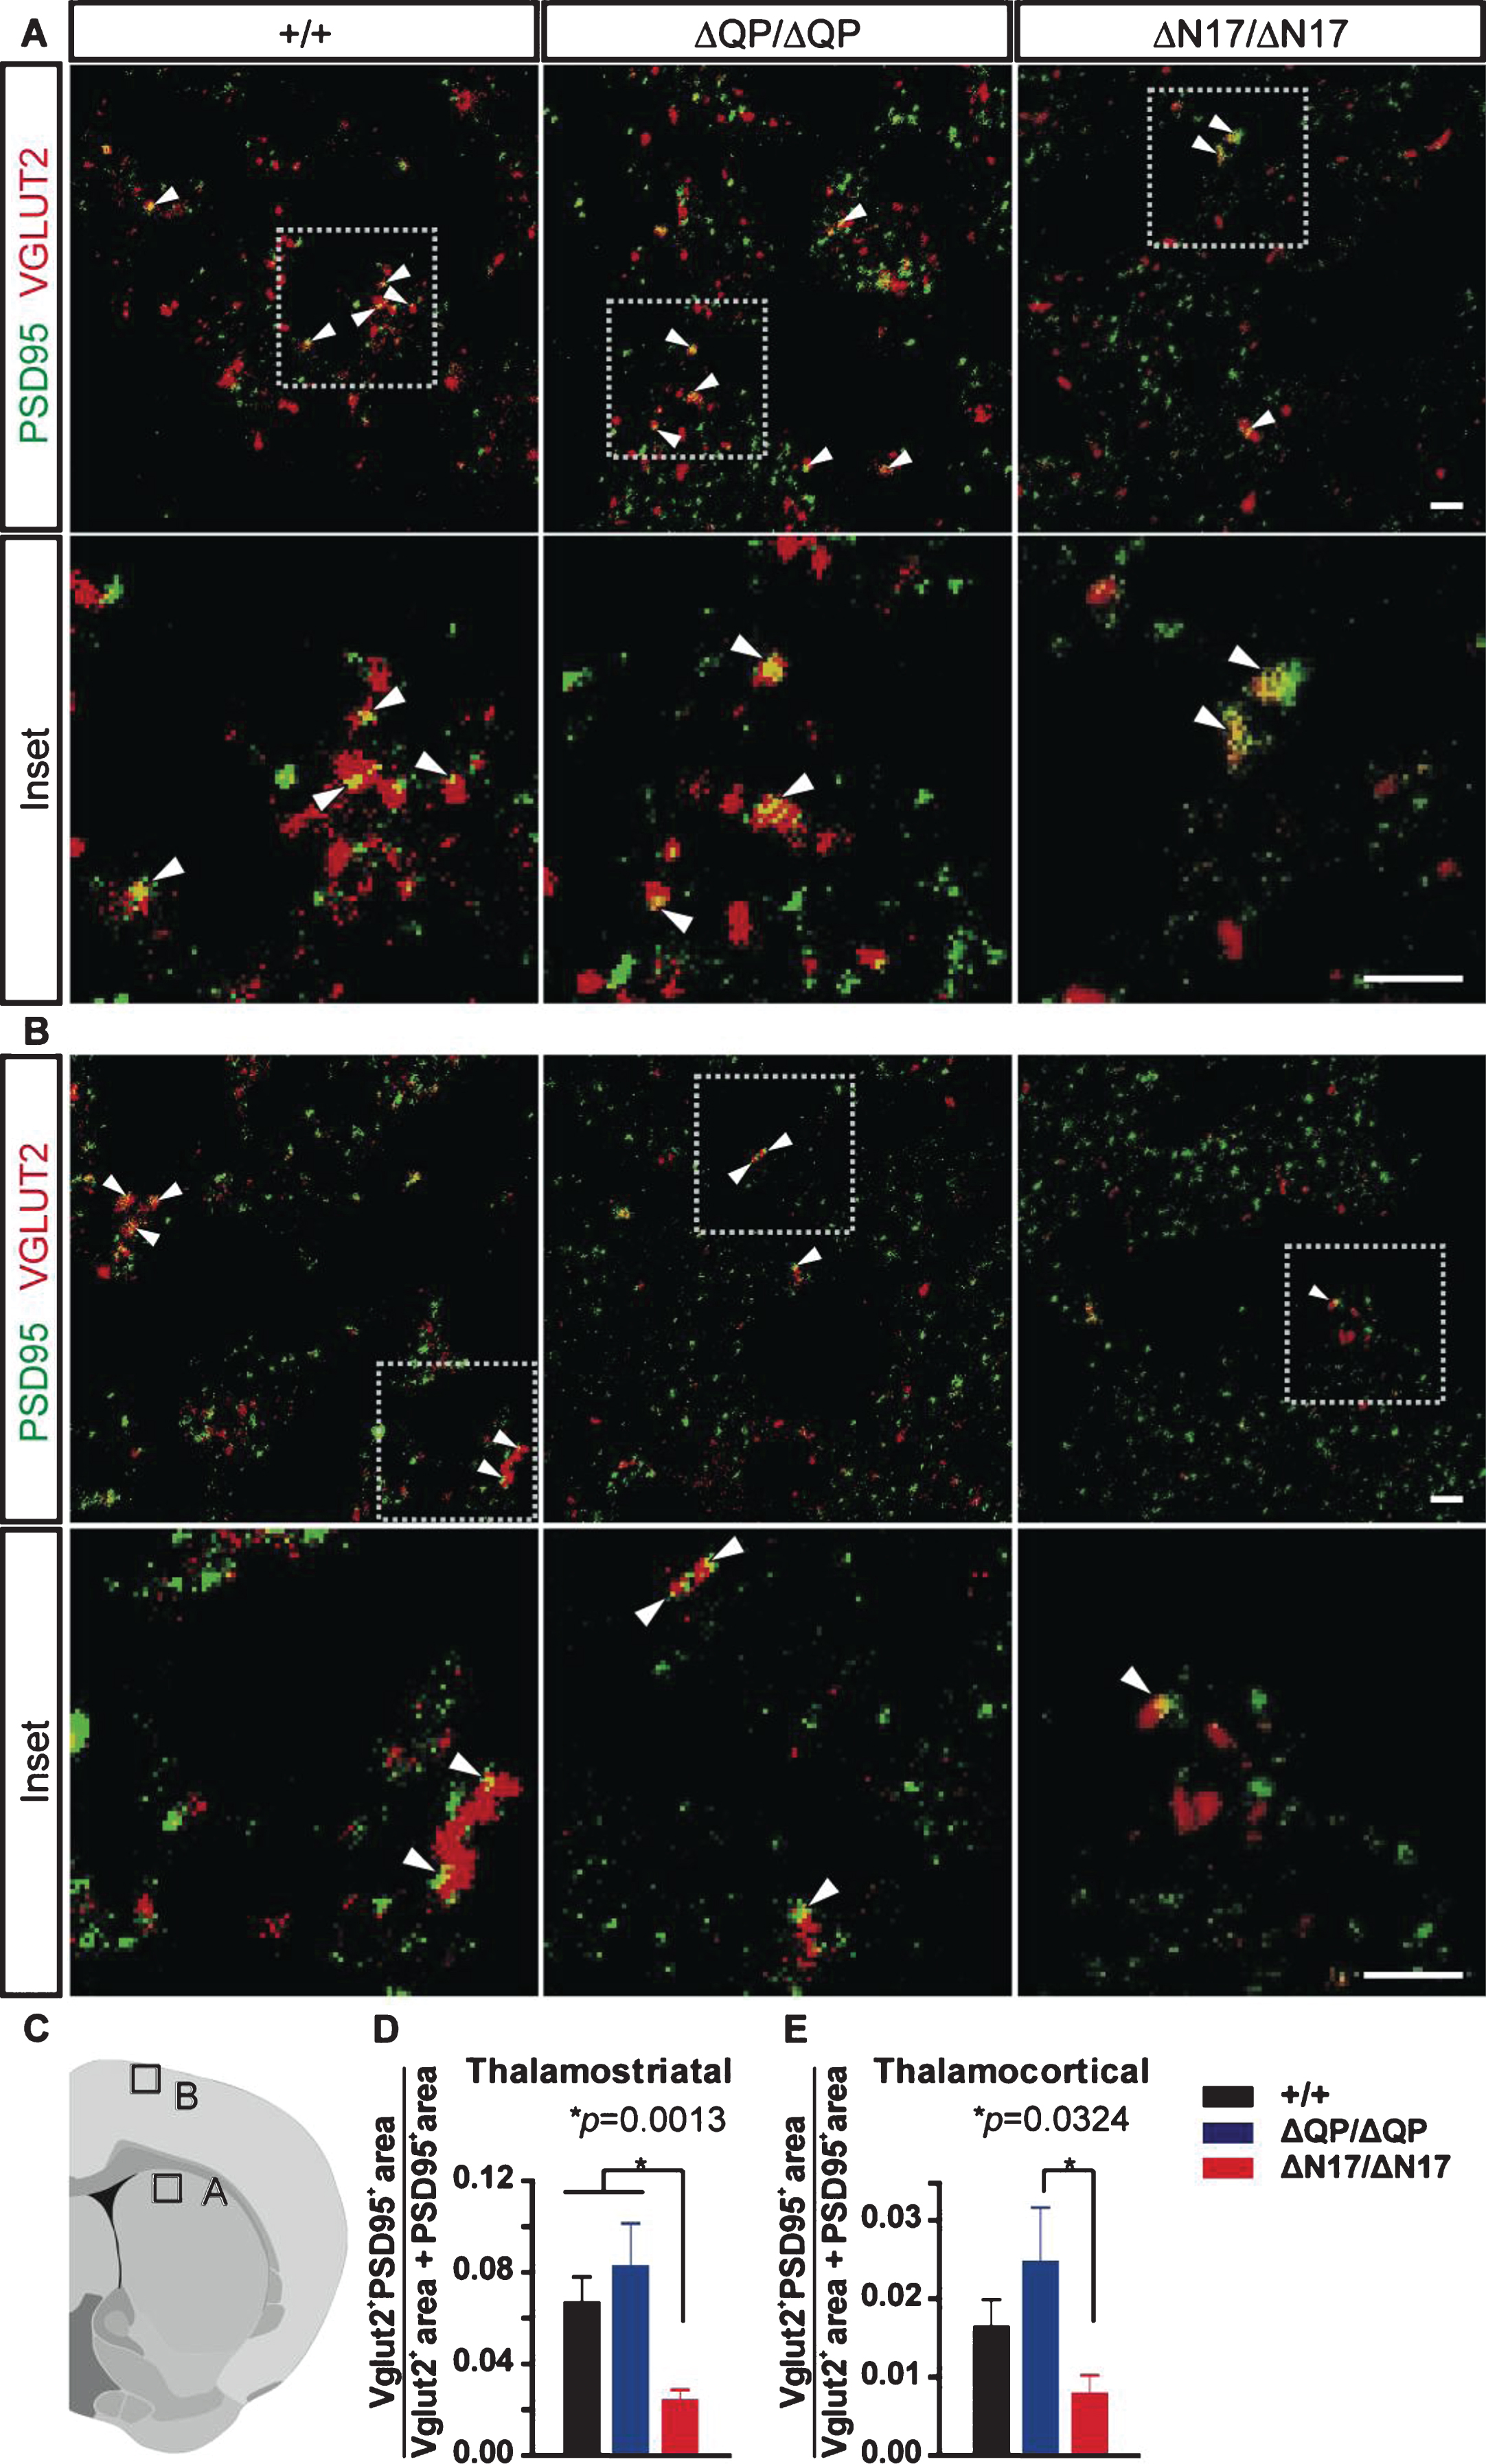
Fig.6
Western blots of whole brain microsomal fractions from 6-month-old mice. HttΔQP/ΔQP (ΔQP/ΔQP) and HttΔN17/ΔN17 (ΔN17/ΔN17) mice had significantly more Vglut2 expression in comparison to controls (HttΔQ/ΔQ: 1.276±0.146, HttΔQP/ΔQP: 1.612±0.106, HttΔN17/ΔN17: 1.780±0.161, p = 0.008). PSD-95 and Vglut1 levels were not significantly different between genotypes (PSD95: HttΔQ/ΔQ: 1.487±0.198, HttΔQP/ΔQP: 1.375±0.139, HttΔN17/ΔN17: 1.578±0.238, p = 0.2277), (Vglut1: HttΔQ/ΔQ: 0.8487±0.0878, HttΔQP/ΔQP: 1.094±0.1512, HttΔN17/ΔN17: 1.310±0.164, p = 0.1277) (mean±SEM, n = 3 mice /genotype, 1-way ANOVA).
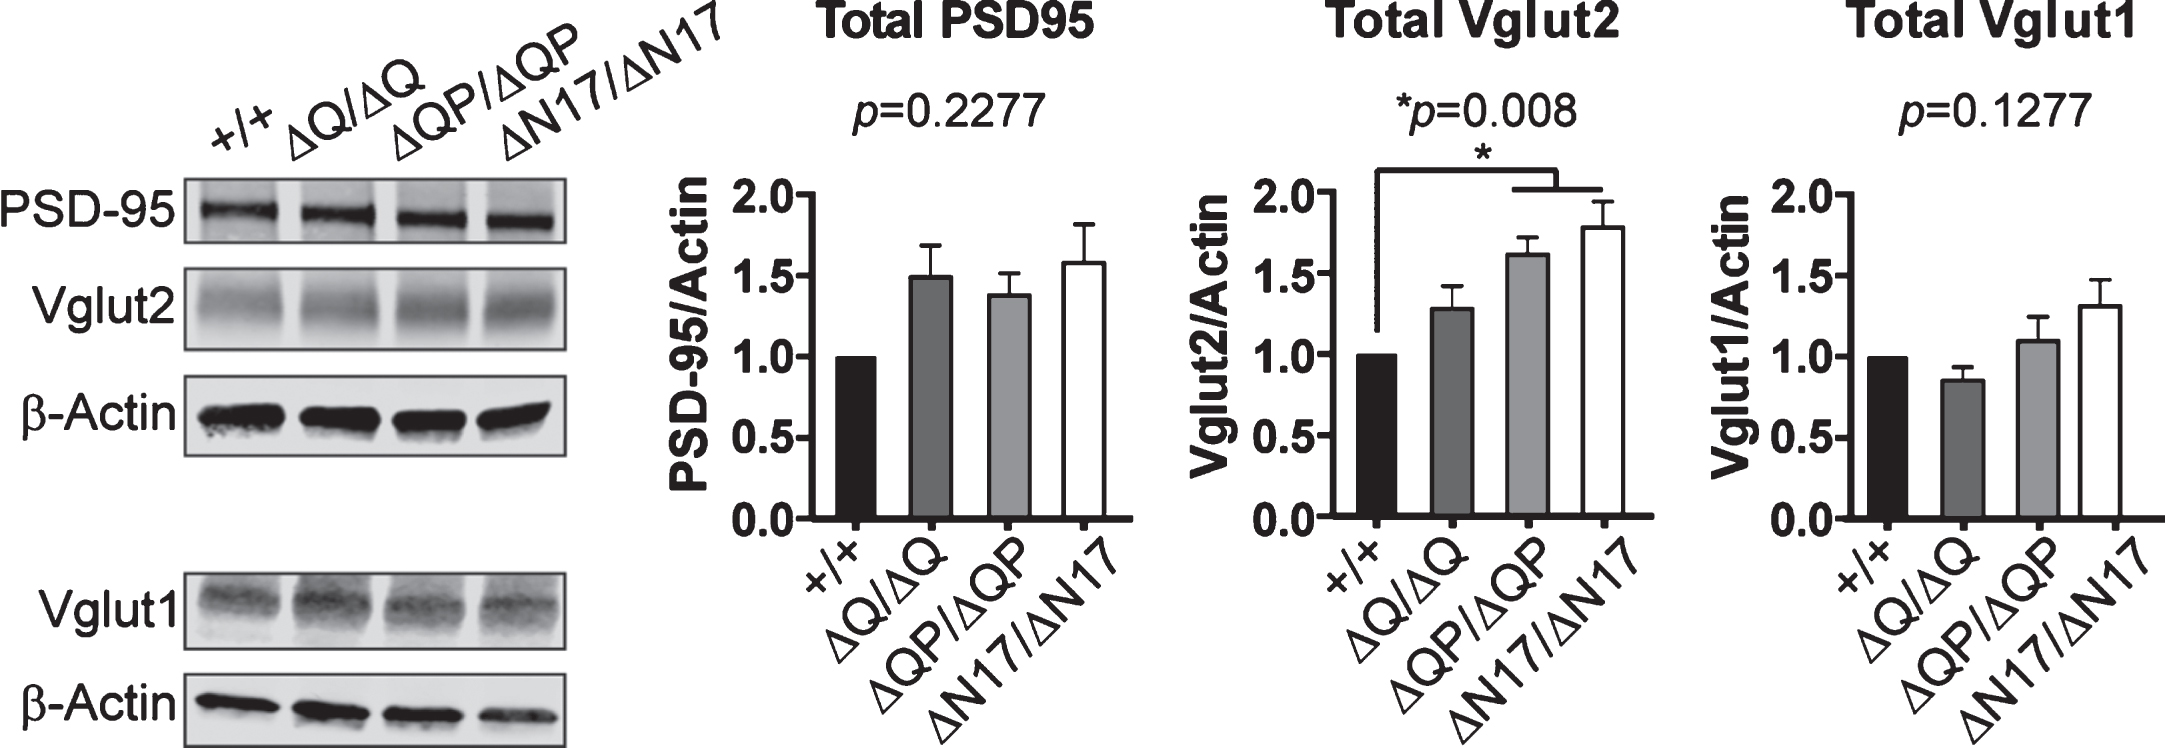
Table 1
The numbers and percentage (by genotype and sex) of progeny born from the various crosses and the results of χ2 analyses
| Genetic Cross | Genotype | # female | # male | Total | % | χ2 |
| ΔQP/+×ΔQP/+ | +/+ | 45 | 29 | 74 | 28.35 | 4.693 |
| ΔQP/+ | 55 | 58 | 113 | 43.30 | p = 0.096 | |
| ΔQP/ΔQP | 33 | 41 | 74 | 28.35 | ||
| ΔN17/+×ΔN17/+ | +/+ | 16 | 24 | 40 | 24.69 | 0.815 |
| ΔN17/+ | 40 | 46 | 86 | 53.09 | p = 0.665 | |
| ΔN17/ΔN17 | 17 | 19 | 36 | 22.22 | ||
| ΔQP/+×+/– | +/+ | 6 | 4 | 10 | 19.23 | 2.923 |
| +/– | 6 | 11 | 17 | 32.69 | p = 0.404 | |
| ΔQP/+ | 6 | 4 | 10 | 19.23 | ||
| ΔQP/– | 10 | 5 | 15 | 28.85 | ||
| ΔN17/+×+/– | +/+ | 5 | 4 | 9 | 30.00 | 2.800 |
| +/– | 2 | 2 | 4 | 13.33 | p = 0.424 | |
| ΔN17/+ | 7 | 3 | 10 | 33.33 | ||
| ΔN17/– | 4 | 3 | 7 | 23.33 |


