
Urban rail transit signal and control based on Internet of Things
Abstract
At present, China’s traffic signal control machine has a low level of intelligence and a single control strategy. It cannot make corresponding control according to the actual traffic situation, and its ability to direct traffic flow in a reasonable and orderly manner is low. In order to understand the urban rail transit signal and control system, we analyzed the requirements of the train dispatching subsystem, designed the overall architecture of the system from the perspective of function realization and architecture, and constructed the wireless sensor network of the system, which is the best for other experts. In this paper, combined with the research of related technologies of the Internet of Things (IoT), an intelligent traffic signal control machine is designed, and the traffic signal control effects under different algorithms are compared, and the relevant rail transit conditions are statistically studied. Studies have proved that sensors based on IoT technology can effectively improve the intensity and control effect of urban rail transit signals. Compared with other algorithm technologies, the overall score of the sensor algorithm is higher than other algorithms, and the ratio is about 30% higher. This article realizes the maintenance function of various data on the system simulation operation terminal, and builds the overall framework of the system; realize the main functions of the train dispatching operation terminal, including the realization of train dispatching functions such as station map, manual route arrangement, automatic route triggering, station deduction and station jump settings, and log report generation. This shows that the sensor algorithm under the IoT has a great promotion effect on the urban rail transit signal and control system.
1.Introduction
With the increasing population of cities and the continuous increase of car ownership, people’s travel problems are getting more and more attention. In addition, the various basic public transportation facilities in the city have been unable to meet people’s travel needs, and vigorously developing rail transit has become a key means for people to solve the congestion problem [1]. Compared with traditional public transportation, rail transit has the advantages of large capacity, high speed, low congestion, etc. However, the cost of subway per kilometer is as high as hundreds of millions of yuan, and the construction of a subway line often costs high construction costs. Citizens’ demand for urban rail transit is constantly expanding, and accordingly they have high requirements on the operation density and operational efficiency of urban rail transit. In this context, urban rail transit is increasingly dependent on signals, and is particularly concerned about the quality of signal project construction. As a domestic urban rail transit construction unit, during the construction of signal projects, it has to deal with many thorny issues from cutting-edge technology, complex interfaces, tight schedules, numerous supply links, huge installation and debugging workloads, etc., which affect the project’s There are many uncertain risks, and the pressure on project management is very high [8]. Therefore, how to effectively control, reduce or avoid the various risks of signal projects is the content that each urban rail transit construction unit pays special attention to during the construction of the new line.
Compared with foreign countries, the development of urban rail transit in China has a shorter development time, and rail technology and engineering construction experience are still at a mature stage [5]. Numerous majors, huge investment, complicated technology, long construction period, and susceptibility to external factors are the salient features of urban rail transit projects. There are many uncertain factors in the construction process, and many risks are unavoidable. The construction of urban rail transit engineering is a kind of project, involving a wide range of majors, mainly including civil engineering, railroads, vehicles, power supply, communications, signals, integrated monitoring, station wind, water, electricity, and disaster prevention. Urban rail transit signal technology is advanced, internal and external interfaces are many and complicated, and the design and commissioning workload is large. As the last link of rail transit construction, in order to ensure the operation and opening nodes, signal projects often need to digest the predecessors due to the demolition, tunnel, station construction, etc. The construction period delay caused by the process is more susceptible to a large number of uncertain factors [22]. Therefore, how to effectively reduce or avoid various uncertain risks and carry out efficient risk management and control of signal projects is the content that the construction unit pays special attention to in the construction process.
Urban traffic signal and control is one of the effective ways to solve traffic congestion. It affects the route choice strategy of travelers by publishing real-time traffic status information and guidance information. In this regard, experts at home and abroad have done a lot of research, and foreign countries started early due to rail transit. Allsop improved the combination method by compressing the road network to adapt it to the complex structure road network. Although this method can be applied to all forms of road network in theory, there are still many difficulties to solve if it is to be applied in practice. Robertson proposed the TRANSYT regional signal timing method. By establishing multiple traffic performance evaluation index functions, the hill-climbing method is used to optimize timing parameters. SCOOT uses this method and can achieve certain results, but generally only a local optimum can be obtained. And very dependent on the selection of the starting point [22]. In China, the research on urban rail transit signal and control started late. Zhaosheng designed a multi-agent model with a multi-layer structure of detection layer, control layer, and coordination layer. Based on this, he designed coordinated traffic dispatch and control. [4]; Zhipeng proposed a multi-agent behavior model in an intersection traffic simulation environment. Each vehicle is an agent, and adjusts its behavior by understanding the state of other vehicles at the intersection [21]. According to different traffic scenarios, the model designs the coordination mechanism between vehicle multi-agents, and designs the vehicle prediction module, so that the vehicle agents can predict the possible consequences of their own behaviors to adjust their own behaviors. Although these methods can achieve good results in theory, they are difficult to be practical due to the limitation of computing power and the requirements of real-time traffic control.
Researchers at home and abroad have conducted a lot of in-depth research in the field of traffic control and proposed many feasible solutions, but there are few detailed researches aimed at specific traffic scenarios (such as urban rail). As an emerging artificial intelligence technology, Internet of Things (IoT) technology is very suitable for transport and has shown many advantages over other methods. Through research into the basic technology of the built-in traffic controller and the application of IoT technology in the field of intelligent traffic control, it can push railway transit units to fully understand the current state of risk management in signal engineering projects and to design risk management plans for urban rail projects. And combined with specific construction project practice, summarized the experience and lessons of signal project risk management, which has a certain degree of guiding significance for the risk management practice of similar projects.
2.Urban rail transit signal and control research methods
2.1.IoT
The IoT uses information recognition technology, such as the interaction between sensors and personnel, and devices through wireless networks. Through the comprehensive application of handwriting recognition, identity recognition, sensor wireless network and other IoT technologies, recognition, positioning, monitoring and management have been carried out [10,19]. The IoT is developed on the basis of sensor technology, communication technology, database technology and the Internet. It uses sensors to perceive various information in the physical world and transmits information to the Internet world through data communication technology. It can also use Internet terminals the device sends instructions or transmits information to certain controllable elements in the real world. The IoT technology can realize the comprehensive perception, reliable transmission and analysis and processing of information. According to these three functions, the IoT can be divided into a perception layer, a transmission layer and an application layer.
(1) Perception layer the perception layer is the bottom layer of the IoT architecture, which can be subdivided into the perception sublayer and the communication sublayer [12]. Among them, the perception sublayer is mainly responsible for collecting physical information in the real world and converting it into electrical signals that can be recognized by embedded devices. It can also perform certain specific operations. The physical devices on this layer are mainly various sensors (such as temperature, Humidity sensors) or electronic tags, as well as some controllable components (such as lights, relays); the physical information collected by sensors cannot often be sent directly to the Internet, but only through a communication sublayer with communication capabilities to access the Internet. Layer usually refers to some short-range wireless communication technologies, such as RFID, Wi-Fi, ZigBee, etc.
(2) Transport layer the transport layer is the middle layer of the IoT. It receives information from the perception layer and transmits it to users or Internet terminals remotely. This level involves data remote transmission technology, which is the link between people and things. Currently, the commonly used remote communication technologies are GPRS and Ethernet, both of which use the TCP/IP communication protocol. GPRS communication is not as reliable and stable as Ethernet, but Ethernet the net needs to be wired.
(3) Application layer the application layer is the uppermost layer of the IoT architecture. It is application software designed according to a certain specific demand. It generally has a visual human-computer interaction interface. Its function is to display and display the received data information. Save, you can also analyze and calculate the data according to the needs of users to get the desired results or generate solutions to problems. The application software of this layer is usually designed with a visual programming language combined with database technology [6].
The application of the IoT technology in the field of intelligent traffic control can realize the combination of the three functions of traffic flow data collection, transmission, and generation of control strategies, and raise the research and application of intelligent transportation to a whole new level. Combined with the three-tier structure of the IoT, the intelligent traffic control machine adopts a three-tier architecture composed of a data acquisition layer, a data transmission layer, and a data management layer [11]. How to obtain effective data from physical sign sensor networks and environmental sensing equipment is a very critical issue. Therefore, it is very necessary to use effective data fusion technology to process related data. In order to reduce the data delay in the network, this paper proposes the minimum delay fusion path method accordingly:
Among them, D is a normal number, which is called the penalty factor. If the value of D is large, it means that the penalty for deviation is large. At this time, the regression function can be expressed as
Among them, the data collection layer uses professional detectors to collect traffic flow data and sends it to the transmission layer by short-range wireless communication technology; the role of the transmission layer is to establish a highly reliable and real-time remote between the traffic management center and urban roads The communication network meets the needs of traffic control data interaction. In the long-distance communication technology, Ethernet communication is more stable than GPRS and the wiring in the city is more convenient. Therefore, it is more appropriate to choose Ethernet; running monitoring software on the computer can remotely monitor the traffic conditions [7,23].
2.2.Sensor technology
In the process of predicting traffic flow, the correlation of traffic flow is a factor that must be considered. This article discusses temporal and spatial correlation. Time correlation refers to the correlation between current traffic flow and past traffic flow and the length of time, and spatial correlation refers to the correlation between the traffic flow of the target road section and its upstream and downstream road sections in the same time interval [16,20]. In order to describe the temporal and spatial correlation in the road network, we add sensors to the pipeline traffic and learn the specific conditions of the pipeline traffic through the sensors. The calculation process is as follows:
The corresponding equation is
An optimization problem that can be transformed into a function, let the error function be:
The
Which represents the fractional frequency operator, and its time domain expression is:
In the formula, δ is a time operator and λ is frequency operator. Using the relationship between the Hermite operator and the instantaneous variable, the instantaneous fractional frequency u of the signal
The signal
The acceptance probability
2.3.Urban rail transit
In recent years, with the rapid advancement of urbanization, traffic in major cities in China has become increasingly congested. In order to alleviate traffic conflicts and reduce automobile exhaust emissions, urban rail transit has gradually become a city as a convenient, large-volume, and green public transportation method. The preferred transportation solution plays an important role in the transportation of large and medium-sized cities [2,3]. As an important part of ensuring traffic safety and improving operational efficiency, rail transit signals are the most critical electromechanical equipment for urban rail transit and one of the important equipment representing the degree of automation of rail transit. Citizens’ demand for urban rail transit is constantly expanding, and accordingly they have high requirements on the operation density and operational efficiency of urban rail transit. In this context, urban rail transit is increasingly dependent on signals, and special attention is paid to the construction quality of signal projects [13]. As a domestic urban rail transit construction unit, during the construction of signal projects, it has to deal with many thorny issues such as cutting-edge technology, complex interfaces, tight schedules, numerous supply links, and huge installation and commissioning workloads, which affect the project’s There are many uncertainties and risks, and the pressure on project management is very high. Therefore, how to effectively control, reduce or avoid the various risks of signal projects is the content that each urban rail transit construction unit pays special attention to in the process of new line construction [15].
In this paper, a set of intelligent traffic signal control machine is designed through the IoT technology. The traffic control machine can collect traffic flow data at intersections and transmit it to the traffic management center. The traffic management center can monitor the traffic conditions at the intersection in real time and remotely control the relevant parameters of the traffic lights. And control method, the traffic control machine designed in this article is divided into data acquisition layer, data transmission layer and data management layer in structure. The data collection layer collects vehicle traffic based on magnetoresistive sensors and ZigBee wireless sensor network technology. There are three types of nodes in the ZigBee network: terminal nodes, router nodes and coordinator nodes. The terminal nodes are connected with magnetoresistive sensors, and this type of node is mainly responsible for collecting the traffic flow and the data are transmitted to the router node, the router node forwards the data to the coordinator node, and the coordinator node forwards the data to the intersection control machine through the serial port [9,14]. The data transmission layer adopts Ethernet technology. The intersection controller connects to the Internet through Ethernet and transmits data to the computer of the traffic management center; the computer of the traffic management center is the data management layer, and the computer is installed with the upper computer monitoring software, which can be used to display and save data and can generate traffic signal control commands and download them to the designated intersection control machine [17]. The design framework is shown in Fig. 1.
Fig. 1.
Traffic control network framework designed based on the IoT.
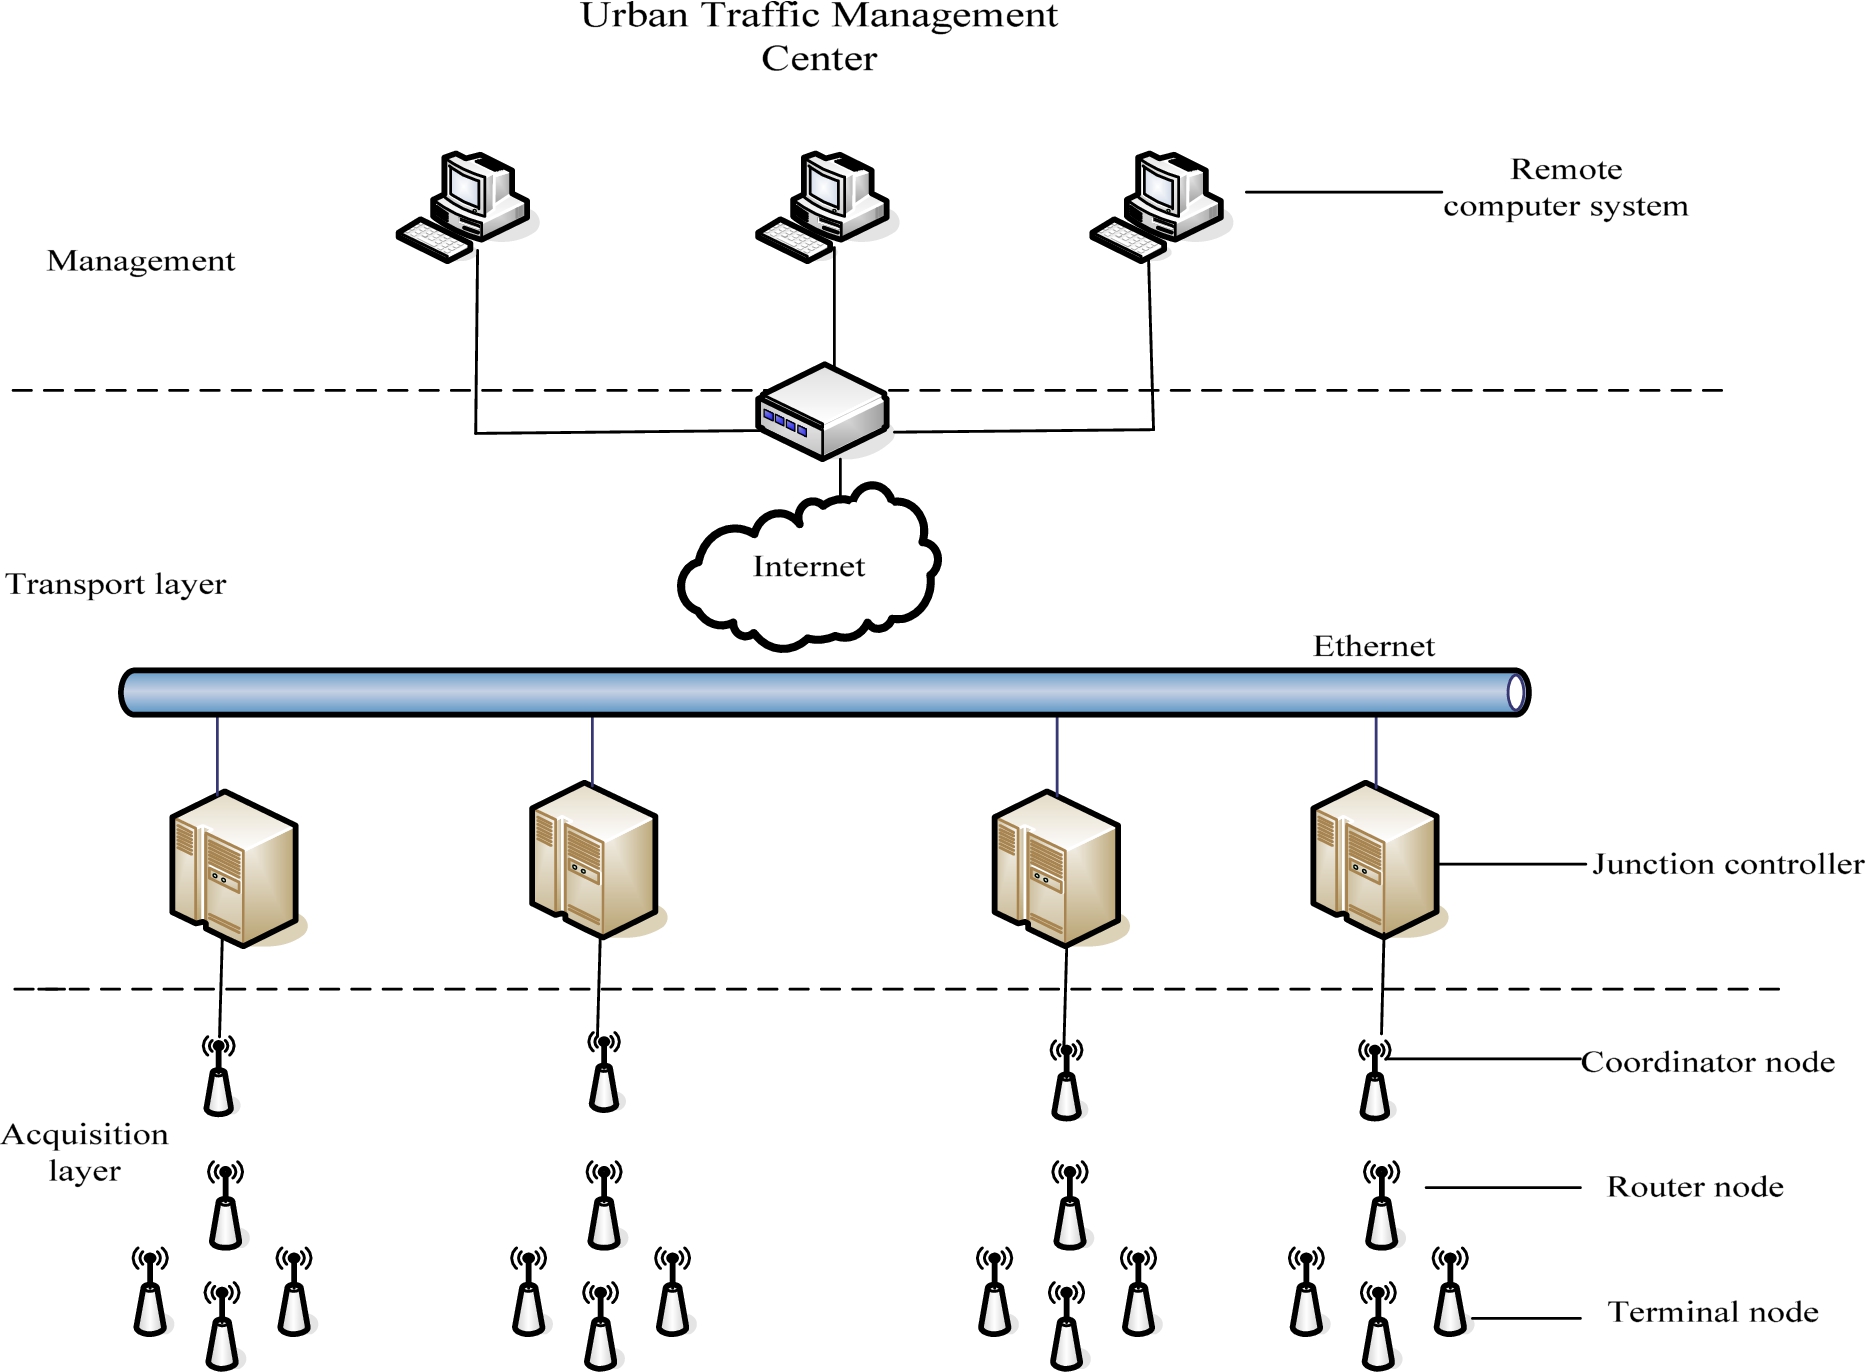
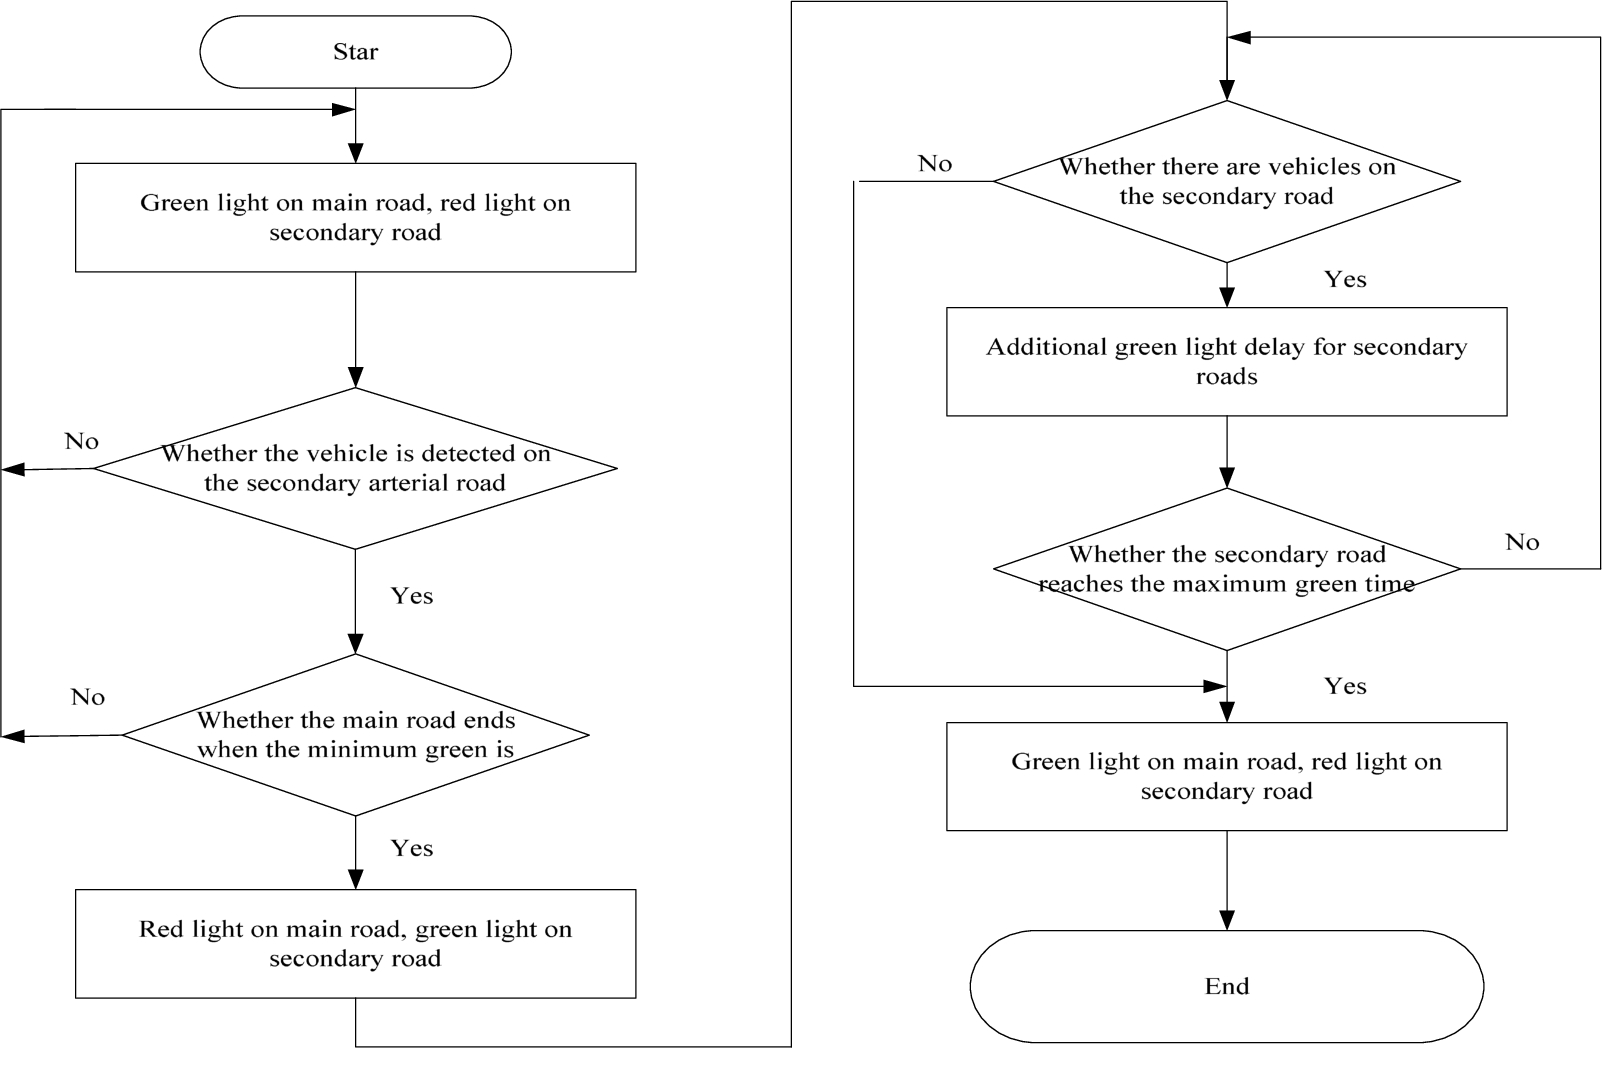
Because ZigBee belongs to the short-range wireless communication technology, in the collection layer of the traffic control machine shown in Fig. 1, the traffic data is transmitted from the terminal node to the coordinator node via the router node. In the actual engineering project, if the terminal node and the distance between the coordinator nodes is within the communication range of ZigBee, and the two can also communicate directly [18]. The signal flow of urban rail transit is shown in Fig. 2. As can be seen, the signal lights of rail transit will control the traffic lights according to the current traffic conditions to facilitate the passage of vehicles. The dynamic physics of the urban rail transit work process is based on the on-site post settings, and the main work process of the line is demonstrated on the physical sand table, including data management, train entry and exit lines, train number loading, and automatic train line operation, The stop and departure of trains, the skipping of trains and platform deductions, the display of station yard maps, manual route management and train operation information display.
Fig. 2.
Traffic control process.
3.Research experiment on urban rail transit signal and control
3.1.Model design
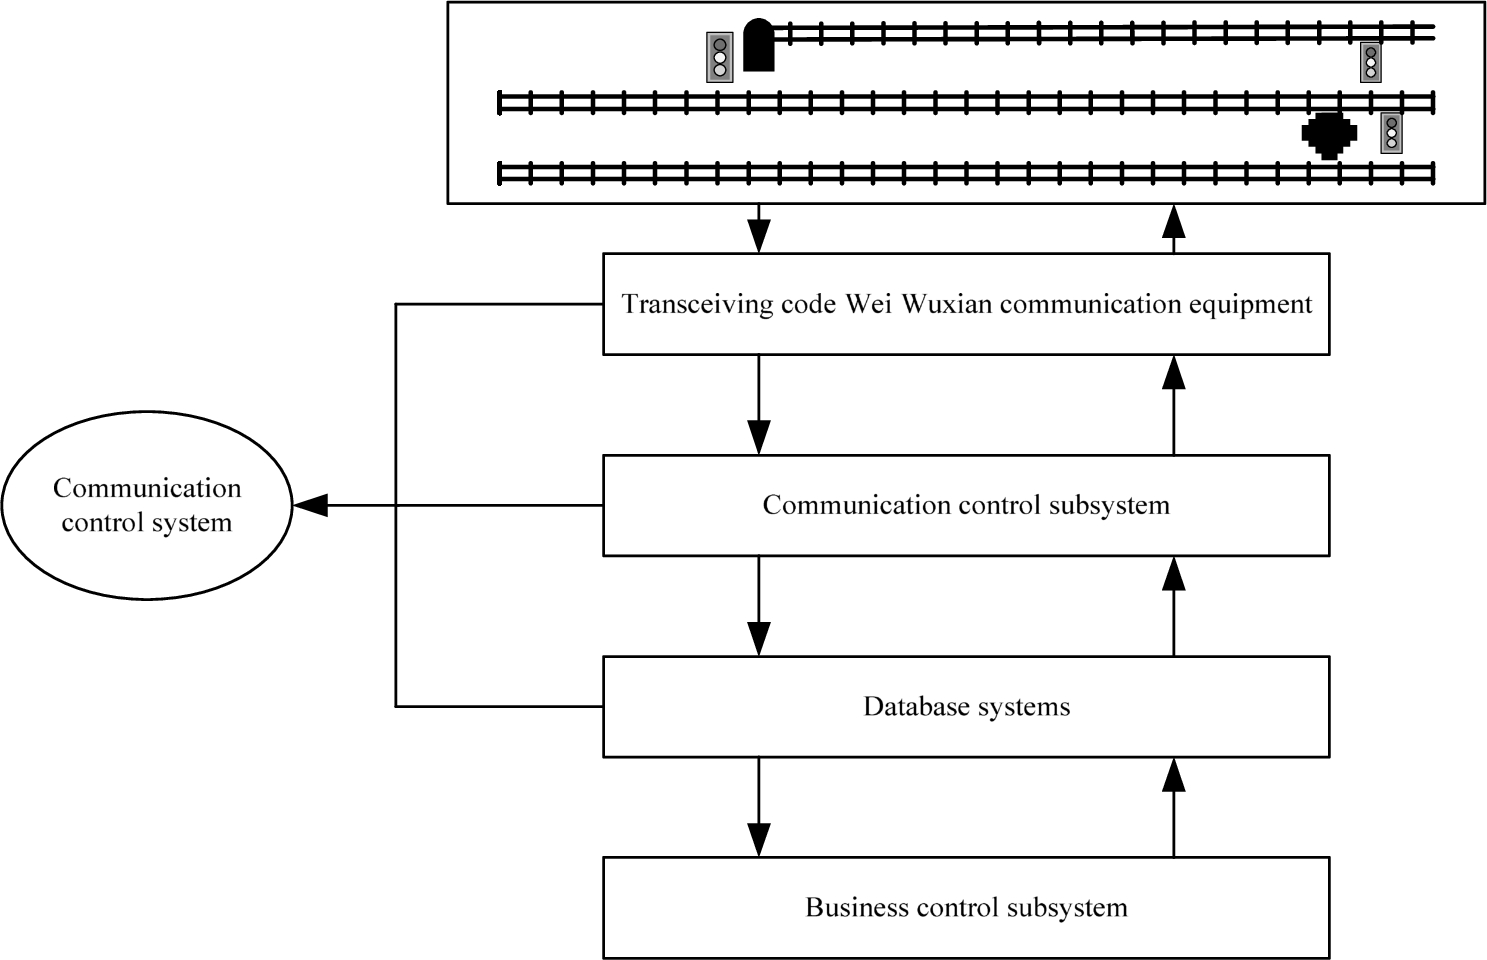
The operation terminal is set up according to the on-site position, and multiple computers are required to operate at the same time. During the operation, a large amount of data needs to be transmitted to control the hardware equipment on the physical sand table. Therefore, the advantages of adopting the C/S structure design scheme based on distributed computing are: on the one hand, it is conducive to the rational use of the processing capacity of the central server; on the other hand, it can greatly reduce the data flow on the communication network and control the physical equipment. The amount of data is large, and the amount of data transmission is reduced as much as possible, which is beneficial to improve the efficiency and enhance the feasibility. In order to simplify the dynamic physical simulation of urban rail transit, the structure is mainly divided into three major components, namely rail transit, communication control, and Business control, as shown in Fig. 3.
Fig. 3.
Simulation of rail transit working process.
3.2.Semaphore model
The main line signal of urban rail transit is divided into the outbound signal, and the signal is blocked by the signal. The semaphore displays a green light to indicate that the train is allowed to pass, the approach ahead has been lined up and the turnouts ahead are in position; the yellow light on the signal indicates that the train is allowed to pass, the approach to the front is lined up and the turnouts are in reverse position, and a red light indicates The train is forbidden to pass this signal., The voltage input and output module provides power for the signal machine through the rail power supply, and the signal control module controls the change of the LED color through the received data frame. The signal machine parameters are shown in Table 1.
Table 1
Signal parameters
| Signal parameters | Value |
| Signal size | Determined according to the type of signal |
| Input voltage | −12 V–+12 V |
| The output voltage | −12 V–+12 V |
| Output current | 50 mA |
| Module | Control module, communication module |
| way of communication | Half-duplex broadcasting station |
| Drive method | LED lights |
| Baud rate | 9600 Bd/s |
3.3.Signal recognition
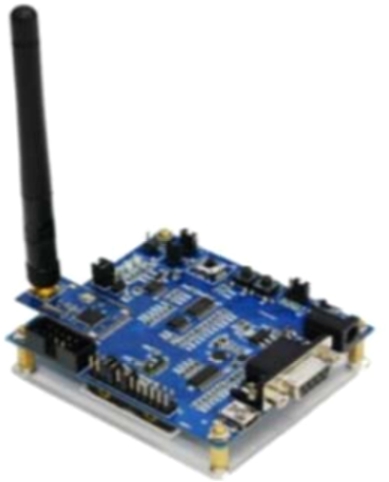
The infrared recognition receiving module is mainly used to detect the current position of the vehicle, which is similar to the role of the locator in the urban rail transit field line, and detects whether the area where the current locator is located is occupied by the vehicle. After the infrared recognition receiving module recognizes the positioning transmitter sensor laid on the lower side of the track, it stores the number of the locator in the train, and the wireless communication module integrates the number of the locator with the number of the embedded single-chip microcomputer in the train, and then sends it to the communication Controlled transceiver code wireless communication equipment. Combining the practical application and the structural characteristics of the wireless sensor network, the star topology network structure is adopted. The structure of the star network topology system is a single-hop network system structure. All sensor nodes communicate with the central coordination node directly. The wireless sensor network is established through ZigBee module, the ZigBee model is shown in Fig. 4.
Fig. 4.
ZigBee signal model.
3.4.Statistics
All data analysis in this article uses SPSS19.0, statistical test uses two-sided test, significance is defined as 0.05, and
4.Experimental analysis of urban rail transit signal and control research
4.1.Train information statistics
We have made relevant experiments on trains. In the interface, the operator selects “Train Information Statistics” to enter the corresponding simulation interface. The query range can be determined by selecting the time to be queried, and the scheduled trains will be listed on the specified date in the form of a table. Information about the number of trains, the actual number of trains in operation, the number of additional trains, the number of delayed trains, the number of arriving trains, and the number of skipped trains. When the information of the day is queried and the operation has not ended, the statistical value is up to the current time, as shown in Table 2.
Table 2
Train information statistics
| Date | Planned number of vehicles | Actual number of vehicles | Increase the number of vehicles | Number of delayed trains | Number of trains arriving late | Number of skipped trains |
| 2020.12.4 | 15 | 13 | 0 | 0 | 0 | 0 |
| 2020.12.5 | 7 | 7 | 0 | 0 | 3 | 0 |
| 2020.12.6 | 15 | 15 | 0 | 0 | 3 | 2 |
| 2020.12.7 | 9 | 7 | 2 | 1 | 0 | 0 |
| 2020.12.8 | 15 | 13 | 2 | 2 | 2 | 0 |
| 2020.12.9 | 0 | 0 | 0 | 0 | 0 | 0 |
| 2020.12.10 | 11 | 9 | 0 | 3 | 1 | 0 |
Determine the query range by selecting the time to be queried, and list the planned number of single trips, the number of executed single trips, and the redemption rate information on the specified date in a tabular form. When the information of the day is queried and the operation has not ended, the statistical value is up to the current time, as shown in Table 3.
Table 3
Operational redemption diagram
| Date | Plan one way number | Number of one-way executions | Redemption rate |
| 2020.12.11 | 16 | 10 | 65.5% |
| 2020.12.12 | 12 | 5 | 41.67% |
| 2020.12.13 | 16 | 8 | 50% |
| 2020.12.14 | 14 | 5 | 41% |
| 2020.12.15 | 16 | 7 | 48% |
| 2020.12.16 | 0 | 0 | 0 |
| 2020.12.17 | 0 | 0 | 0 |
| 2020.12.18 | 0 | 0 | 0 |
| 2020.12.19 | 16 | 11 | 72% |
| 2020.12.20 | 12 | 4 | 33.3% |
4.2.Hardware debugging
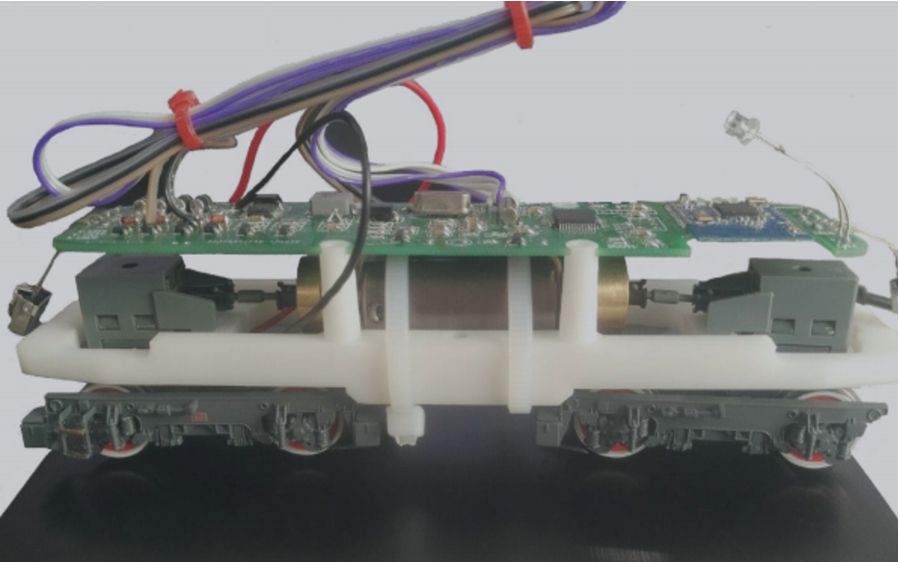
In order to realize the digital control dynamic physical simulation of urban rail transit work process, it is necessary to ensure the reliability of the hardware, which mainly includes the control of rolling stock, turnouts and signals. The control of the vehicle mainly includes the forward, backward, acceleration, parking and positioning test of the vehicle. By connecting the vehicle microcontroller to the vehicle and putting the vehicle on the track; the infrared microcontroller is also connected to the track. The vehicle motion control code transmitter and the vehicle inquiry code transmitter are connected through a computer USB interface, and the serial debugging software assistant sends control data to the vehicle single-chip computer to control the vehicle’s motion state. Figure 5 is the control diagram of the vehicle model. The control code is sent to the vehicle through the vehicle motion control code transmitter to realize the corresponding motion state.
Fig. 5.
Vehicle model.
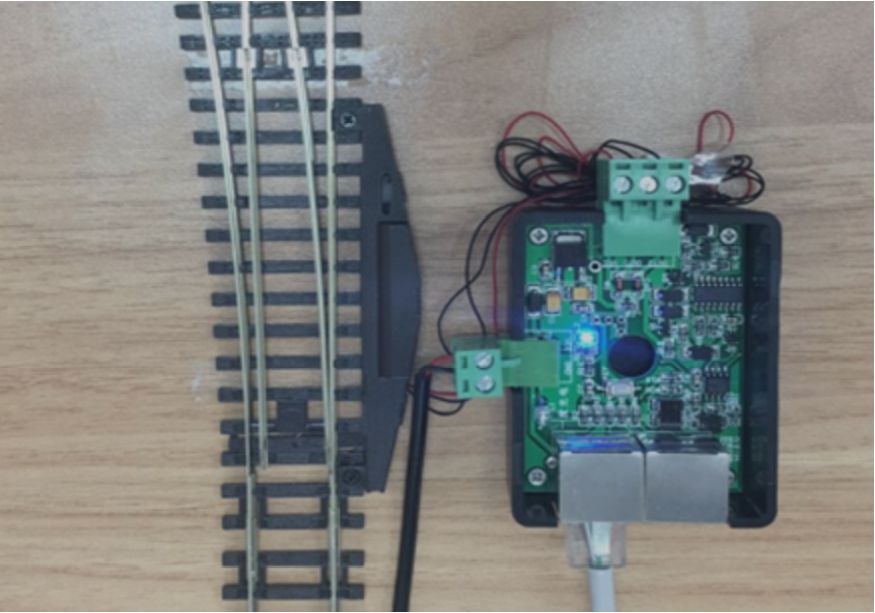
The function of the control of the turnout is mainly to control the positioning and reverse state of the turnout; the function of the signal machine control is mainly to control and test the three states of the signal machine on, off and flashing. By connecting the turnout and signal single-chip microcomputer to the turnout and signal model respectively, and connecting the voltage input and output terminals to the track. Connect the switch and the signal machine to control the code transmitter through the computer USB interface, and use the serial debugging software assistant to send the control data to the switch and the signal machine microcontroller to control the state of the physical object. Figure 6 is the state control test diagram of the signal machine. The signal machine is controlled by the code transmitter to send the corresponding control code to the signal machine, and the signal machine can be controlled according to the program. Figure 7 is the turnout state control test diagram. The turnout control code transmitter sends the corresponding control code to the turnout, and the turnout can switch to the corresponding state according to the program.
Fig. 6.
Signal state diagram.
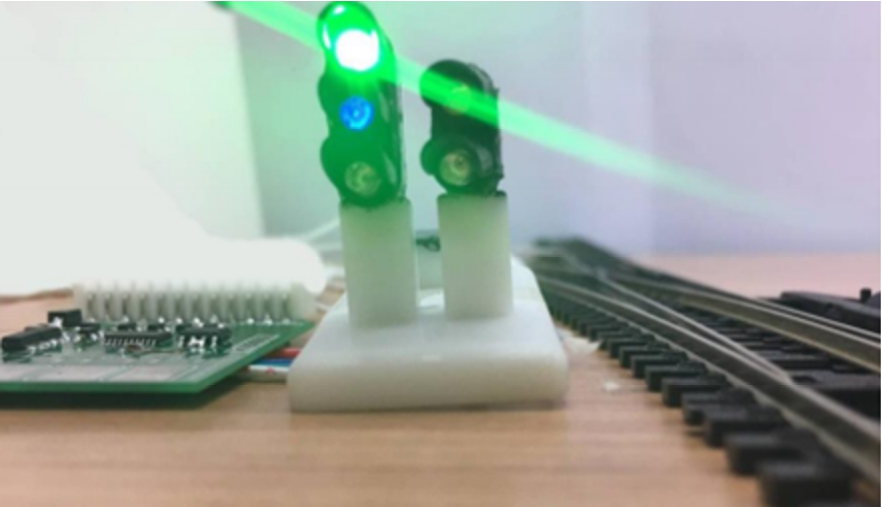
Fig. 7.
Turnout state control diagram.
4.3.Signal control under different IoT technologies
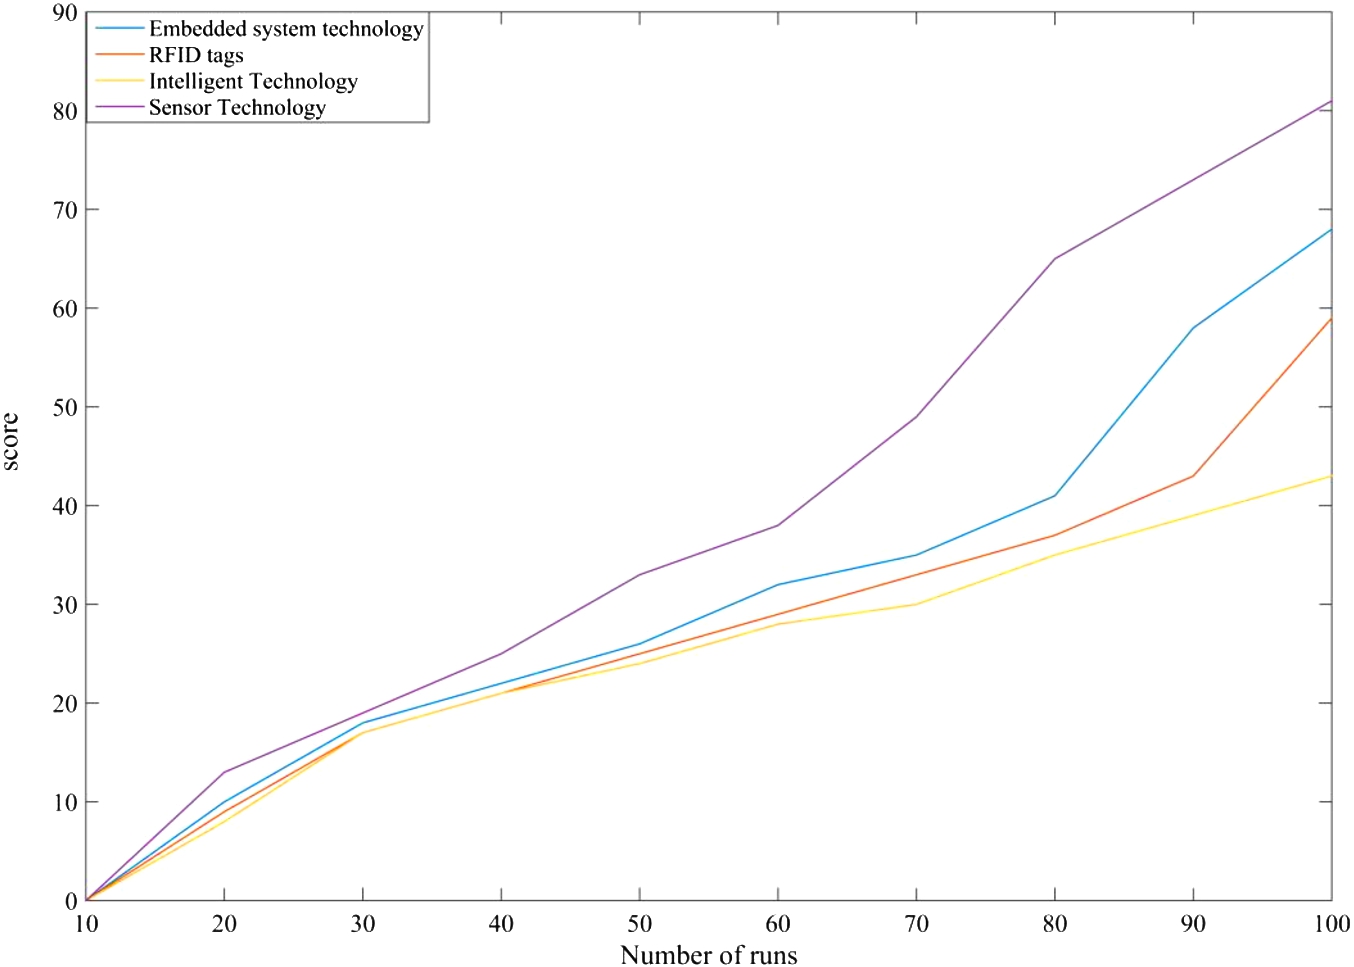
Through previous experiments, we have collected the control of rail transit signals by different technologies of the simulated IoT in different situations, as shown in Table 4. It can be seen that through the sensor technology, the various parameters in the signal recognition are much higher than the parameters of other IoT technology, in which the transmission efficiency and transmission speed have great changes, in this article The sensor technology used in the experiment is established, and its related parameters should be established with high embedded technology and intelligent technology. In order to verify the correctness of the experiment, we run multiple models under different algorithms to understand the situation, as shown in Fig. 8. From this figure we can see that at the beginning of the operation, the signal ratings of different algorithms are not very different, but when the number of executions exceeds about 40 times, the differences between the algorithms begin to appear. This article uses sensors in the IoT. The signal score of technology in rail transit exceeds that of other technologies, and as the number of operations increases, the difference is also increasing, and the maximum difference between the scores is nearly 30%. This shows that sensor technology based on the IoT can play an important role in rail transit signal control.
Table 4
Parameters of each communication method
| Signal strength | Transfer speed | Transmission distance | Adaptation rate | Effectiveness | |
| Embedded system technology | 1.93 | 2.19 | 2.44 | 2.05 | 2.4 |
| RFID tags | 1.3 | 1.77 | 2.04 | 2.11 | 2.07 |
| Intelligent technology | 2.12 | 2.39 | 2.57 | 2.47 | 2.6 |
| Sensor technology | 2.43 | 2.42 | 2.73 | 2.6 | 2.75 |
Fig. 8.
Signal conditions under different algorithms.
5.Conclusion
With the rapid development of urban rail transit, the construction of urban rail transit laboratories will inevitably play an important role in cultivating rail transit talents. Based on the relevant literature and the rich field experience of domestic and foreign rail transit operating companies, this paper summarizes the current emphases and shortcomings of rail simulation at home and abroad. On this basis, a set of urban rail transit physical simulations that are more suitable for on-site training dispatchers and rail transit talents are proposed. The demand analysis and overall structural framework of this model are introduced in detail, and the entire model is divided into multiple sub-operations, and according to on-site job requirements, it is divided into multiple operation terminals, realizing the “station-based on-site position”. Completed the design of the signal equipment on the physical sand table, such as the signal machine, the switch machine, and the model of the train. The wireless sensor network was constructed through infrared wireless identification technology and Zigbee wireless communication technology to ensure the communication between various wireless devices in the middle and the business operation terminal. This article also has some shortcomings. Due to time constraints, the entire set of overall hardware and software joint debugging has not been completed. At present, it is only for hardware and software separate debugging. For the line adjustment subsystem, it is only implemented in software, and has not been combined with hardware testing. Therefore, the hardware test function needs to be combined in the later stage.
Acknowledgements
This work was supported by the Guangxi University innovation team and excellence scholar program.
Conflict of interest
The authors have no conflict of interest to report.
References
[1] | G. Cai, C. Yang, Y. Pan et al., EMD and GNN-AdaBoost fault diagnosis for urban rail train rolling bearings, Discrete & Continuous Dynamical Systems 12: (4&5) ((2019) ), 1471–1487. doi:10.3934/dcdss.2019101. |
[2] | W. Chen and I.J. Wassell, A decentralized Bayesian algorithm for distributed compressive sensing in networked sensing systems, Wireless Communications IEEE Transactions on 15: (2) ((2016) ), 1282–1292. doi:10.1109/TWC.2015.2487989. |
[3] | T. Fossati and T.H. Transport, Layer Security (TLS)/Datagram Transport Layer Security (DTLS) profiles for the Internet of Things, Physiological Reviews 66: (4) ((2016) ), 1121–1188. |
[4] | M. Handschin, ETCS in Deutschland – Die Chance für mehr Verkehr auf der Schiene?! Aus Sicht der ETCS-Fahrzeugausrüstung (Alstom Transport Deutschland GmbH), ZEVrail – Glasers Annalen 143: (1–2) ((2019) ), 7–9. |
[5] | J.B. Ingvardson, J.K. Jensen and O.A. Nielsen, Analysing improvements to on-street public transport systems: A mesoscopic model approach, Public Transport 9: (1) ((2018) ), 1–25. |
[6] | X. Jie, Z. Zhong and B.A. Wireless, Powered sensor networks: Collaborative energy beamforming considering sensing and circuit power consumption, IEEE Wireless Communication Letters 5: (4) ((2016) ), 1–8. doi:10.1109/LWC.2016.2587019. |
[7] | K. Kernstock and M.M. Die, Bahnkommunikation der Zukunft – von den Anforderungen und technologischen Überlegungen bis hin zur Umsetzung, Signal + Draht 111: (6) ((2019) ), 45–52. |
[8] | E.V. Kuzmin, O.E. Gorbunov, P.O. Plotnikov et al., On finding a threshold of useful signals in the analysis of magnetic and eddy current defectograms, Modeling and Analysis of Information Systems 24: (6) ((2017) ), 760–771. doi:10.18255/1818-1015-2017-6-760-771. |
[9] | J. Lin, W. Yu, N. Zhang et al., A survey on Internet of Things: Architecture, enabling technologies, security and privacy, and applications, IEEE Internet of Things Journal 4: (5) ((2017) ), 1125–1142. doi:10.1109/JIOT.2017.2683200. |
[10] | R. Liu, Y. Zhao, Wei and S. Enhance, Neighbor reversibility in subspace learning for image retrieval, IEEE Journal of Selected Topics in Signal Processing 12: (6) ((2018) ), 1338–1350. doi:10.1109/JSTSP.2018.2879581. |
[11] | Y. Liu, G.Y. Li and H. Wei, Quantization and feedback of spatial covariance matrix for massive MIMO systems with cascaded precoding, IEEE Transactions on Communications 65: (4) ((2017) ), 1623–1634. doi:10.1109/TCOMM.2017.2658619. |
[12] | H. Manz, Zertifizierung der satellitenbasierten Ortung als industrielle Komponente im Schienenverkehr, ZEVrail – Glasers Annalen 141: (10) ((2017) ), 372–379. |
[13] | H. Mostafa, T. Kerstin and R.S. Wearable, Devices in medical Internet of Things: Scientific research and commercially available devices, Healthcare Informatics Research 23: (1) ((2017) ), 4–15. doi:10.4258/hir.2017.23.1.4. |
[14] | M. Mozaffari, W. Saad, M. Bennis et al., Mobile Unmanned Aerial Vehicles (UAVs) for energy-efficient Internet of Things communications, IEEE Transactions on Wireless Communications 11: ((2017) ), 7574–7589. doi:10.1109/TWC.2017.2751045. |
[15] | M.R. Palattella, M. Dohler, A. Grieco et al., Internet of Things in the 5G era: Enablers, architecture and business models, IEEE Journal on Selected Areas in Communications 34: (3) ((2016) ), 510–527. doi:10.1109/JSAC.2016.2525418. |
[16] | Y.T. Pan, X. Liu, G.X. Zheng et al., Temporal autocorrelation of small-scale fading using leaky coaxial cable in confined space, IEEE Wireless Communications Letters 7: (6) ((2018) ), 1082–1085. doi:10.1109/LWC.2018.2864284. |
[17] | J. Singh, T. Pasquier, J. Bacon et al., Twenty security considerations for cloud-supported Internet of Things, IEEE Internet of Things Journal 3: (3) ((2017) ), 269–284. doi:10.1109/JIOT.2015.2460333. |
[18] | B. Stojkoska and K.V. Trivodaliev, A review of Internet of Things for smart home: Challenges and solutions, Journal of Cleaner Production 140: (pt. 3) ((2017) ), 1454–1464. doi:10.1016/j.jclepro.2016.10.006. |
[19] | C. Wei, D. Wipf, W. Yu et al., Simultaneous Bayesian sparse approximation with structured sparse models, IEEE Transactions on Signal Processing 64: (23) ((2016) ), 6145–6159. doi:10.1109/TSP.2016.2605067. |
[20] | W. Windolf and R. Tadje, Controlguide CTmobile – energy self-sufficient position transfer and status monitoring in freight traffic, Signal + Draht 110: (4) ((2018) ), 37–47. |
[21] | Y. Xu, S. Chao, Z. Ding et al., Joint beamforming and power splitting control in downlink cooperative SWIPT NOMA systems, IEEE Transactions on Signal Processing 18: ((2017) ), 4874–4886. doi:10.1109/TSP.2017.2715008. |
[22] | Y. Zhao, J. Stow and C. Harrison, Estimating the frequency of trains approaching red signals: A case study for improving the understanding of SPAD risk, Iet Intelligent Transport Systems 10: (9) ((2016) ), 579–586. doi:10.1049/iet-its.2015.0052. |
[23] | W. Zhe, Z. Zhong, M. Ni et al., Bus-based content offloading for vehicular networks, Journal of Communications & Networks 19: (3) ((2017) ), 250–258. doi:10.1109/JCN.2017.000042. |


