
Bidirectional cell tests on non-grouted and grouted large-diameter bored piles
Abstract
The 37-storey apartment buildings of the Everrich II project in HoChiMinh City, Vietnam was designed to be supported on a piled foundation consisting of bored piles assigned a 22-MN working load per pile. The foundation design included performing bidirectional-cell, static loading tests on four test piles. The soil profile consisted of organic soft clay to about 28 m depth followed by a thick deposit of sandy silt and silty sand with a density that gradually increased with depth from compact to dense, becoming very dense at 65 m depth. In March 2010, the test piles, one 1.5-m diameter pile and three 2.0-m diameter piles, were installed to 80 m through 85 m depth and constructed using bucket drill technique with bentonite slurry and a casing advanced ahead of the hole. The bidirectional-cell assemblies were installed at 10 m through 20 m above the pile toes. The piles were instrumented with pairs of diametrically opposed vibrating wire strain-gages at three to four levels below and six to seven levels above the respective cell levels. After completed concreting, the shaft grouting was carried out throughout a 20 m length above the pile toe for the 1.5-m diameter pile and for one of the 2.0-m diameter piles. The static loading tests were performed about 34 through 44 days after the piles had been concreted.
The analysis of strain-gage records indicated an average Young’s modulus value of about 25 GPa for the nominal crosssections of the piles. The average unit grouted shaft resistances on the nominal pile diameters were about two to three times larger than the resistance along the non-grouted lengths. The measured load distribution of maximum mobilized shaft resistances corresponded to effective stress proportionality coefficients, ß, of about 0.2 through 0.3. The ultimate shaft resistance for the pile lengths below the bidirectional cells reached an ultimate value after about 8 to 10 mm movement, whereafter the load-movement was plastic. The pile toe stress-movement responses to toe stiffness were soft with no tendency toward an ultimate value.
1Introduction
The Everrich II project in HoChiMinh City, Vietnam, consists of a series of 37-storey apartment buildings with a height of approximately 152 m covering an about 112,000 m2 area. Fig. 1 shows an architect’s view of the complex. The soils at the site are typical for the Mekong Delta basin which is filled in with recent deposits from the Mekong River [8] and consist of a thick deposit of alternating alluvial soil layers of organic soft clay, compact silty sand with some gravels, and medium dense to dense silty sand, underlain by dense to very dense silty sand [8]. Regional settlements occur in the area. The building complex was originally designed to be supported on a piled foundation consisting of 1,500 and 2,000-mm diameter bored piles with 80 and 85-m embedment, respectively. The maximum working load (under the tallest building sections) was 22 MN sustained (dead) load per pile. As a part of the design, a test programme was carried out on four strain-gage instrumented piles each constructed using bucket drill technique with bentonite slurry and casing advanced ahead of the hole. Two of the test piles were post-construction grouted along about 20 m above the pile toe. The static loading tests employed the bidirectional celltest method [7].
2Soil conditions
The soil profile at the site of the test piles consists of organic soft clay to about 28 m depth, compact silty sand with some gravels to 38 m depth, medium dense sandy silt to 44 m depth, and compact sand to about 60 m depth followed by dense to very dense silty sand to at least 100 m depth. The pore pressure distribution is hydrostatic and corresponds to a groundwater table at 1 m depth below the ground surface. Fig. 2 shows the distribution of water content, consistency limits, grain size distribution, and SPT N-indices. The average natural water content was about 70% to 28 m depth and about 18% below this depth to 100 m depth. The saturated density of soft clay is about 1,600 kg/m3. The density of silty sand below is about 2,100 kg/m3.
2.1Construction of test piles
Four test piles were constructed: Pile TPH and Piles TP1 through TP3. Pile TPH had 1,500-mm nominal diameter and Piles TP1 through TP3 had 2,000-mm nominal diameter. Each pile had a reinforcing cage of forty-four 28 mm bars, resulting in a steel reinforcement area of 246 cm2 and reinforcement ratios of 0.78% and 0.84 % of the 1.77 m2 3.14 m2 total nominal pile cross sections, respectively. Two piles, Piles TPH and TP3 were post-grouted over the last 20 m length, as described below. The test piles were the first piles of a Phase 1 construction consisting of a total of 406 piles, which final size and depth were to be based on the outcome of the tests. Figure 3 shows the total foundation plan, Phase 1 part boundaries, and locations of the test piles
The construction started at the end of January 2010, by installing a temporary casing with an inside diameter 20 mm wider than the nominal pile diameter, initially to 9 m depth. The piles were then constructed using bucket drill and bentonite slurry inside as the casing was advanced ahead of the drilling. Piles TP1, TP2, TP3, and TPH were drilled to Depths 80.3, 80.6, 84.7, and 80.3 m, respectively, as based on a preliminary design. The reinforcing cage with a bidirectional cell assembly attached was lowered into each test pile 2, 4, 4, and 6 days after drilling, respectively. The cell assemblies were located 20.3, 18.4, 20.6, and 18.7 m respectively, above the pile shaft bottom (pile toe). All four test piles had the same two 670-mm diameter bidirectional cell arrangement. The pore pressure at the cell depths was about 600 kPa for TP1 through TP3 and 700 kPa for TPH. Each reinforcing cage was instrumented with single pairs of diametrically opposed vibrating wire strain-gages at four levels below and six levels above the cell level. Figure. 4 shows the layout of gages and cells.
After cleaning the shafts (on the day after the drilling), the reinforcing cage was lowered into the slurry-stabilized hole. Concrete was then delivered via a 300-mm outside diameter, tremie pipe into the bottom of the shaft displacing the bentonite slurry. When the concrete reached the ground surface, the temporary casing was immediately withdrawn.
The volume of concrete placed in the test piles was monitored. Fig. 5 shows the nominal and as-placed actual volumes of concrete versus depth. The actual volume ratios were 1, 3, and 2% larger than the nominal for Piles TP1 through TP3, respectively, and 4% for Pile TPH. The volume measurements suggest that the pile cross sections were quite uniform throughout the pile lengths. The concrete 28-day strength was about 65 MPa for all fourtest piles.
To arrange and facilitate the shaft grouting of Piles TPH and TP3, six 60-mm-diameter Tube-à-Manchette pipes had been symmetrically attached around the perimeter of the reinforcing cage throughout the shaft length. Over the lower 20 m length, the grout tubes were perforated for grout release and covered by a tight fitting rubber sleeve to serve the post grouting of the shaft. A few days after completed concreting, the shaft grouting was implemented by first cracking the pile concrete cover pumping water through the grout tubes at high pressure. That the cracking of the concrete cover had been accomplished was signaled by a sudden drop of the water pressure. The water was then turned off and cement grout was pumped out into the soil surrounding the pile shaft. The grout volumes were not measured.
3Tests and measurements
3.1Loads versus movements
The loading method was performed by raising the bidirectional cell load in a number of equal increment: 1.6 MN for TP1 and 0.8 MN for the other test piles The first 8 to 10 load levels were held constant during 1 hour (see Fig. 6). However, the duration of the load-holding for the following increment was increased to 6 hours. The next load duration returned to a 1-hour load-holding duration but for the last load level which was held for 24 hours.
Nothing is gained by keeping the load level for a longer duration at one or other load level. It is unfortunate that it yet was made, because such change of load-holding duration adversely affects the evaluation of pile axial stiffness for the load levels following. It could have been worse, the testing schedule could have included unloading/reloading steps, which would have made the analysis of the strain-gage records very challenging and the results disconcertingly ambiguous [3].
Table 1 compiles the measured maximum loads and movements of the bidirectional cell tests. Fig. 7 shows the measured upward and downward load-movement curves of the tests. The buoyant pile weight has not been subtracted from the upward loads and the water force acting on the downward force at the cell level has not been added to the cell load. In neither of the tests was the upward shaft resistance fully mobilized. The downward movement was more than 100 mm for TP1, TP2, and TPH, which suggests that their downward shaft resistance wasfully mobilized.
3.2Axial stiffness of the test piles
In order to determine the load values from the strain-gage measurements, knowledge of the pile stiffness, EA (“elastic” modulus, E, times cross sectional area, A), is required. For steel piles, the E is accurately known and, usually, also the pile cross section, A. In contrast, for concrete piles, the modulus can vary significantly from pile to pile and from concrete mix to concrete mix. A theoretical evaluation of the modulus, E, from, say, the concrete strength or from some other parameter is not very precise. Often, the cross section is not that well known either. However, the actual stiffness, EA, can be evaluated from the measured loads and strains. Figure. 8 shows the measured load-strain curves for the strain-gage levels of the four test piles. Although the load-strain representations trend to linearity, closer look shows that they are curved. Obviously, stress-strain relation and, therefore, also pile stiffness are not constant. An linear trend is indicated, representing an average pile stiffness, EA, for the gage levels closest to the cell level.
The average stiffnesses of Piles TP1 and TP2 stiffness, EA, of 80 GN and 84 GN, when correlated to the nominal cross sectional areas of 3.24 m2, correspond to an E-modulus of about 25 GPa. It is reasonable to expect that the stiffness of the concrete in the shaft-grouted piles, TP3 and TPH, is the same. Applying a 25 GPa E-modulus to the stiffness averages of the latter piles, 130 and 65 GN, suggests that the shaft grouting has resulted in increased cross section to 4.2 and 2.6 m2, respectively. That is, the shaft grouting would have resulted in an about 20-% increase of the pile shaft diameter. Unfortunately, as the grout volumes were not measured, the calculated increase cannot be correlated to the grout volume.
The loading test consists of applying known increments of load to the pile at the cell level. The strain increments induced by the load increments are measured and register the strain due to the portion of the applied load reaching the gage level. Because the shaft resistance is not known, the load reaching the gage level is unknown. However, once the shaft resistance between the gage level and the cell has become fully mobilized (assuming that shaft resistance response is neither strain-softening nor strain-hardening), all the load increments applied next will reach the gage level and the load increase will now be known. The load-strain relation, rather, the load-increments vs. strain increment relation, will be linear and the slope of the line is parallel to the pile tangent stiffness, EtA.
Indeed, the best way of determining the pile modulus is by means of a so-called “tangent modulus” or “incremental stiffness” plot [1, 3], that is, the applied increment of load over the induced increment of strain plotted versus the measured strain. This is shown in Fig. 9 for Piles TP1, TP2, TP3 and TPH, respectively.
This method aims to determine the incremental stiffness, the tangent modulus, Et, from which the secant modulus, Es, can be determined. It is a differentiation process and, therefore, it is very sensitive to small variations of accuracy of both load and strain measurements, as well as disturbance originating from unequal duration of load-holding. Moreover, it requires that the shaft response shows only moderate strain-hardening or strain-softening tendencies. The incremental stiffness method assumes that, for load increments applied after the shaft resistance at the studied gage level has been fully mobilized, the continued incremental stiffness values will plot along an approximately straight line–slightly sloping, because of the fact that the modulus of concrete reduces with increasing strain (due to the increase of applied stress). The line defines the tangent modulus relation for the pile cross section. The tangent modulus is then converted to secant modulus.
Because of the combined effect of the strain-softening and the scatter of values, the incremental stiffness method did not provide consistent tangent stiffness values. We eliminated some of the variations by disregarding the incremental values for the two sets of measurements obtained immediately after the long, 6-hour load-holding. The so-adjusted records were used for the incremental stiffness diagrams.
3.3Load distributions
To convert the measured strain data into load, the stiffness (EsA) values evaluated from incremental stiffness method were used to convert the measured strains to load and load distributions as presented in Figure 10. The figures include the distributions measured in bidirectional-cell test and the equivalent head-down distributions. The latter correlate the bidirectional measurements to the usual manner of presentation of load distributions of conventional head-down static loading tests and is obtained by “flipping over”— mirroring— the bidirectional curve above the cell level. Because the upward shaft resistance was not mobilized in the tests, the head-down distributions do not represent the fully mobilized resistance above about 40 m depth. Also included are the distributions produced in an effective stress analysis fitted to the equivalent head-down distribution.
The distributions show that were the pile toe resistance to be disregarded, the 20-MN working load will result in a neutral plane (force equilibrium) at depths of ranging from about 40 to 50 m.
Figure 11 shows the distributions of the beta-coefficients and unit shaft shear that were applied to achieve the effective stress analysis fit to the measured load distributions. The analyses were made using the UniPile Version 5 software [5]. Where the shaft resistance was fully mobilized, it correlated to a beta-coefficient ranging from about 0.2 through about 0.3.
Piles TP1 and TP2 are almost “twin” piles, although TP2 developed more resistance below the cell level than TP1: The shaft resistances are similar in magnitude, the difference in total resistance is mostly due to the fact that TP2 mobilized a larger toe resistance, as opposed to Pile TP1 despite their toe movements being essentially equal (see Table 1). The back-calculated unit shaft resistances below the cell level are about equal. Pile TP1 mobilized a smaller total shaft resistance above the cell level than that for Pile TP2, which is due to its smaller upward movement, about 2 mm as opposed to 11 mm. The reaction resistance below the cell level limited the amount of the shaft resistance that could be engaged above the cell level.
The two shaft-grouted piles, TP3 and TPH, show a unit shaft resistance in the grouted zone (all below the cell levels) that is about 30 to 50% larger than that of the non-grouted piles, which agrees with the mentioned about 20-% increase of pile diameter implied by the stiffness increase due to the grouting.
3.4Shaft shear resistance mobilization
The average unit shaft shear resistances between the gage levels were determined by means of the difference in gage-level loads divided by the surface area between the gage levels and then plotted against movements at the mid-points between the gage levels (interpolated linearly from the measured movements at the locations of bidirectional-cell assembly, pile head, and pile toe). The shaft shear resistance curves of the tested Piles TP1, TP2, TP3 and TPH are shown in Fig. 12. The left column of diagrams shows the unit shaft resistances versus downward movement for the gage levels below the cell levels. The right column of diagrams shows the unit shaft resistances versus upward movement for the gage levels above the cell levels.
For Piles TP1 and TP2, the unit shaft shear resistances below cell were mobilized fully at a movement of about 8 to 10 mm whereafter shaft resistance became plastic. Above the cell level, the movement for TP1 was smaller than 4 mm and the shaft resistance was not fully mobilized. For TP2 between the cell and SG8 (27 m above the cell and 32 m below ground) the upward movement was larger than 10 mm and the shaft resistance was fully mobilized.
3.5Toe resistance
The toe resistance was not measured directly, but was determined as the load at Gage Level SG2 (nearest the pile toe) subtracted by the shaft resistance between the gage level and the pile toe, as estimated in the analyses of the test records. Fig. 13 shows the toe resistance versus the pile toe movement measured in the tests on Piles TP1, TP2, and TPH. Pile TP3 toe response is not of interest as the pile showed next to no toe movement in the test. The toe movements are small, but representative for what is usually observed for bored piles in the area (e.g., [4]). The curves display no tendency toward an ultimate resistance, confirming the fact that toe capacity does not exist [2, 4]. The shaft grouting does not show to have had any effect on the toe response of Pile TPH.
4Foundation design based on the test results
The design was eventually made for 2,000-mm diameter piles. To ensure adequate pile capacity, the project piles were constructed with shaft-grouting along the lower 20 m length. Because of the ongoing regional settlement in the area and the planned intermittent placing of up to 2 m thick permanent fill at the site, it was important that the neutral plane— the force equilibrium and settlement equilibrium depths— be located below about 60 m depth, that is, below the compact sand and into the dense sand layer, which was not expected to settle appreciably. This required that the uncertain toe response shown for the tests, be compensated for by extending the pile embedment length to 95 m.
5Summary
The pile secant modulus, Es, ranged from about 28 GPa at small strain through about 24 GPa at a strain beyond about 300+μɛ.
The effective stress analysis fitted to the evaluated equivalent head-down load distributions showed that the beta-coefficients in the sand ranged from 0.2 through 0.3.
The ultimate shaft resistance for the pile lengths below the bidirectional cells reached an ultimate value after about 8 to 10 mm movement, whereafter the load-movement was plastic.
The shaft grouting of the lower 20 m length of the pile resulted in significant increase of shaft resistance as compared to that of non-grouted piles.
The pile toe stress-movement showed no tendency toward an ultimate value. The pile toe resistance was very soft and indicated that debris might have been left at the bottom of the pile shaft after cleaning the slurry and the tremie concreting. For the final design, therefore, toe resistance was disregarded and each pile was shaft grouted along the lower 20 m length.
The equivalent head-down distributions for the test piles indicated that, for piles similar to the test piles, if the contribution from pile toe resistance is disregarded, even for shaft-grouted piles, the neutral plane for the long-term conditions would be located in settling soil layers. For the final design, therefore, the pile lengths were extended to about 95 m depth, which resulted in a neutral plane at a depth of about 60 m, where the long-term settlements were considered to be minimal.
Acknowledgments
The bidirectional-cell tests were performed by Loadtest Asia Pte. Ltd. under the direction of Mr. Khoo Han Sen.
REFERENCES
1 | Fellenius BH(1989) Tangent modulus of piles determined from strain dataASCE, Geotechnical Engineering Division, the 1989 Foundation CongressKulhawy FH1: 500510Editor |
2 | Fellenius BH(1999) Bearing capacity—A delusion? Deep Foundation Institute, Hawthorne, NJProc of Annual Meeting, Dearborn, MI17: 1416 |
3 | Fellenius BH. Basics of foundation design, a text book. Revised Electronic Edition, [www.Fellenius.net], 2014;410 |
4 | Fellenius BH, Nguyen MH(2013) Large diameter long bored piles in the Mekong deltaInternational Journal of Case Histories2: 3196207 |
5 | Goudrault PA, and Fellenius BH. UniPile 5 Version 5, Users and Examples Manual. UniSoft Geotechnical Solutions Ltd. 2013; [www.UniSoftLtd.com]. 99 p |
6 | Loadtest International Pte. Ltd., 2010. Reports on Bored Pile Testing, Everrich II, HCMC,Vietnam, LTI-2860-1, 2860-2, 2860-3 and 2860-4, 105 p, 111p, 112p and 97 p |
7 | Osterberg JO (1998) The Osterberg load test method for drilled shaft and driven piles. The first ten years 7th Int. Conf. on Piling and Deep Foundations 17: Deep Foundation Institute Vienna, Austria 15 17 |
8 | Workman DR. Geology of Laos, Cambodia, South Vietnam, and the eastern part of Thailand. Overseas geology and mineral resources, 50, Her Majesty’s Stationery Office, London, 1977;33 |
Figures and Tables
Fig.1
Architect’s view of the Everrich Project II.

Fig.2
Water content, plastic and liquid limits, grain size distribution, and SPT N-indices from a representative borehole drilled at the site.
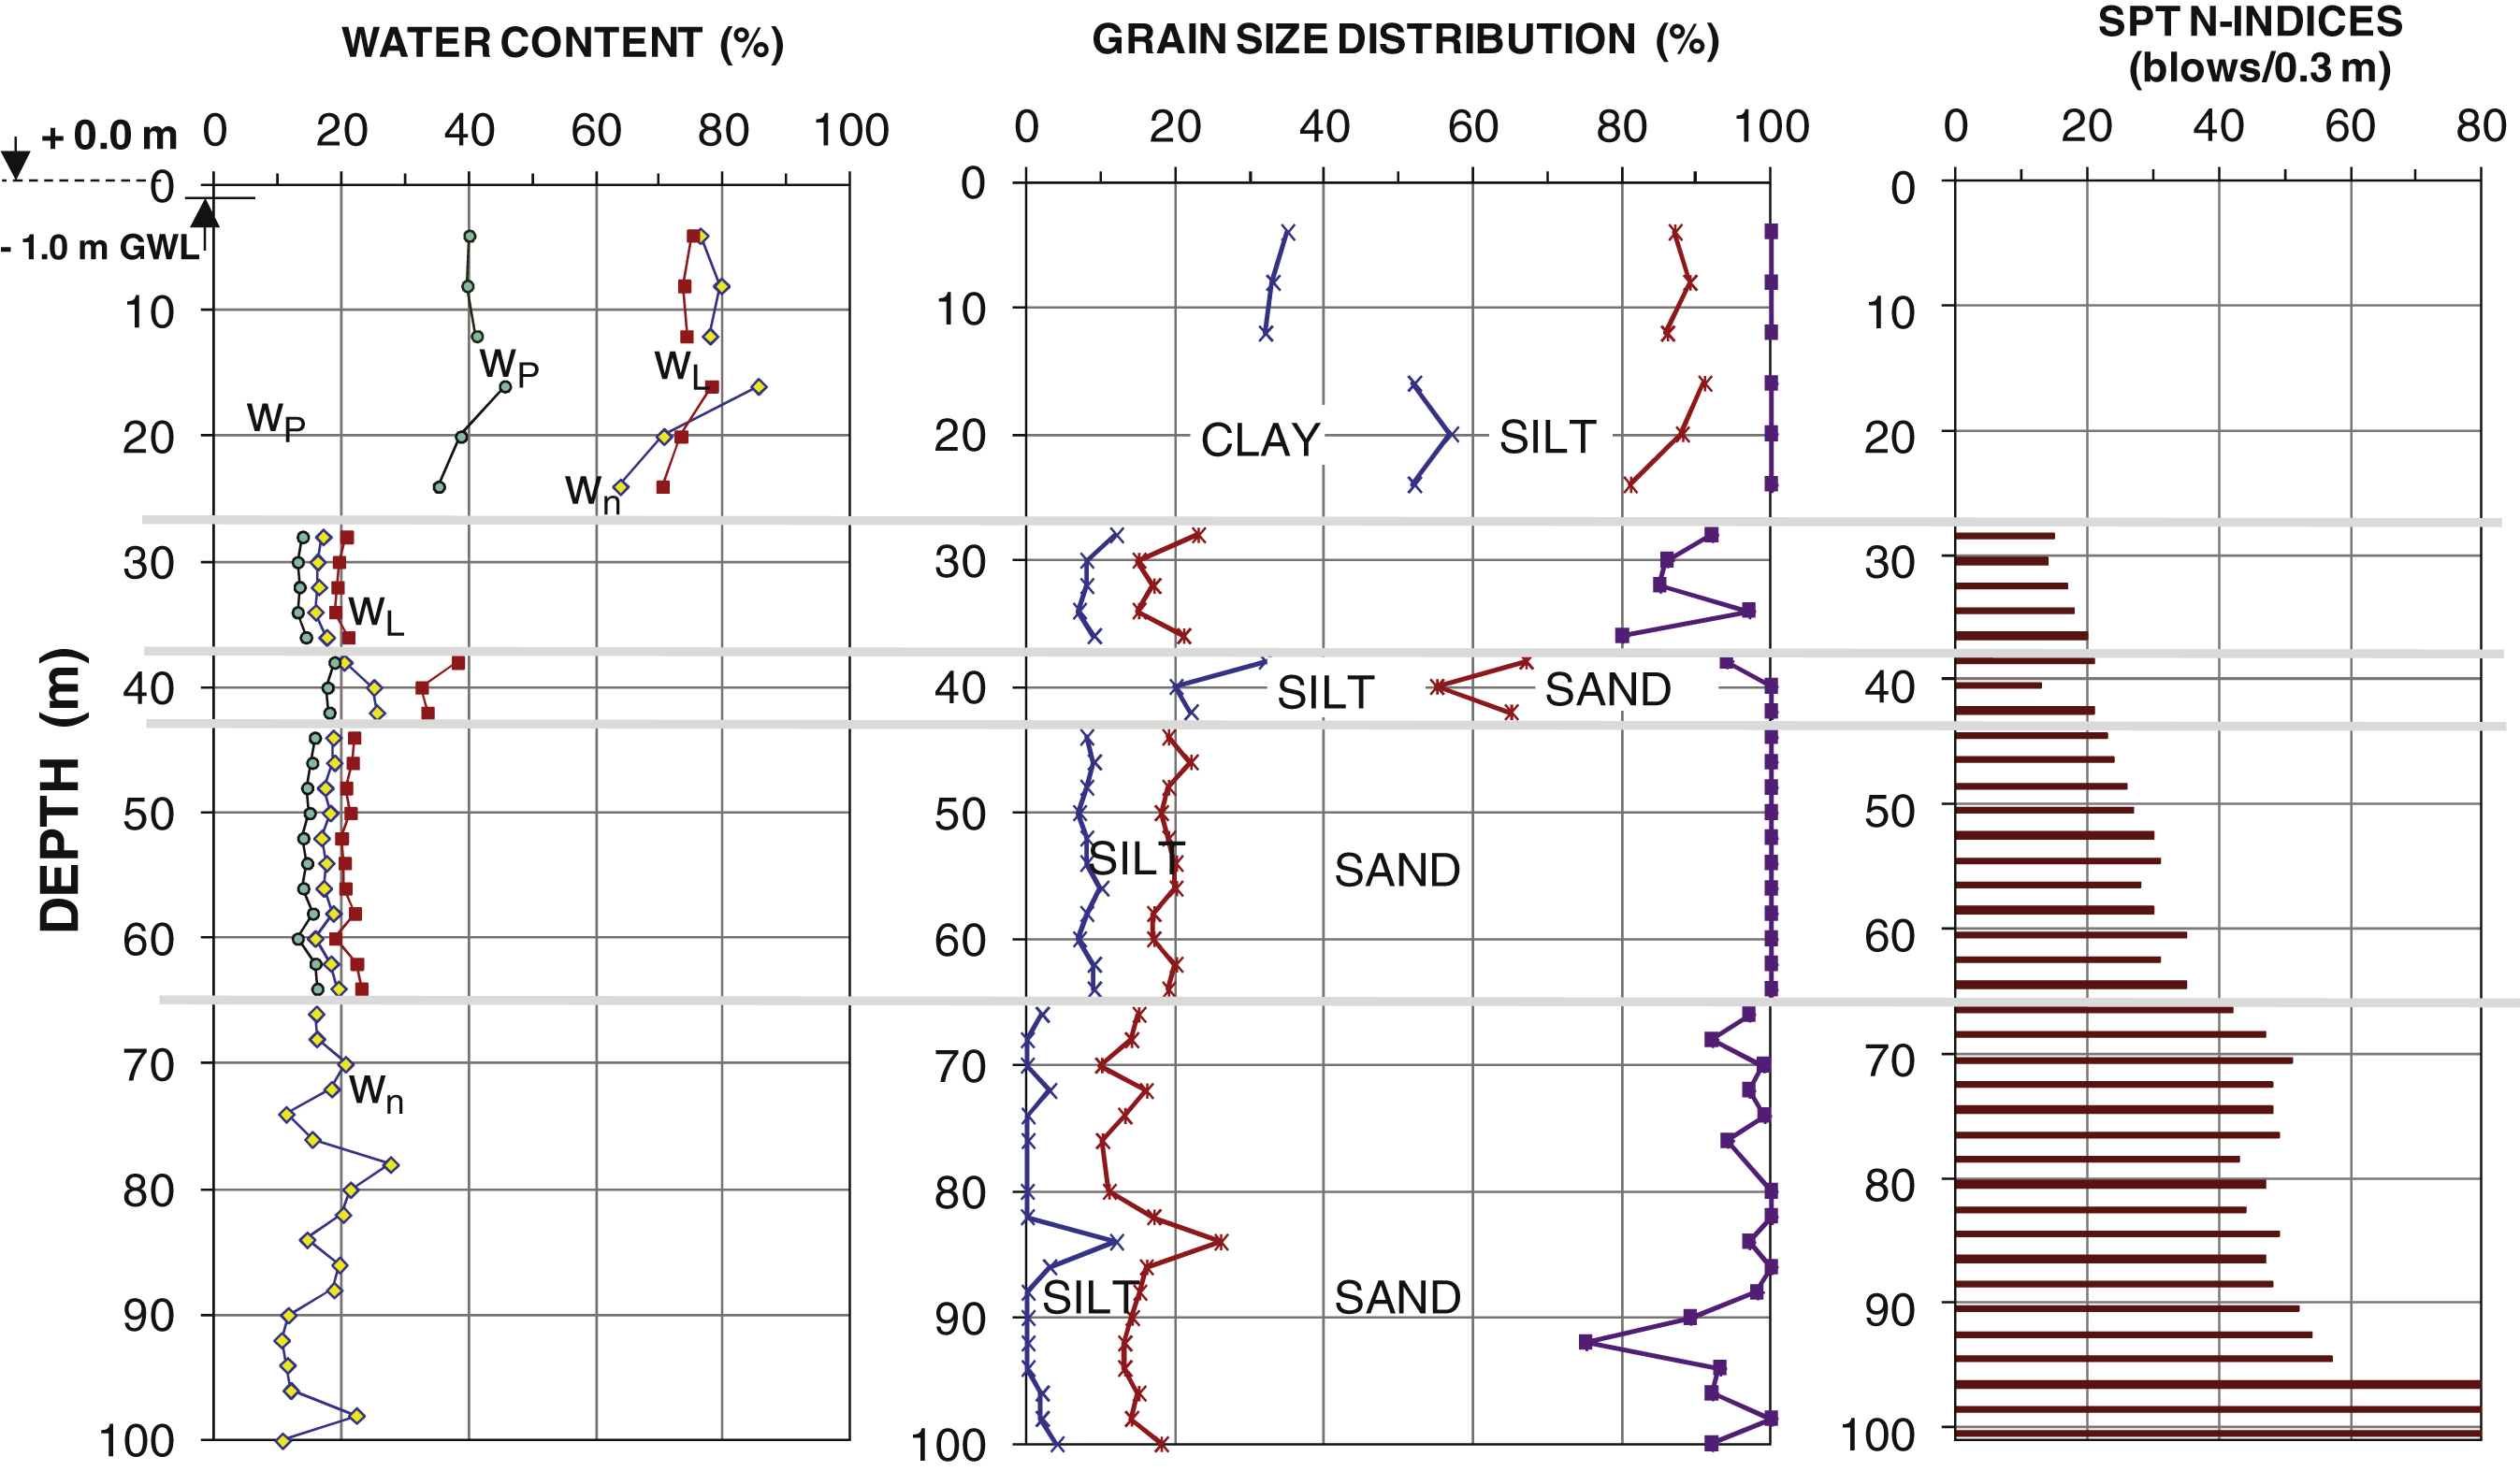
Fig.3
Layout of test piles and Boreholes in phase 1.
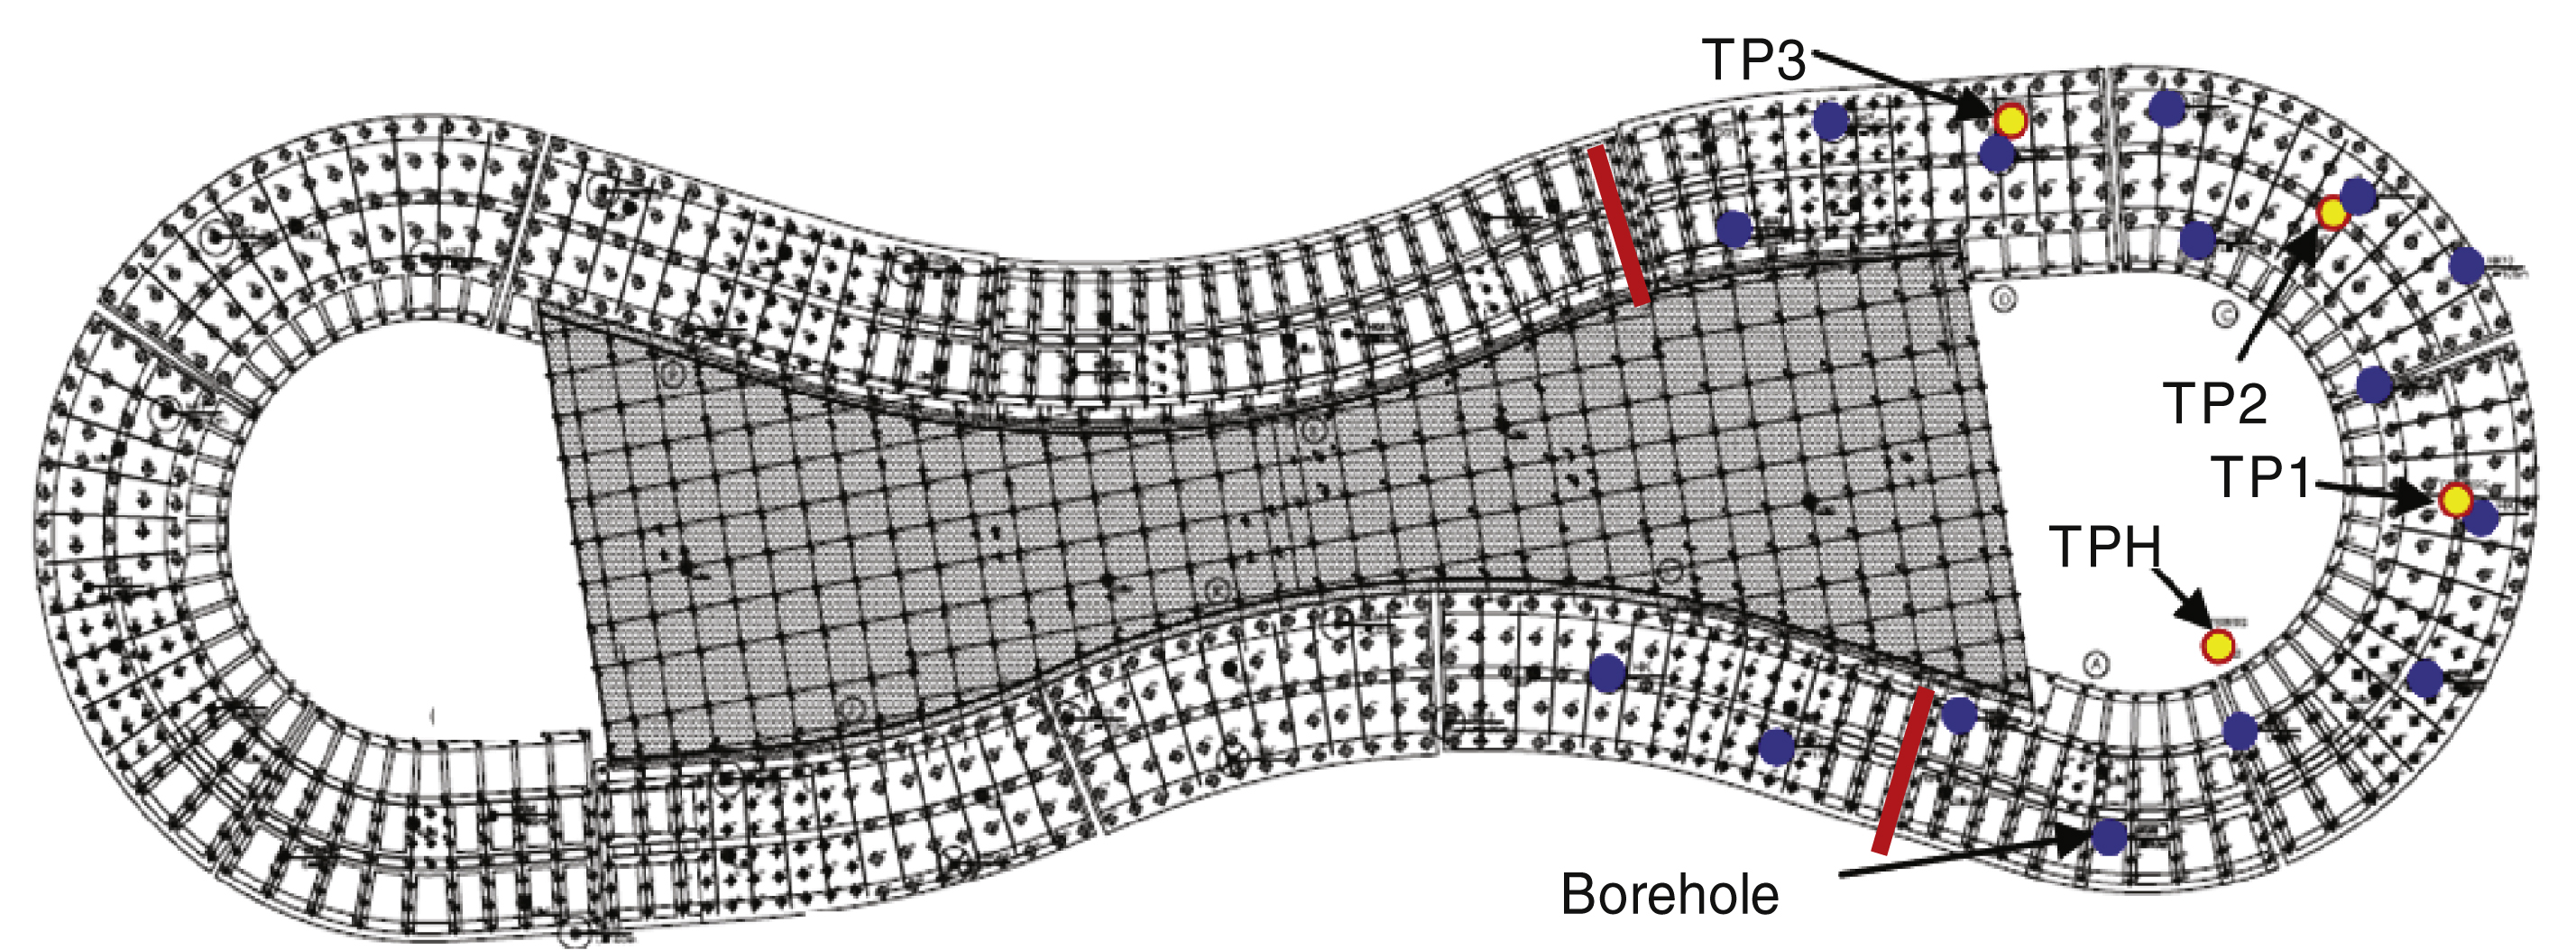
Fig.4
Depths to bidirectional cells and strain-gage levels in the test piles.
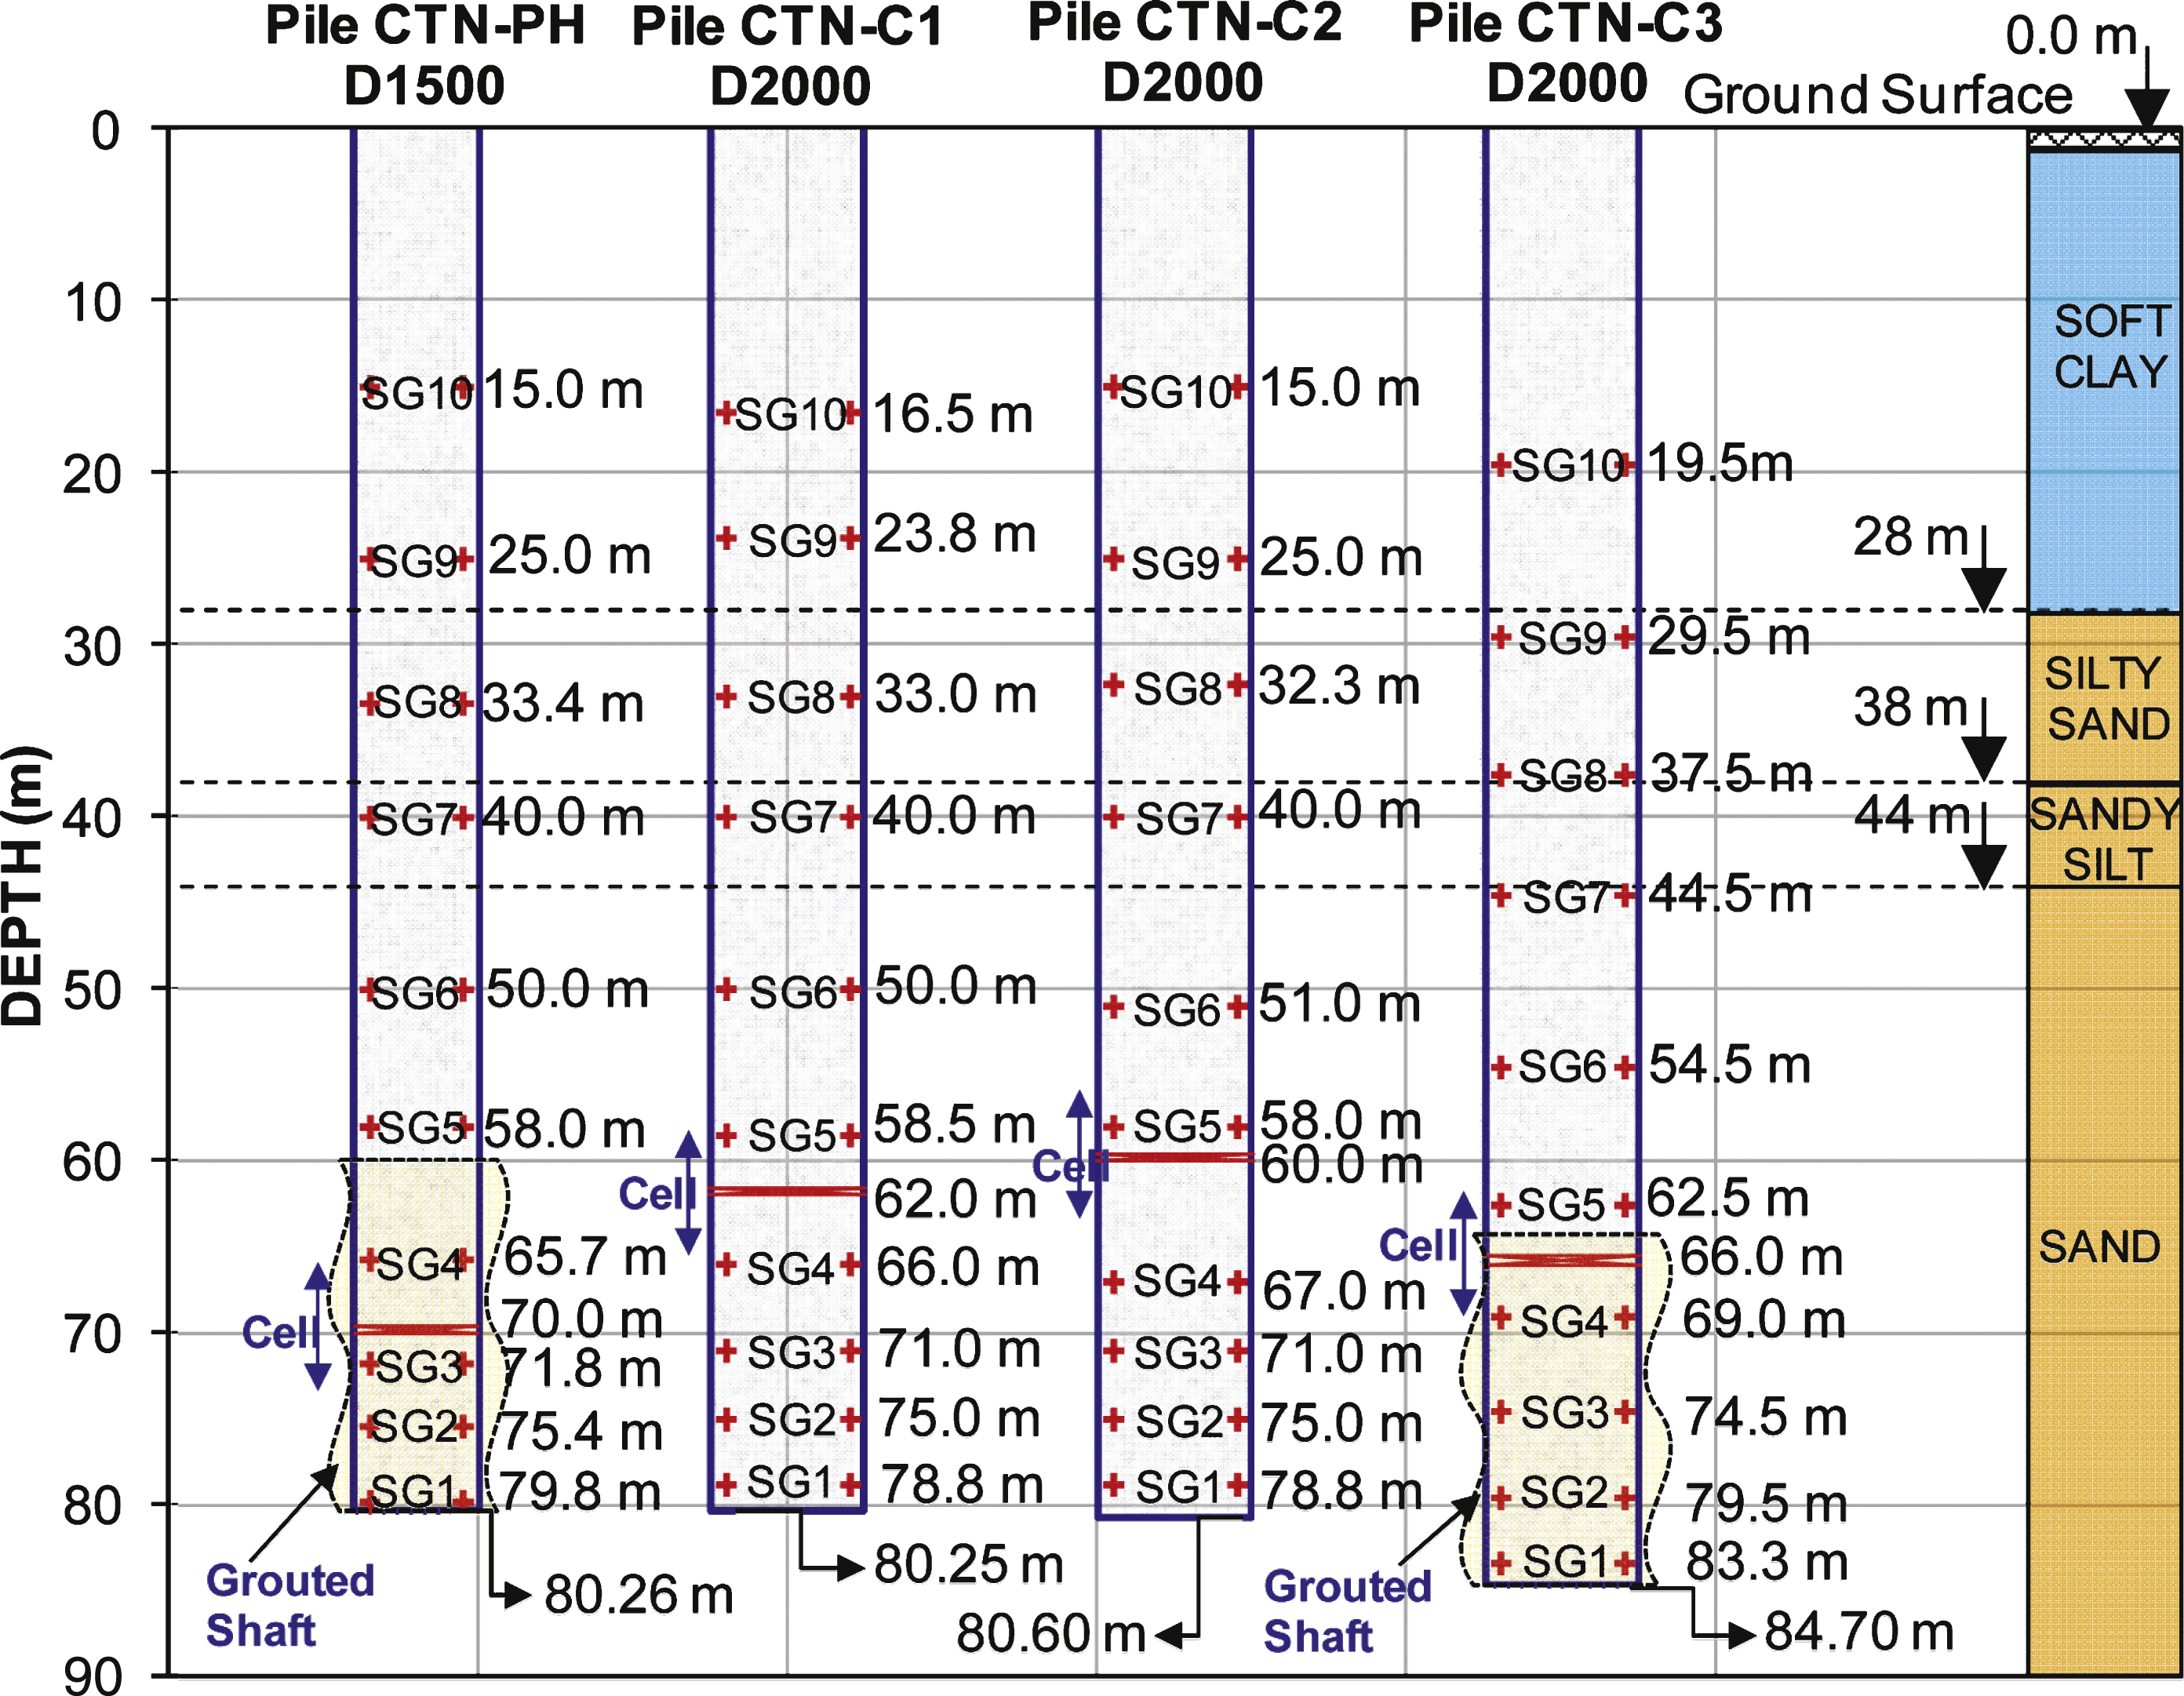
Fig.5
Nominal and as-placed concrete volumes.
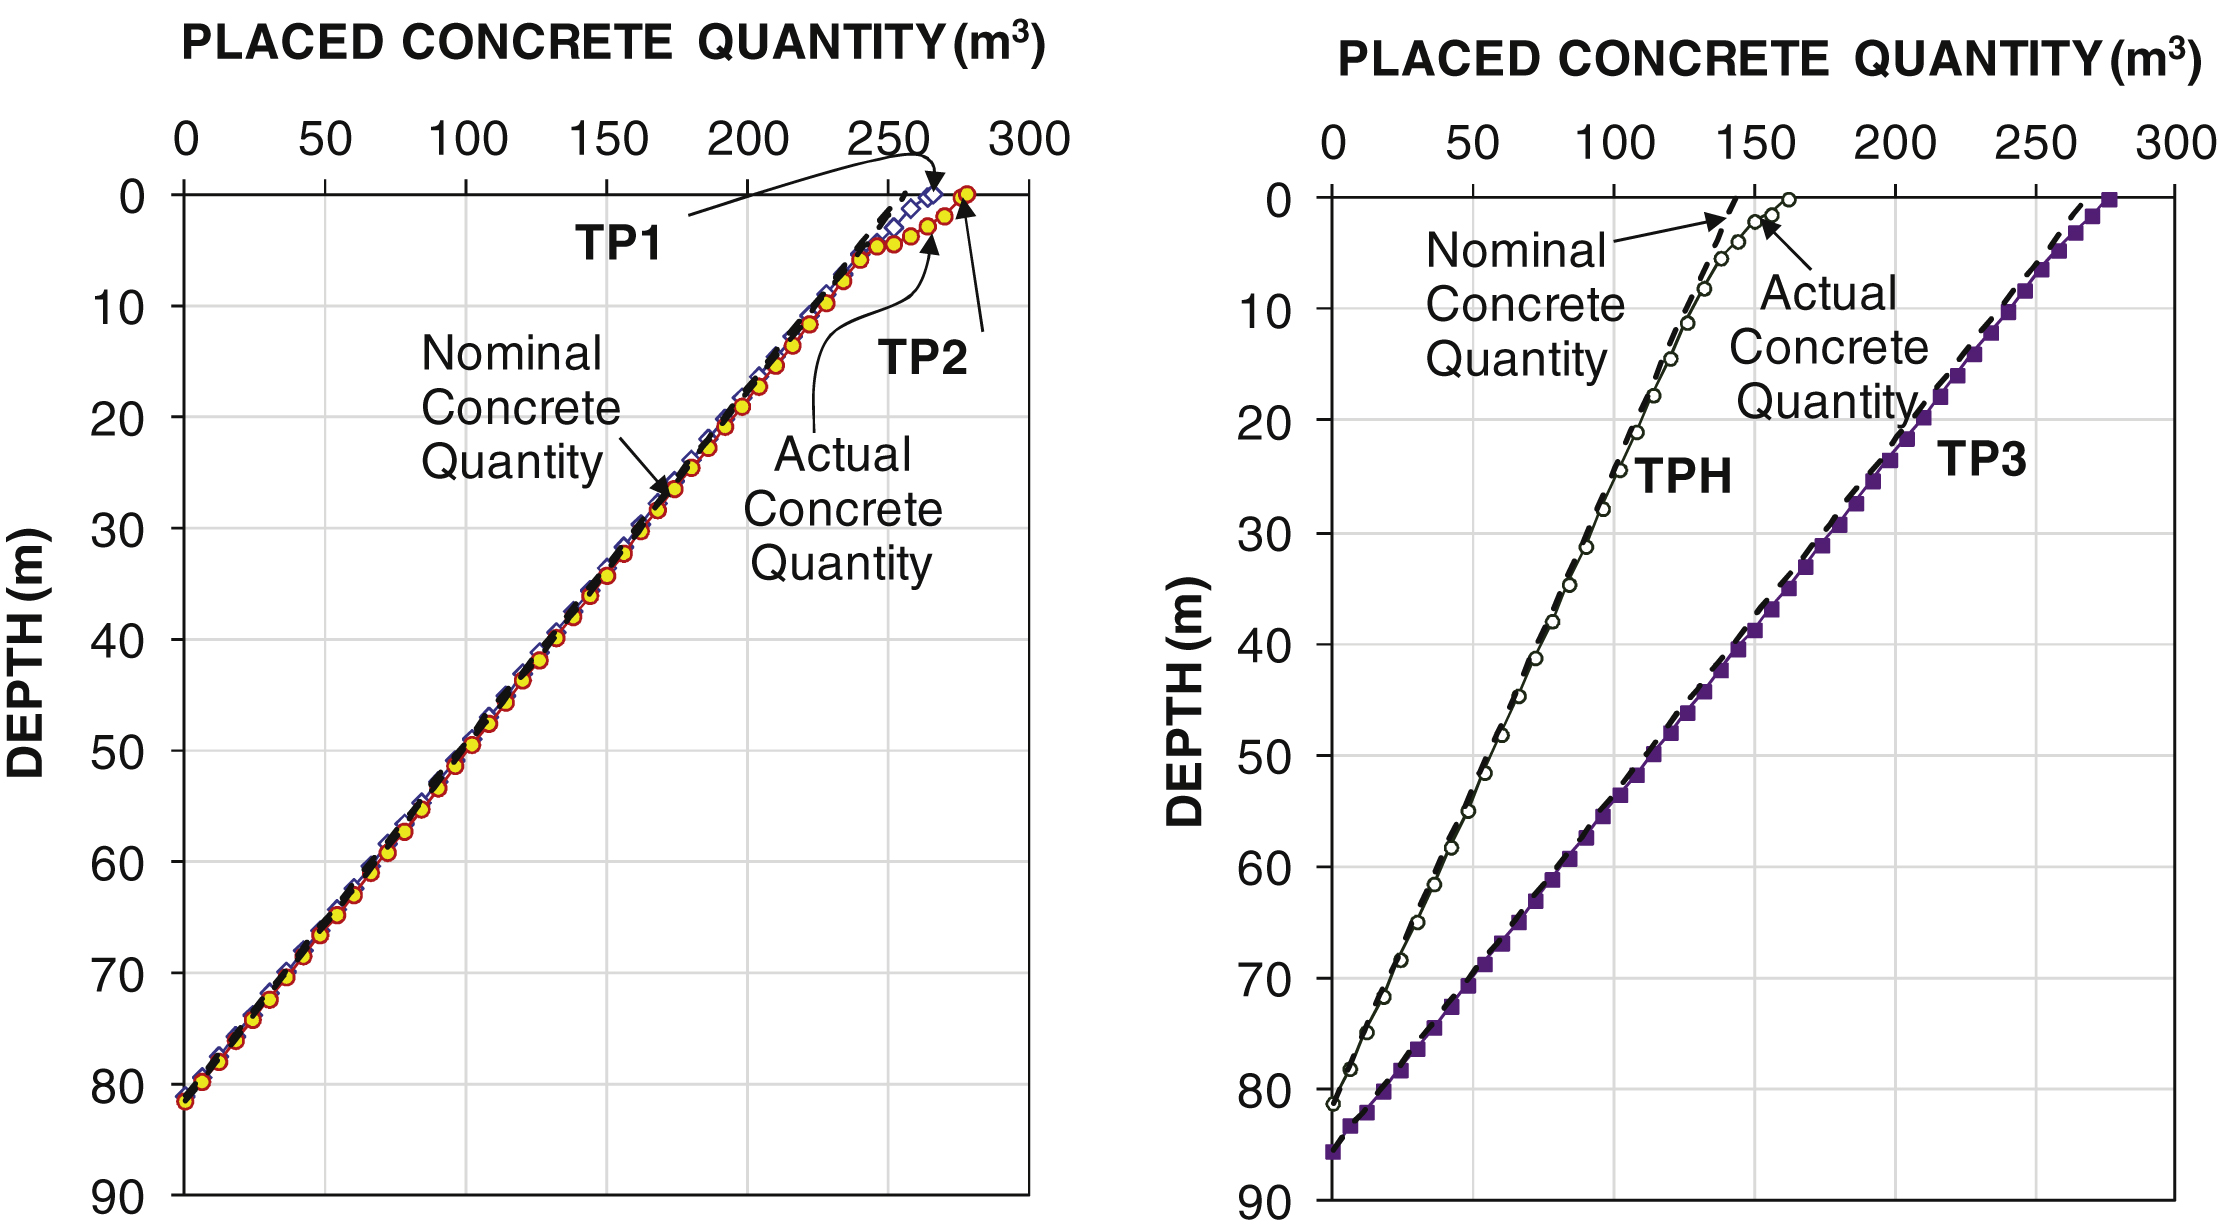
Fig.6
Loading schedule for the test piles.
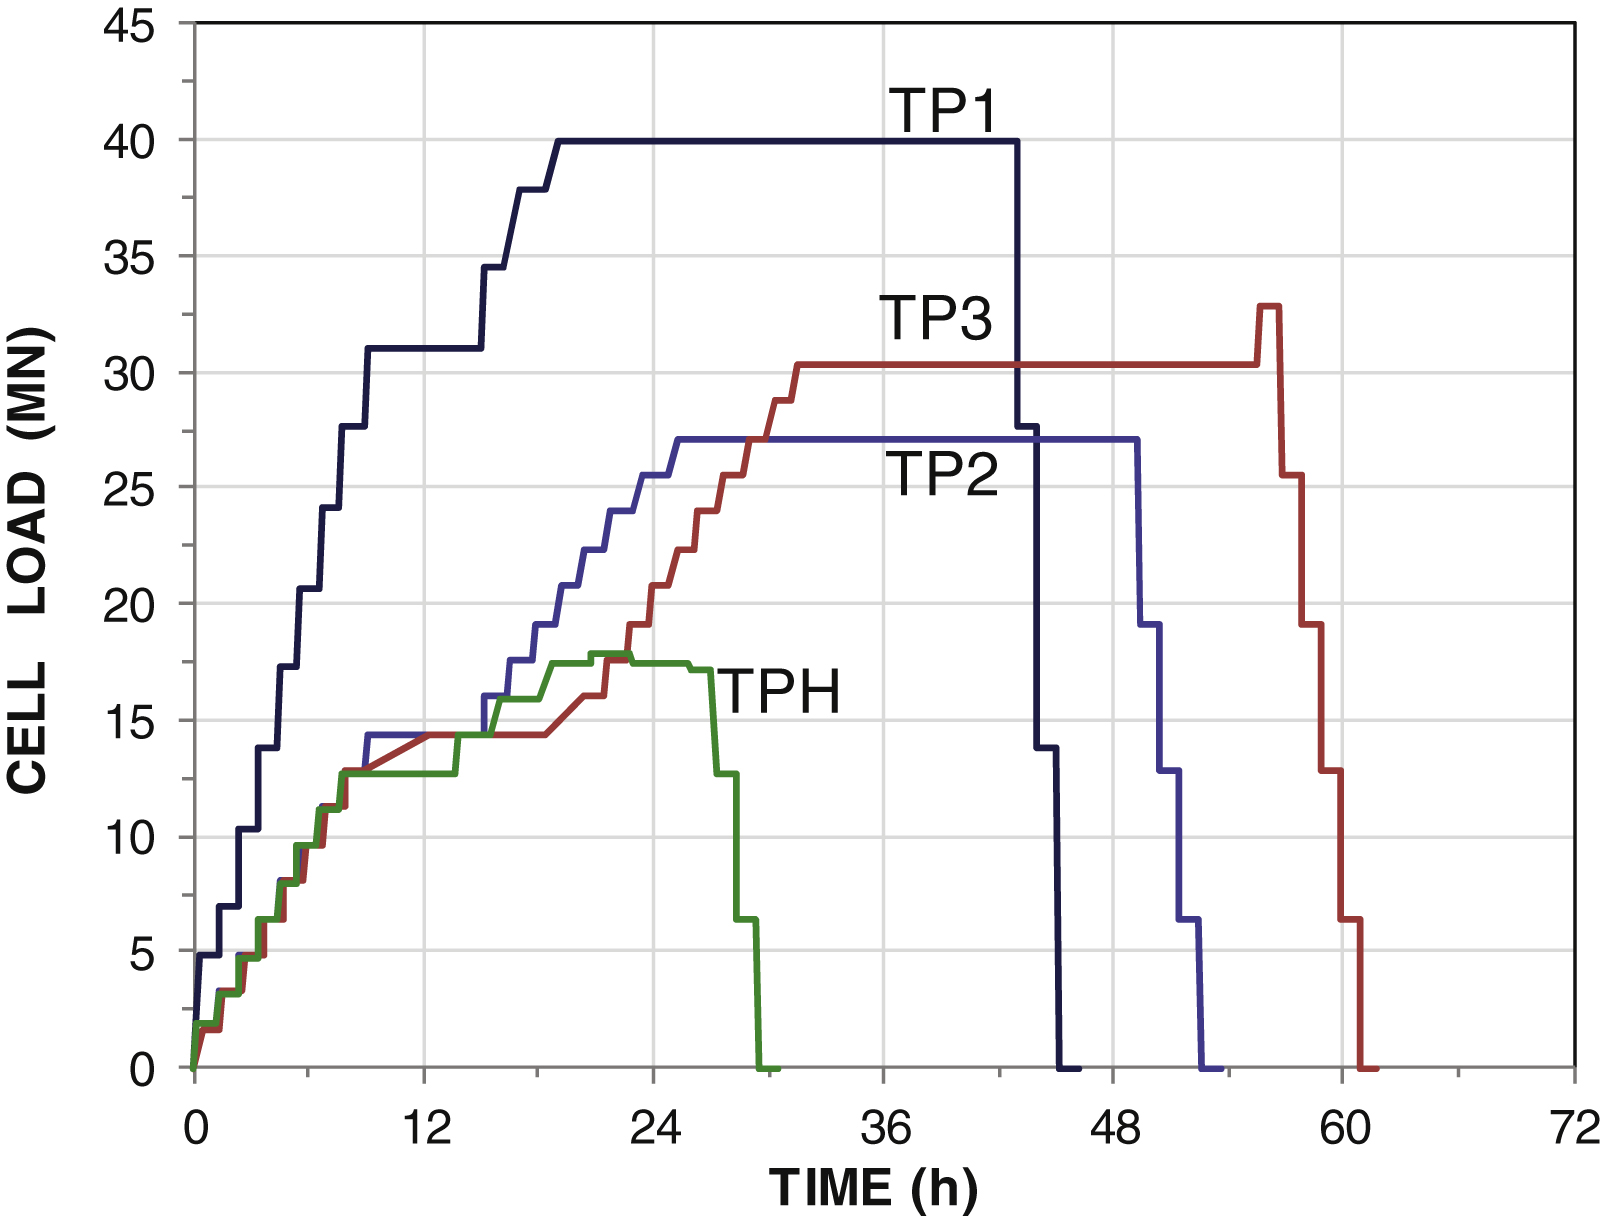
Fig.7
Upward and downward load-movement curves.
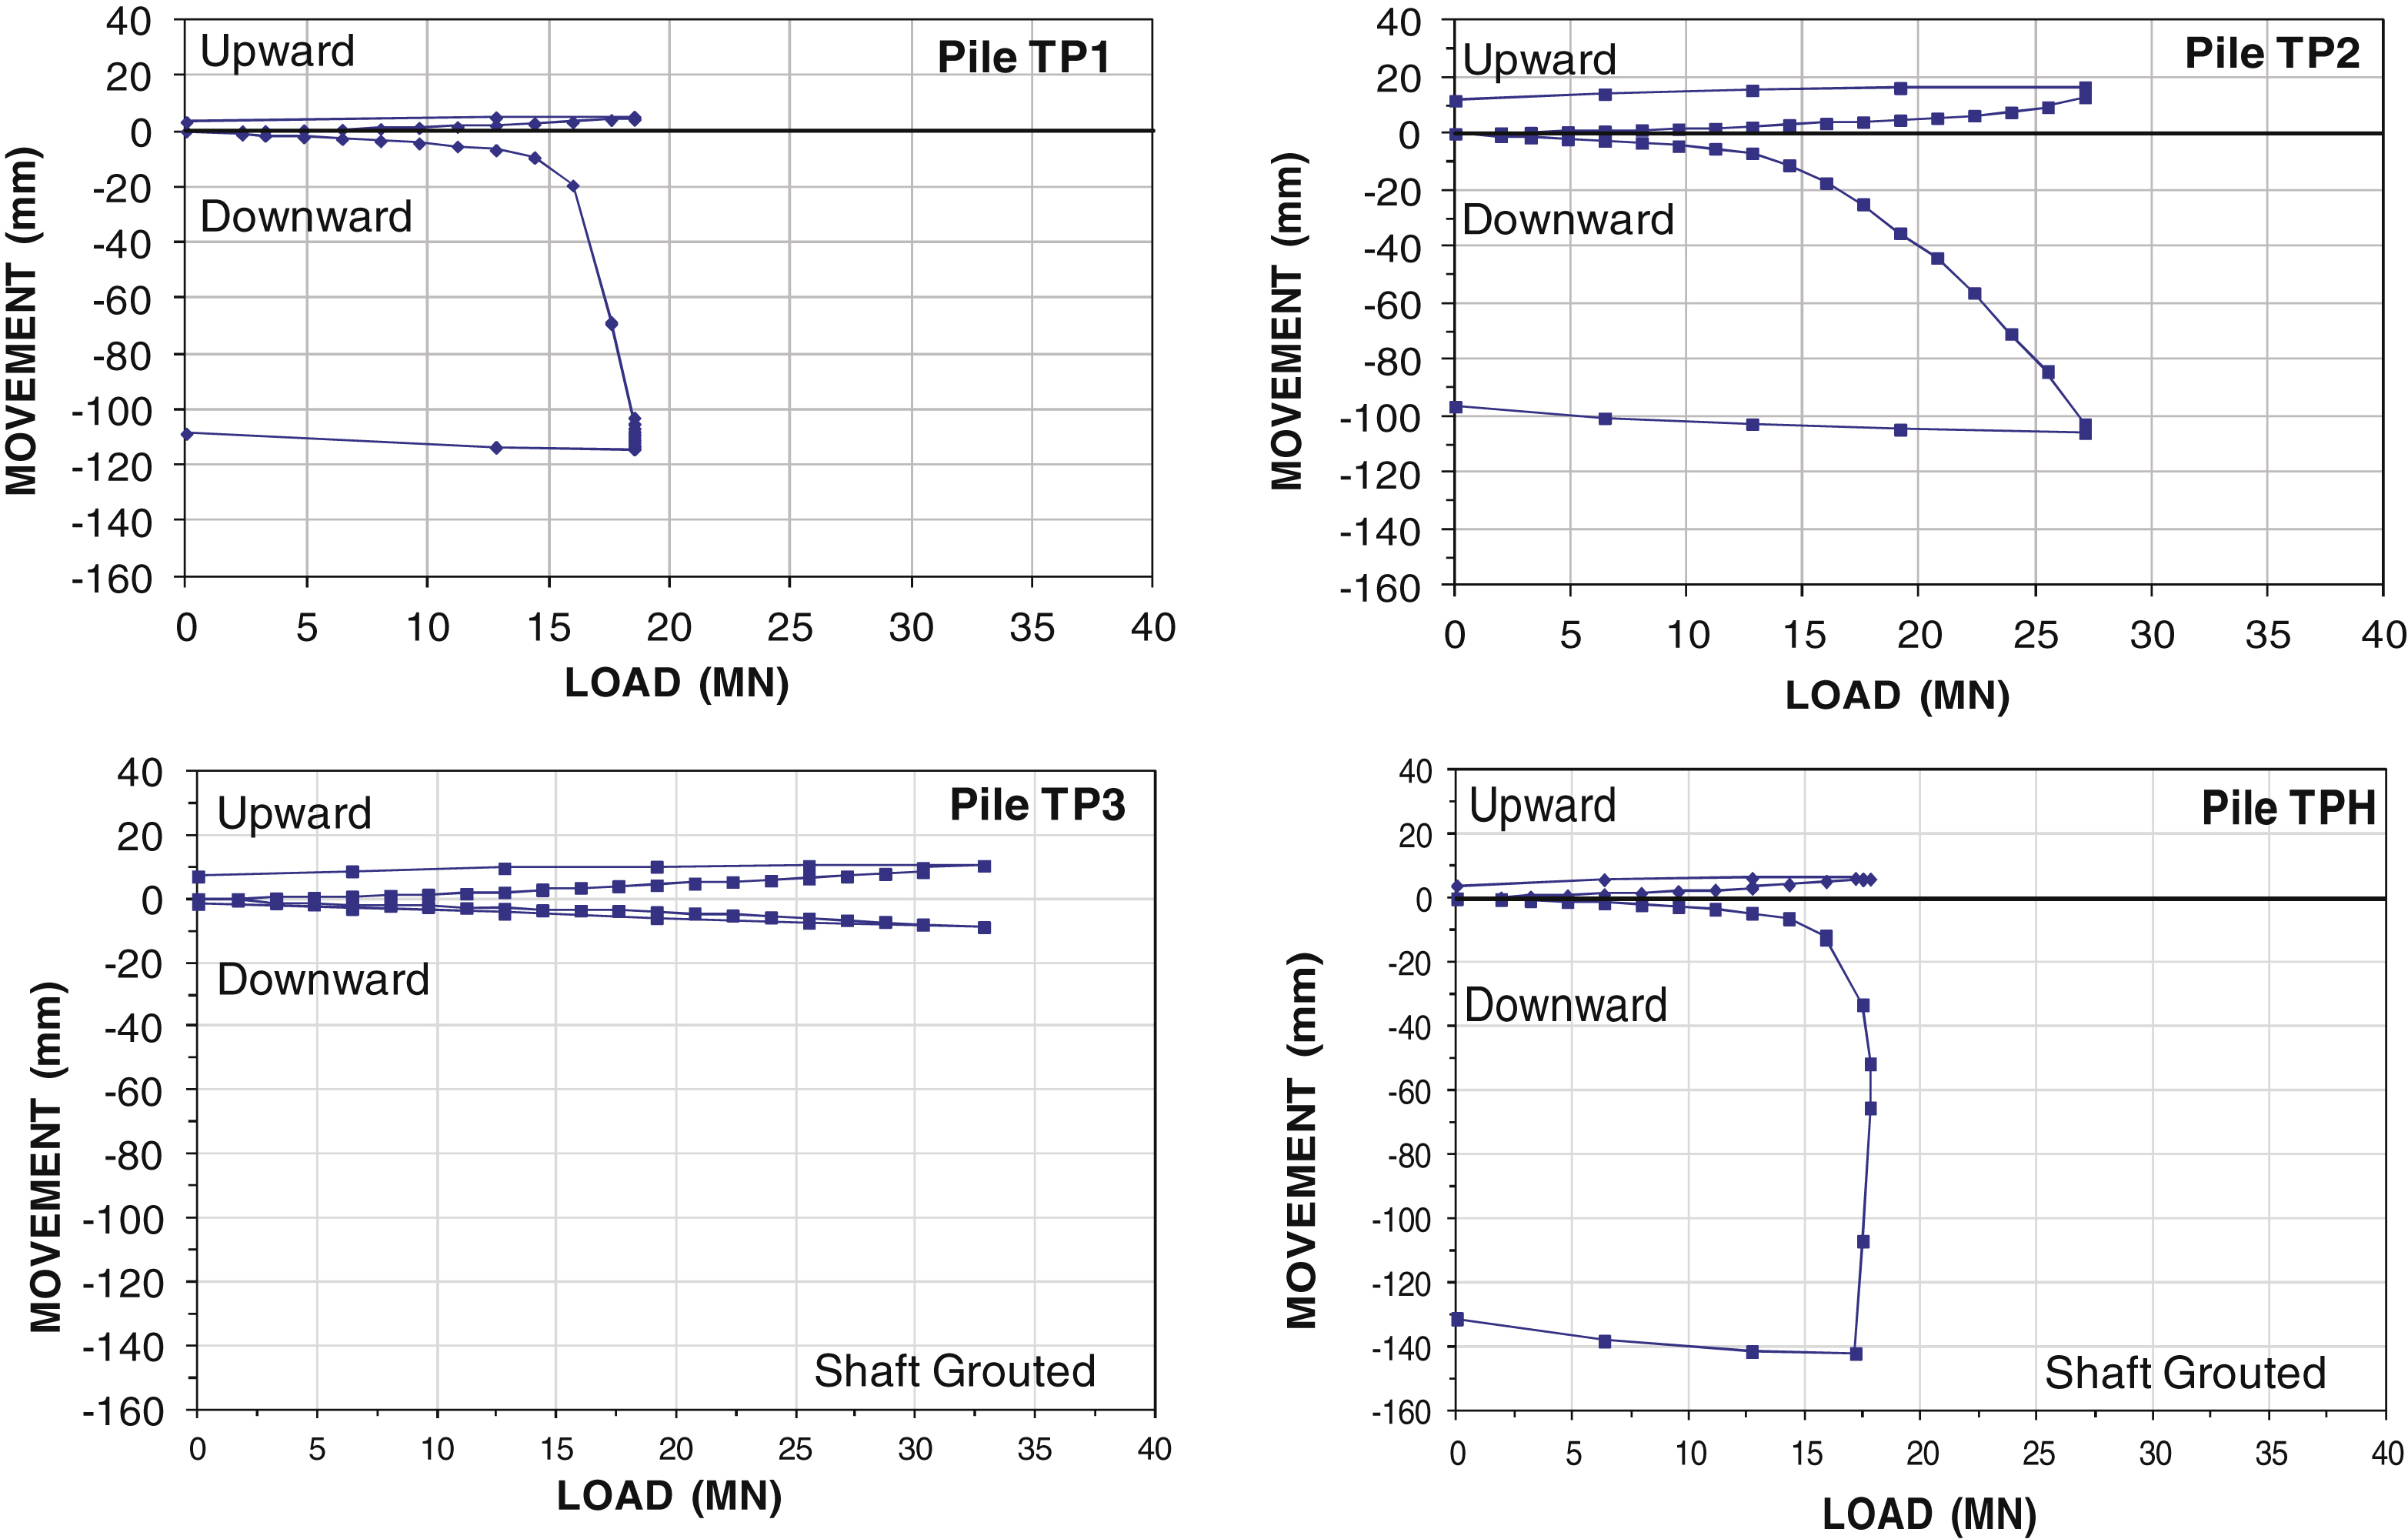
Fig.8
Load versus strain. “SG” stands for “Strain-Gage” pair.
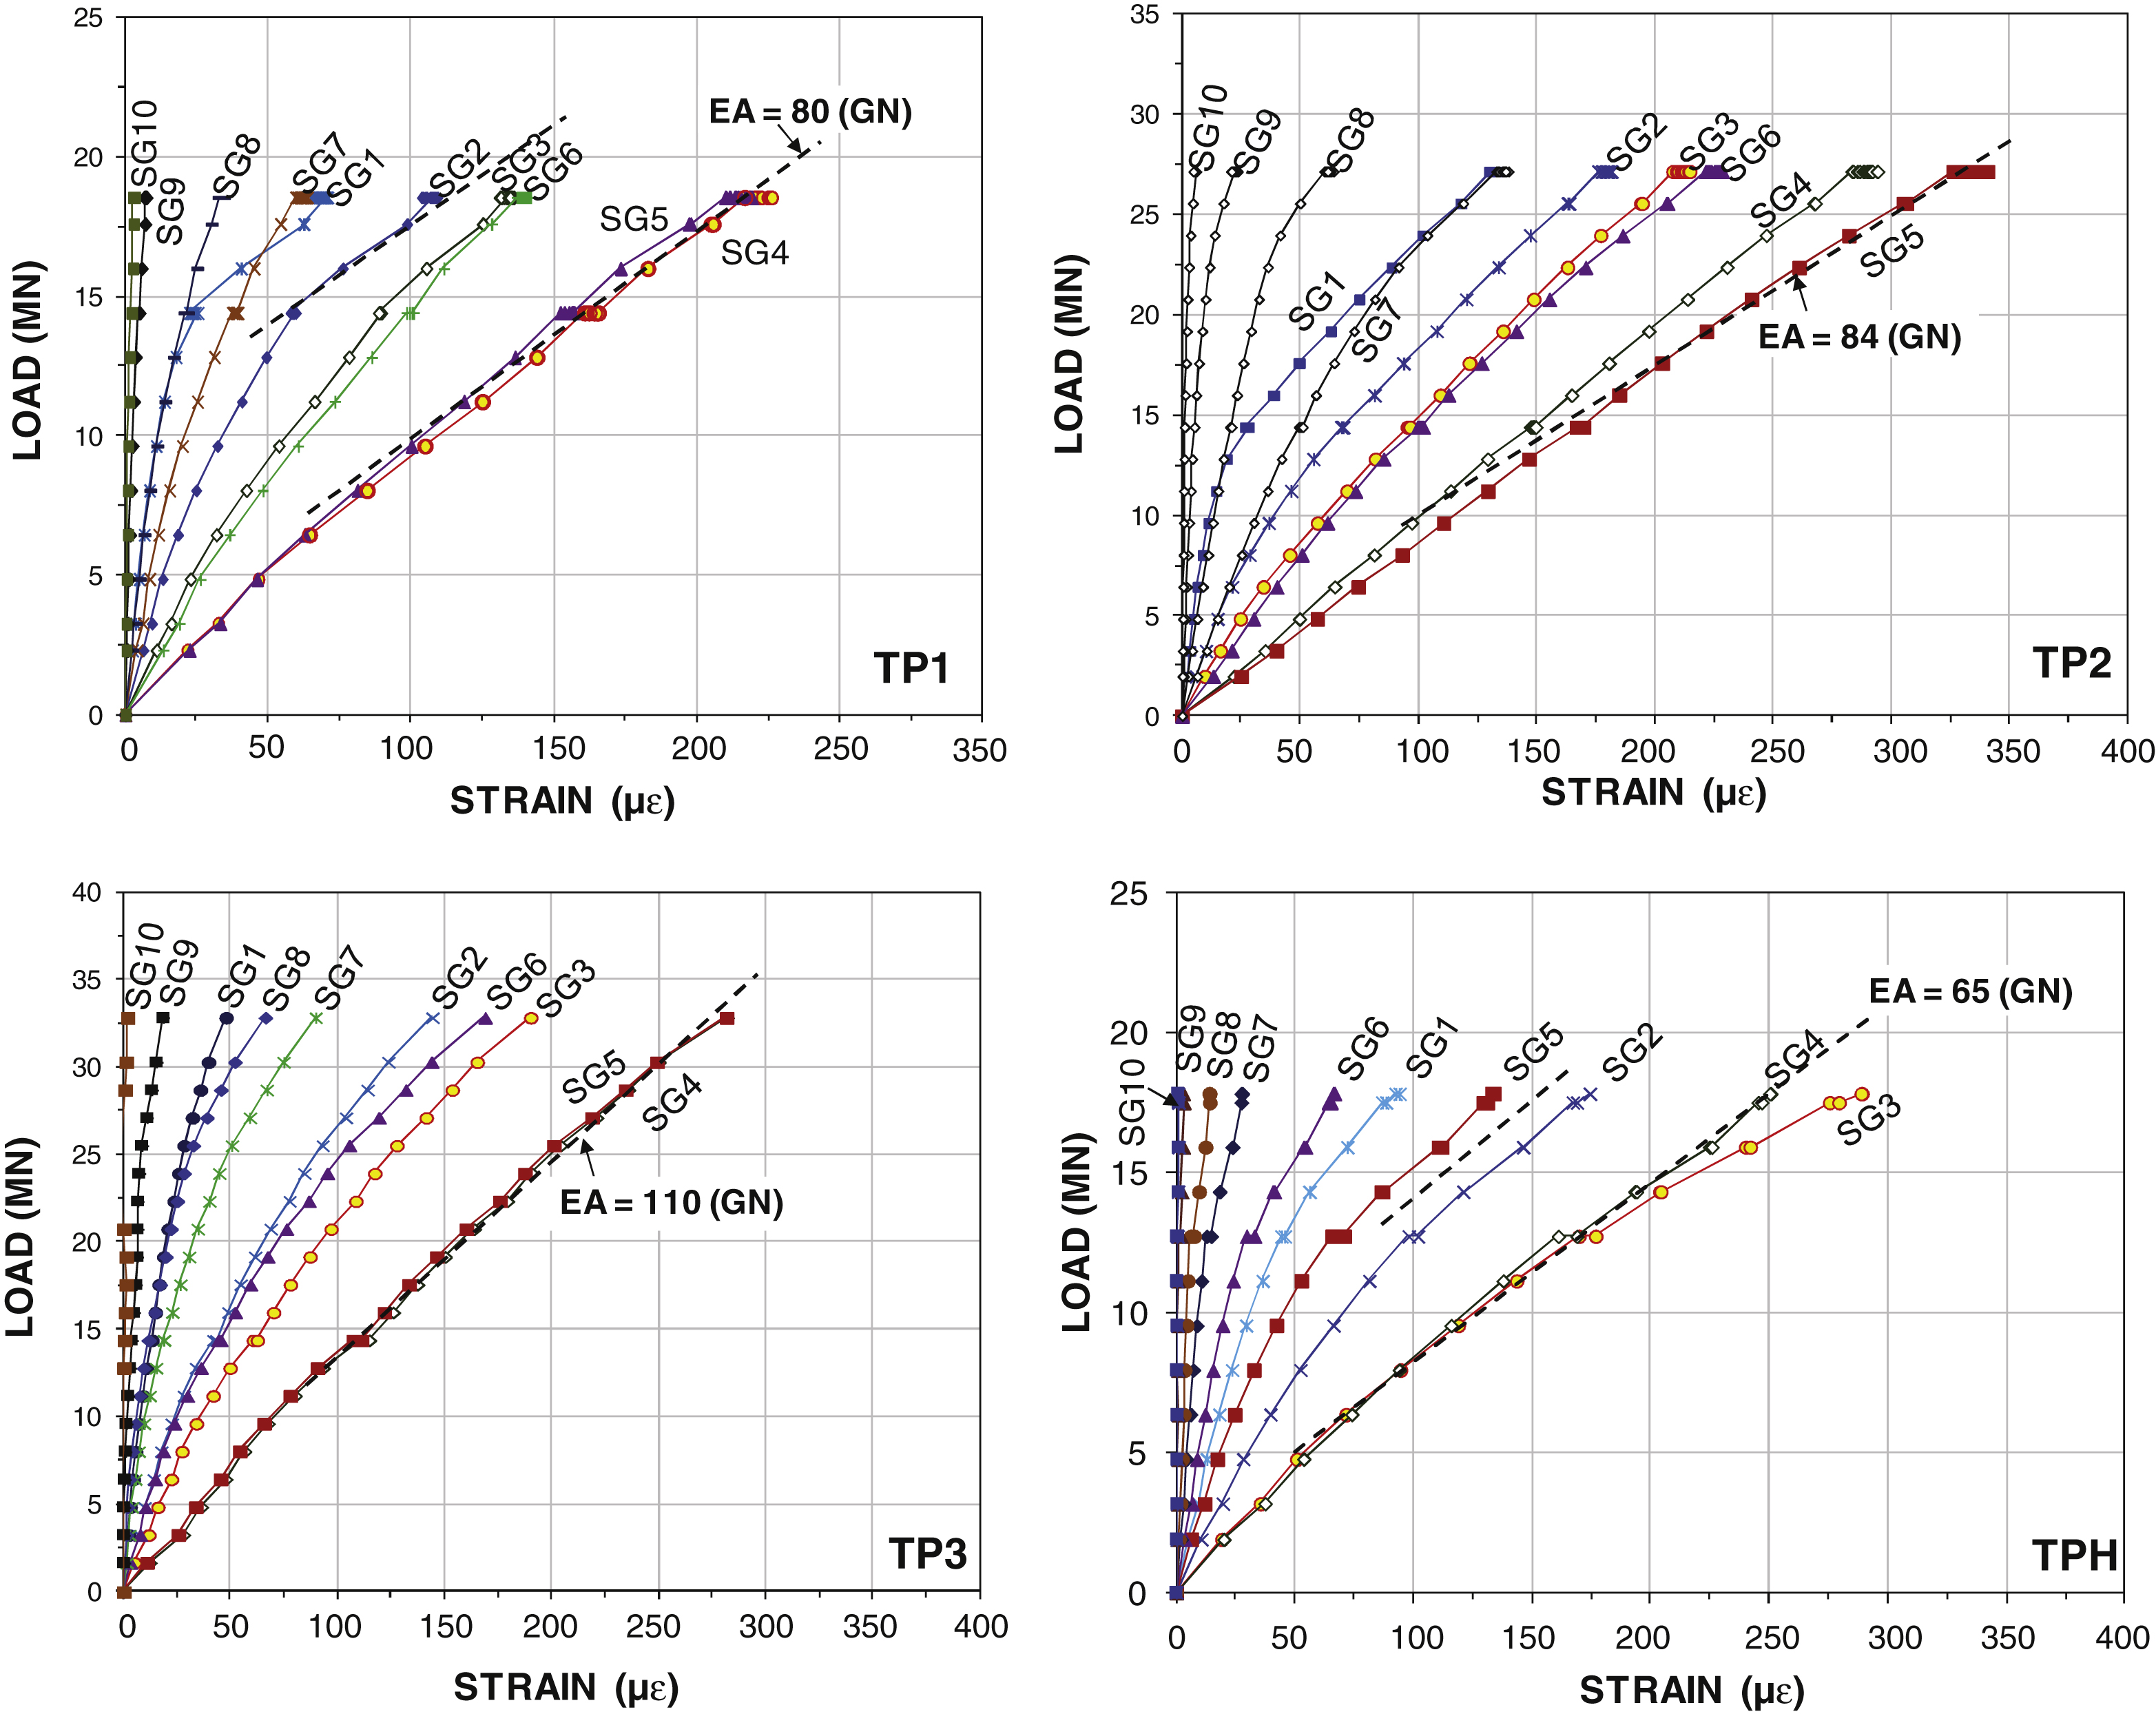
Fig.9
Incremental stiffness plots with approximate secant stiffness values.
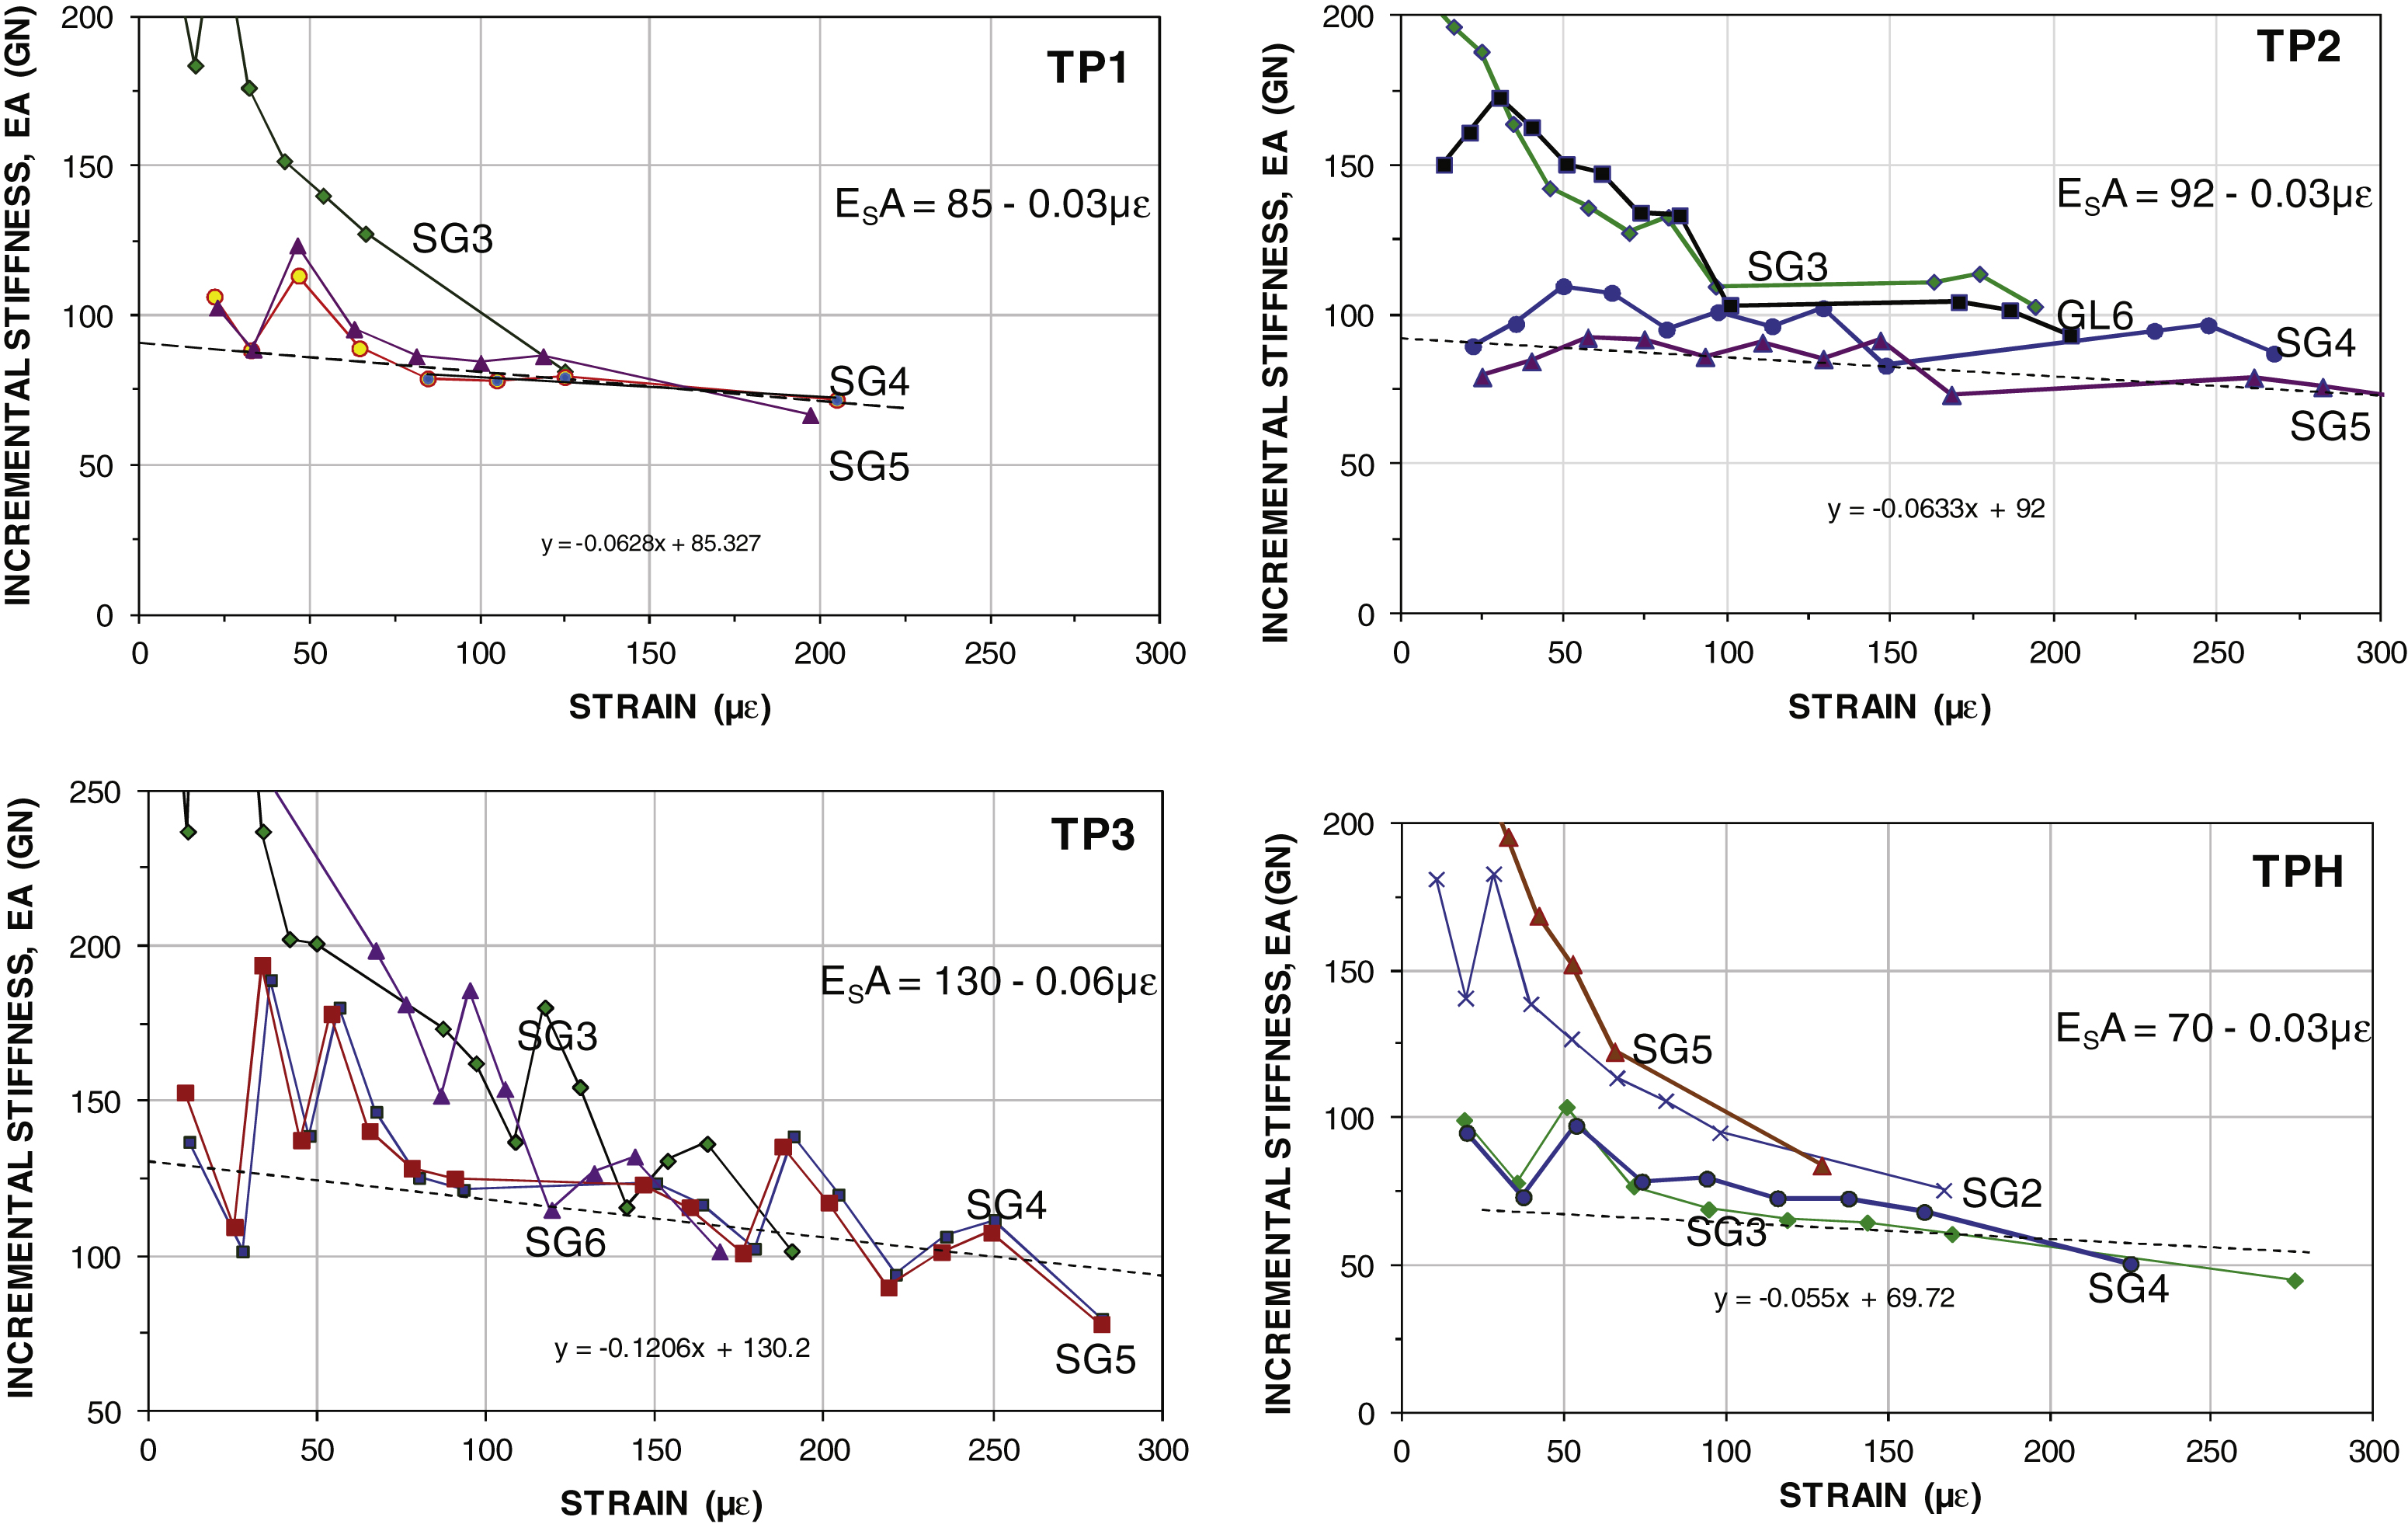
Fig.10
Load distributions: Measured and fitted in effective stress analysis.
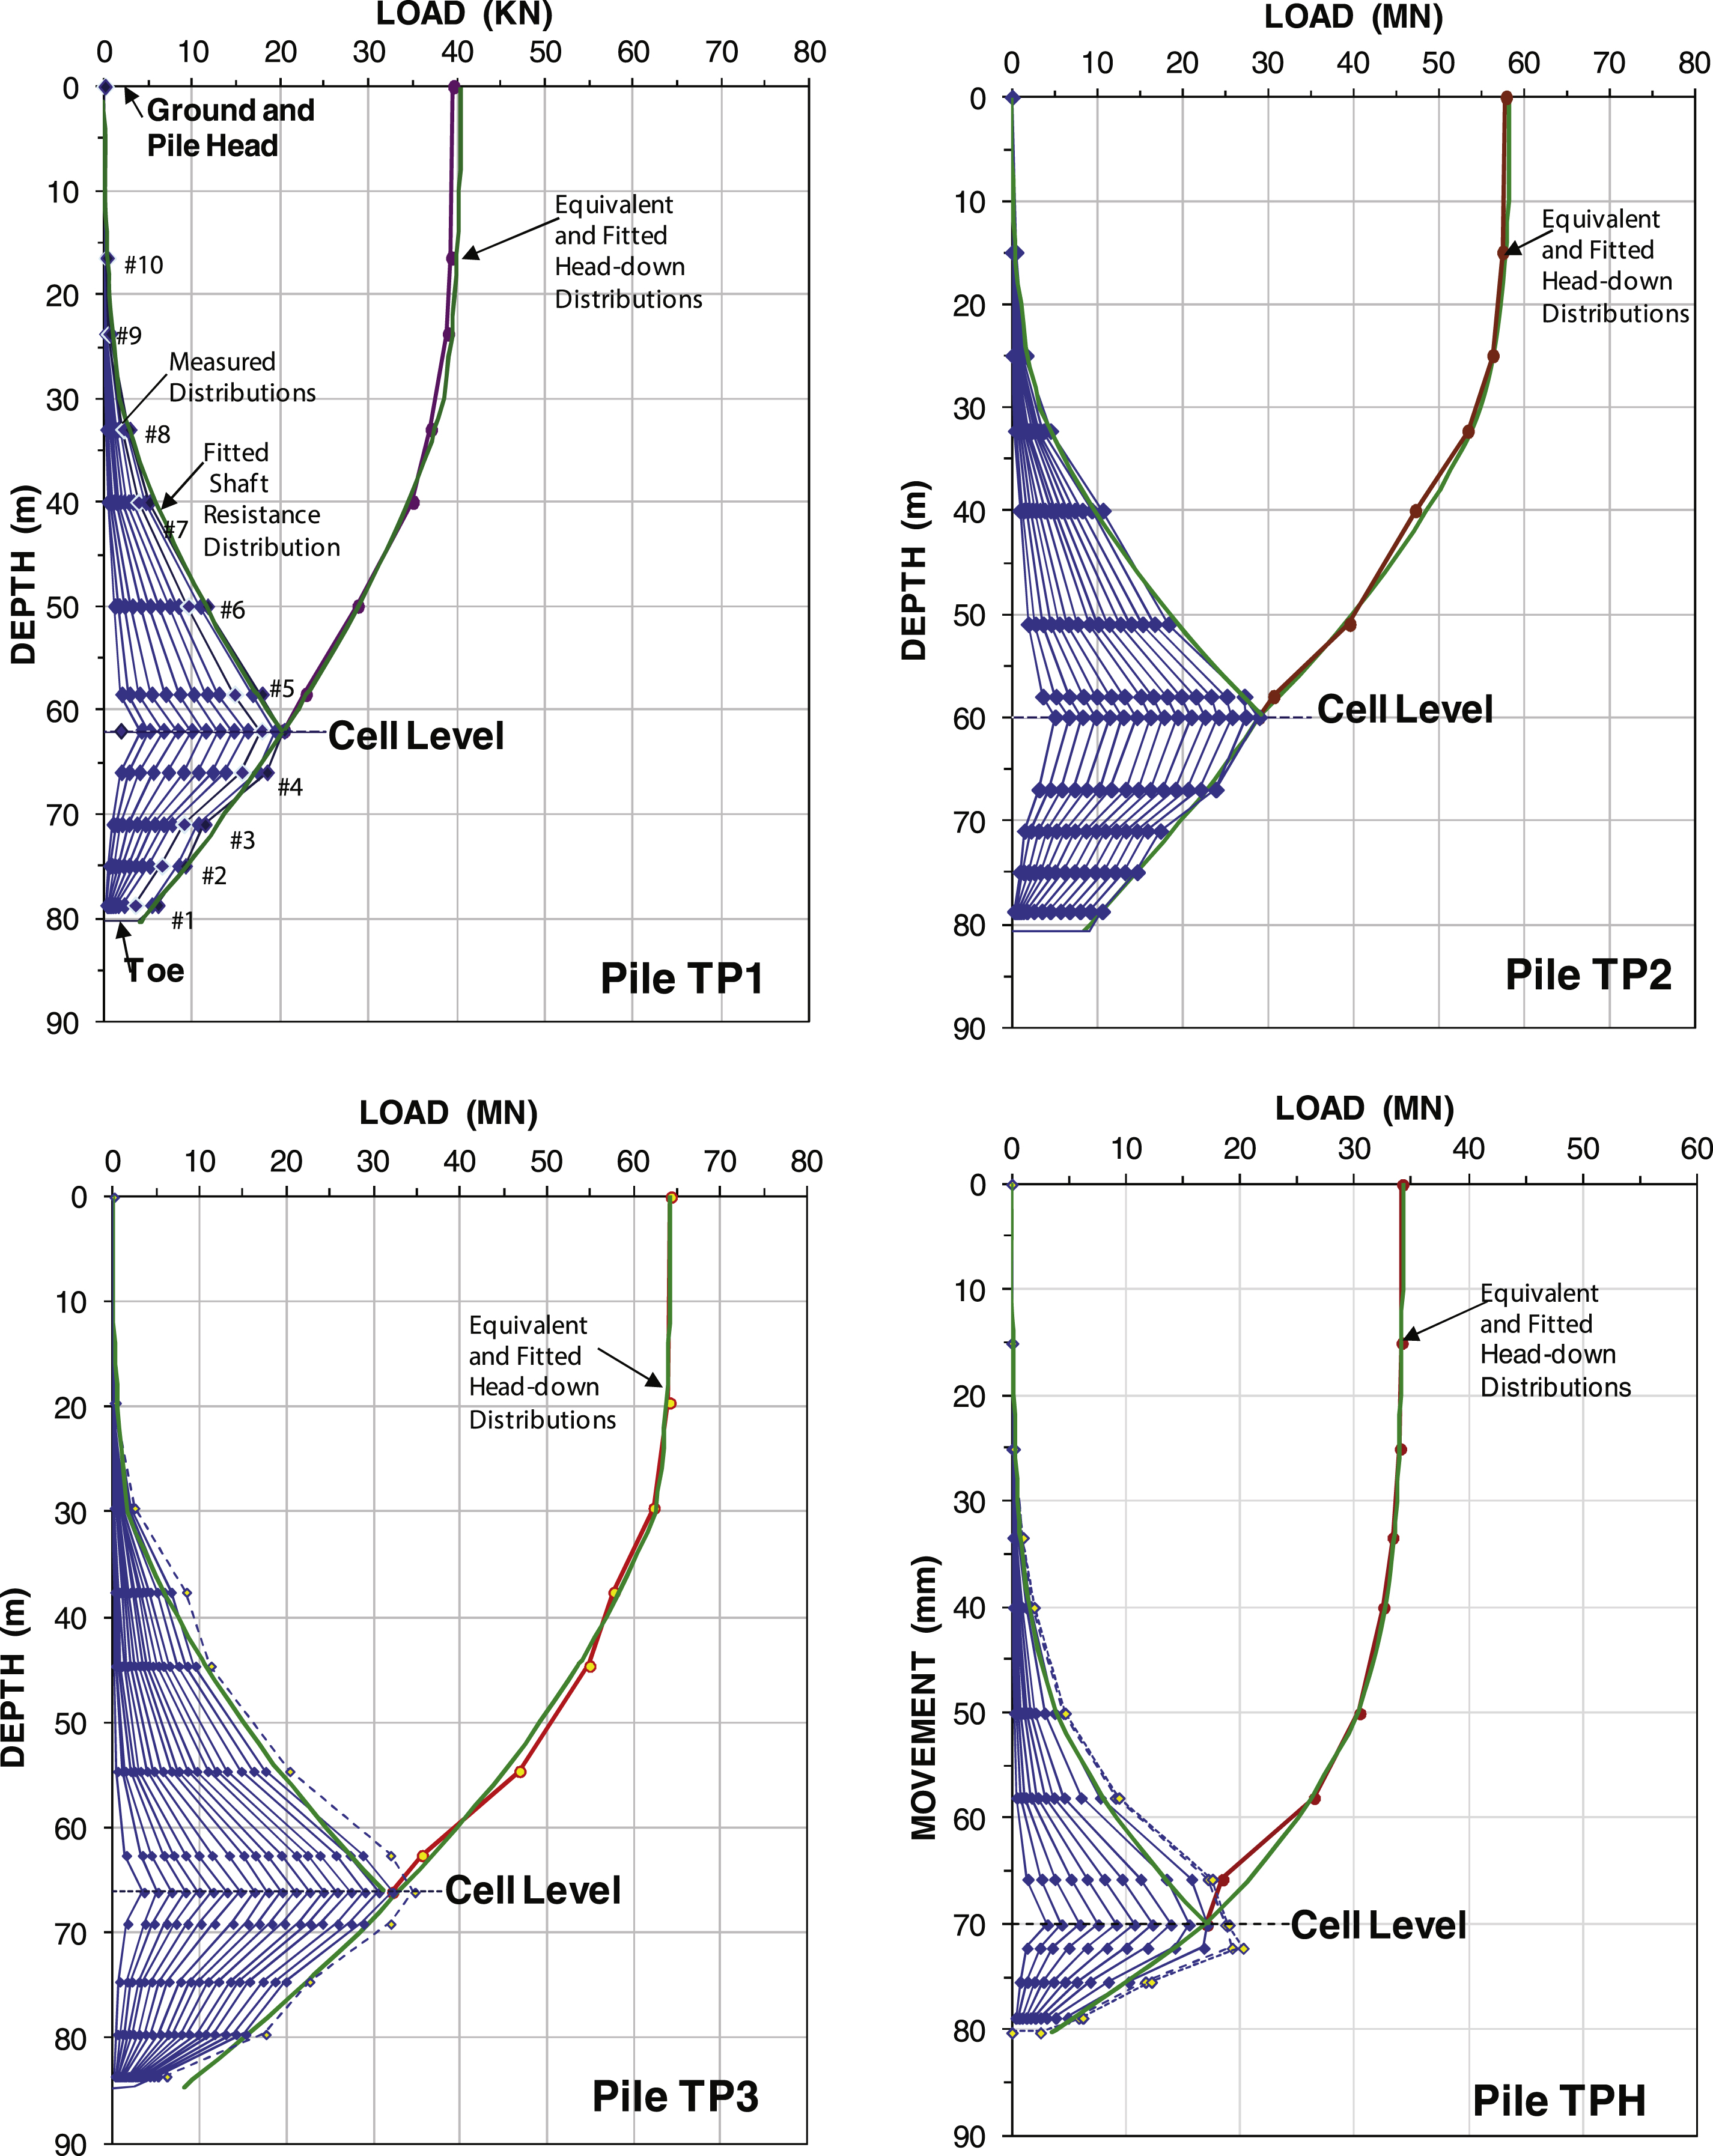
Fig.11
Distributions of beta-coefficients and unit shaft shear.
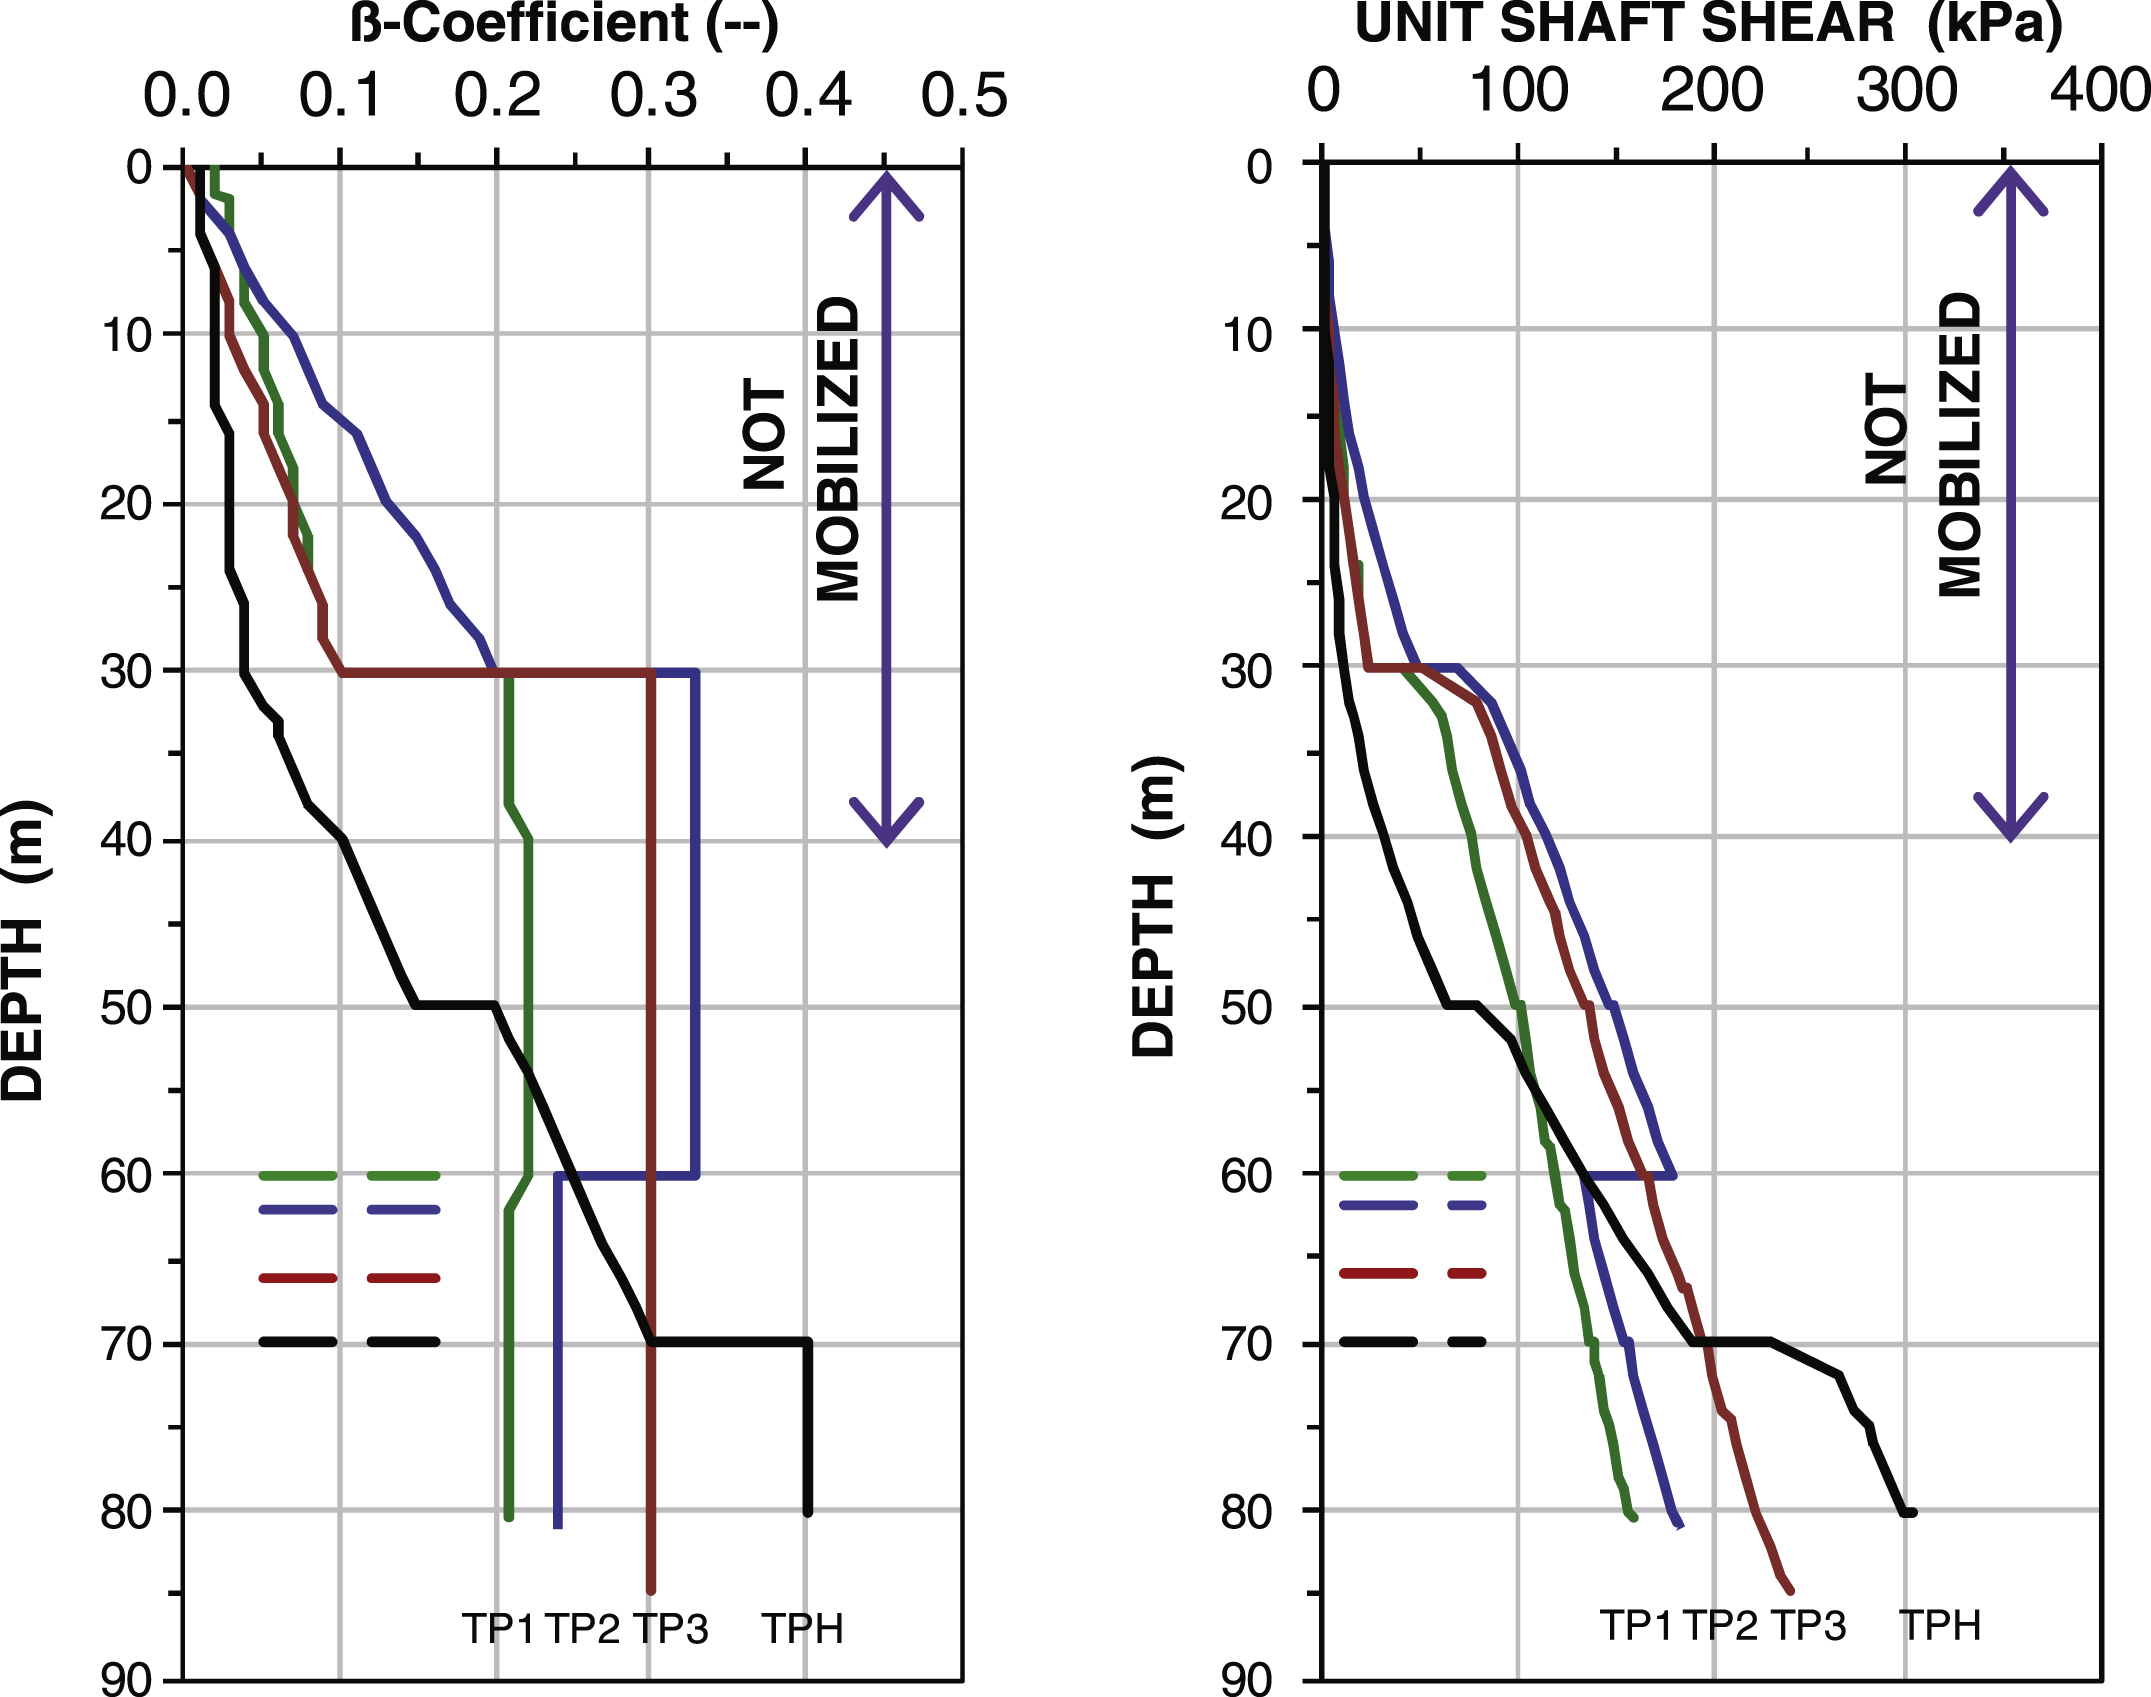
Fig.12
Unit shaft resistances.
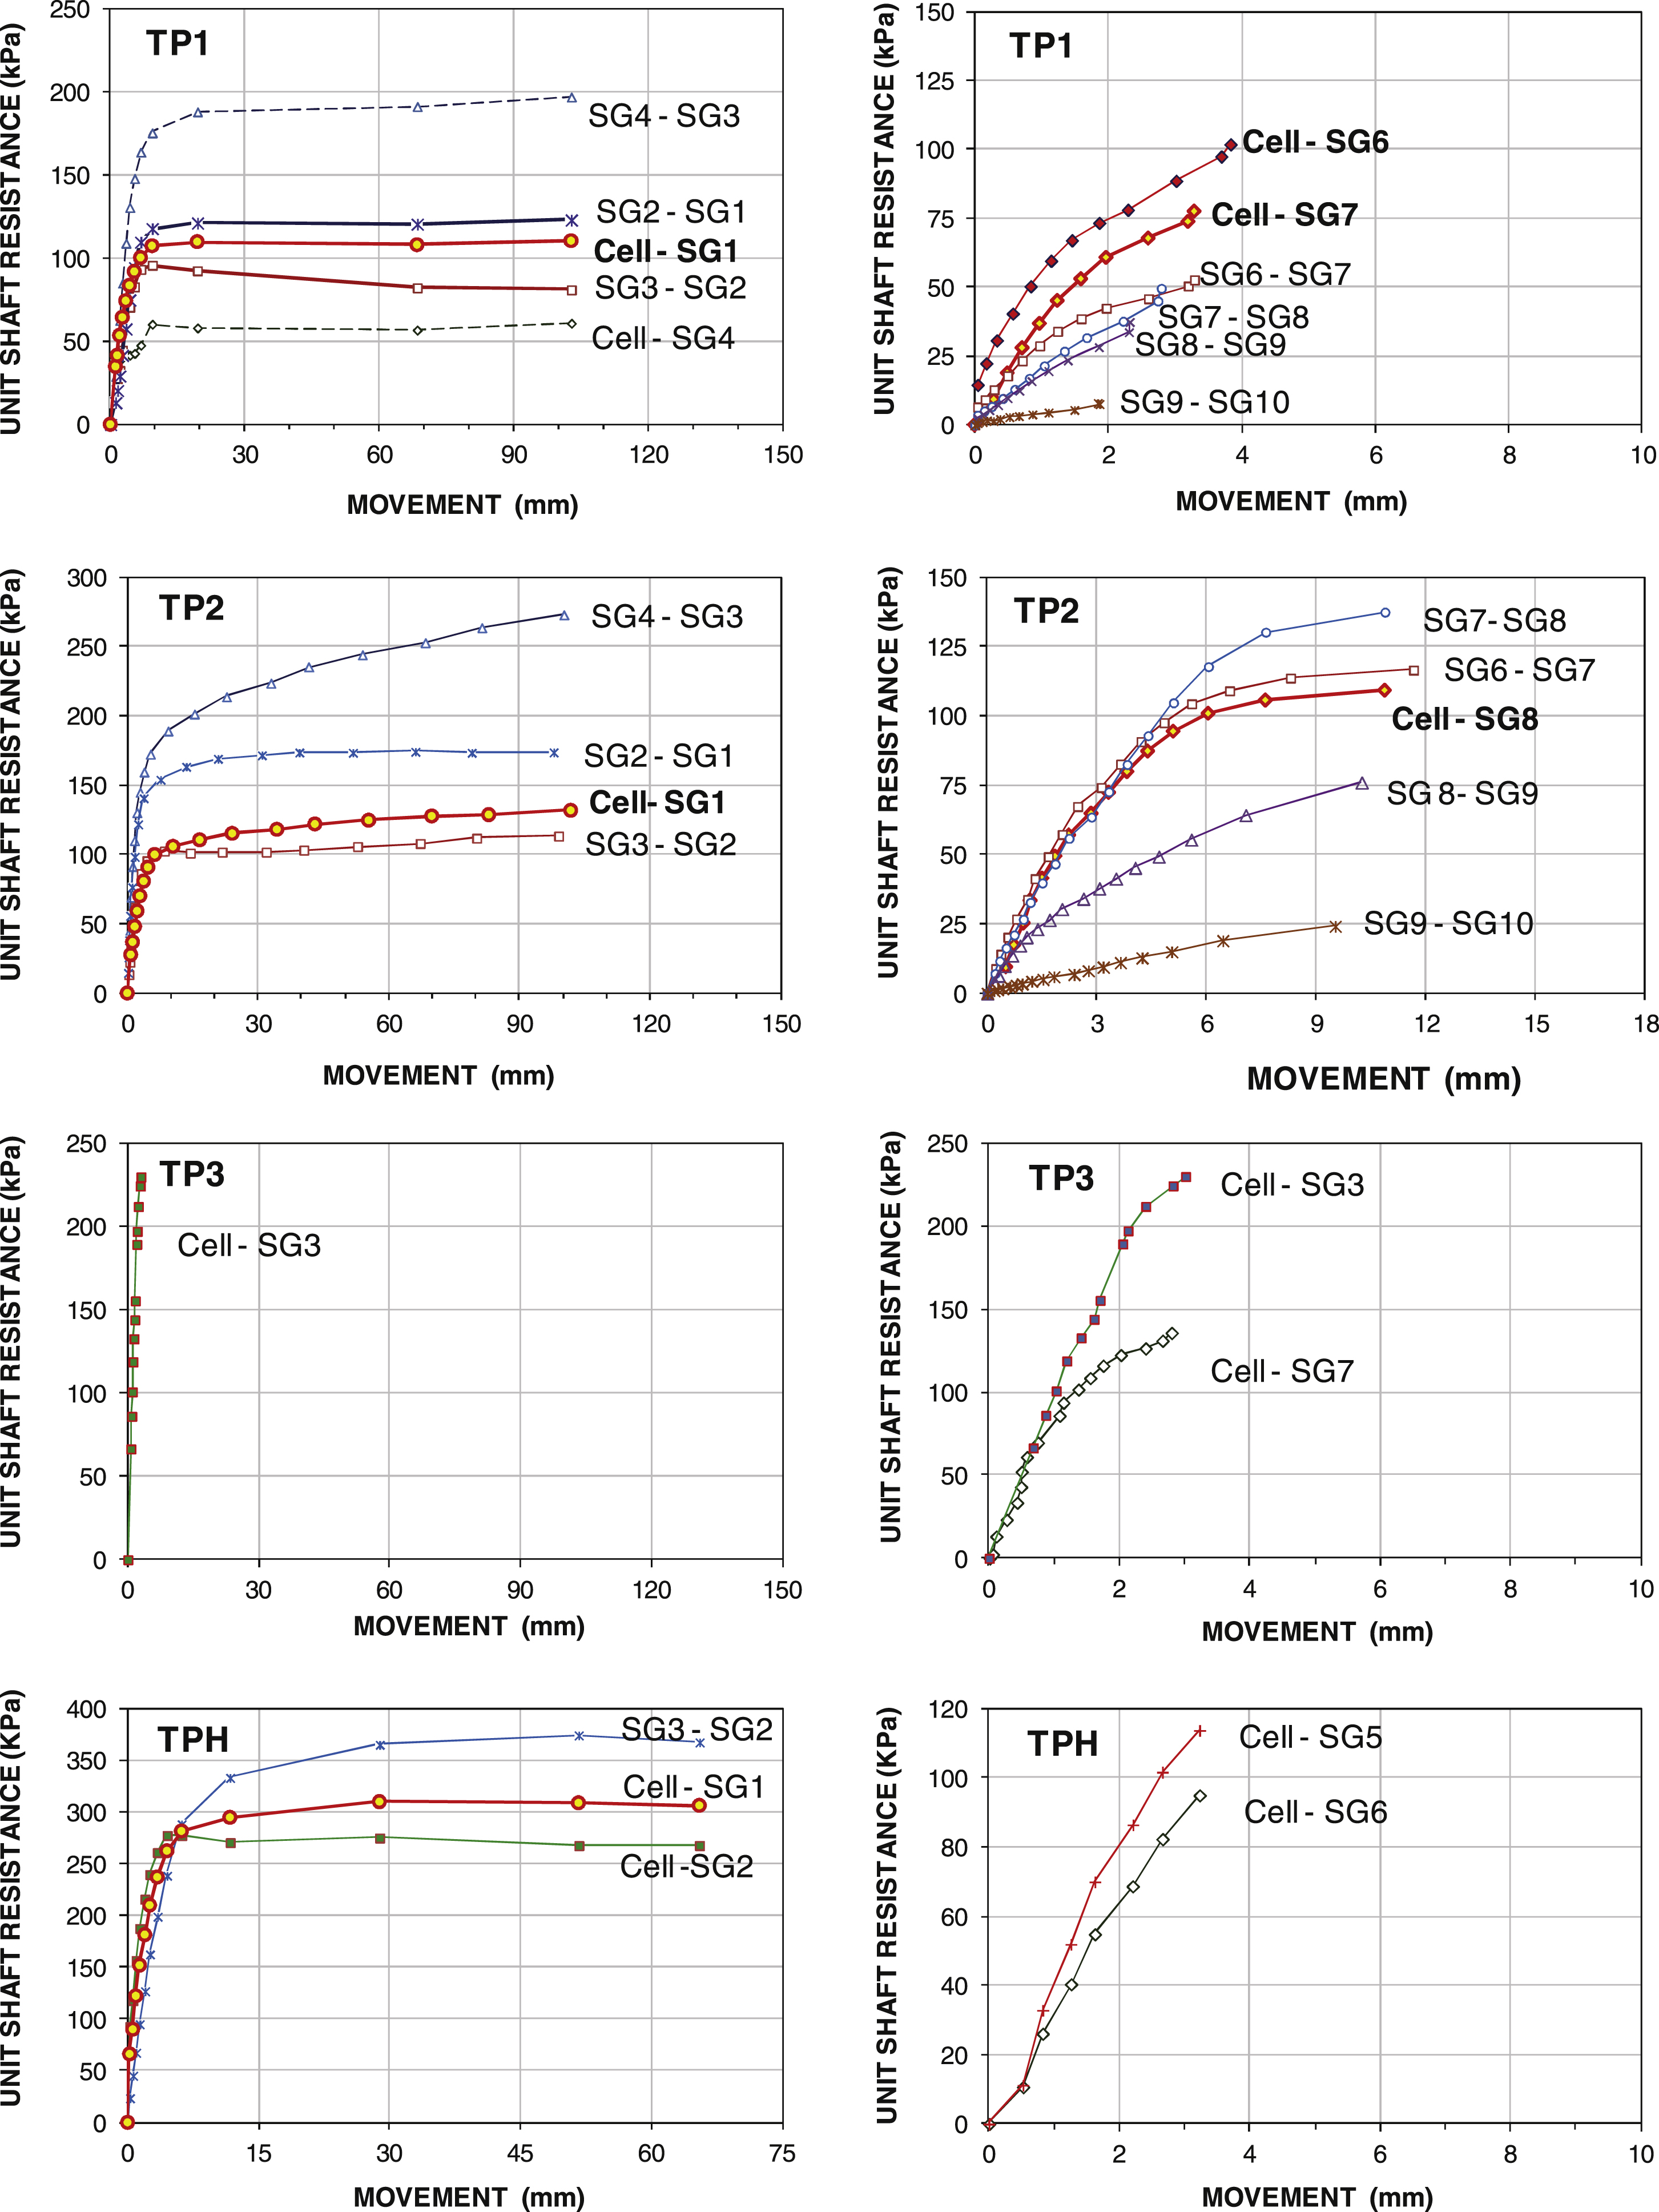
Fig.13
Toe stress versus toe movement for Piles TP1, TP2, and TPH.
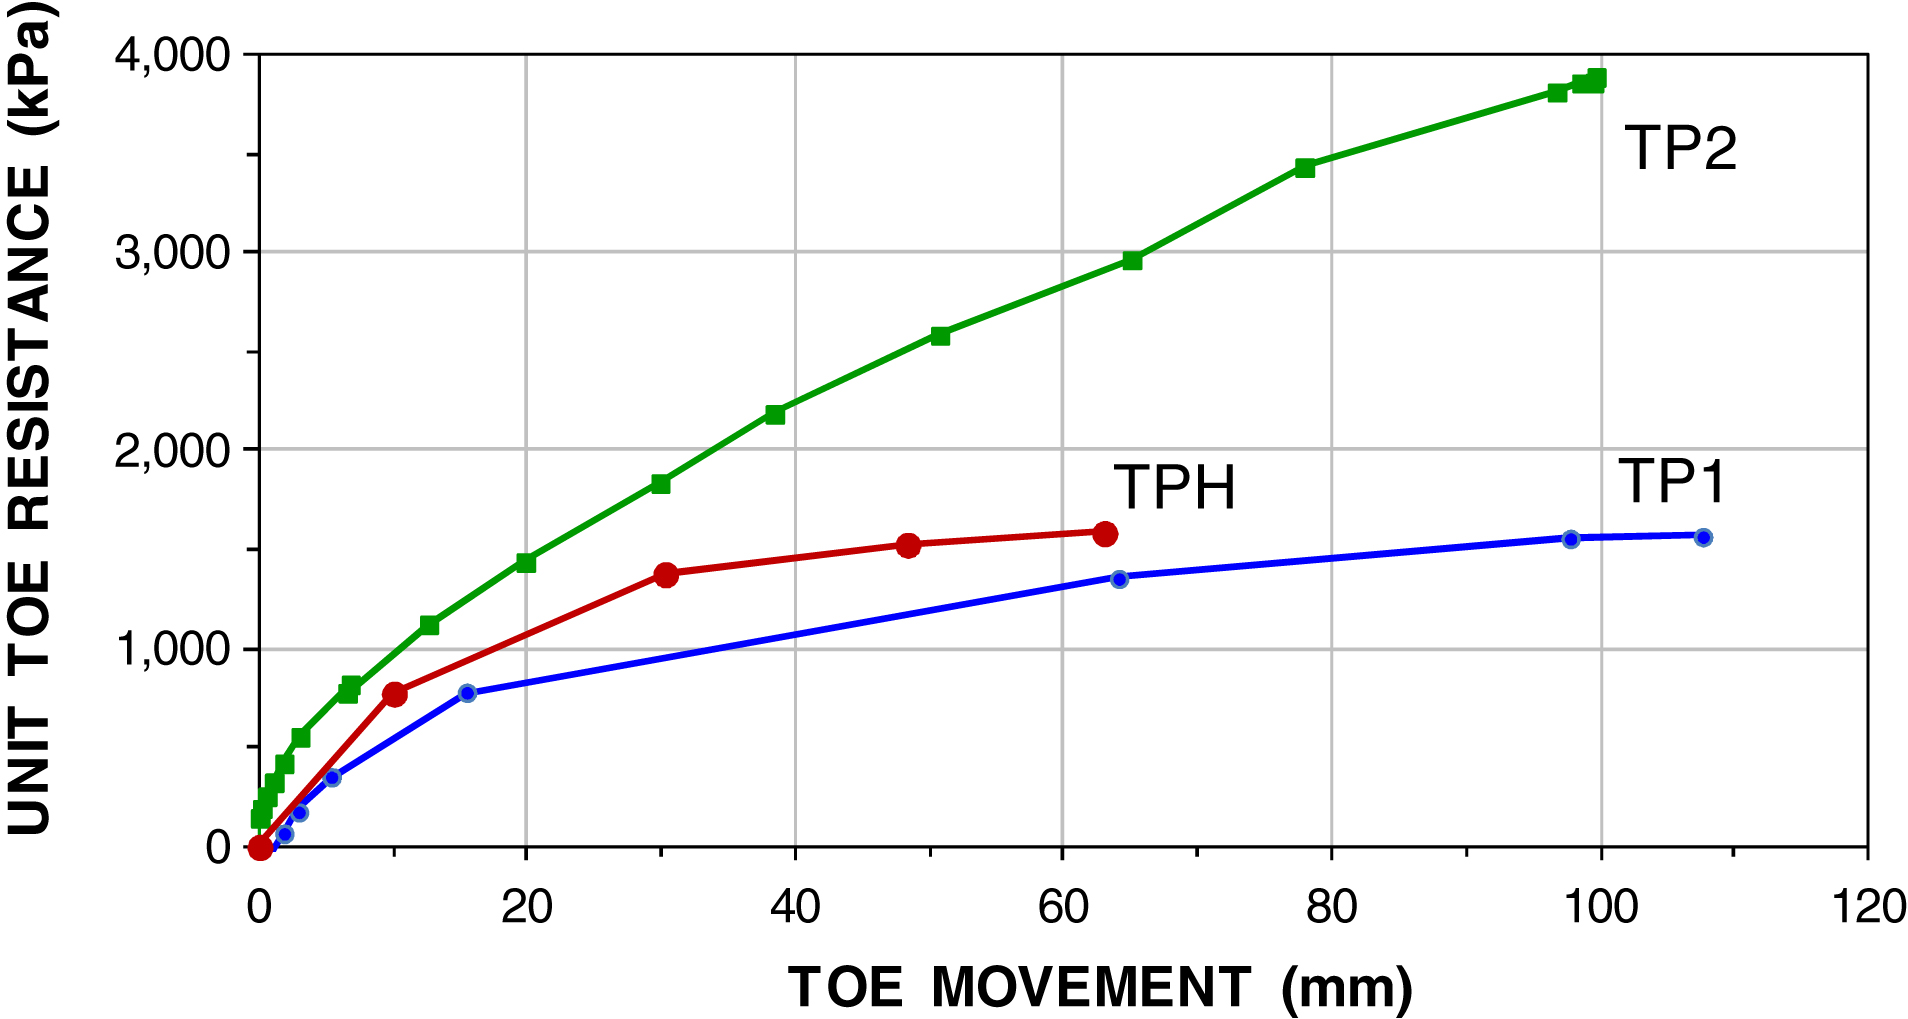
Table 1
Loads and movement of the bidirectional tests
| Pile (#) | Date tested | Days after concreting | Maximum cell load (MN) | Maximum movement | |||
| Upward (mm) | Downward (mm) | Head (mm) | Toe (mm) | ||||
| TP1 | March 12 | 38 | 18.5 | 5.2 | 114.2 | 1.6 | 109.1 |
| TP2 | March 5 | 34 | 27.1 | 16.5 | 105.7 | 11.4 | 100.2 |
| TP3 | March 16 | 41 | 32.8 | 10.4 | 8.9 | 4.0 | 2.9 |
| TPH | March 22 | 44 | 17.8 | 16.5 | 148.5 | 0.8 | 142.2 |


