
Next generation structural silicone glazing
Abstract
This paper presents an advanced engineering evaluation, using nonlinear analysis of hyper elastic material that provides significant improvement to structural silicone glazing (SSG) design in high performance curtain wall systems. Very high cladding wind pressures required in hurricane zones often result in bulky SSG profile dimensions. Architectural desire for aesthetically slender curtain wall framing sight-lines in combination with a desire to reduce aluminium usage led to optimization of silicone material geometry for better stress distribution.
To accomplish accurate simulation of predicted behaviour under structural load, robust stress-strain curves of the silicone material are essential. The silicone manufacturer provided physical property testing via a specialized laboratory protocol. A series of rigorous curve fit techniques were then made to closely model test data in the finite element computer analysis that accounts for nonlinear strain of hyper elastic silicone.
Comparison of this advanced design technique to traditional SSG design highlights differences in stress distribution contours in the silicone material. Simplified structural engineering per the traditional SSG design method does not provide accurate forecasting of material and stress optimization as shown in the advanced design.
Full-scale specimens subject to structural load testing were performed to verify the design capacity, not only for high wind pressure values, but also for debris impact per ASTM E1886 and ASTM E1996. Also, construction of the test specimens allowed development of SSG installation techniques necessitated by the unique geometry of the silicone profile. Finally, correlation of physical test results with theoretical simulations is made, so evaluation of design confidence is possible. This design technique will introduce significant engineering advancement to the curtain wall industry.
1Introduction
Requirements for curtain walls in today’s building codes have been influenced by recent extreme wind events. ASCE7-10’s design wind speeds and cladding pressures have increased significantly resulting in correspondingly larger material sizes and strength for sufficient structural capacity. For example, tall buildings in hurricane zones have cladding pressures that now routinely exceed 6 kPa.
Over the past several decades attachment of architectural glass to curtain wall framing has been successfully accomplished via use of structural silicone glazing (SSG). However, very high cladding wind pressure magnitudes result in bulky SSG profile dimensions. Architectural desire for aesthetically slender curtain wall framing sight lines prompted SSG designers to find a way to optimize the silicone joint.
During the process of this optimization, two advances in structural design and engineering were proposed. First, development of nonlinear analysis of hyper-elastic material is used to replace the industry standard assumptions, which use rigid supports, uniform load distribution, small deformations and linear material behaviour. Second, reconfiguring the silicone joint geometry from rectangular to trapezoidal shape provides improved stress distribution and allows design of a more efficient structural connection.
This paper will present a sequence of empirical and theoretical evaluations to demonstrate confidence in these two new techniques for design of SSG. Physical test specimens of structural silicone material will be closely examined to establish structural behaviour that can be rigorously compared to computer modelling using hyper elastic theory. And full-scale performance mock-up testing of the new joint design has been executed to compare to predicted capacity of an advanced finite element analysis of the integrated glazing system.
2Structural silicone glazing yesterday and today
Silicone structural glazing has its origin in 1965 with the use of glass to glass structural seals in the PPG Total Vision System. The practice further developed into two sided application in 1970, which utilized two sides adhered to metal framing members using silicone sealants, typically vertical jambs, with the head and sill of the glazing captured into a glazing channel with compression glazing. Four sided applications, where silicone sealants were solely utilized to attach glass to metal mullions, were first used in 1971 (Hilliard et al., 1977).
As building facades began to evolve through the use of innovative glass products, the use of insulating glass units were used in two sided applications in 1976 and four sided applications in 1978. What was unique about the use of insulating glass was that not only was the glazing held onto the side of the building facade by silicone sealants, but that also the structural component holding the lites of glass in the construction of the insulating glass unit utilized structural silicone sealants.
Structural silicone glazing has been studied with respect to high performance environments for the last several decades with proven durability and performance in areas of high wind zones, hurricane/typhoon prone areas, extreme temperatures, and seismic activity (Carbary, 2007). However, the basic design theory on how to properly size the structural joint has remained the same. The Bite calculation as derived from the trapezoidal loading theory is as follows:
The ASTM article, “Methods for Calculating Structural Silicone Sealant Joint Dimensions”, published in 1989, described the structural joint requirements for a rectangular glazing unit. (Haugsby et al., 1989). The requirements described were based on the simple physical relationship of the size of the glass, trapezoidal loading principle, maximum wind load, and maximum sealant design strength of 140 kPa (20 psi). Key discussion points from this article are:
• The wind load is the maximum determined force of pressure on the glazing unit due to wind speed.
• Short span is the shortest dimension of one of four sides of rectangular glazing unit.
• Sealant design strength is the maximum tensile force expected on the sealant at maximum wind load.
Sealant technology, analytical techniques and computing technology have significantly advanced over the history of the practice of structural glazing without much change to the method of design. Sealant technology has progressed with neutral curing formulations, increased tensile strengths, and higher movement capability. Studies have been conducted on the performance of sealants in specialized applications. Several papers have been written on the use of silicone sealants in curtain wall units for seismic activity (Zhargamee et al., 1996) including the use of finite element analysis to predict the mode of failure in silicone joint (Broker et al., 2012).
A study entitled “Evaluation of Silicone Sealants at High Movement Rates Relevant to Bomb Mitigating Window and Curtainwall Design” using high speed photography and specialized measuring devices to illustrate the relationship that the tensile capability of the sealant increases as the strain rate increases (Yarosh et al., 2008). This unique property of silicone explains the successful use of silicone sealants in ballistic and blast mitigating applications.
The basis for design strength and method of design are not addressed in these papers, for good reason as the design has been used in projects all over the world that have performed well in excess of 40 years. ASTM C1401 Standard Guide for Structural Sealant Glazing is the most complete reference to the design considerations for structural silicone glazing. This document provides an excellent overview of the practice along with a full list of historical references regarding the subject.
There have been efforts to challenge both the basis of designing structural joints and increasing design strengths. The reasons for attempting the changes are to reduce the use of aluminium, which can impact the overall cost of the curtain-wall project as well as the thermal performance. Another reason of the increased vision area due to reduced sightlines is an aesthetic driver for this attribute. Unfortunately, there have been no thoroughly developed and published technical arguments for proof of challenges to designing structural sealant joints and increasing design strengths within these advancements. There appear to be opportunistic approaches to increased design strength based on business risk and reward as opposed to sound science and engineering.
Finite element analysis of structural silicone has been used to explore standard (Travis et al., 1998) and unique designs (Hagl, 2008) coupled with the understanding of the non-linear behaviour of structural silicone materials. This tool that has been used in the aerospace and automotive industries, has expanded the understanding of nonlinear materials in the construction industry.
3Finite element (FE) modeling of SSG
A FE software package was used to conduct finite element modelling of structural silicone. This software package provides access to several hyper elastic material properties, as well as curve-fitting subroutines which can be used to automatically generate material property data from physical testing. The services of a test laboratory were used to develop accurate tension, shear, and biaxial extension data for the Structural Glazing Sealant material. The tension, shear, and biaxial data was then curve-fitted with several material models within a finite element program, with the objective being to find a curve fit which minimized the scaled residuals resulting from the data provided. It was found that an incompressible 2-Parameter Mooney-Rivlin curve fit produced minimal scaled residuals, and was selected for as the material model. Both the finite element program and independent literature indicate that the Mooney-Rivlin material model can accurately represent a material’s response up to 100% strain. An added benefit of the Mooney-Rivlin model is that it is a relatively standard model within finite element packages that are capable of modelling large strain effects.
Strain Energy Density Function for Mooney-Rivlin 2 Parameter Model:
(1)
Values selected for C1 and C2 were 0.239 and 0.010 MPa, respectively.
As a validation method for the model generated, the Mooney-Rivlin 2 parameter model was tested against the results of ASTM C1135 samples previously tested. A mesh size of 1.27 mm was used. The model used to replicate the ASTM C1135 test sample is documented below; the size of the silicone sample was 50.8 mm×12.7 mm×12.7 mm. Note that for computational efficiency, the size of the glass adhered to the silicone was reduced to the surface area of the silicone sample itself.
Results of the ASTM C1135 test model were compared against the results of physical specimens of the same batch of silicone as that used to generate the curve-fitted data. Figure 1 documents the load vs. deflection diagrams of the ASTM C1135 physical test samples and the C1135 modelled sample. Additionally, results at each 1.27 mm of deflection are provided in Table 1, along with the resultant force error at each point.
4Results
The results within the curve-fitting regime in a single silicone batch indicate a maximum-recorded error of 17.6% in the range of 0.15” deflection, or approximately 30% nominal strain. In all cases, the FEA results over-predicted the physical test results. Observation of the percentage of error within the silicone batch, however, does indicate that while the material properties appear stiffer than the material tested, the offset between the tested and modelled materials is consistently between 11% and 18% , through the full range of modelled extensions. It should be noted that the strain rate of the data used to generate the FEA material properties and the data used to generate the ASTM C1135 test results were prepared based on different strain rates; the FEA material properties were generated at 0.01 s-1 strain rate, while the ASTM C1135 test results were generated at 0.0167 s-1 strain rate. It is known that the rate at which hyper-elastic materials are strained has an effect on the properties of such a material, but the effects of the rate of strain were not explicitly analysed in this paper.
In addition to checking the FEA results within a single batch of silicone, the FEA results were also compared across several batches of silicone. These comparisons can be seen in Table 2. Three historical sets of ASTM C1135 data randomly selected were provided for error analysis against the FEA results. The results of the sensitivity study indicate that the error between the FEA silicone model and the sample batches has a maximum reported error of 33.3% at 25% strain. Unlike the intra-batch comparison, the inter-batch comparison indicates that the FEA model is, in general, underpredicting the induced loads in the physical tests. Unlike the error calculated from the intra-batch comparison, the error calculated from the inter-batch comparison does not indicate that there is a consistent offset between the two materials. Again, it should be noted that the strain rate of the historical data was generated at a different load rate than the strain rate of the FEA model. The historical data were generated at a load rate of 50.8 mm/min, equal to a strain rate of 0.067 s-1.
The stress distribution plots in Figures 2 and 3 indicate the results of the FEA models at 0.76 mm (0.03”) deflection and 1.78 mm (0.07”) deflection. At these deflections, the induced forces were 84.1 N and 177.9 N, respectively, which are approximately representative of 100% and 200% of what is typically considered limiting stresses for structural silicones.
Note that in both cases, stress peaks are calculated around the perimeter, and the stress within the silicone sample is highly non-uniform. The high differential stiffness between the silicone and the adjacent substrate (glass in this case, or aluminium in the case of a typical curtain wall assembly) causes the stress to be unevenly distributed. The results shown above are consistent with typical failure propagation observed in ASTM C1135 tests; the sample failure propagates from the perimeter of the silicone sample.
The rationale behind the newly proposed silicone sealant joint can be seen in the results of the ASTM C1135 test samples. In a typical curtain wall assembly, where the silicone is adhered in a square cavity, the finite rotation of the glass at the perimeter seal under negative load will induce the greatest movement at the edge of the silicone joint. The concept behind the new sealant joint is, rather than force the sealant to fight against the finite rotation of the glass at the perimeter (which, theoretically, could be inducing a moment couple within the silicone joint), the sealant joint should be designed such that the silicone at the perimeter joint has additional movement capacity to allow for the glass to rotate more freely. Figure 4 schematically demonstrates where the anticipated centre of rotation of the glass relative to the silicone joint is expected to be in both cases.
The proposed sealant joint design was tested on a 1905 mm×1524 mm glass model. One quarter of the glass was included in the model for computational efficiency. Two models were generated: one for the proposed sealant design (trapezoid with 23.81 mm long dimension, 6.35 short trapezoid dimension, and 12.7 mm long trapezoid dimension), and one with a 50.8 mm long rectangular sealant joint, per standard industry practice. The above-mentioned glass was loaded to 9.6 kPa. The results of the models were compared to each other, as well as to benchmark stresses in the C1135 model.
The results of the trapezoidal silicone models indicating the maximum stress through the gross area of the silicone bite did not exceed 0.38 MPa, with peak stress along the edge of the silicone joint at 0.64 MPa. The results of a similar ASTM C1135 test sample with similar edge stresses were loaded to 2.29 mm deflection and 218.6 N applied force. The results of a ‘traditional’ silicone model indicating the gross area of the silicone bite did not exceed 0.55 MPa, with peak stress along the edge of the silicone joint at 0.91 MPa. The results of a similar ASTM C1135 test sample with similar edge stresses were loaded to 3.30 mm deflection and 293.4 N applied force. Details of these stresses at the midspan of both the long and short dimensions, as well as comparable peak edge stresses from C1135 test models, are shown in Figs. 5 to 10.
The results of the preceding figures indicate that a stress reduction can be achieved by allowing the silicone to rotate with the glass under large wind loads. The results also indicate that, while safety factors are included in the design of silicone joints, these safety factors may not be as high as those indicated when comparing silicone in the traditional configuration to the results of a C1135 sample test.
To confirm that the proposed silicone joint would not compromise the glass under positive load, the above-mentioned silicone joint was loaded to 6.2 kPa positive pressure to check the effects on the stress distribution within the silicone joint. Corner joint stresses were checked against the stresses in the typical silicone joint; these can be seen in Figure 11. The stresses in both the gross area and the corner of the trapezoidal silicone joint did not exceed those in the traditional silicone joint under negative wind load.
5Mock up results
A mock-up was fabricated (details see Fig. 12) and tested to the requirement of the Miami-Dade Building Code for impact-resistant products. There are two types of impact-resistant products: large-missile resistant and small-missile resistant.
The unique joint design was scaled up on a real size piece of glass and a design of 9.58 kPa (200 psf) and tested to the Miami Dade, Florida Building Code’s Test Protocol for High-Velocity Hurricane Zones. The protocols that were followed were Testing Application Standard (TAS) 201–94, TAS 202–94 and TAS 203–94.
TAS 201–94 is the protocol that covers procedures for conducting the impact test as required by Section 1626 of the Florida Building Code. TAS 202–94 is the protocol that covers procedures for conducting a uniform static air pressure test. This test is operated in the spirit of ASTM E330 Standard Test Method for Structural Performance of Exterior Windows, Doors, Skylights and Curtain Walls by Uniform Static Air Pressure Difference. TAS 203–94 is the protocol that covers procedures for conducting cyclic wind pressure loading test required by FBC and TAS 201–94. Impact products are required to undergo a ± 4500 cycle test (9000 total) and are conducted per ASTM C1886 Standard Test Method for Performance of Exterior Windows, Curtain Walls, Doors, and Impact Protective Systems Impacted by Missile(s) and Exposed to Cyclic Pressure Differentials.
Impact resistant glazing products that are accepted in the Miami Dade area have two options for protocol testing. A large missile resistant product is a product that is exposed to two impacts with a piece of lumber weighing approximately 4.1 kg (9 pounds), measuring 50 mm × 100 mm a 2740 mm (2” × 4” × 9’) in size, launched into the glazing at 15.2 meter per second (50 feet per second, 34 mph). The unit is then subjected to hurricane loading of 9,000 wind cycles, positive and negative. Successful passing assemblies must remain able to withhold pressure during the entire test.
A small missile resistant product is a product that is impacted with three sets of 10 ball bearings launched into the glazing at a speed of 24.4 meter per second (80 feet per second, 50 mph). The product is then subjected to wind loads for 9,000 cycles. Successful passing assemblies must remain able to withhold pressure during the entire test.
The loading pressures for this mock-up were chosen to be ± 9.58 kPa (200 psf) with a ± 14.37 (300 psf) test to validate 150% overload as specified in the TAS 202–94.
The mock-up samples were fabricated to accommodate a glass size of 1524 × 1905 mm (60” × 75”). Two different laminates were used, Polyvinylbutyral (PVB) and Inoplast interlayer (SGP). Three different monolithic laminated types of glass were used in the mock-up testing:
1. 5 mm clear tempered, 2.3 mm PVB interlayer, 5 mm clear tempered (3/16” Clear tempered, 0.090 PVB interlayer, 3/16” Clear tempered).
2. 5 mm clear tempered, 2.3 mm SGP interlayer, 5 mm clear tempered (3/16” Clear tempered, 0.090 SGP interlayer, 3/16” Clear tempered).
3. 6 mm clear Heat Strengthened, 2.3 mm SGP interlayer, 6 mm clear Heat Strengthened (1/4” Clear Heat Strengthened, 0.090 SGP interlayer, 1/4” Clear Heat Strengthened).
The glass was attached to an anodized aluminium frame as shown in Fig. 13 above. The frame above was constructed out of a standard aluminium tube to which a brake metal shape was mechanically attached with 6 mm (1/4”) fasteners 200 mm (8”) on centre. Glass types 1 and 2 were tested exactly as shown in Figure 13. The weather seal detail used with glass type 3 was altered by not using a backer rod and filling the rectangular cavity with the structural silicone. In all cases the structural silicone was not in contact with the silicone used at the glass edge.
During the test, the test protocol for TAS 202–94, or structural loading by using air pressure, deflection measurements were taken of the aluminium frame and the centre of glass by the testing laboratory. These deflections are reported in Tables 4–6 and correspond to the locations noted in the tables under ‘Indicator Reading’. Tables 4–6 report the data taken on the air infiltration, water infiltration and static loading of the glass units.
The three types of glass met the Miami Dade Code requirements for TAS 202–94 at a design wind pressure of ± 9.58 kPa (200 psf), which included a ± 14.37 kPa (300 psf) overload.
6Mock up to evaluate silicone deflections
Additional work was completed to validate the deflections in the silicone joints under load in the new trapezoidal joint compared to a conventional joint. Although this was attempted at the mock-up facility using the full size units, the permanent set of all the data points varied between 1 and 5 mm as can be seen in Tables 4–6. This permanent set disrupted the data acquisition network that was targeted at measuring deflections in the silicone joints on the order of 0.01 mm.
A small mock-up framing system was built out of 65 mm × 100 mm aluminium tubes with a 3 mm wall thickness that had an overall dimension of 914 mm × 1524 mm. 6 mm tempered glass was attached to the 914 mm dimension using a conventional structural silicone design of 50.8 mm × 9 mm and the trapezoidal joint design that has a glass contact dimension of 24 mm with a varying glue thickness from 12 to 6 mm. These edge conditions can be seen in Figures 14 and 15. Foam spacer tapes we used to set the dimension. Release liners from the foam tapes were left in place so that they would not contribute to wind-load resistance during the testing.
The trapezoidal joint was created by mechanically attaching a trapezoidal aluminium shape to the rectangular tubes. The spacer was created by using three 6 mm thick pieces of foam tape. See Fig. 14.
The 1524 mm dimension did not have a structural seal to the frame. This allowed an unsupported span of glass of 1524 mm that was the same short span in the mock-up of the full size units. The long span was air sealed with a low modulus silicone rubber sheet that did not hinder the deflection of this assembly under wind load. Deflection gauges were placed at the top and bottom of the unit in symmetrical placements. See Fig. 16. The displacements were measured when a simulated negative wind load was applied. The data was acquired during an increasing wind load to the point that the centre of glass deflection were measured at 50.8 mm. The pressure was not taken to 14 kPa, as was done on the full-scale mock-up due to the possibility of glass breakage. This part of the project was to study deflections in the joints.
Two graphs of data are presented. Figure 18 are the comparative deflections at a maximum deflection of 50.8 mm at the centre of the glass. Figure 17 is the comparison of the deflections at 4.1kPa.
The measured deflections at points 1–6 are all in the proper direction as predicted by the model in Figures 5 and 8. Figure 17 shows the deflections at a 4.1 kPa wind load. This wind load was induced to achieve a 50.8 mm centre of glass deflection for the trapezoidal joint. The conventional joint allowed the centre of glass to deflect 34.1 mm. The increased amount of silicone indeed resisted the glass from deflecting. The conventional joint deflected less at all measured points except point #5. This trend is logical due to the contact dimension on the glass, which is double that of the trapezoidal joint. When reviewing the data in points 1 and 6, this represents the chord shortening of the glass when the glass is deflected under load. Since the conventional design showed less deflection, it is reasonable to expect the measured results of point 1 and 6.
Figure 18 shows the gauge deflections when the centre of the glass was allowed to reach 50.8 mm for each design. The negative load for this case was 6.0 kPa for the conventional joint and 4.1 kPa for the trapezoidal. We can conclude that the conventional joint will limit the glass deflection at the centre. When we review the data at gauges 1 and 6 at the same centre of glass deflection we see different deflections in the sealant. These numbers should be the same when the glass has the same centre of pane deflection. Gauge 3 reflects a 24.3% deflection (basis 9 mm thickness) of the conventional joints and a 14.4% deflection (basis 12 mm thickness) of the trapezoidal joint whenthe centre of pane is deflected 50.8 mm. Gauge 4 reflects a 19.7% deflection (basis 9 mm thickness) of the conventional joint and a 12.6% deflection (basis 12 mm thickness) of the trapezoidal joint when the centre of pane is deflected 50.8 mm. Referring back to Figure 17, the percent strains at 4.1 kPa for gauges 3 are 14.8% conventional and 14.4% trapezoidal. The percent strain for gauge 4 is 11.9% conventional and 12.6% trapezoidal. These relative strains in the joint can be consideredthe same.
If the trapezoidal joint behaved exactly like the conventional joint, the measured strains in the joint should be double because less than 50% of the glass is contacted with silicone. Therefore, it is reasonable to conclude that these joints in the trapezoidal design are better distributing the stress as predicted by the Finite Element Models shown in Figures 5, 6, 8 and 9.
7Large missile impact testing TAS 203–94
The three types of glass were subjected to the impact of a large missile testing protocol. All three types of glass could be cycled through the first 3500 cycles of the testing during positive wind load to the pressures outlined in Table 1 above. Upon reversal of the pressure from positive to negative, each type of glass had become deglazed from the frame due to extreme fatigue of the broken glass at the impact site. Figures 19 and 20 show the deglazed area.
The silicone remained intact and adhered to the glass and aluminium framing in each case; however the air leakage through the broken fatigued glazing ended the test. Building specifications do not typically require the large missile impact requirement above 30 feet from the ground. This test was done to determine if such a glass design could meet this strict test.
A small missile impact test was completed on Glass Type 3. 10 Ball bearings 8 mm diameter weighing 2.0 grams each were fired three times into the glazing. Figure 21 shows the impact of these small missiles upon the glass.
Glass Type 3 with the small missile impact as shown in Figure 21 was subjected to the cyclic loading pressures noted in Table 3. There was no issue with delamination of any sort. Figure 22 shows a close up of the lower left corner of the decommissioned specimen in Figure 21 after the 9000 cycles. The decommissioned specimen showed no signs of fatigue or failure.
This mock-up clearly showed that the unique silicone joint design passed the wind-load design criteria for ± 9.58 kPa (200 psf) and survived the ± 14.37 (300 psf) overload. The silicone joint was able to support broken glazing under positive wind load in 4500 pressure cycles in the large missile impact test without visible signs of duress. The silicone joint also survived a full 9000 pressure cycle in the small missile impact test. The silicone material used for the structural attachment of the glass in combination with the unique joint design has demonstrated a performance not demonstrated before.
8Pros/Cons
With this proposed advance in design of SSG, it is prudent to consider the disadvantages of change versus the advantages to using a new approach. Disadvantages will include the need for a change in manufacturing technique. The trapezoidal shape will require new extrusion die designs to accomplish the proper joint profile. Application of silicone material into the joint cavity is also different due to a narrower opening at one end of the trapezoidal geometry. A significant change in structural design/analysis will require a more rigorous engineering effort.
In spite of these changes, the potential advantages of the new SSG design can provide serious benefits. Aesthetically the new design allows for larger daylight openings in a typical module. The new design also allows for use of narrower framing sight lines. Slender aspect ratio’s for mullion design is frequently a desired architectural characteristic in curtain walls. A large economic saving can be realized by the reduced amount of aluminium required by the more efficient joint profile. Reduction of mullion width from 125 mm to 88 mm can easily save 10% of aluminium weight as well as finish surface area. Lighter units will be easier to transport and install. And while this new design uses the same SSG material that has a proven track record, the new joint profile provides a more evenly distributed stress contour compared to a standard joint design. Hence greater load capacity is achieved with advanced engineering design.
9Conclusion on how to use Next Generation SSG and incorporating a new design
As mentioned previously, the lack of credible technical resource through publication has created a need to properly consider new design methods or increases to design strength of structural silicone sealant. In conclusion of the previous supporting data, the authors would like to extend a systematic approach for use of Finite Element Analysis for consideration to design the structural bite configuration based upon evaluating the maximum stresses determined by Finite Element Analysis.
The process of achieving alternative methods of design should be defined in the following process:
1. Establish an accurate FEA model,
2. Develop an FEA model of a structural joint designed by the conventional formula and design stress,
3. Develop an optimized FEA model for the alternative joint design and sealant design strength,
4. Compare conventional joint model and alternative model to determine that distribution of maximum stress has been reduced via alternative design,
5. Validate alternative joint design with actual performance mock-up curtain wall units.
9.1Establishment of an accurate FEA model
Finite Element Analysis models are generated by complex computing software that requires two main things. First and foremost is the proper selection of a material model that accurately predicts the behaviour of a material over the range of expected performance. Two is an accurate data set that has been tested by conventional test methods recognized by the modelling software to accurately predict real world performance of the material.
Tensile adhesion joints tested to ASTM C1135 Standard Test Method for Determining Tensile Adhesion Properties of Structural Sealants have become a standard bearing test method to understand the stress/strain relationship of structural sealants in a prototypical joint geometry of structurally glazed curtain wall units. Figure 2 is a typical configuration of a Tensile Adhesion Joint that illustrates a conventionally designed joint where a 1524 mm (5’) by 2438 mm (8’) curtain wall glazing unit would be designed to accommodate 2.3 kPa (48 psf) wind load.
Given the proven history of the conventional structural design methods with correlation to predicted material performance of a tensile adhesion joint, one should be convinced that the selection of the proper model for predicting material behaviour would be predictive of the performance of the tensile adhesion joint. It is of the authors’ opinion that the data development based on actual test specimens should be a result of the independent testing laboratory that is proficient in test suited for characterizing information used in finite element modelling.
Next in the process for alternative design would be to predict the distribution of forces in a conventional joint design at maximum loads. Of importance is to understand the peak forces generated in a stressed joint to design load to illustrate the potential for higher stress points within the structure of the joint that could indicate performance requirements near or approaching the limits of the material behaviour (including the notion that the reducing of the overall distribution of stress within an appropriate safety factor of the material performance could improve the durability performance of the sealant over time).
Using the FEA modelling software, the next step would be to determine the optimal joint geometry to predict and overall lower cumulative and stress distribution within the sealant joint to achieve desirable conditions for reduced aluminium or metal framing members for the curtain wall unit, as well as induce long term durability for performance expected by silicone structural glazing.
Comparison of both models should make physical sense with respect to the expected performance of the sealant including actual test results, reasonable expectation for forces generated within the different joints, and appropriate validation of the different joint geometries such as tensile adhesion joints tested according to ASTM C1135.
ASTM C1184 outlines the needed performance of a silicone sealant used in structural glazing applications. Of importance is a minimum tensile property of 350 kPa (50 psi) as tested by ASTM 1135 at different potential environmental conditions related to temperature and environmental exposure. Silicone sealants are well behaved over a wide range of expected temperatures, but potential differences exist within the performance expectations of the sealant.
Understanding the relative impact of environment to the sealant environment is a necessary requirement to understand the impact of using alternative methods of designing the joint geometry and design strength. In general, sealants have less elongation and higher tensile property in cold regions (−29C) and higher elongation and lower tensile property in hot regions (88C). Some sealant properties can change over time to include either softening or hardening.
This illustrates an important consideration in selection of the sealant used for alternative joint design. Structural sealants that marginally meet any requirement of ASTM C1184 via ASTM C1135 testing should not be considered as primary option relative to other choices. Sealants that meet each requirement with a relatively high degree of safety factor should be the primary choices for alternative design and sealant design strength. Additional testing of the actual joint geometry may be warranted to include the environmental conditions to ensure technically sound decisions.
The authors envision that as this alternative method for joint design with increased sealant design strength is adopted via finite element analysis, the need for proper mock-validation is needed as projects move through the design phase. Mock-up testing should be used to enable predictive comparison of the actual sealant behaviour and predicted behaviour model. When tested and predicted behaviours are compared and are within close proximity to each other, this ensures competency in a new design that has a deviation from the convention of the current standard that has proven 40 years of success.
The preceding discourse has been focused on the need to accurately and technically predict a sealant joint geometry that improves the stress distribution of the structural silicone sealant to ensure long term durability from a proven performance of structural silicone glazing in expected wind load events. Performance to onetime events such as bomb blast and impact applications still will need proper consideration from current practices of testing actual mock-ups for appropriate building codes and industry accepted test methodologies.
References
1 | Broker, K. A., Fisher, S., & Memari, A. M. (2012). Seismic racking test evaluation of silicone used in a four-sided structural sealant glazed curtain wall system, Journal of ASTM International, 9(3), Paper ID JAI104144. Available online at www.astm.org |
2 | Carbary, L. D. (2007). A Review of the Durability and of Performance Silicone Structural Glazing Systems, Conference proceedings of Glass Performance Days 2007, http://www.glassfiles.com/library/article.php?id=1083&search=carbary&page=1 (viewed April 23, 2012) |
3 | Hagl, A. (2008). Durability by design: New results on load carrying silicone bonding. Third symposium on durability of building and construction sealants and adhesives, Denver CO, June 25-26, Journal of ASTM International, 9(2), Paper ID JAI101956. Available online at www.astm.org |
4 | Haugsby MH, Schoenherr WJ, Carbary LD, Schmidt CM(1989) Methods for Calculating Structural Silicone Joint Dimensions, Science and Technology of Glazing Systems, ASTM STP10544657Philadelphia, PA:American Society for Testing and Materials |
5 | Hilliard JR, Parise CJ, Peterson COJr(1977) Structural Sealant Glazing, Sealant Technology in Glazing Systems, ASTM STP 638West Conshohocken, PAASTM International6799 |
6 | Travis HS, Carbary LD(1998) Finite Element Analysis of a Structural Silicone Shear Bead used in Skylight ApplicationsScience and Technology of Building Seals, Sealants, Glazing and Waterproofing: Seventh Volume, ASTM STP 1334.Klosowski Jerome MPhiladelphia, PAAmerican Society of Testing and Materials |
7 | Yarosh, K. F., Wolf, A. T., & Sitte, S. (2008). Evaluation of silicone sealants at high movement rates relevant to bomb mitigating window and curtainwall design, Journal of ASTM International, 6(2), Paper ID JAI101953, Available online at www.astm.org |
8 | Zhargamee, M. S., Schwartz, T. A., & Gladstone, M. (1996). Seismic Behavior of Structural Silicone Glazing. Science and Technology of Building Seals, Sealants, Glazing, and Waterproofing, Sixth Volume, ASTM STP 1286, ASTM, pp. 46-59. |
Figures and Tables
Fig.1
Load vs. Deflection in ASTM C1135 tension tests.
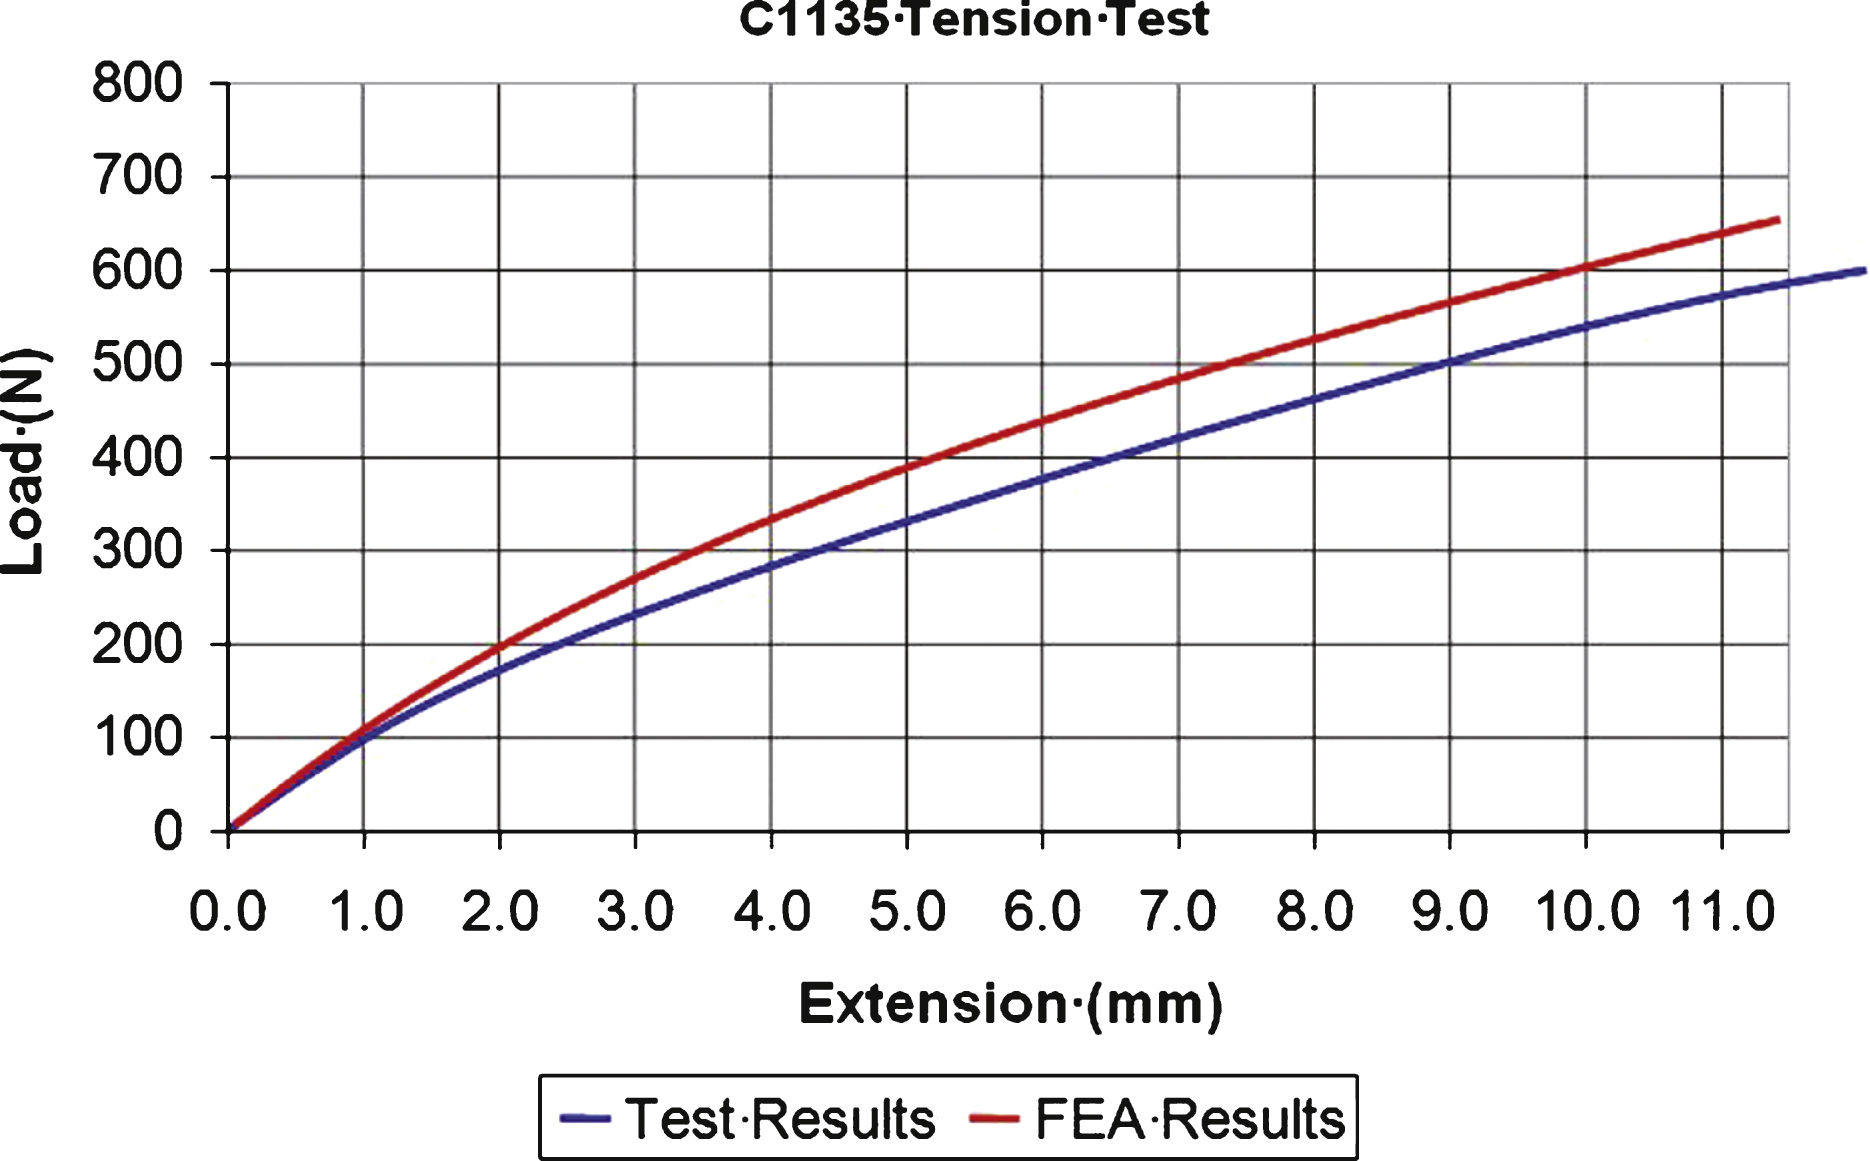
Fig.2
Stress distribution at 100% of allowable nominal silicone stress.
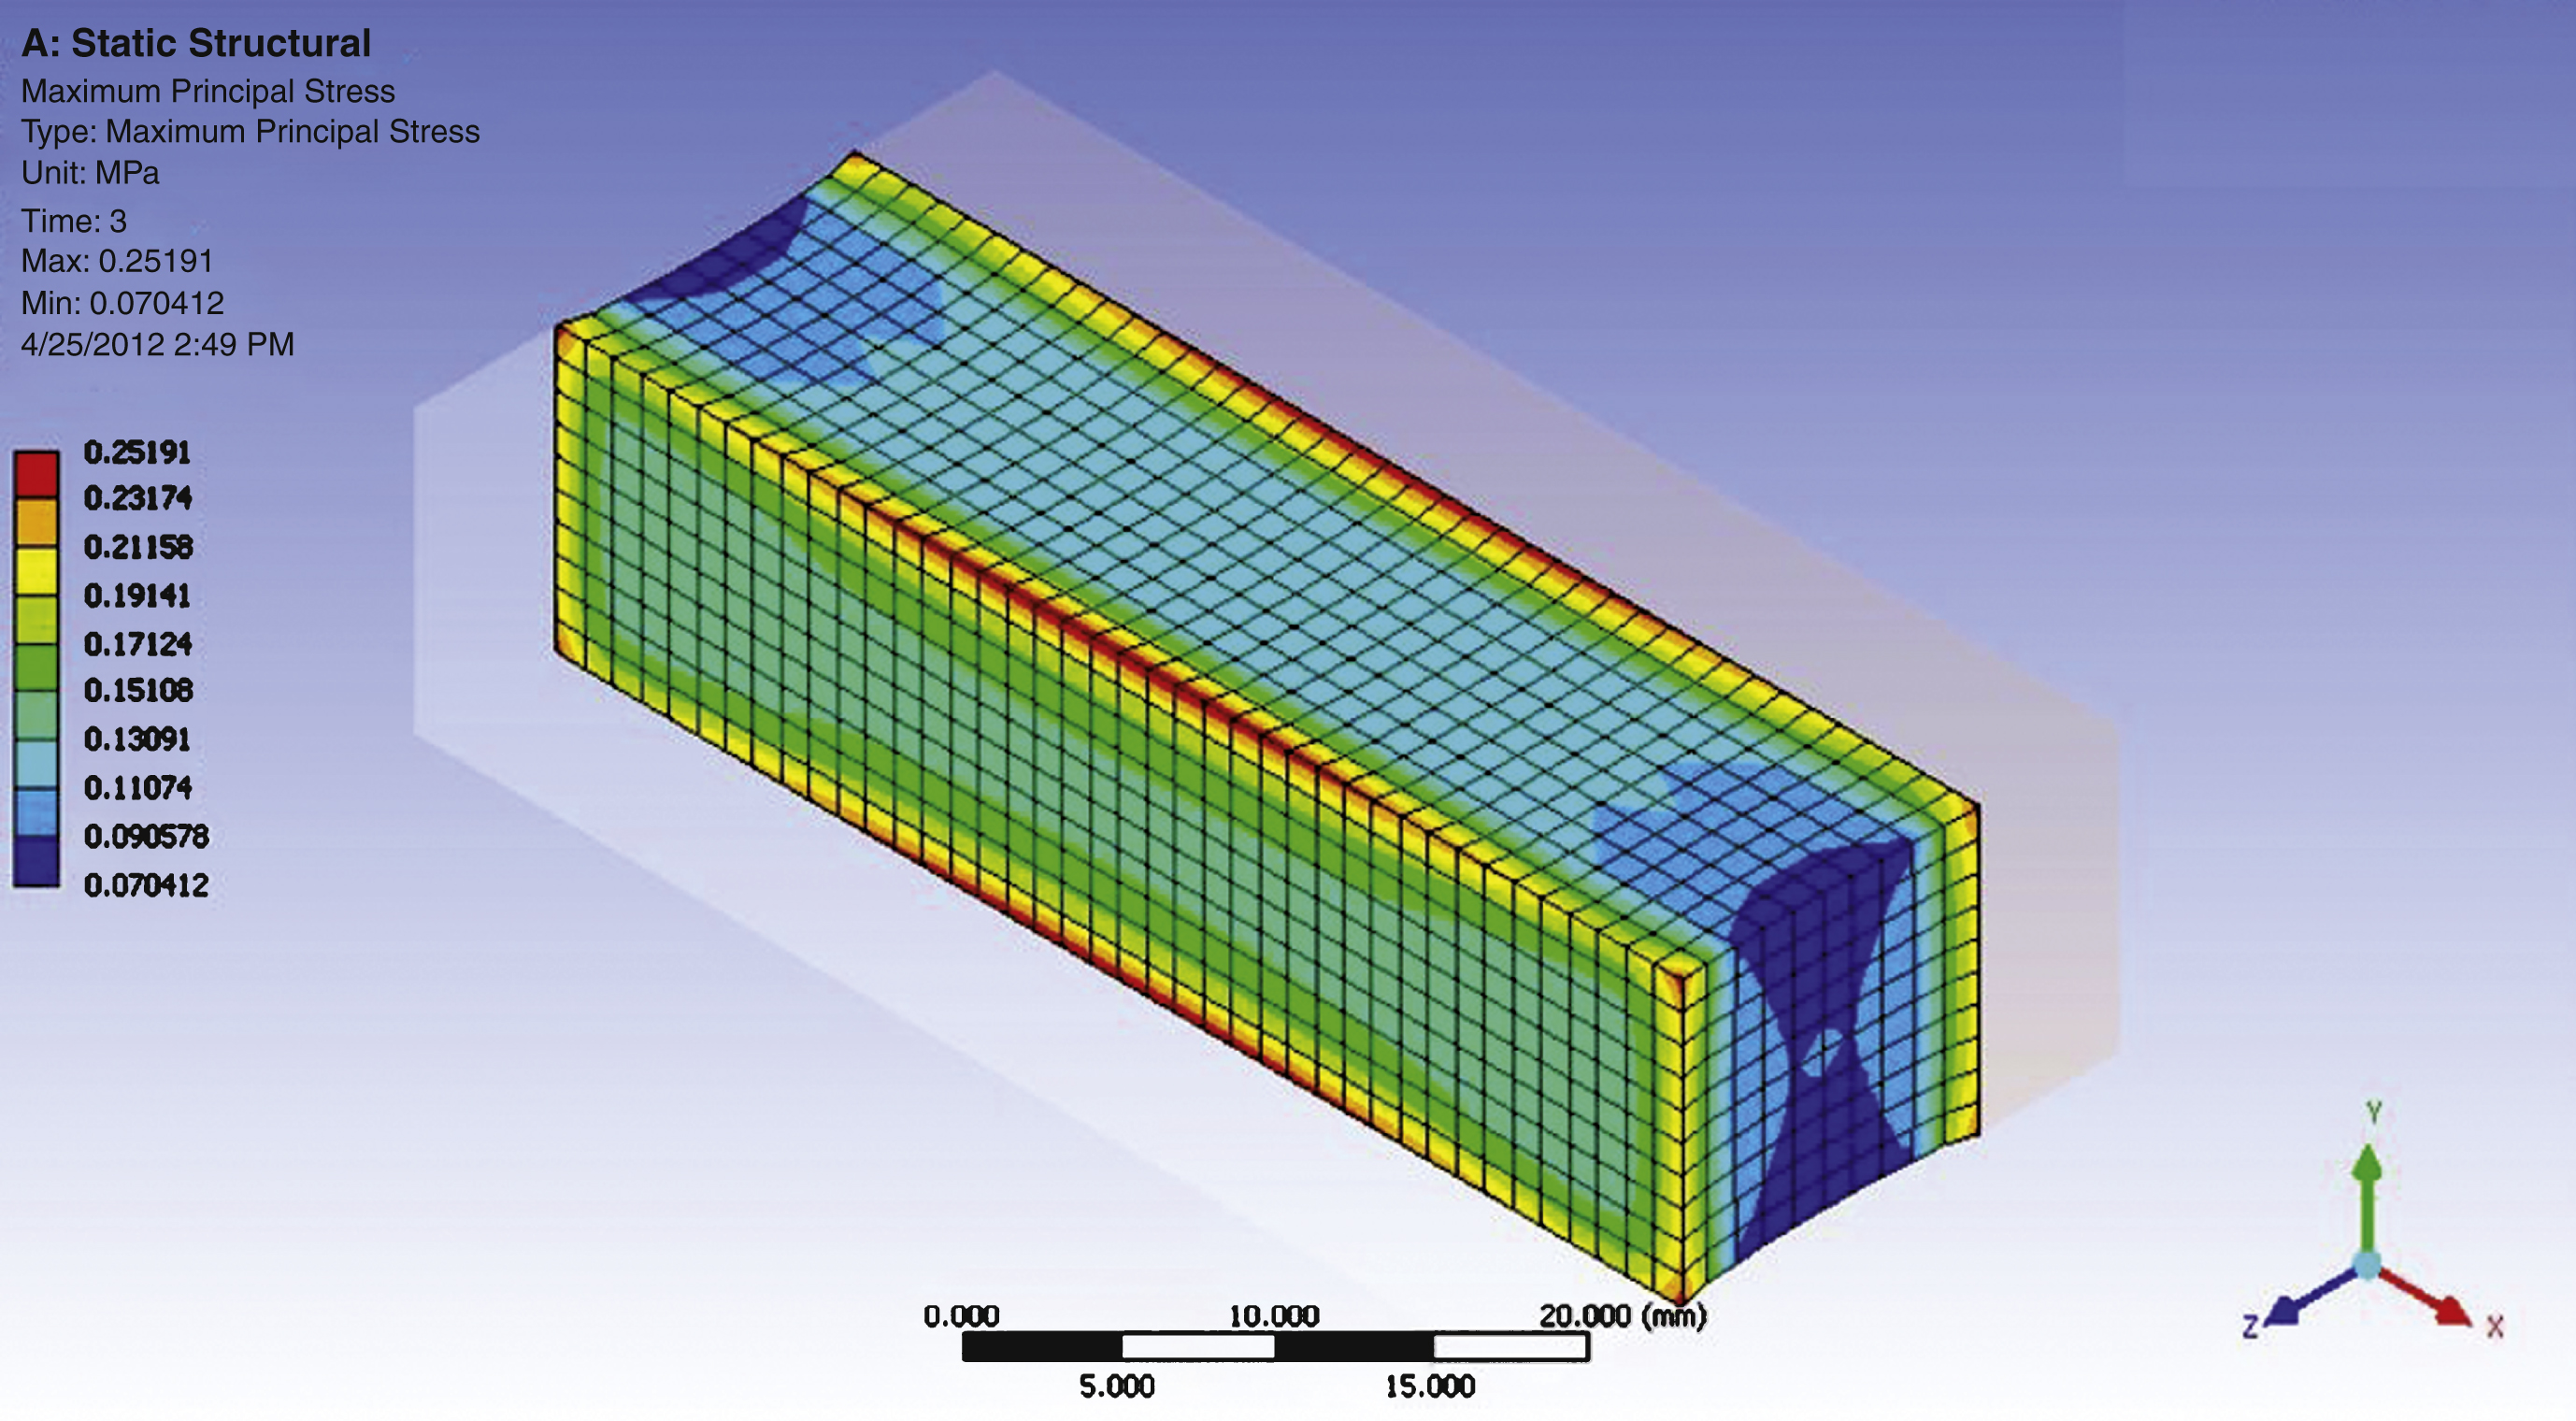
Fig.3
Stress distribution at 200% of allowable nominal silicone stress.
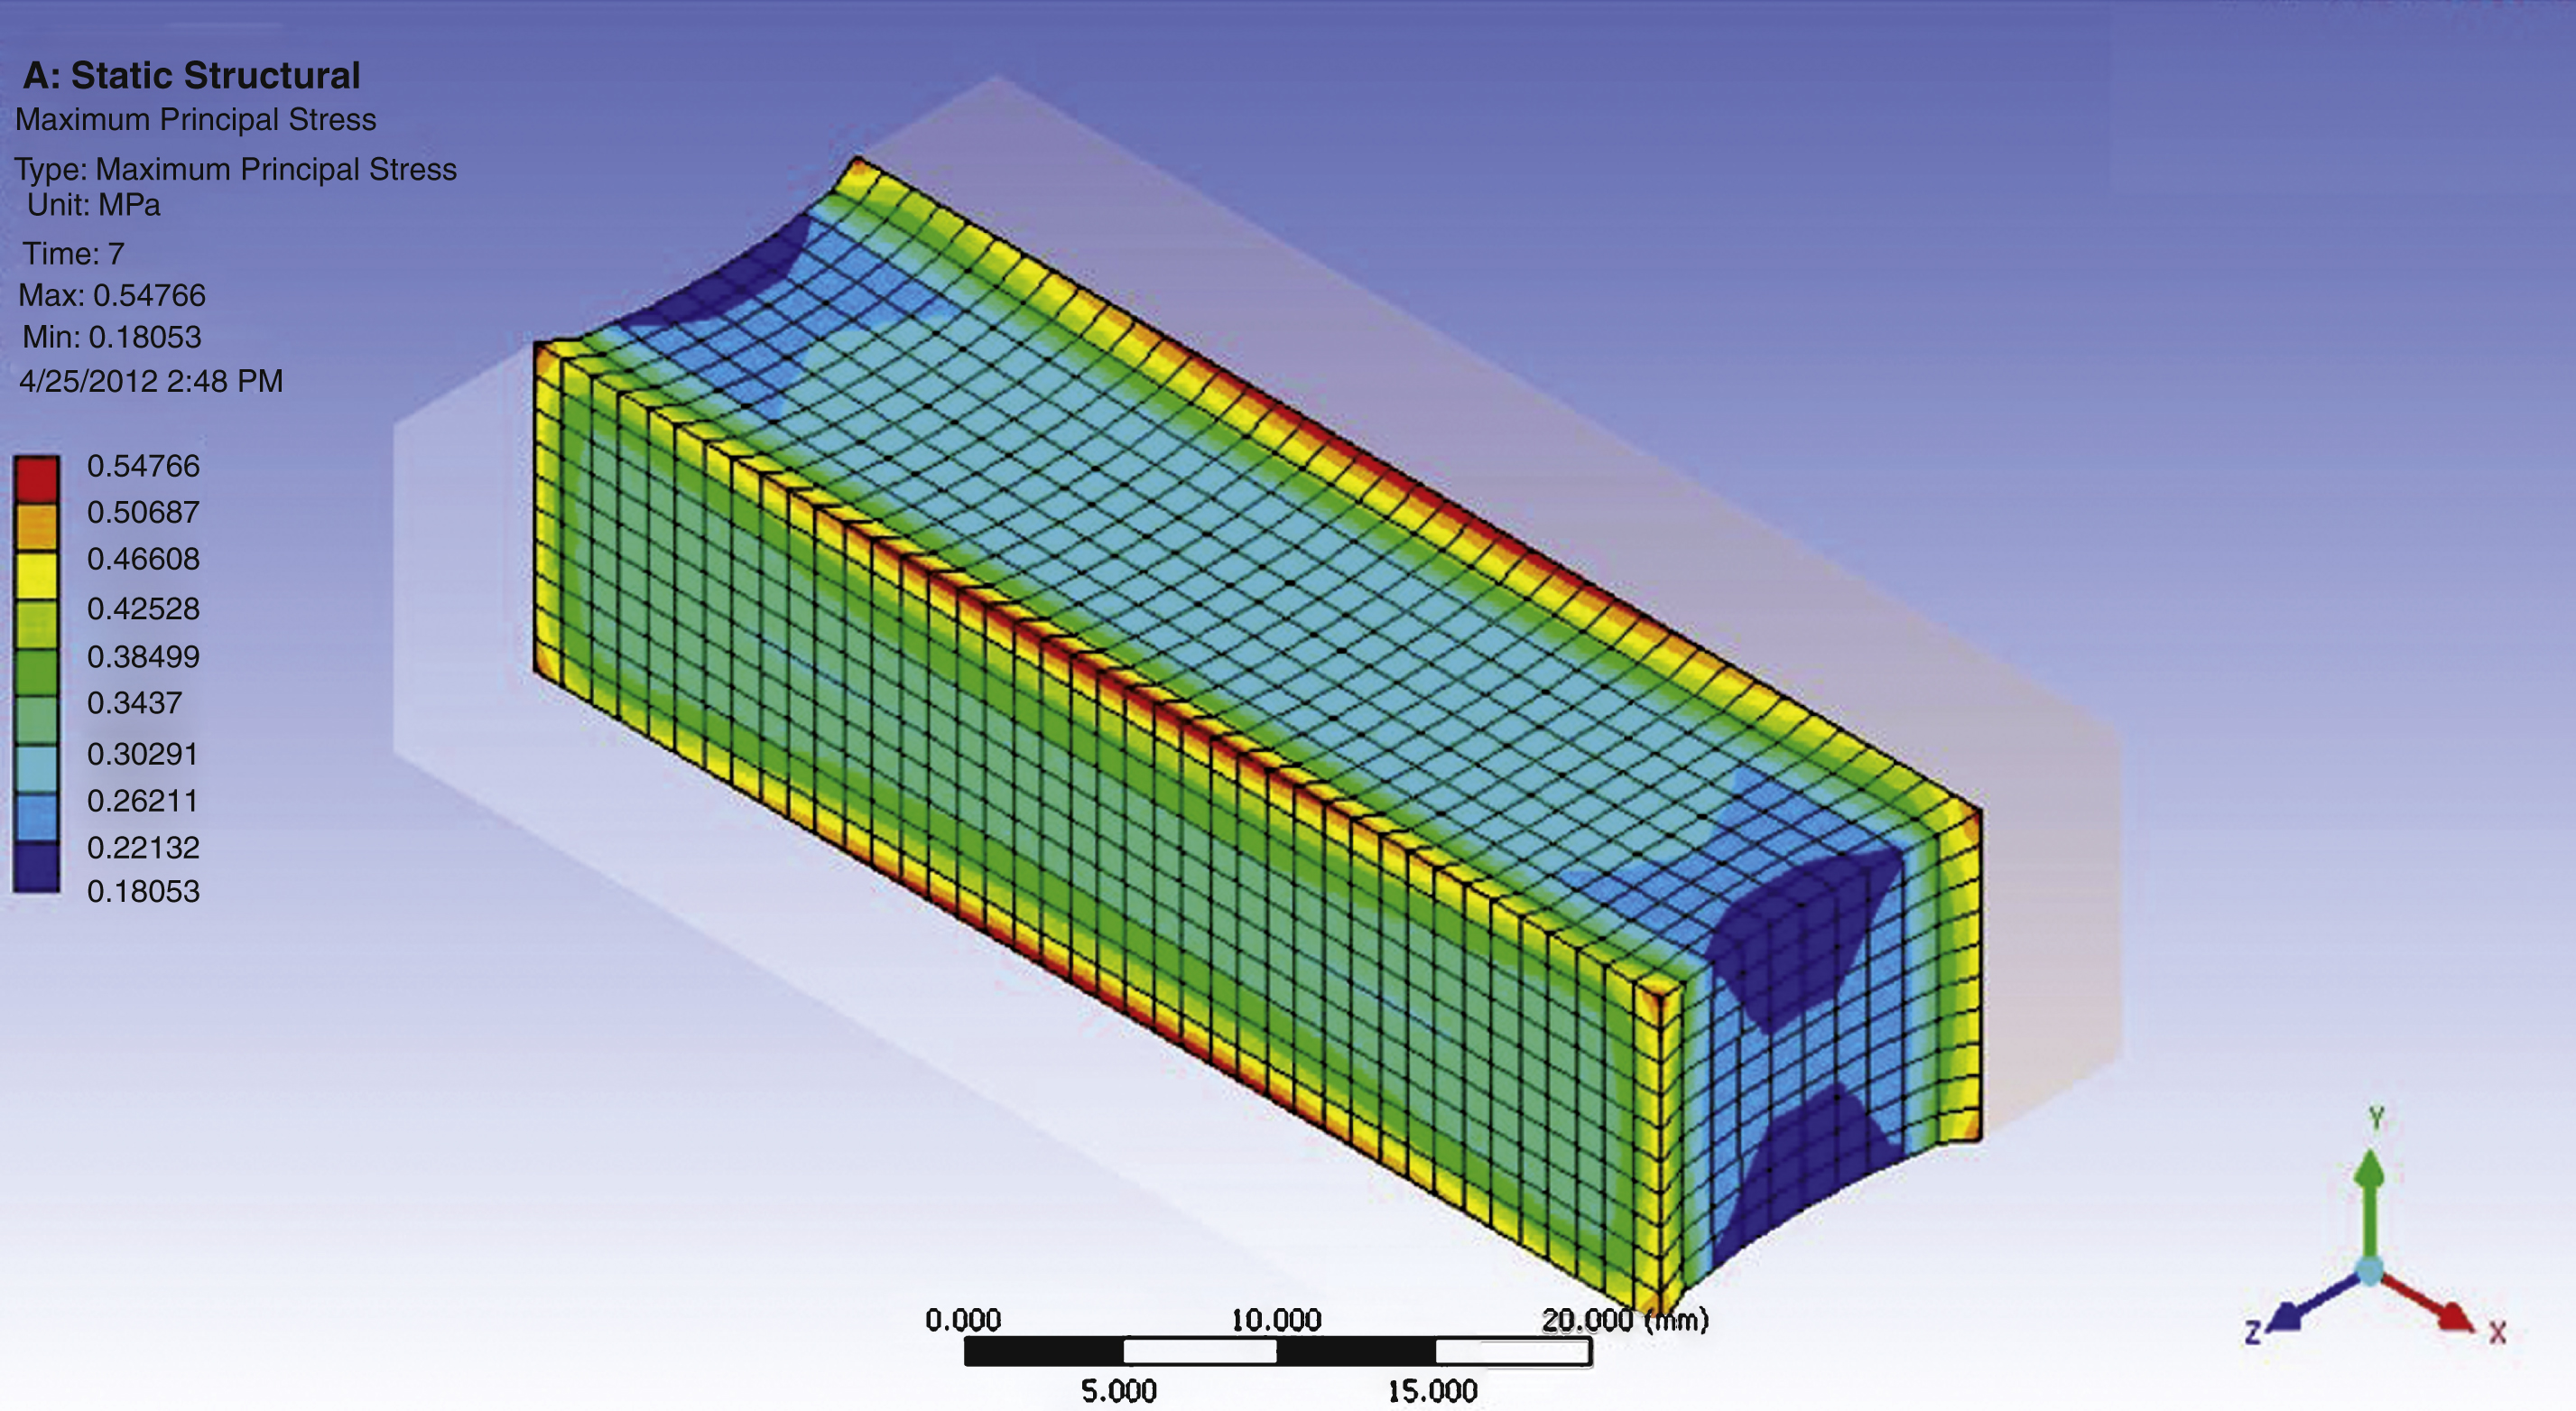
Fig.4
Schematic of glass rotation for traditional and trapezoidal silicone joints.
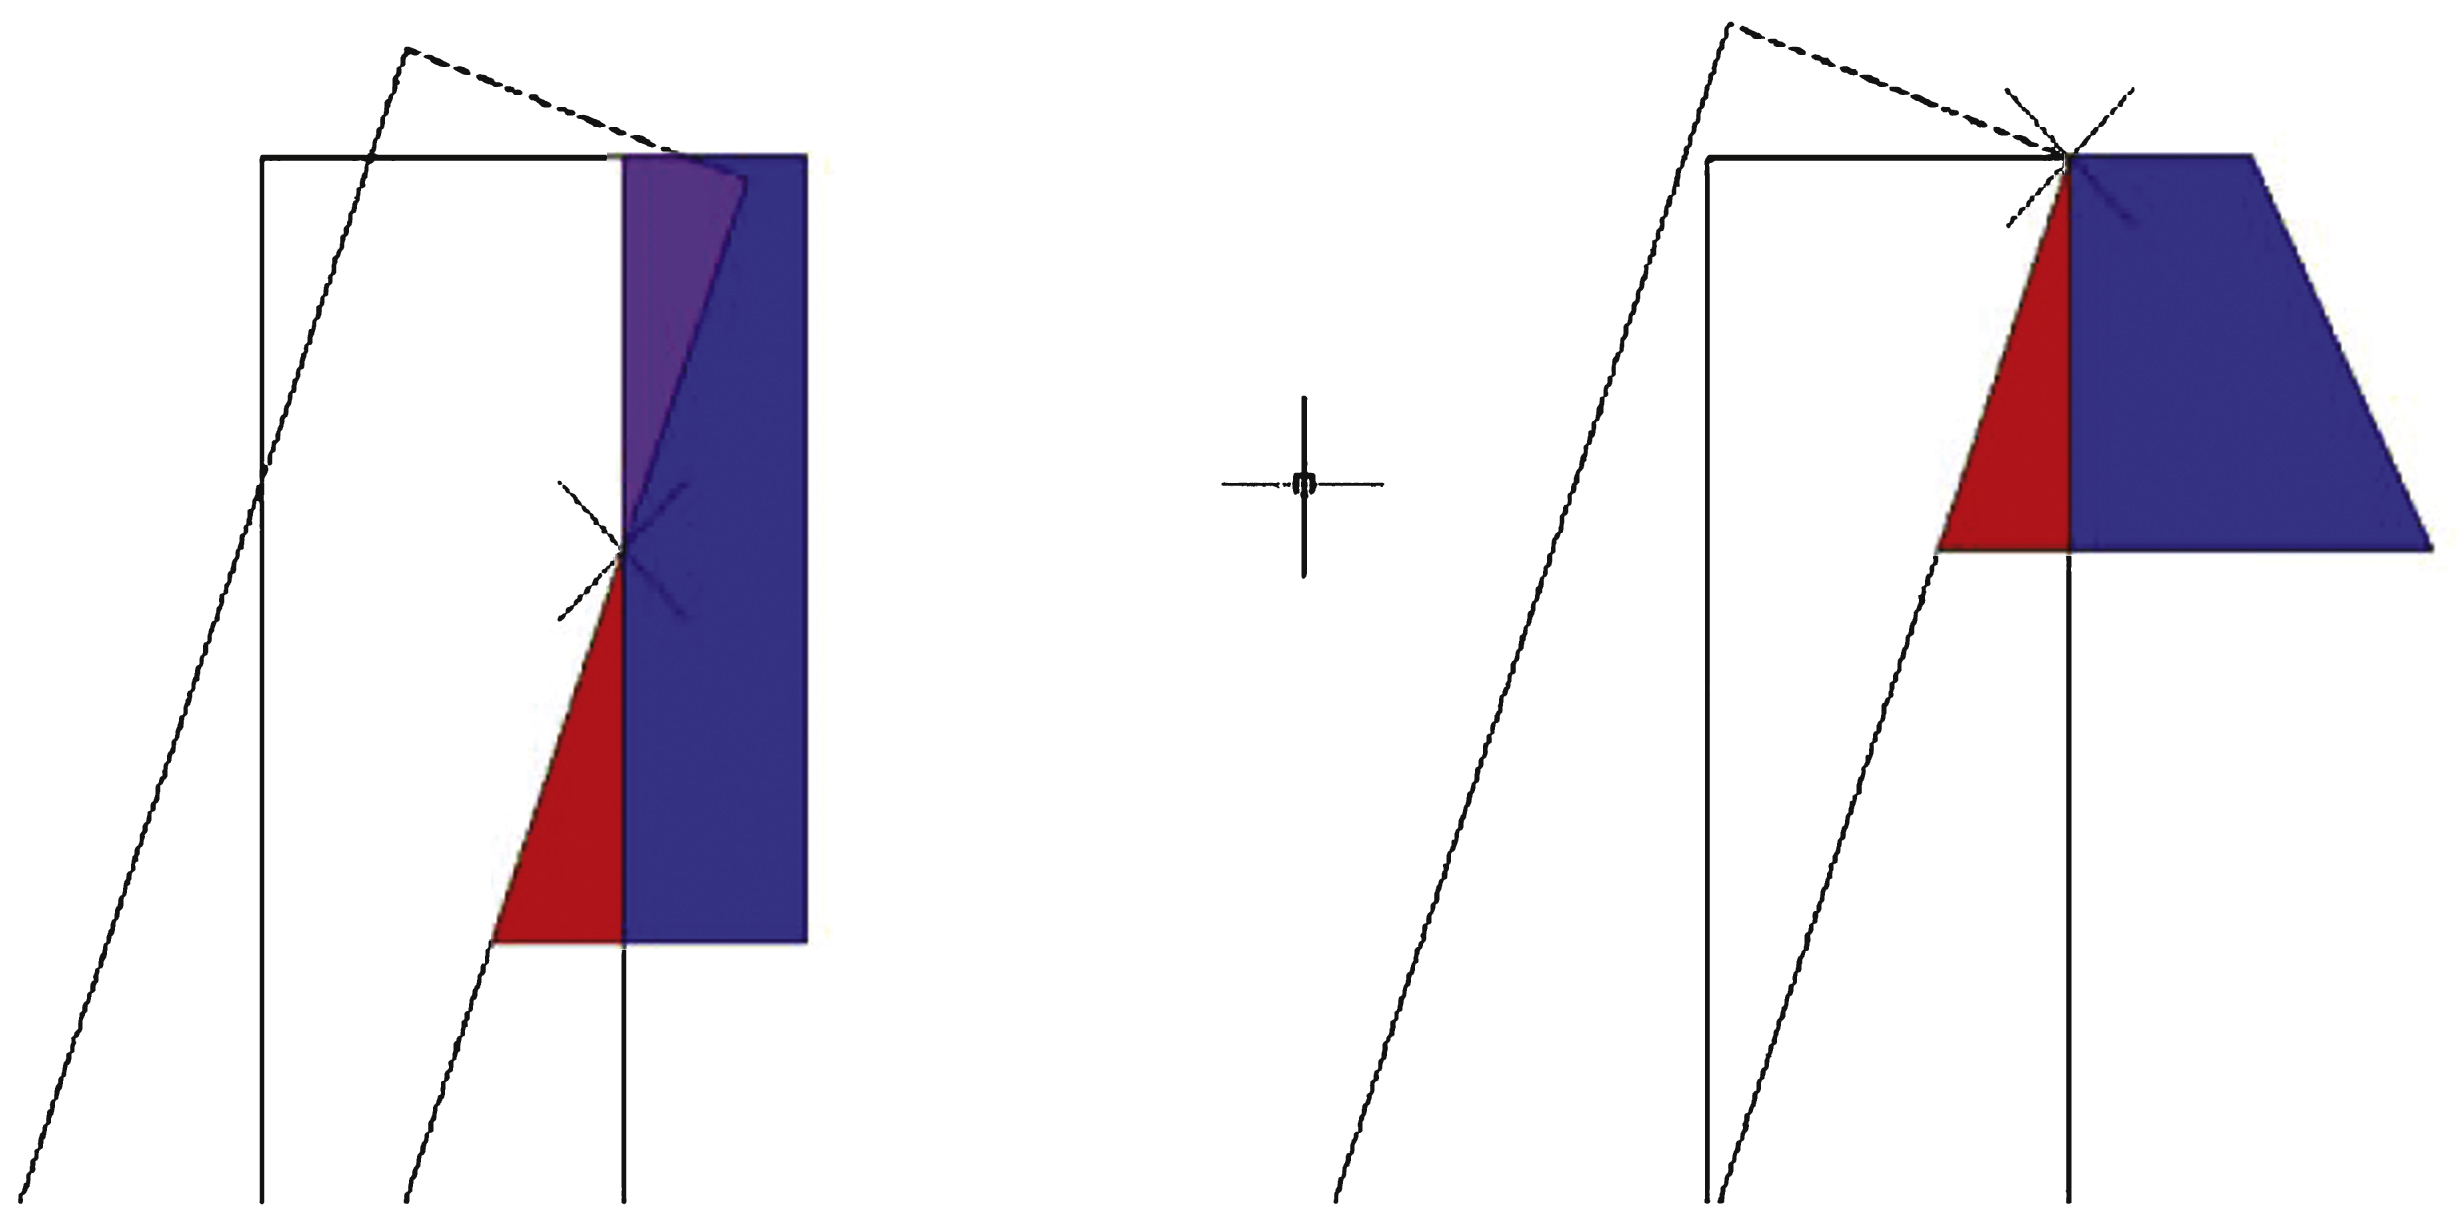
Fig.5
Stress at short dimension midspan of trapezoidal joint.
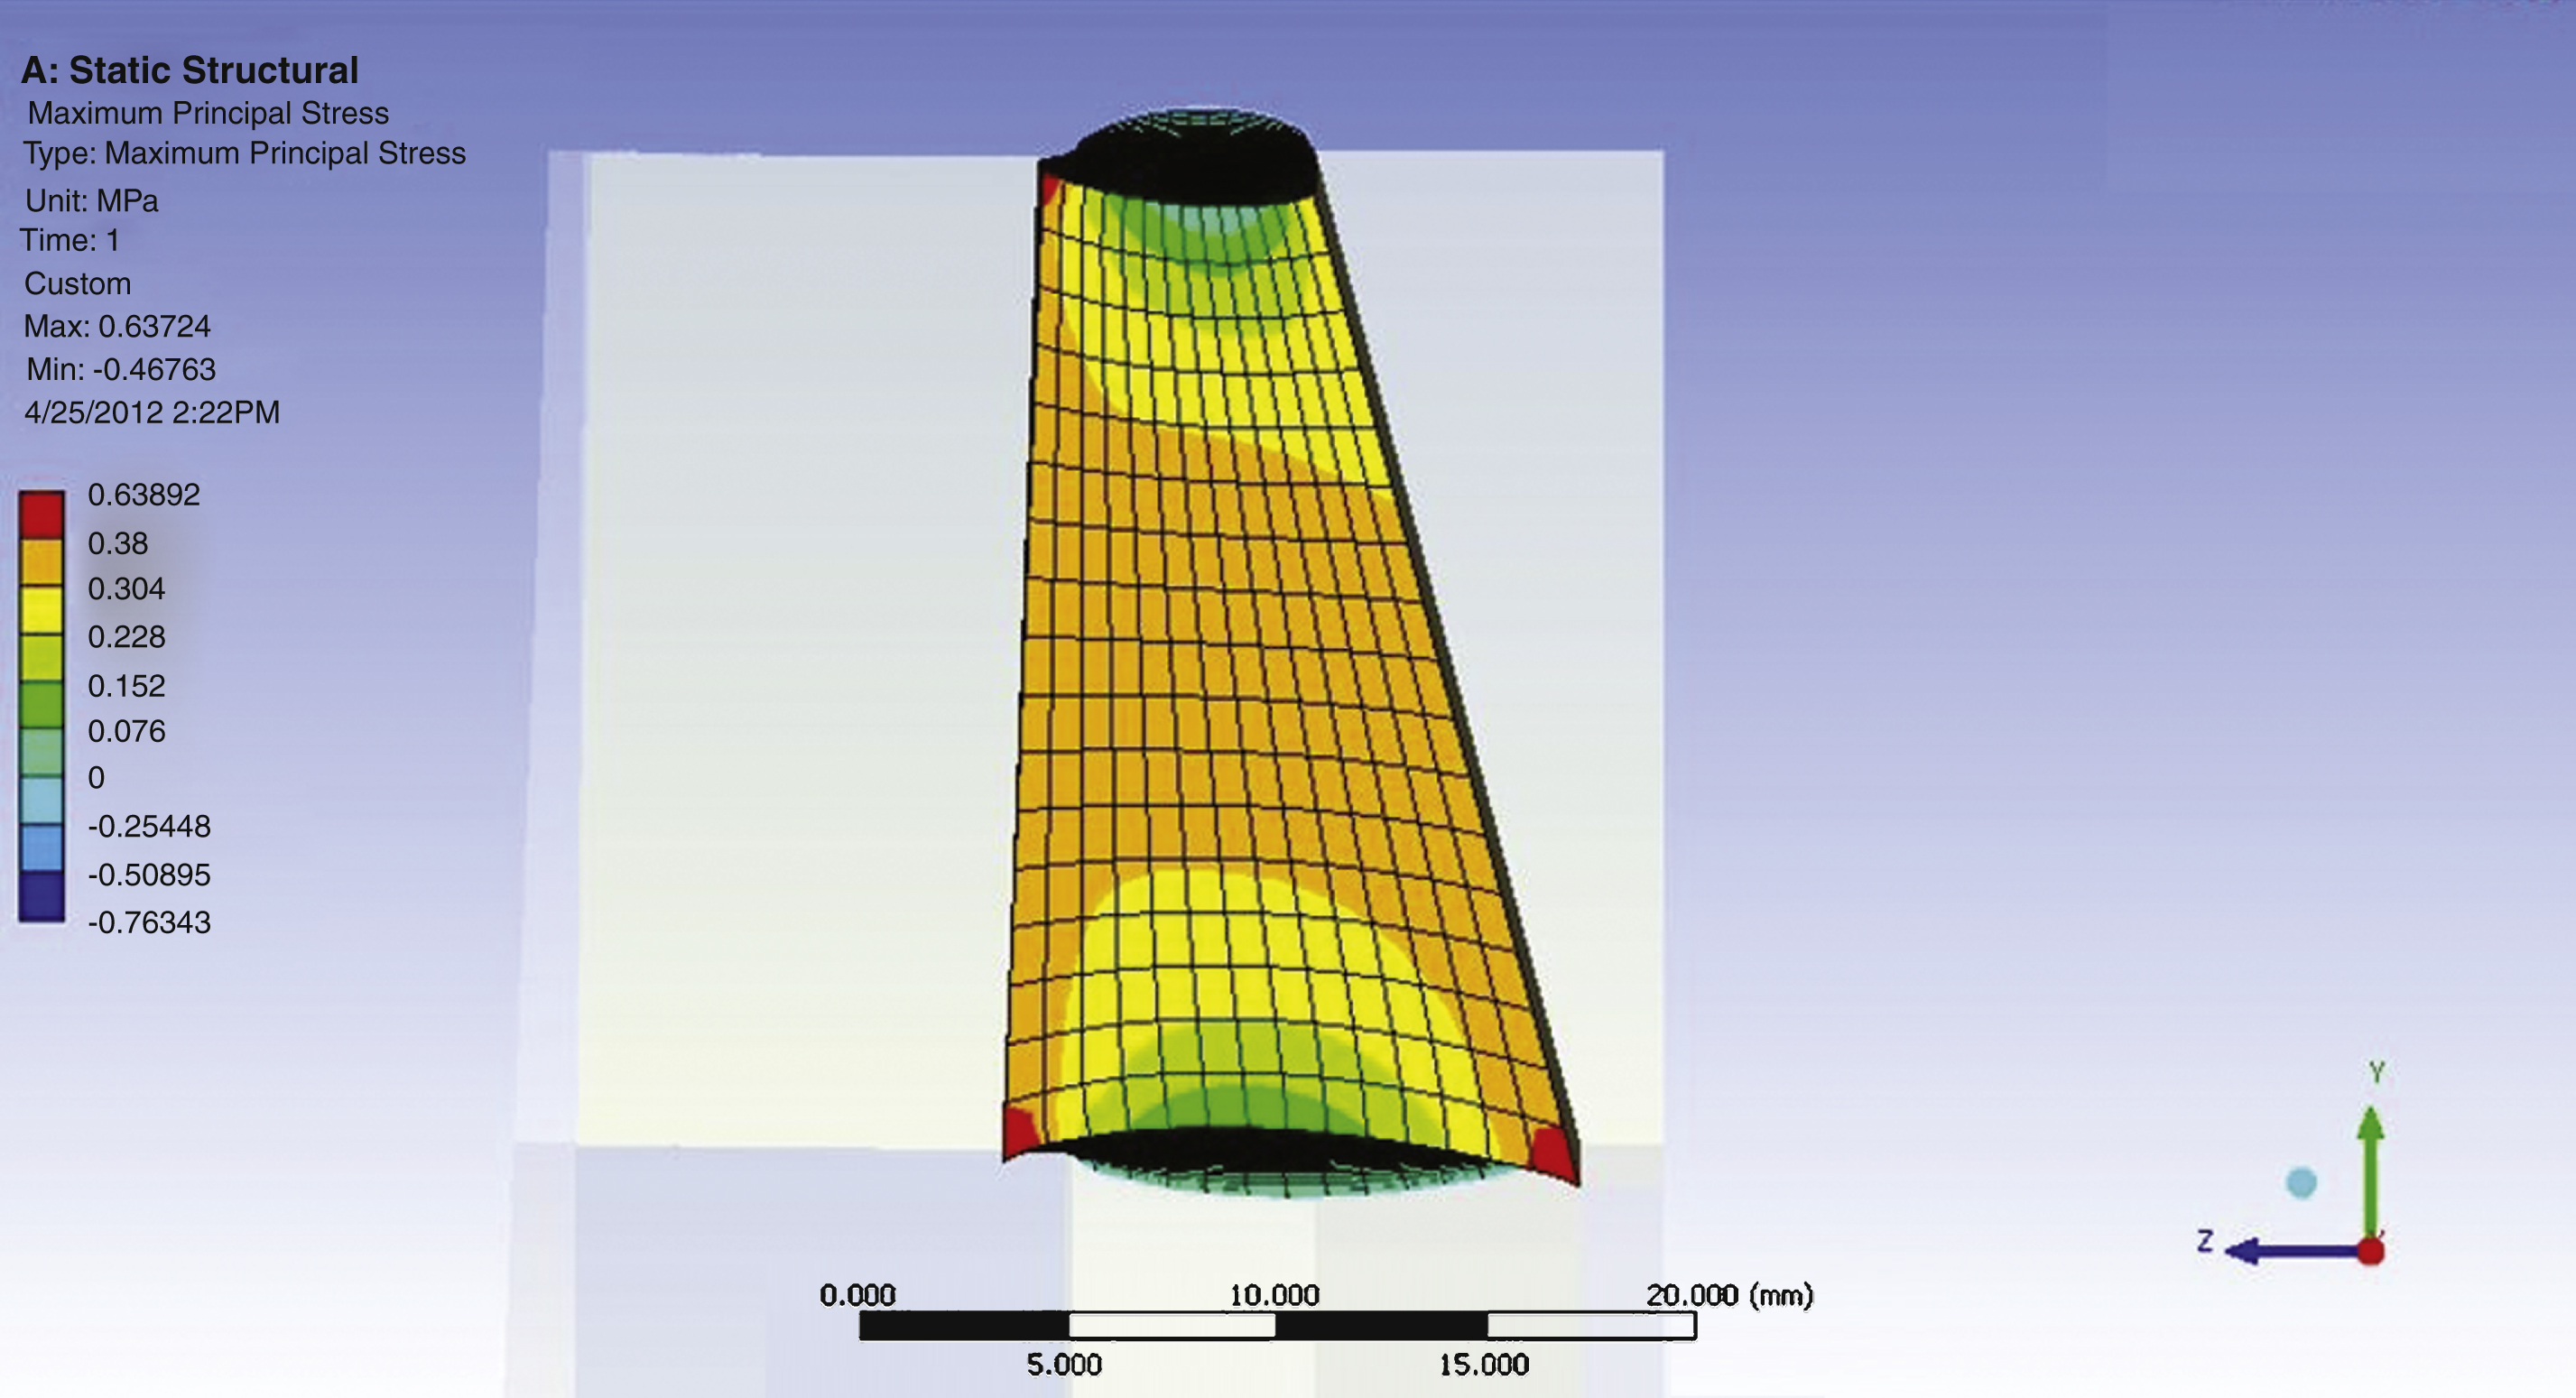
Fig.6
Stress at long dimension midspan of trapezoidal joint.
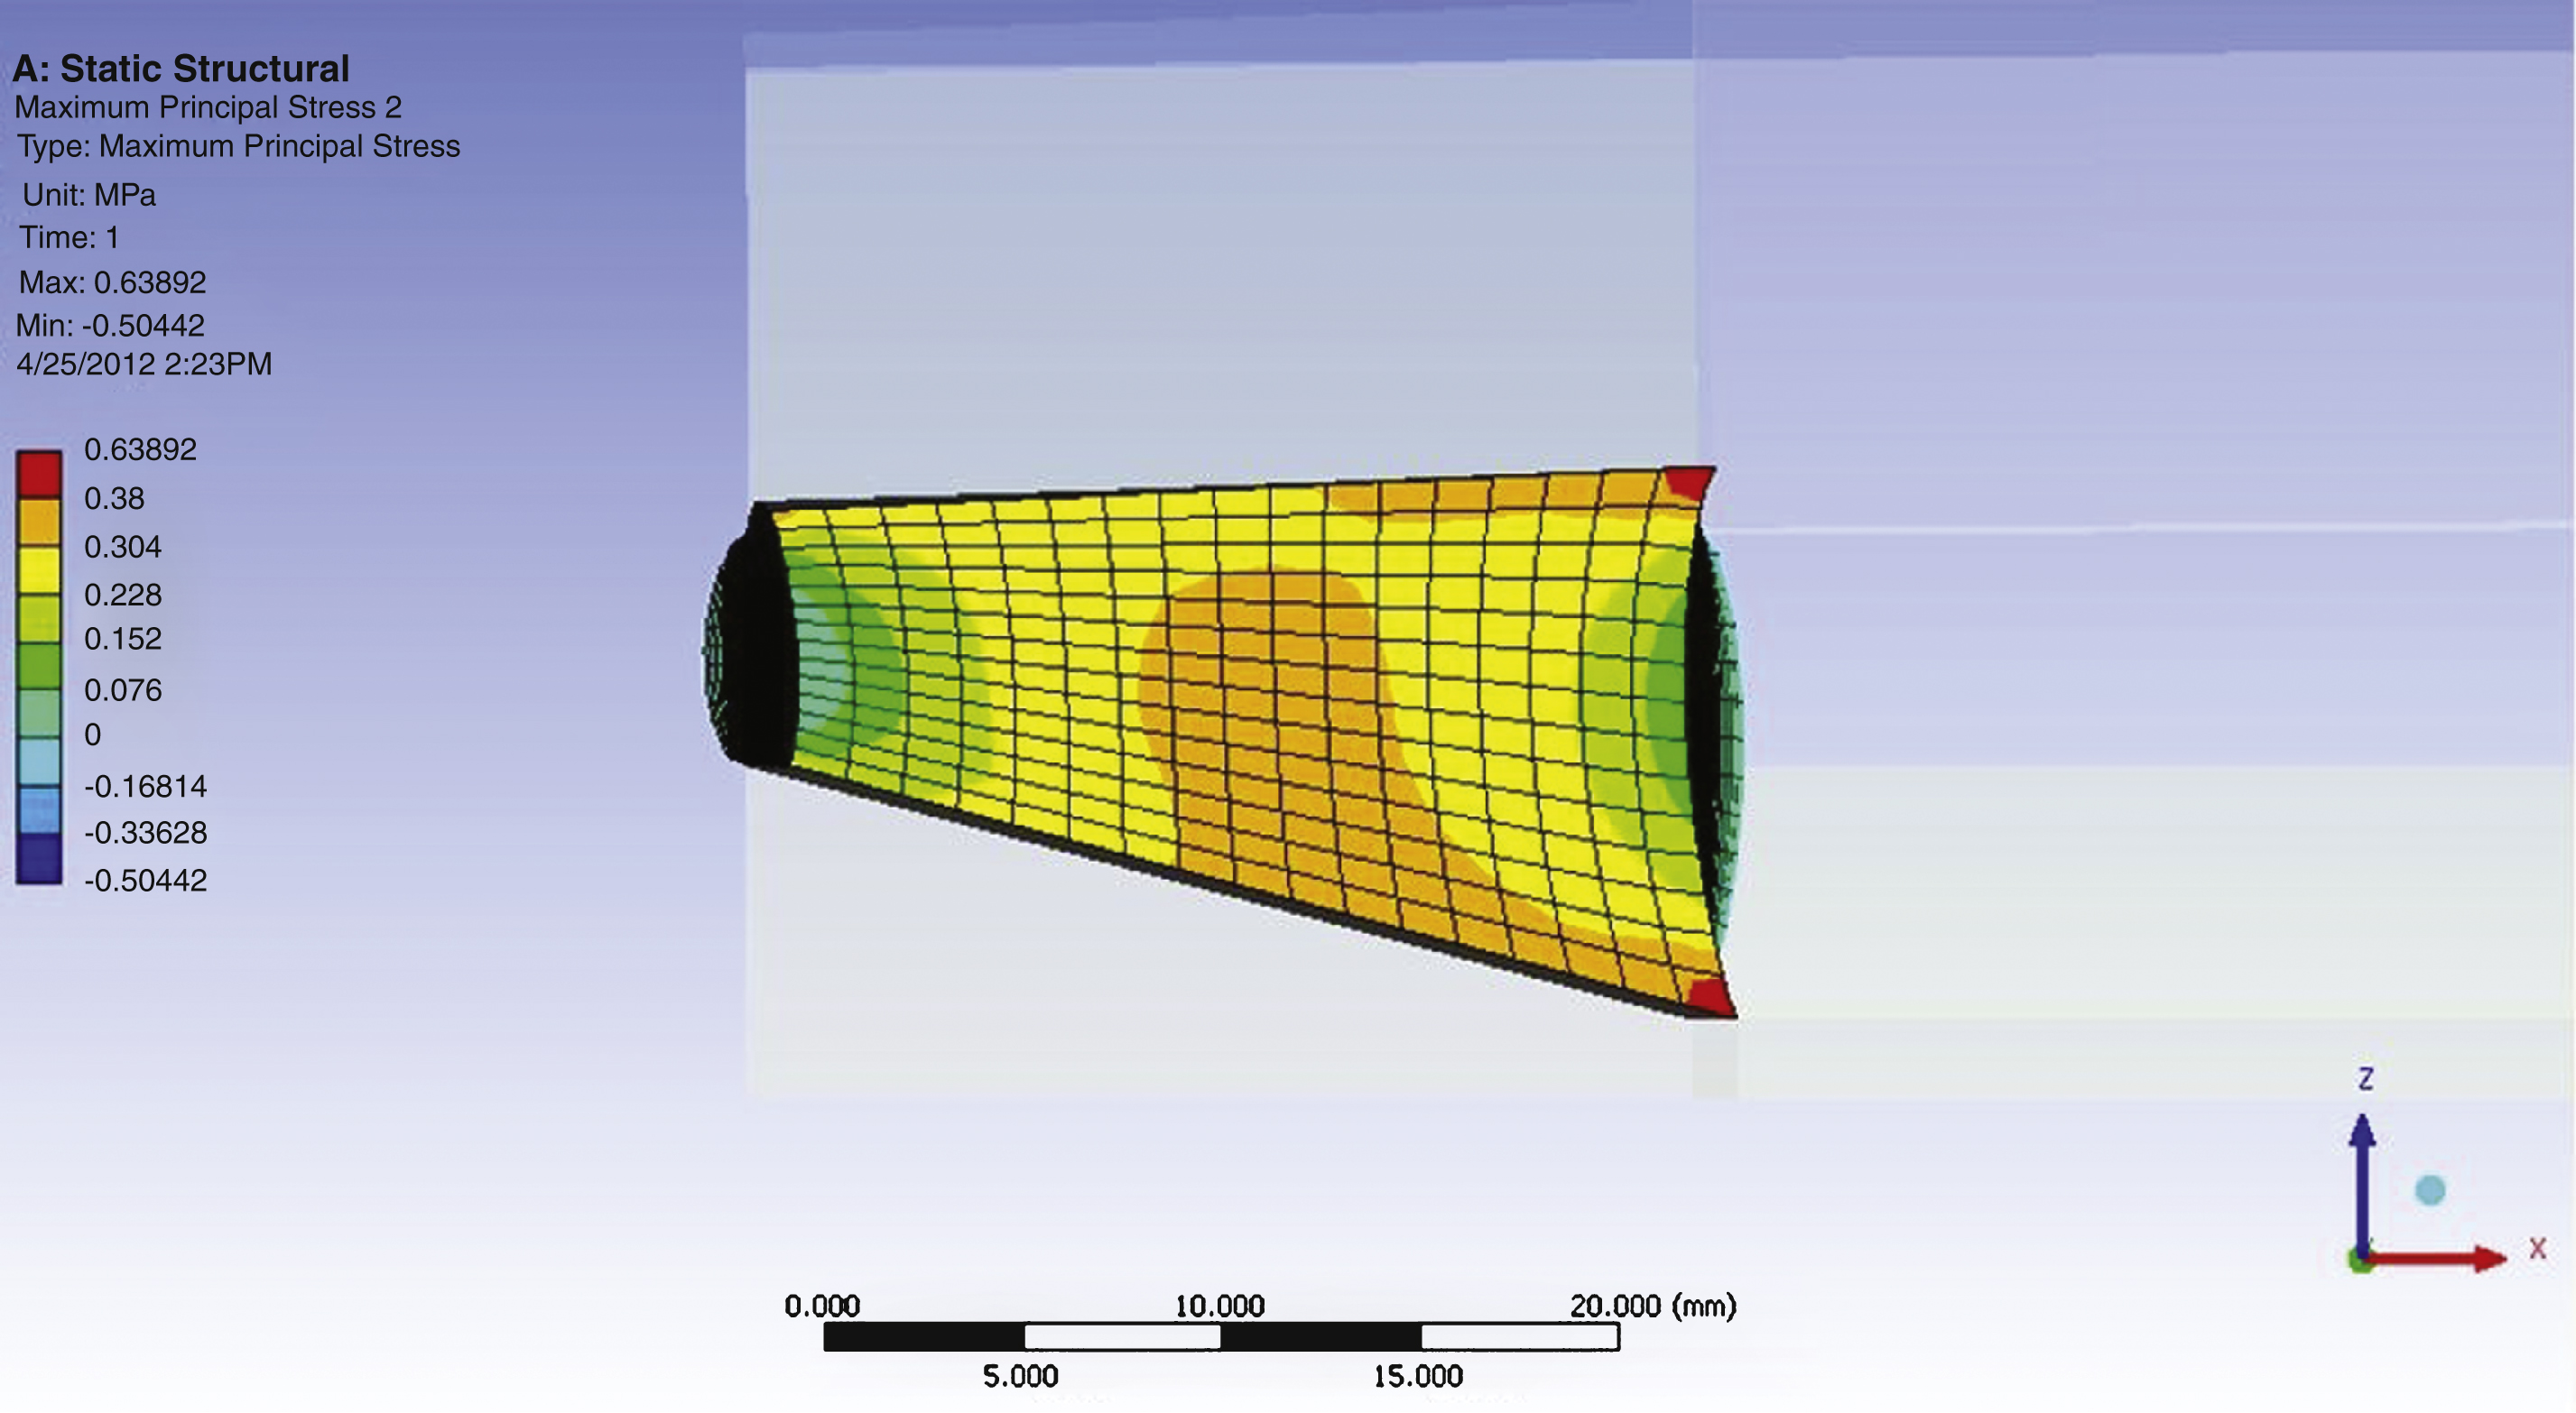
Fig.7
Test results with similar peak edge stresses to trapezoidal joint.
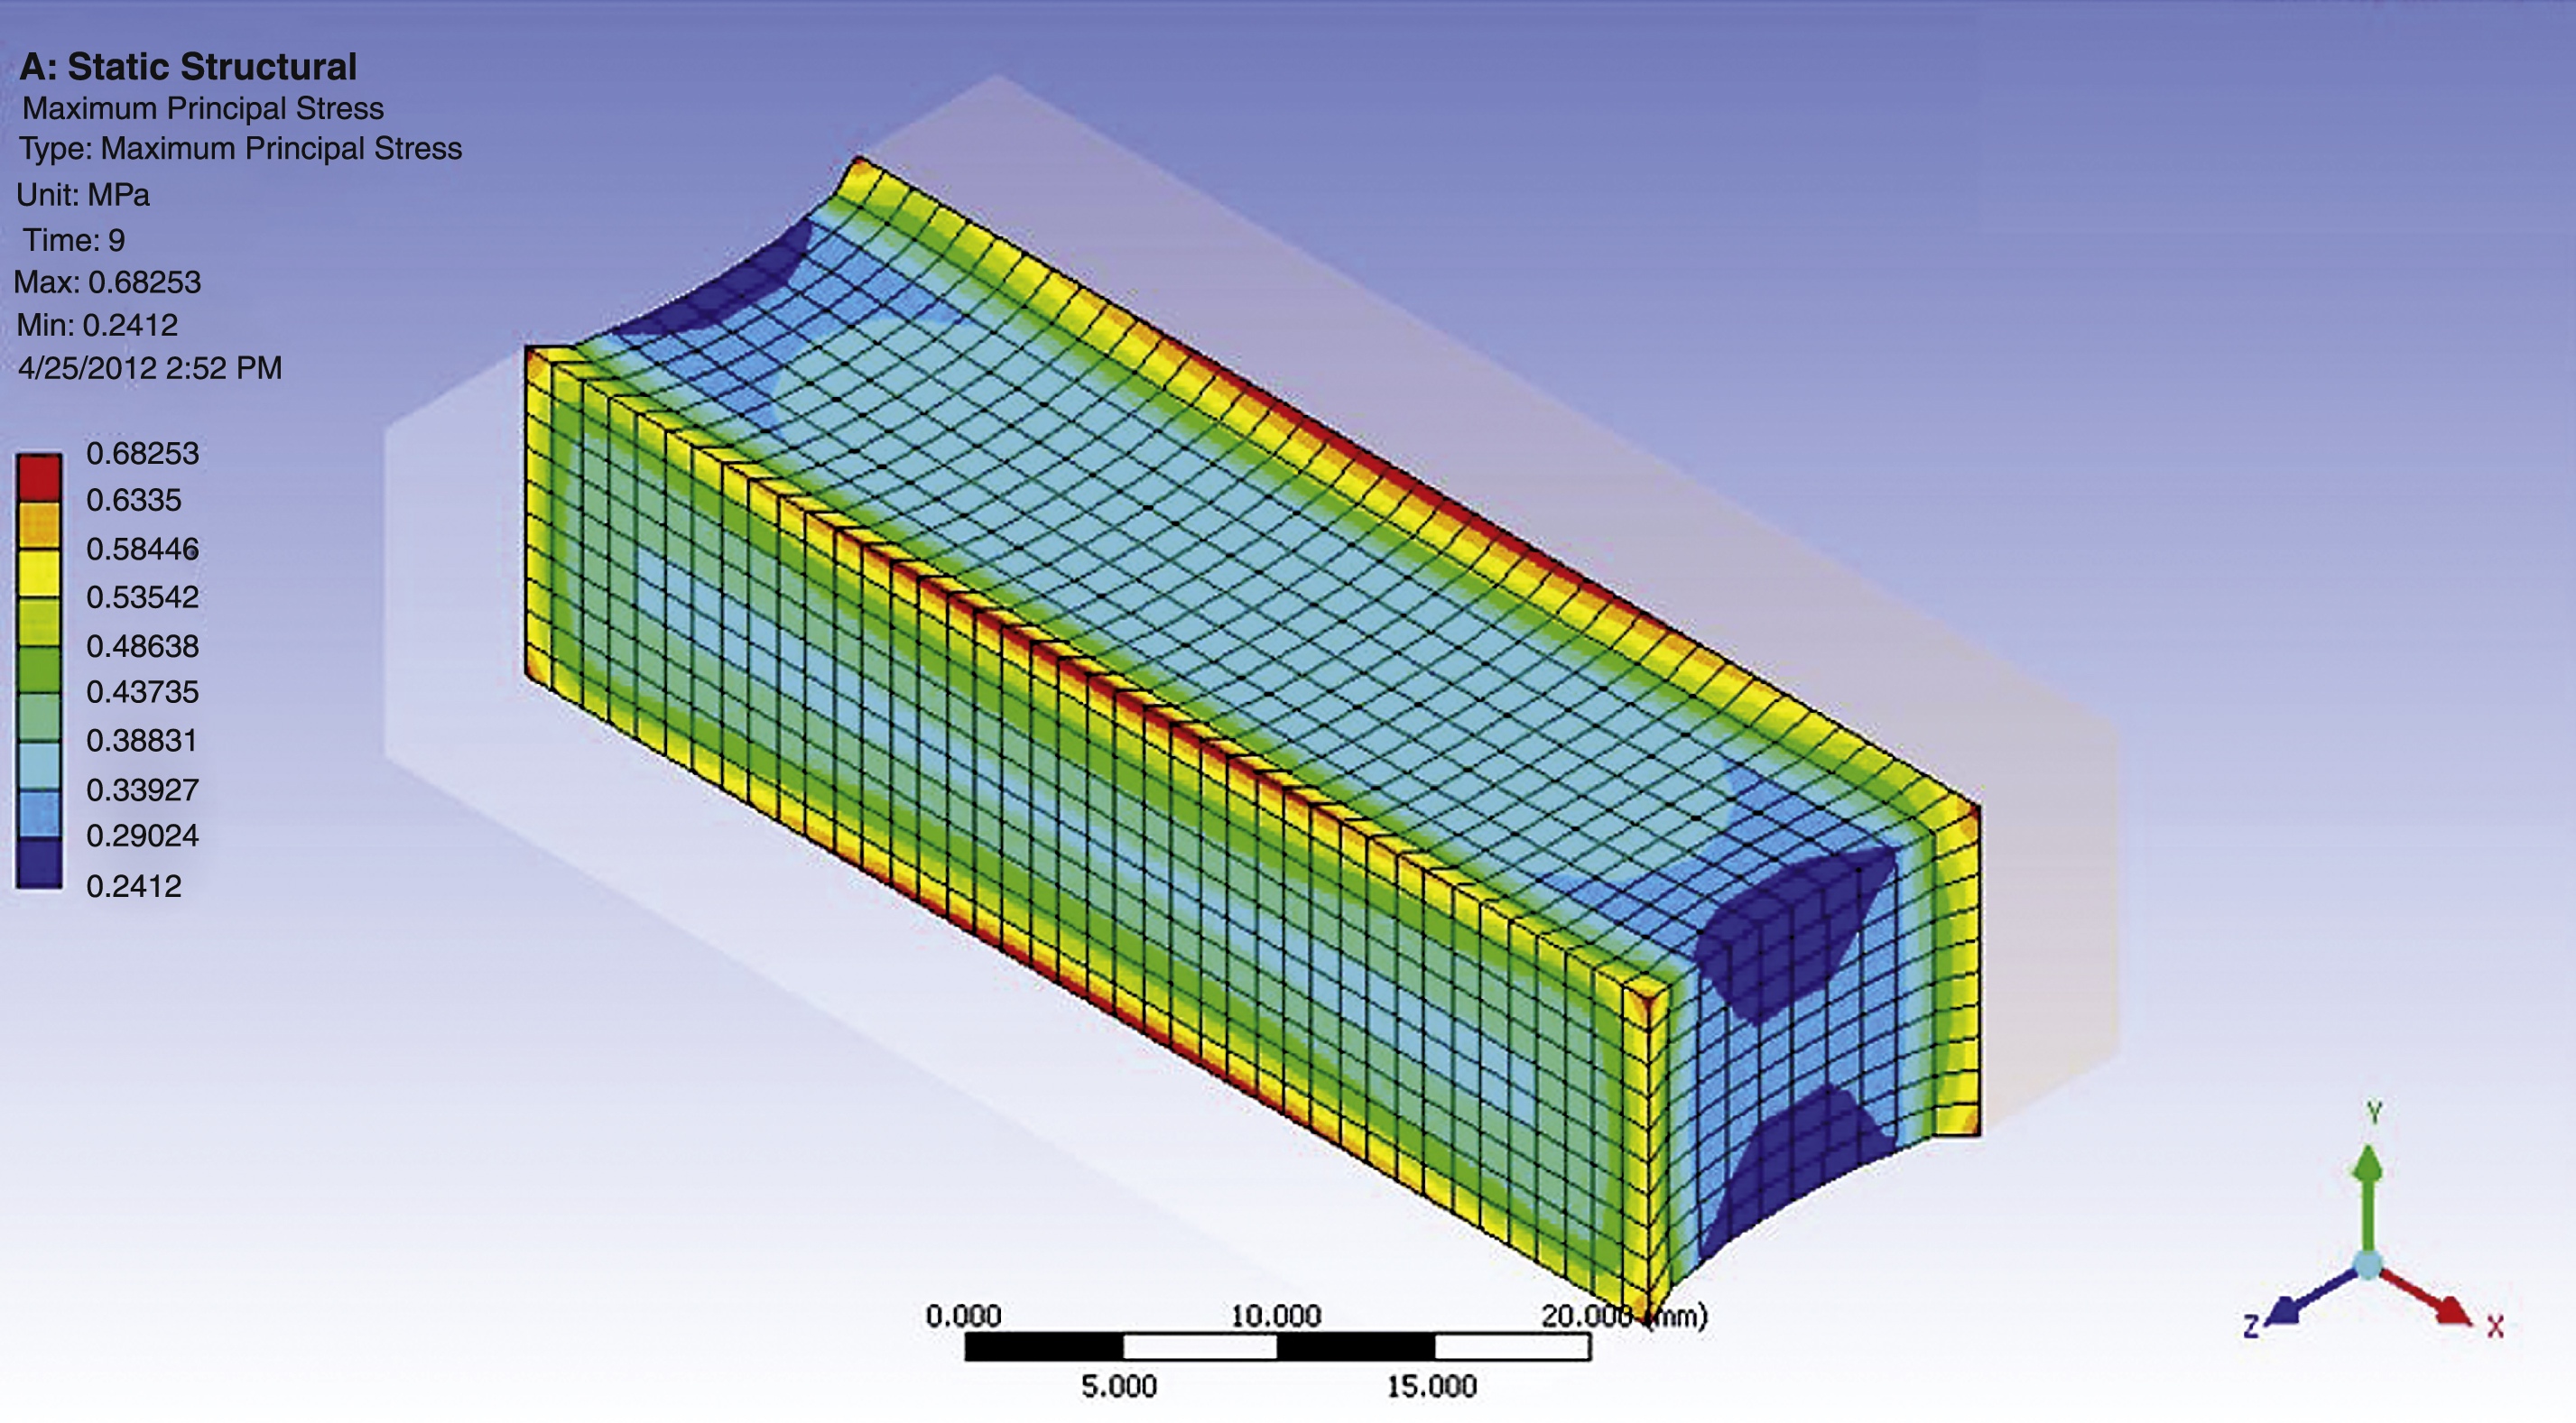
Fig.8
Stress at short dimension midspan of traditional joint.
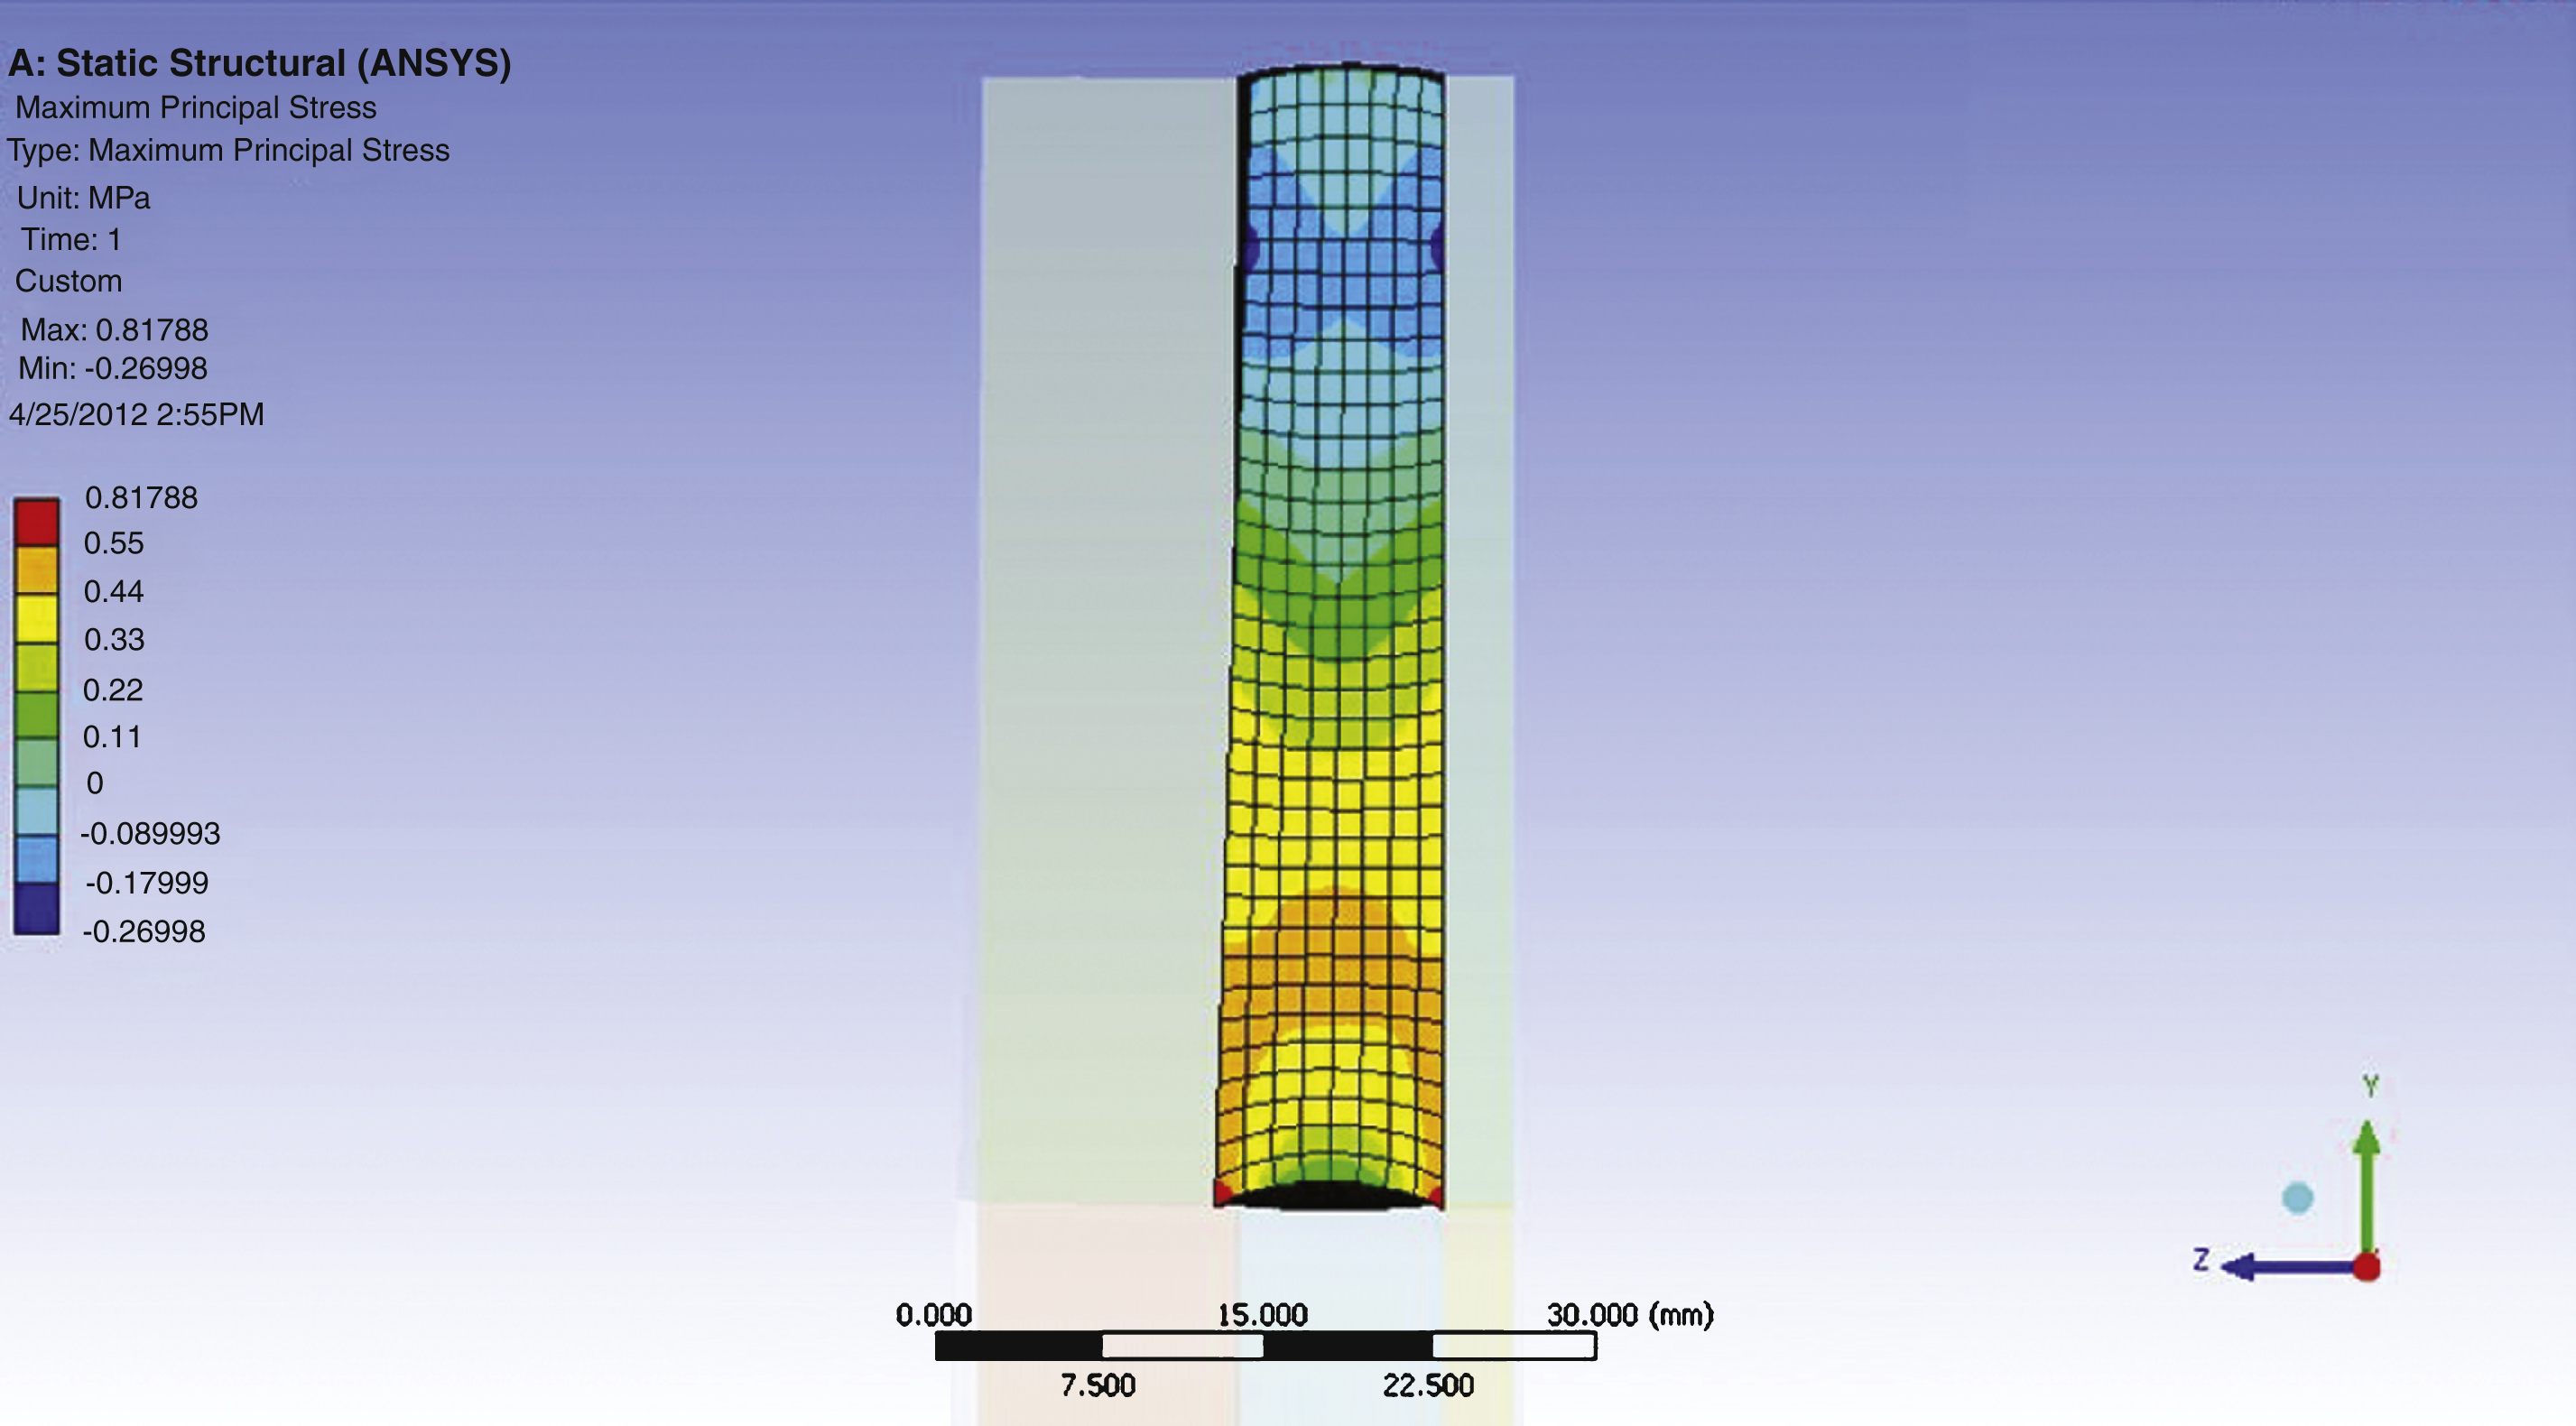
Fig.9
Stress at long dimension midspan of traditional joint.
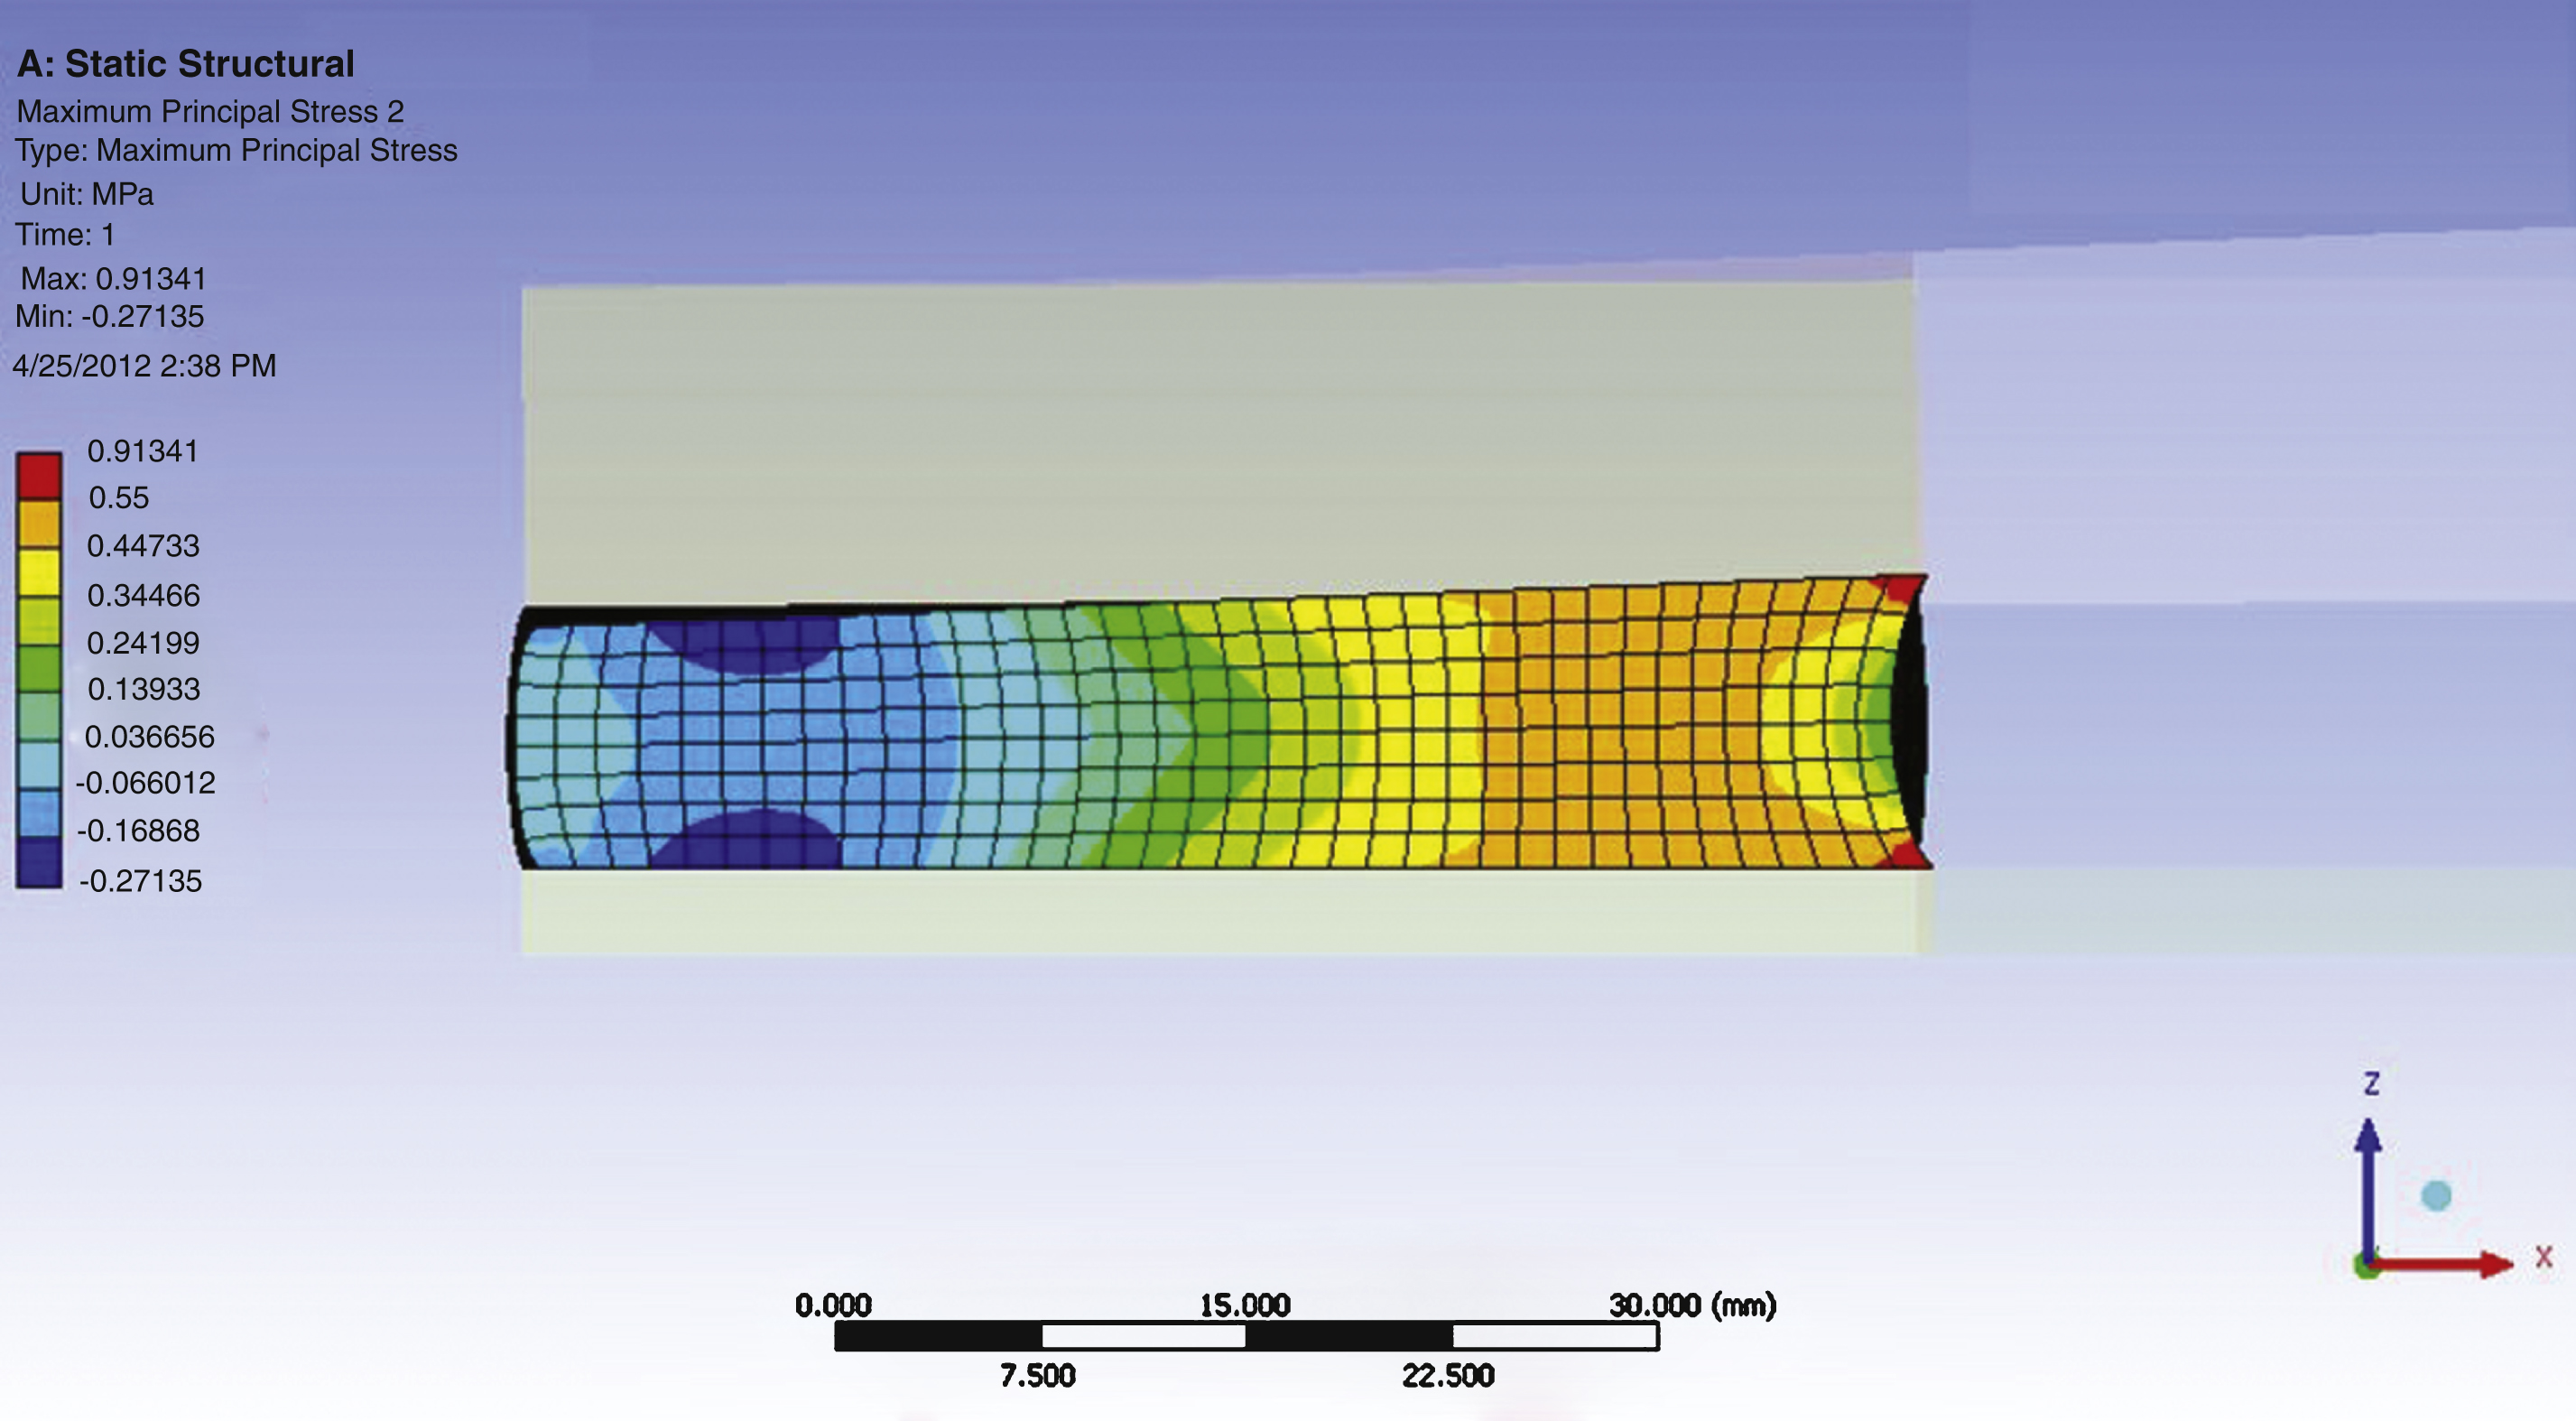
Fig.10
C1135 test results with similar peak edge stresses to traditional joint.
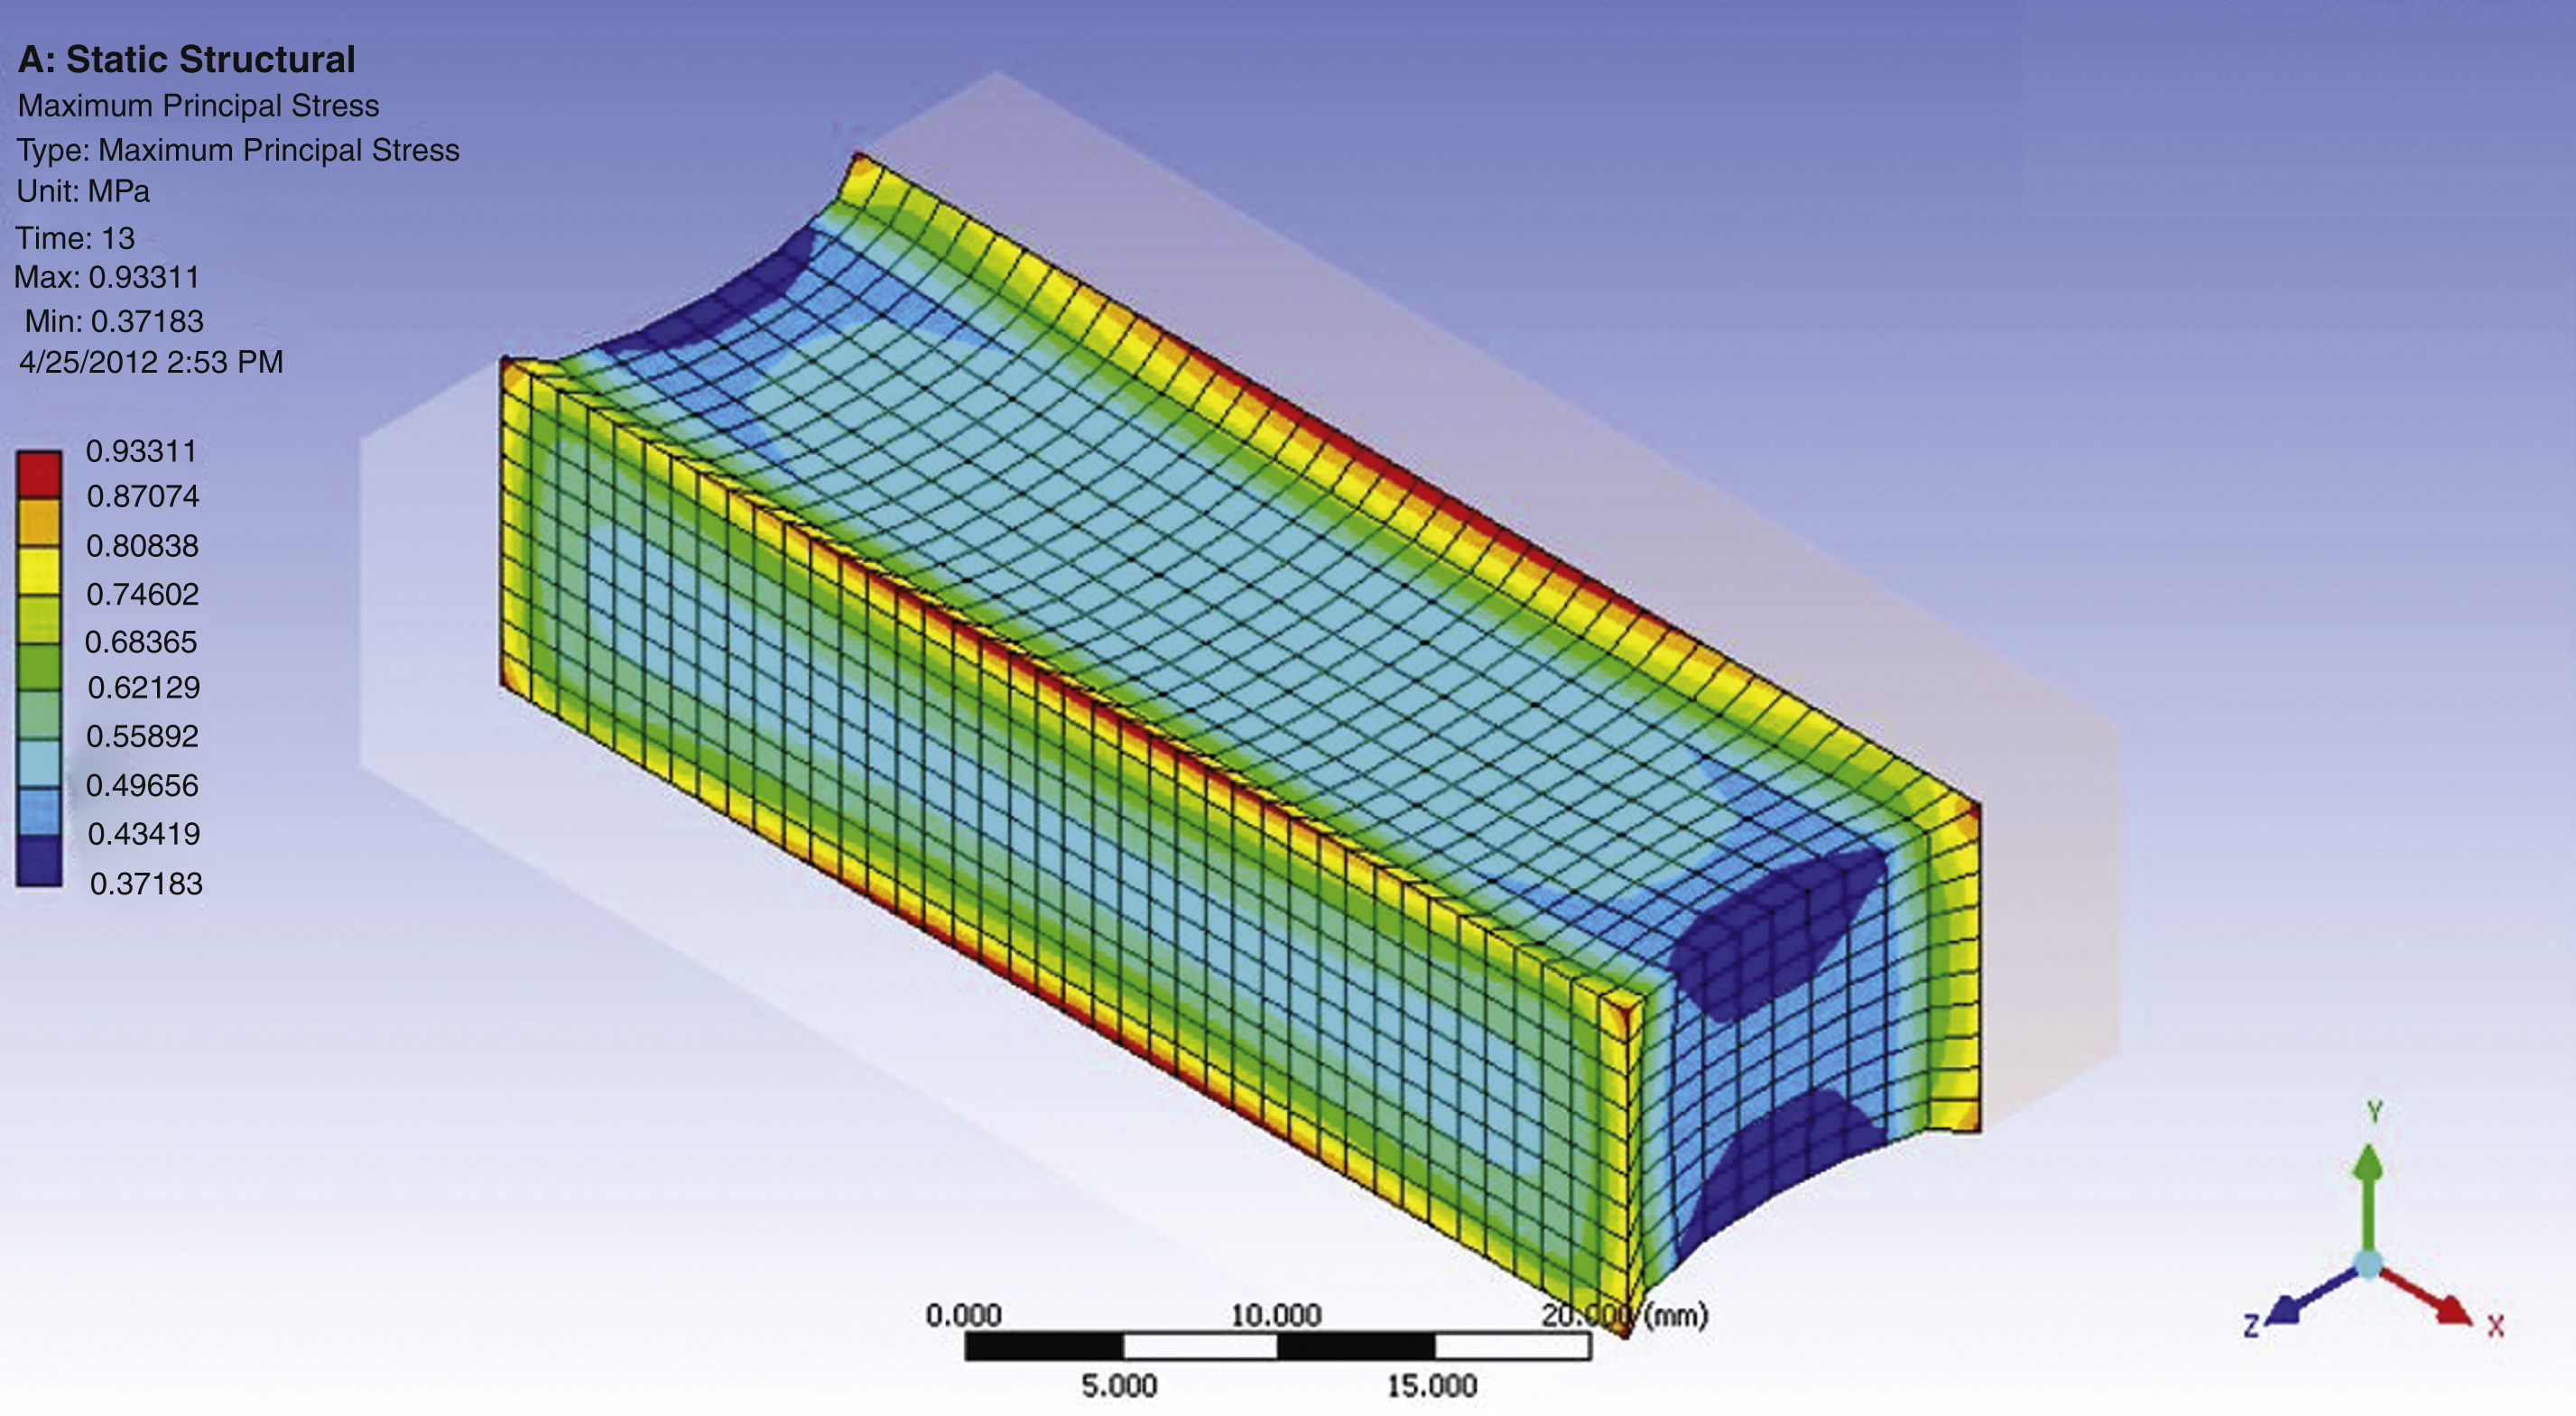
Fig.11
Stress at the corner of the silicone joint under positive wind load.
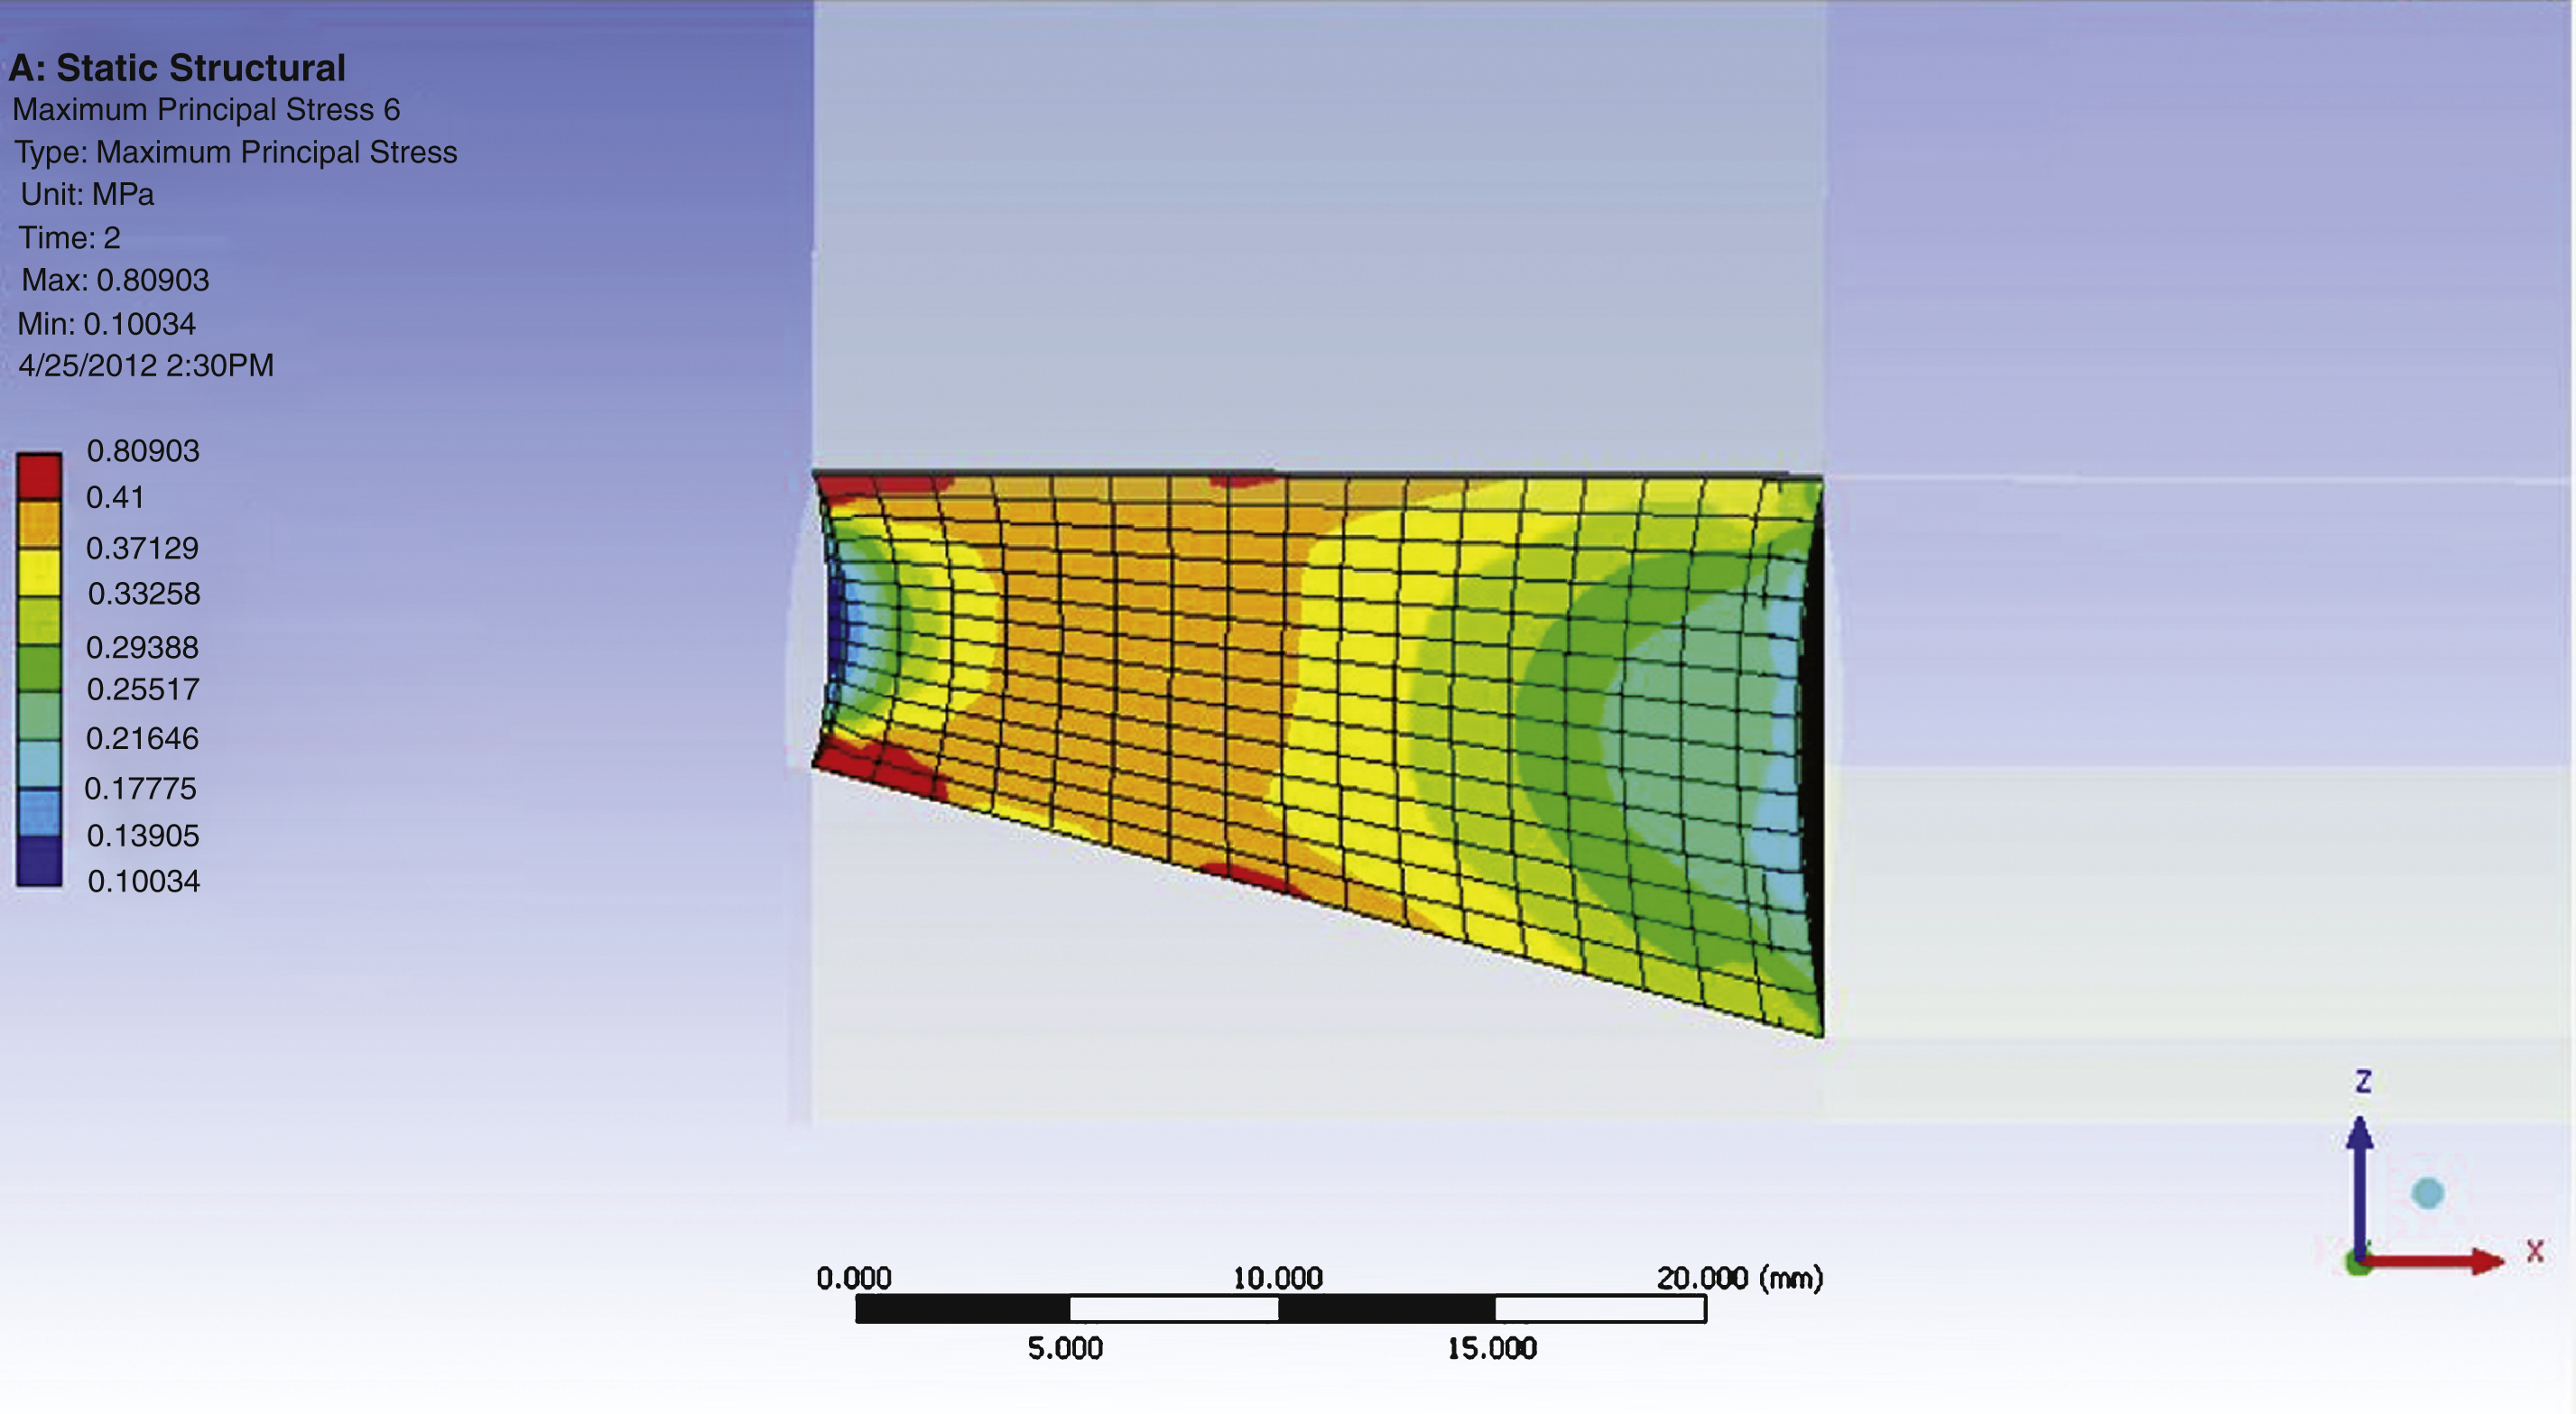
Fig.12
Mock-up detail of horizontal and vertical structural silicone attachment.
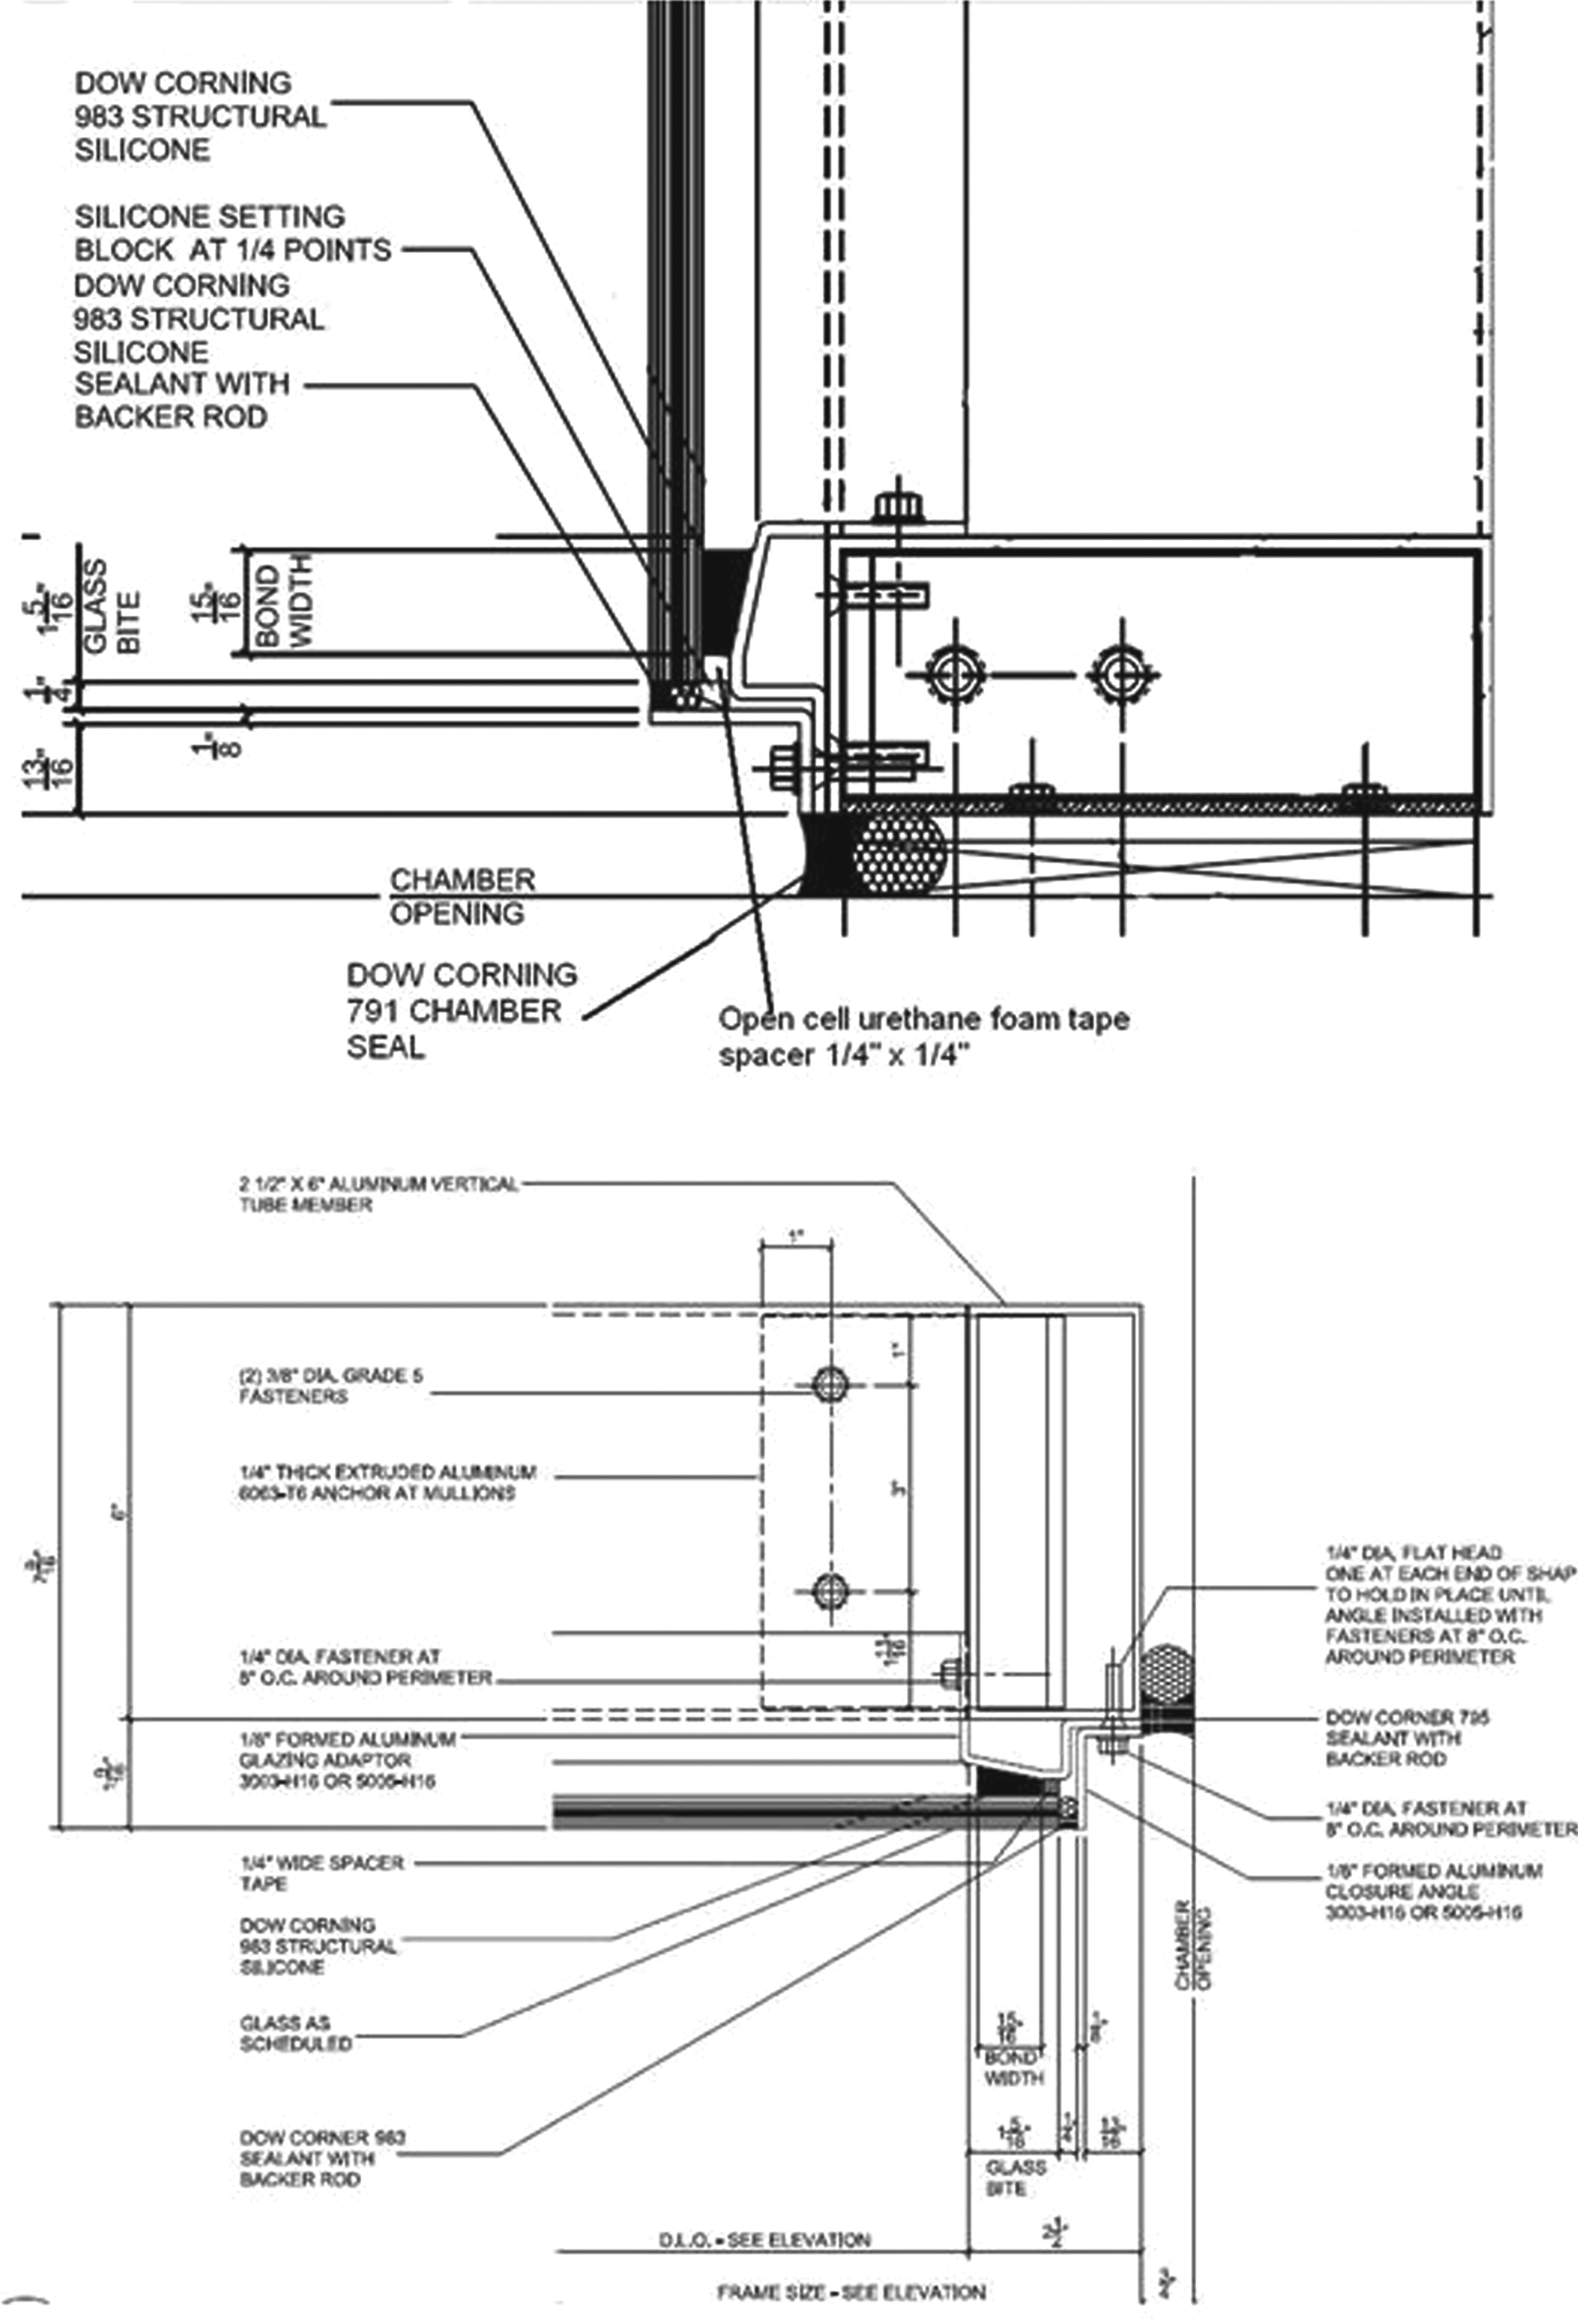
Fig.13
Finished unit set for testing.
Fig.14
Trapezoidal joint profile and gauge locations.
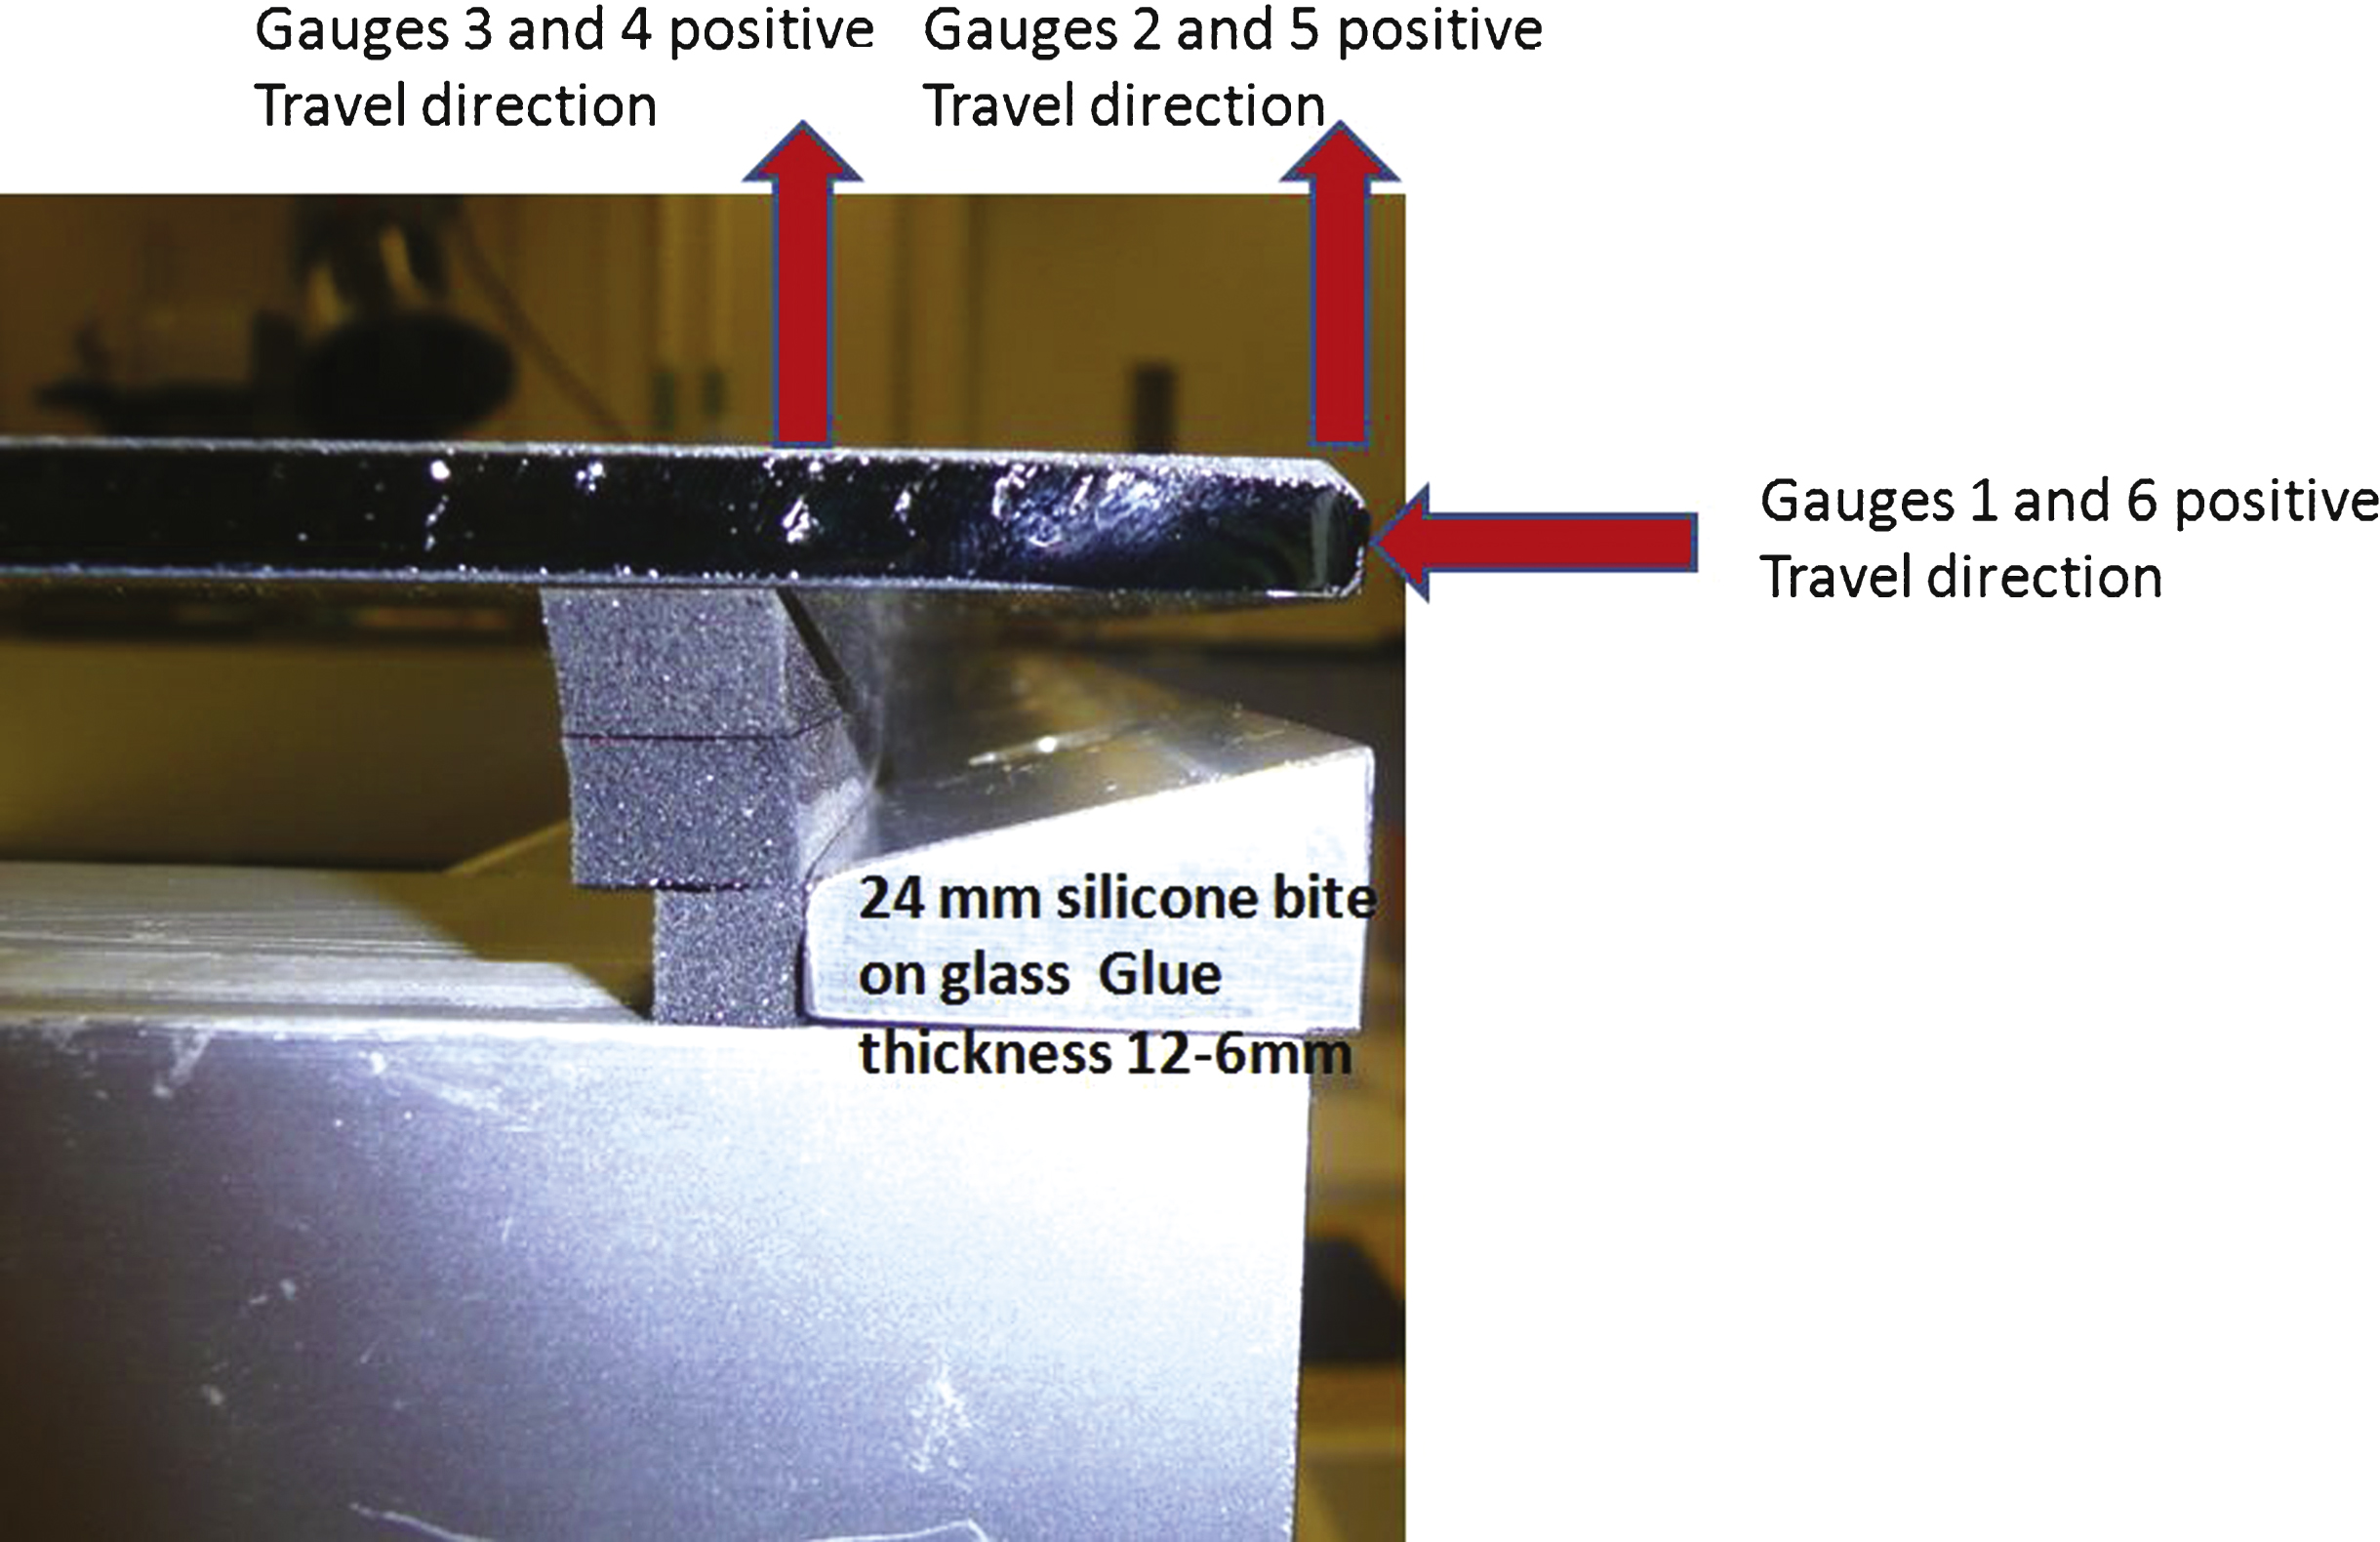
Fig.15
Conventional joint profile and gauge locations.
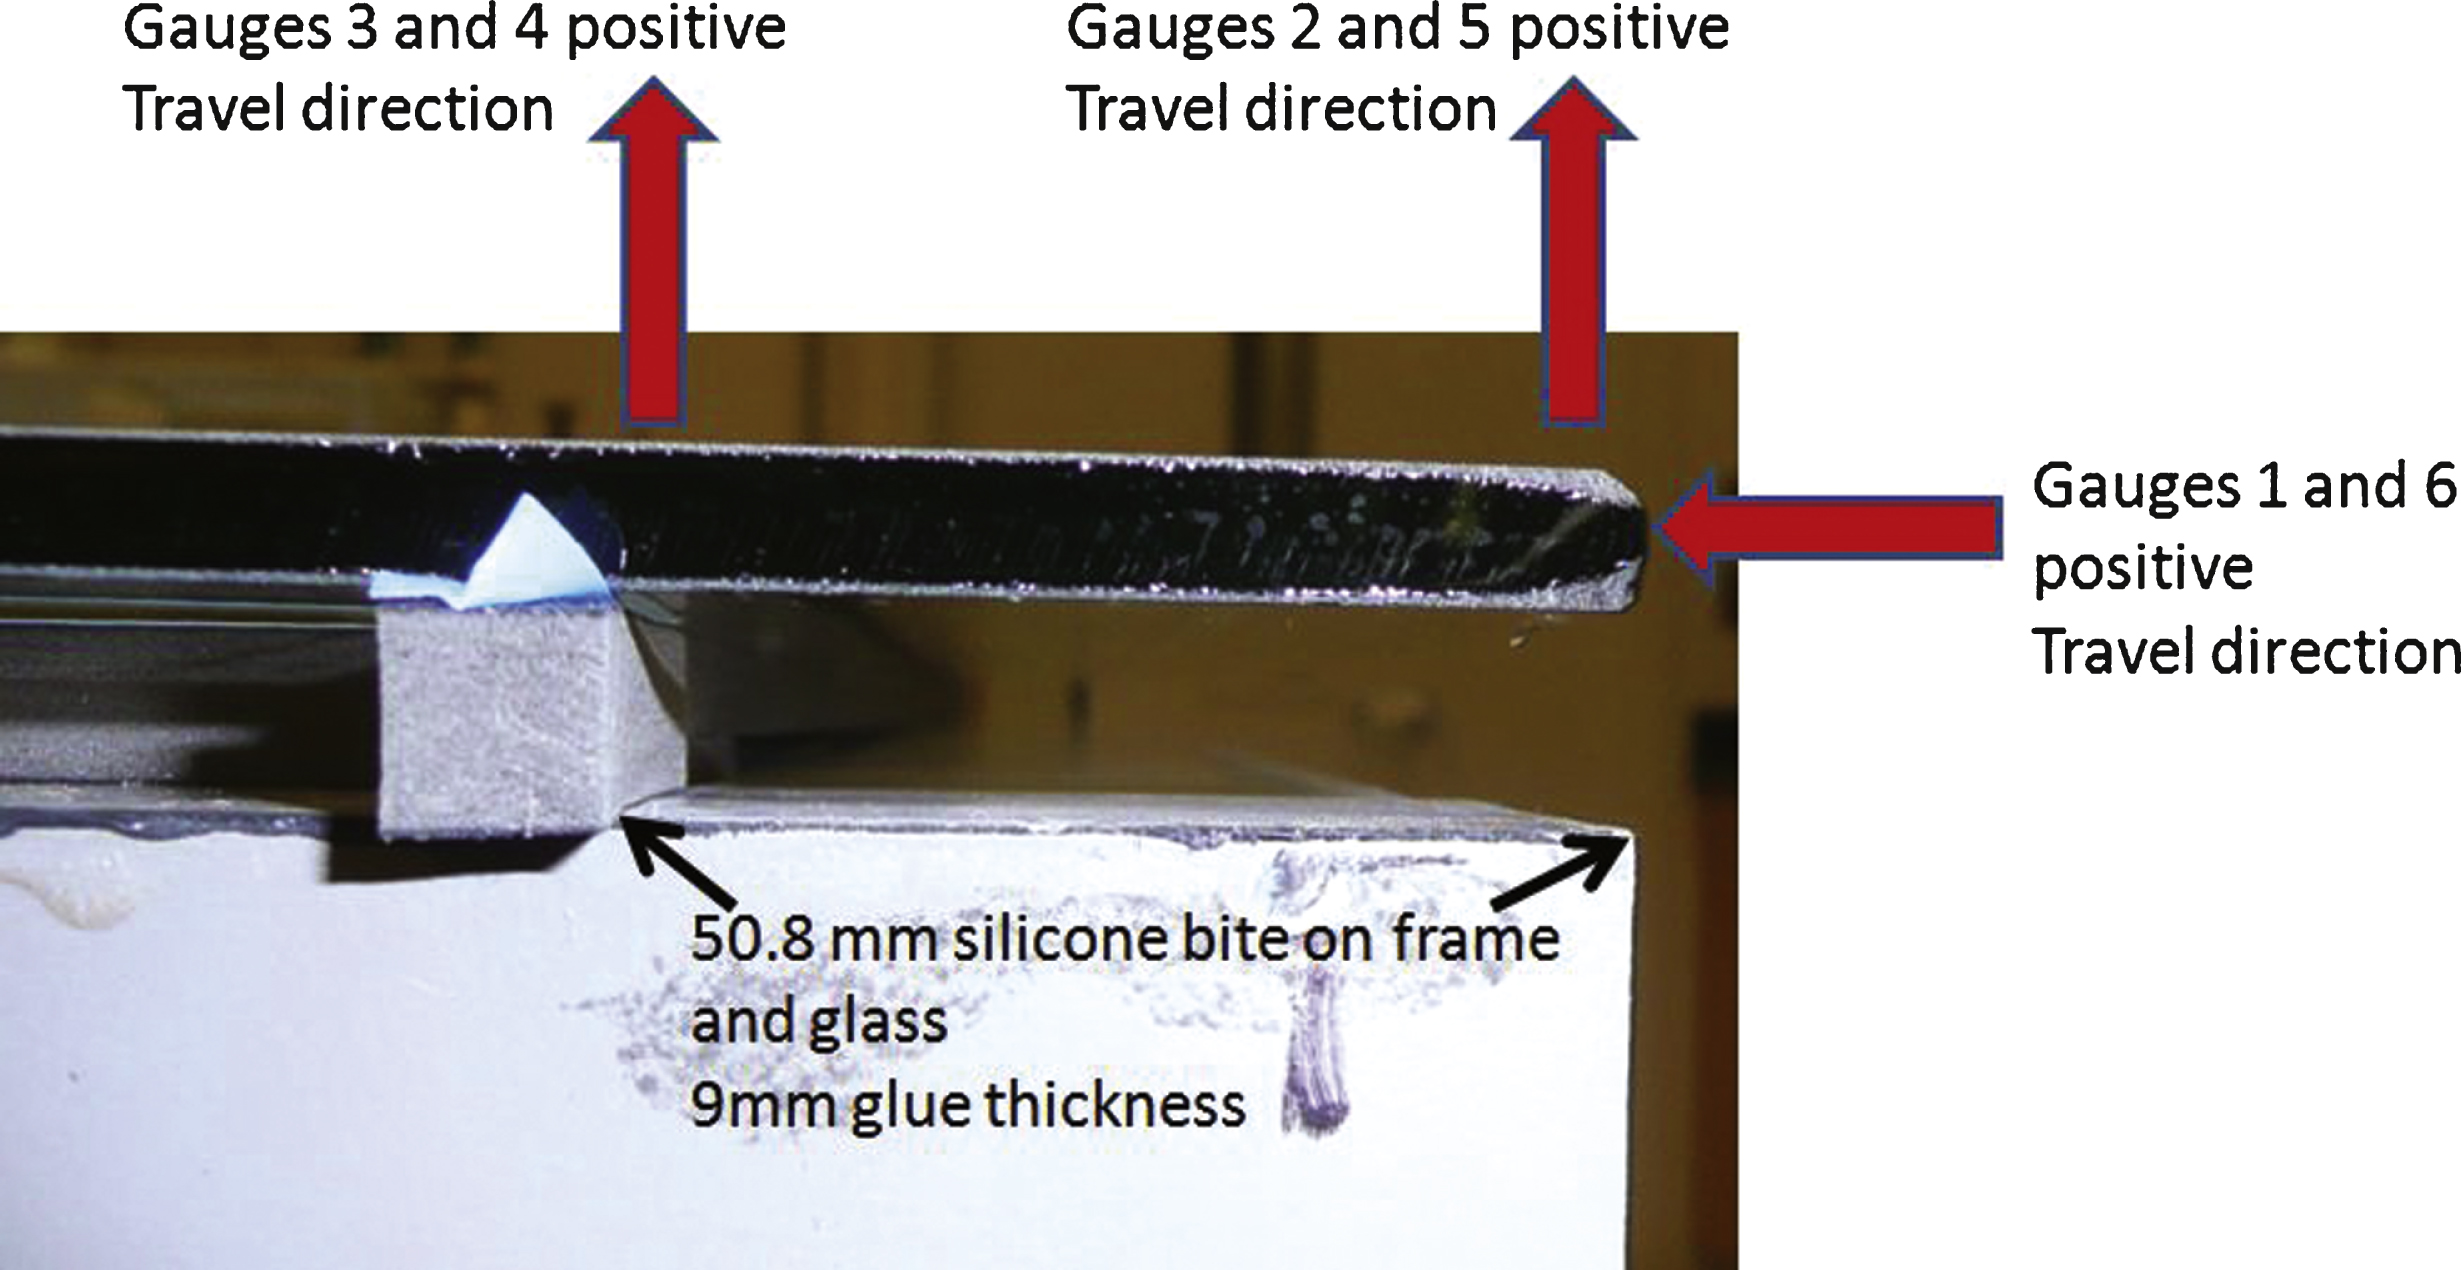
Fig.16
Mock-up elevation and gauge locations.
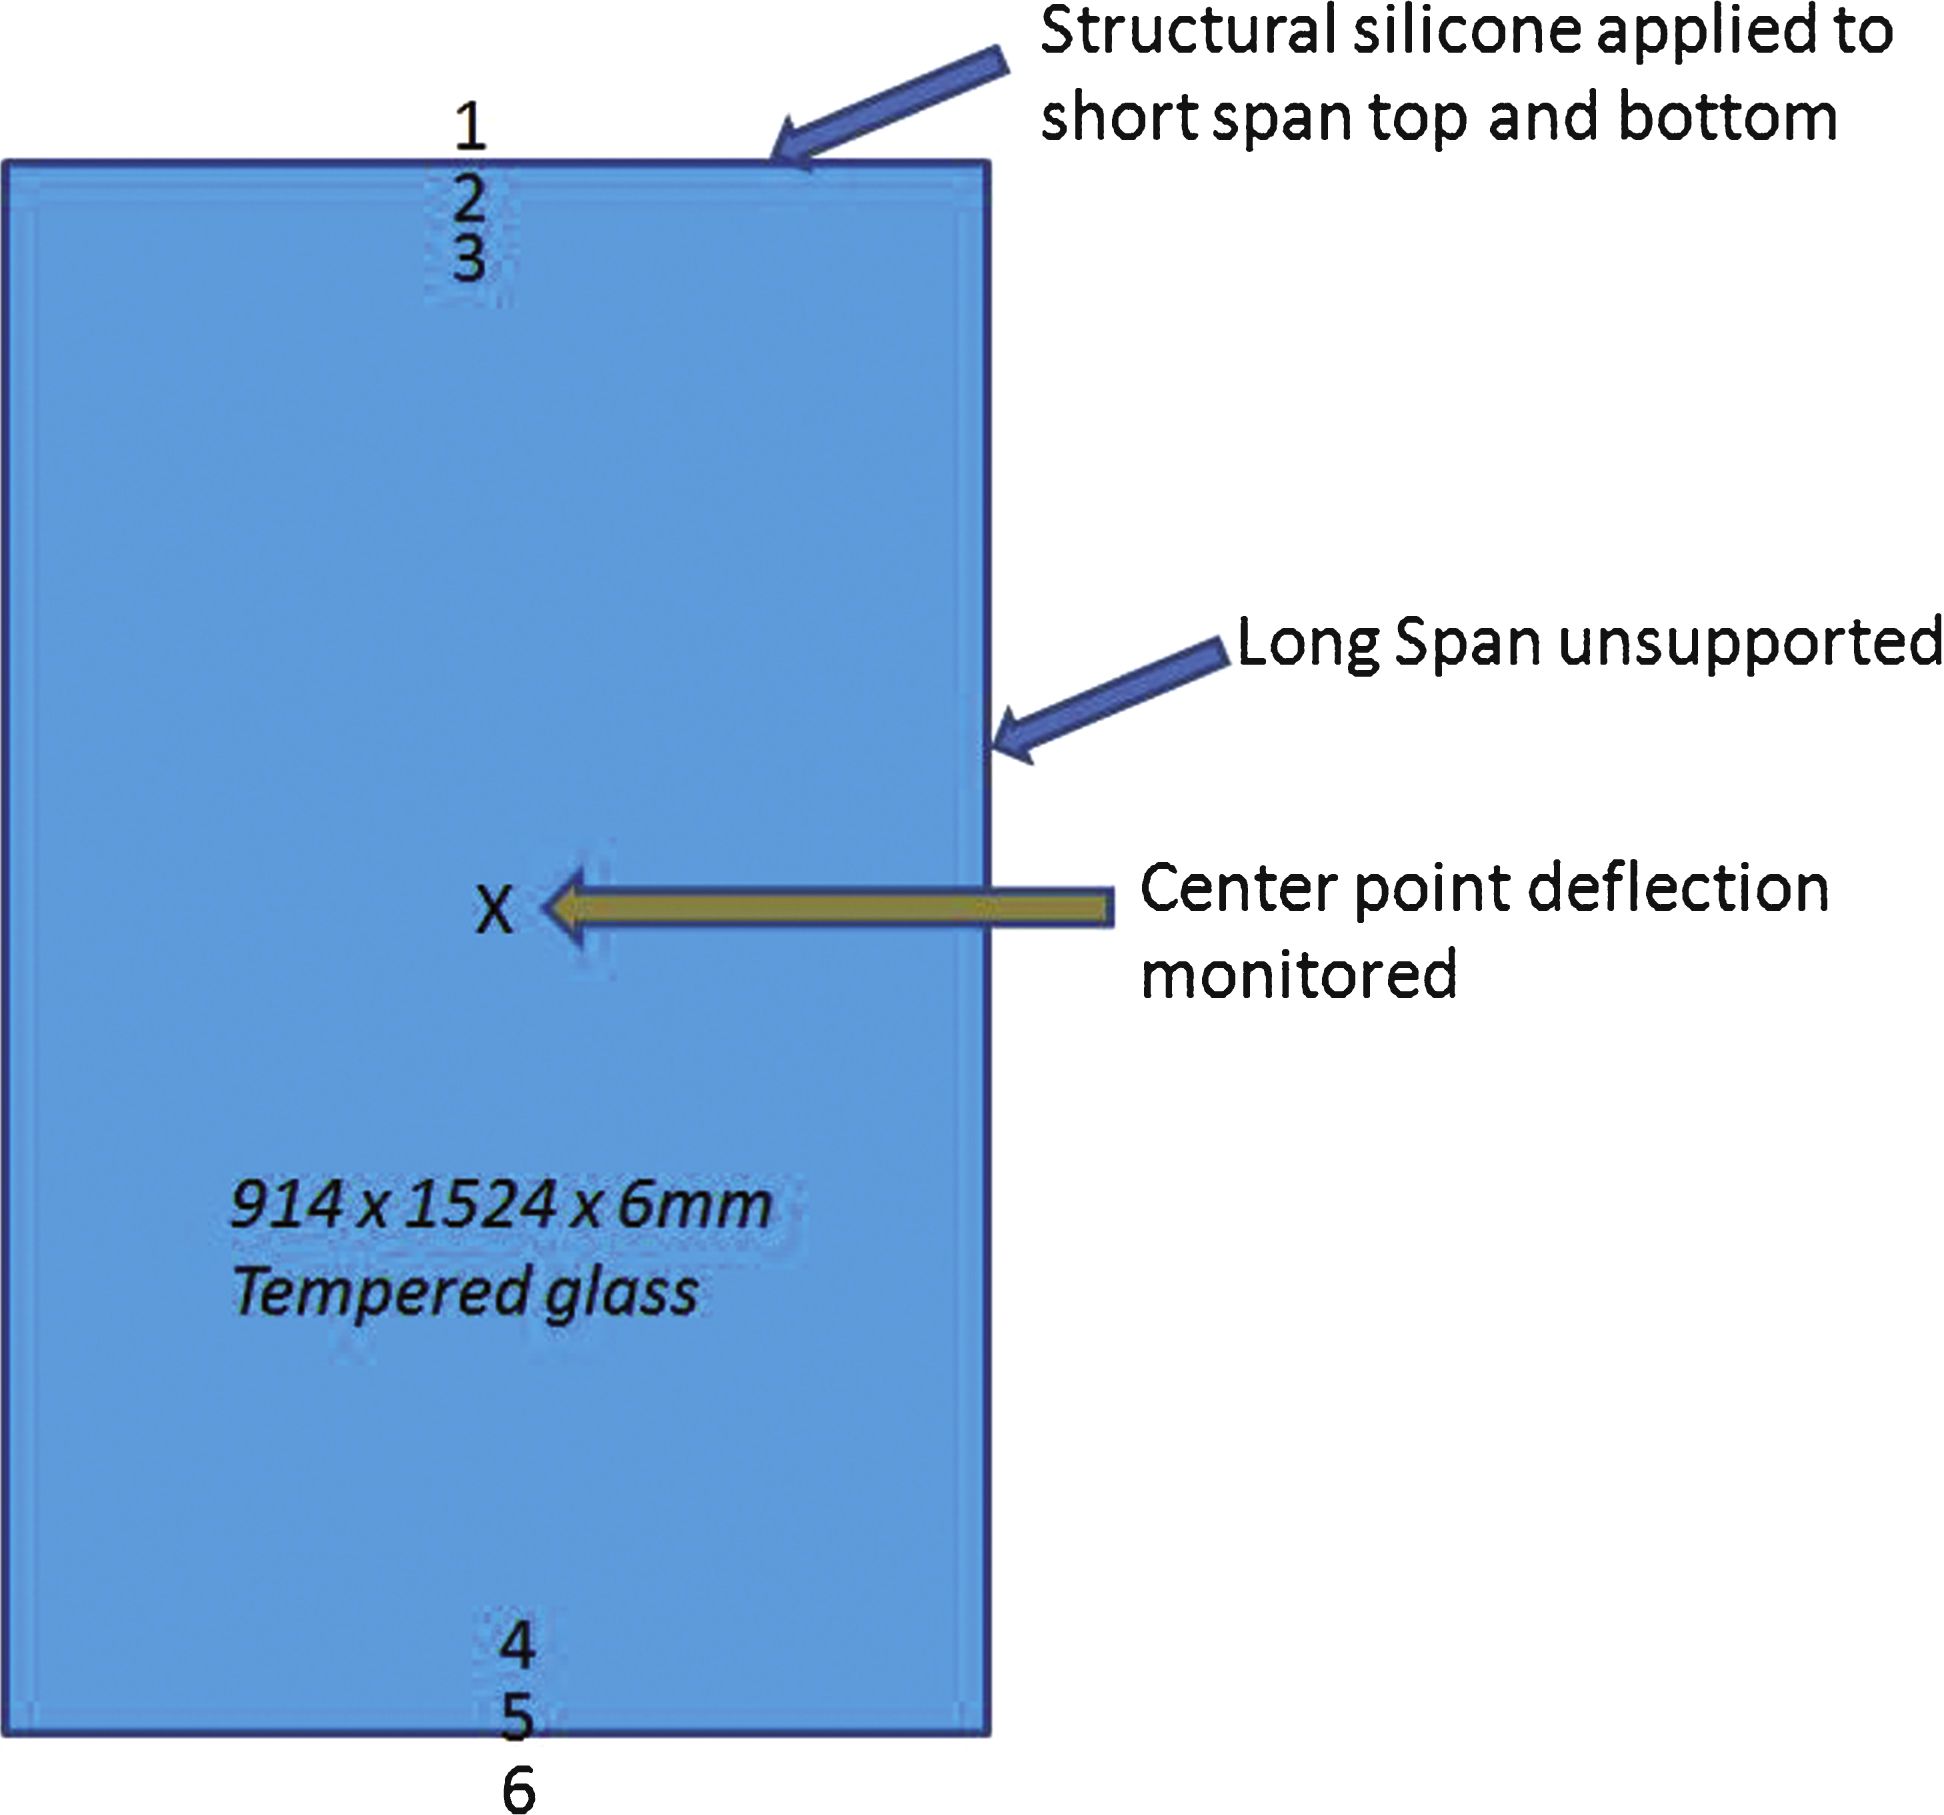
Fig.17
Gauge deflections at 4.1 kPa.
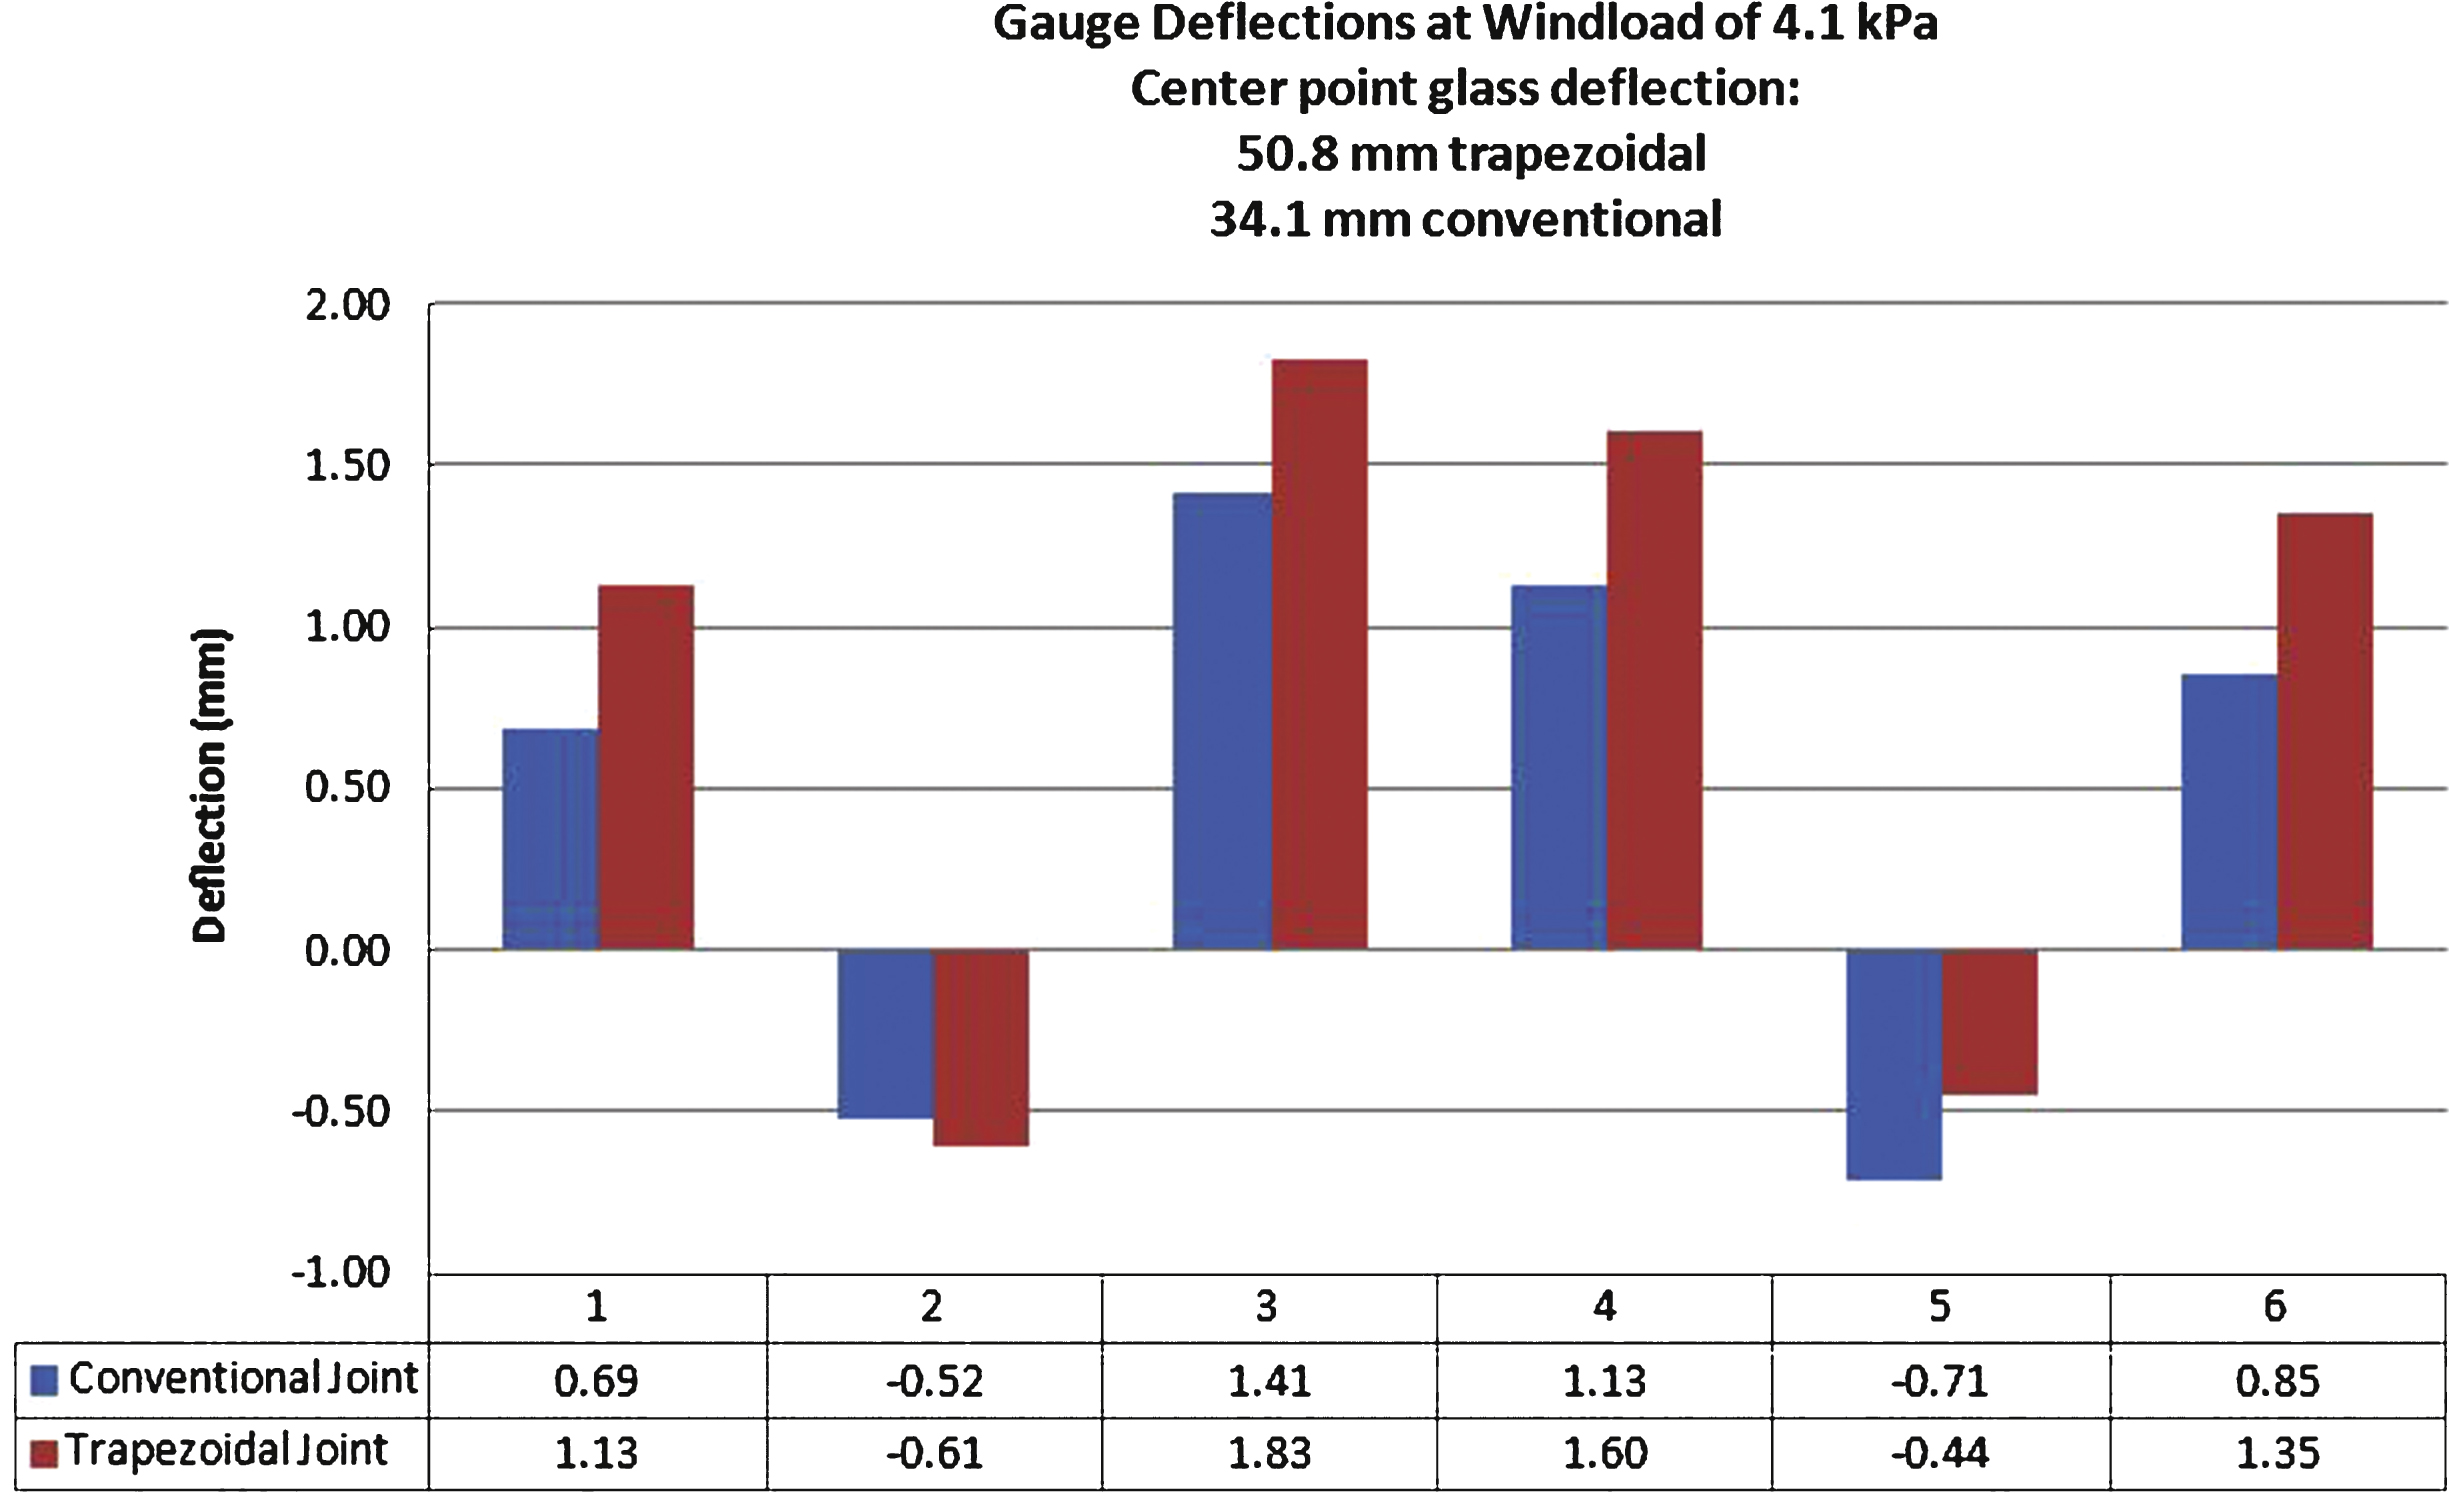
Fig.18
Gauge deflections at 50.8 mm centre of glass deflection.
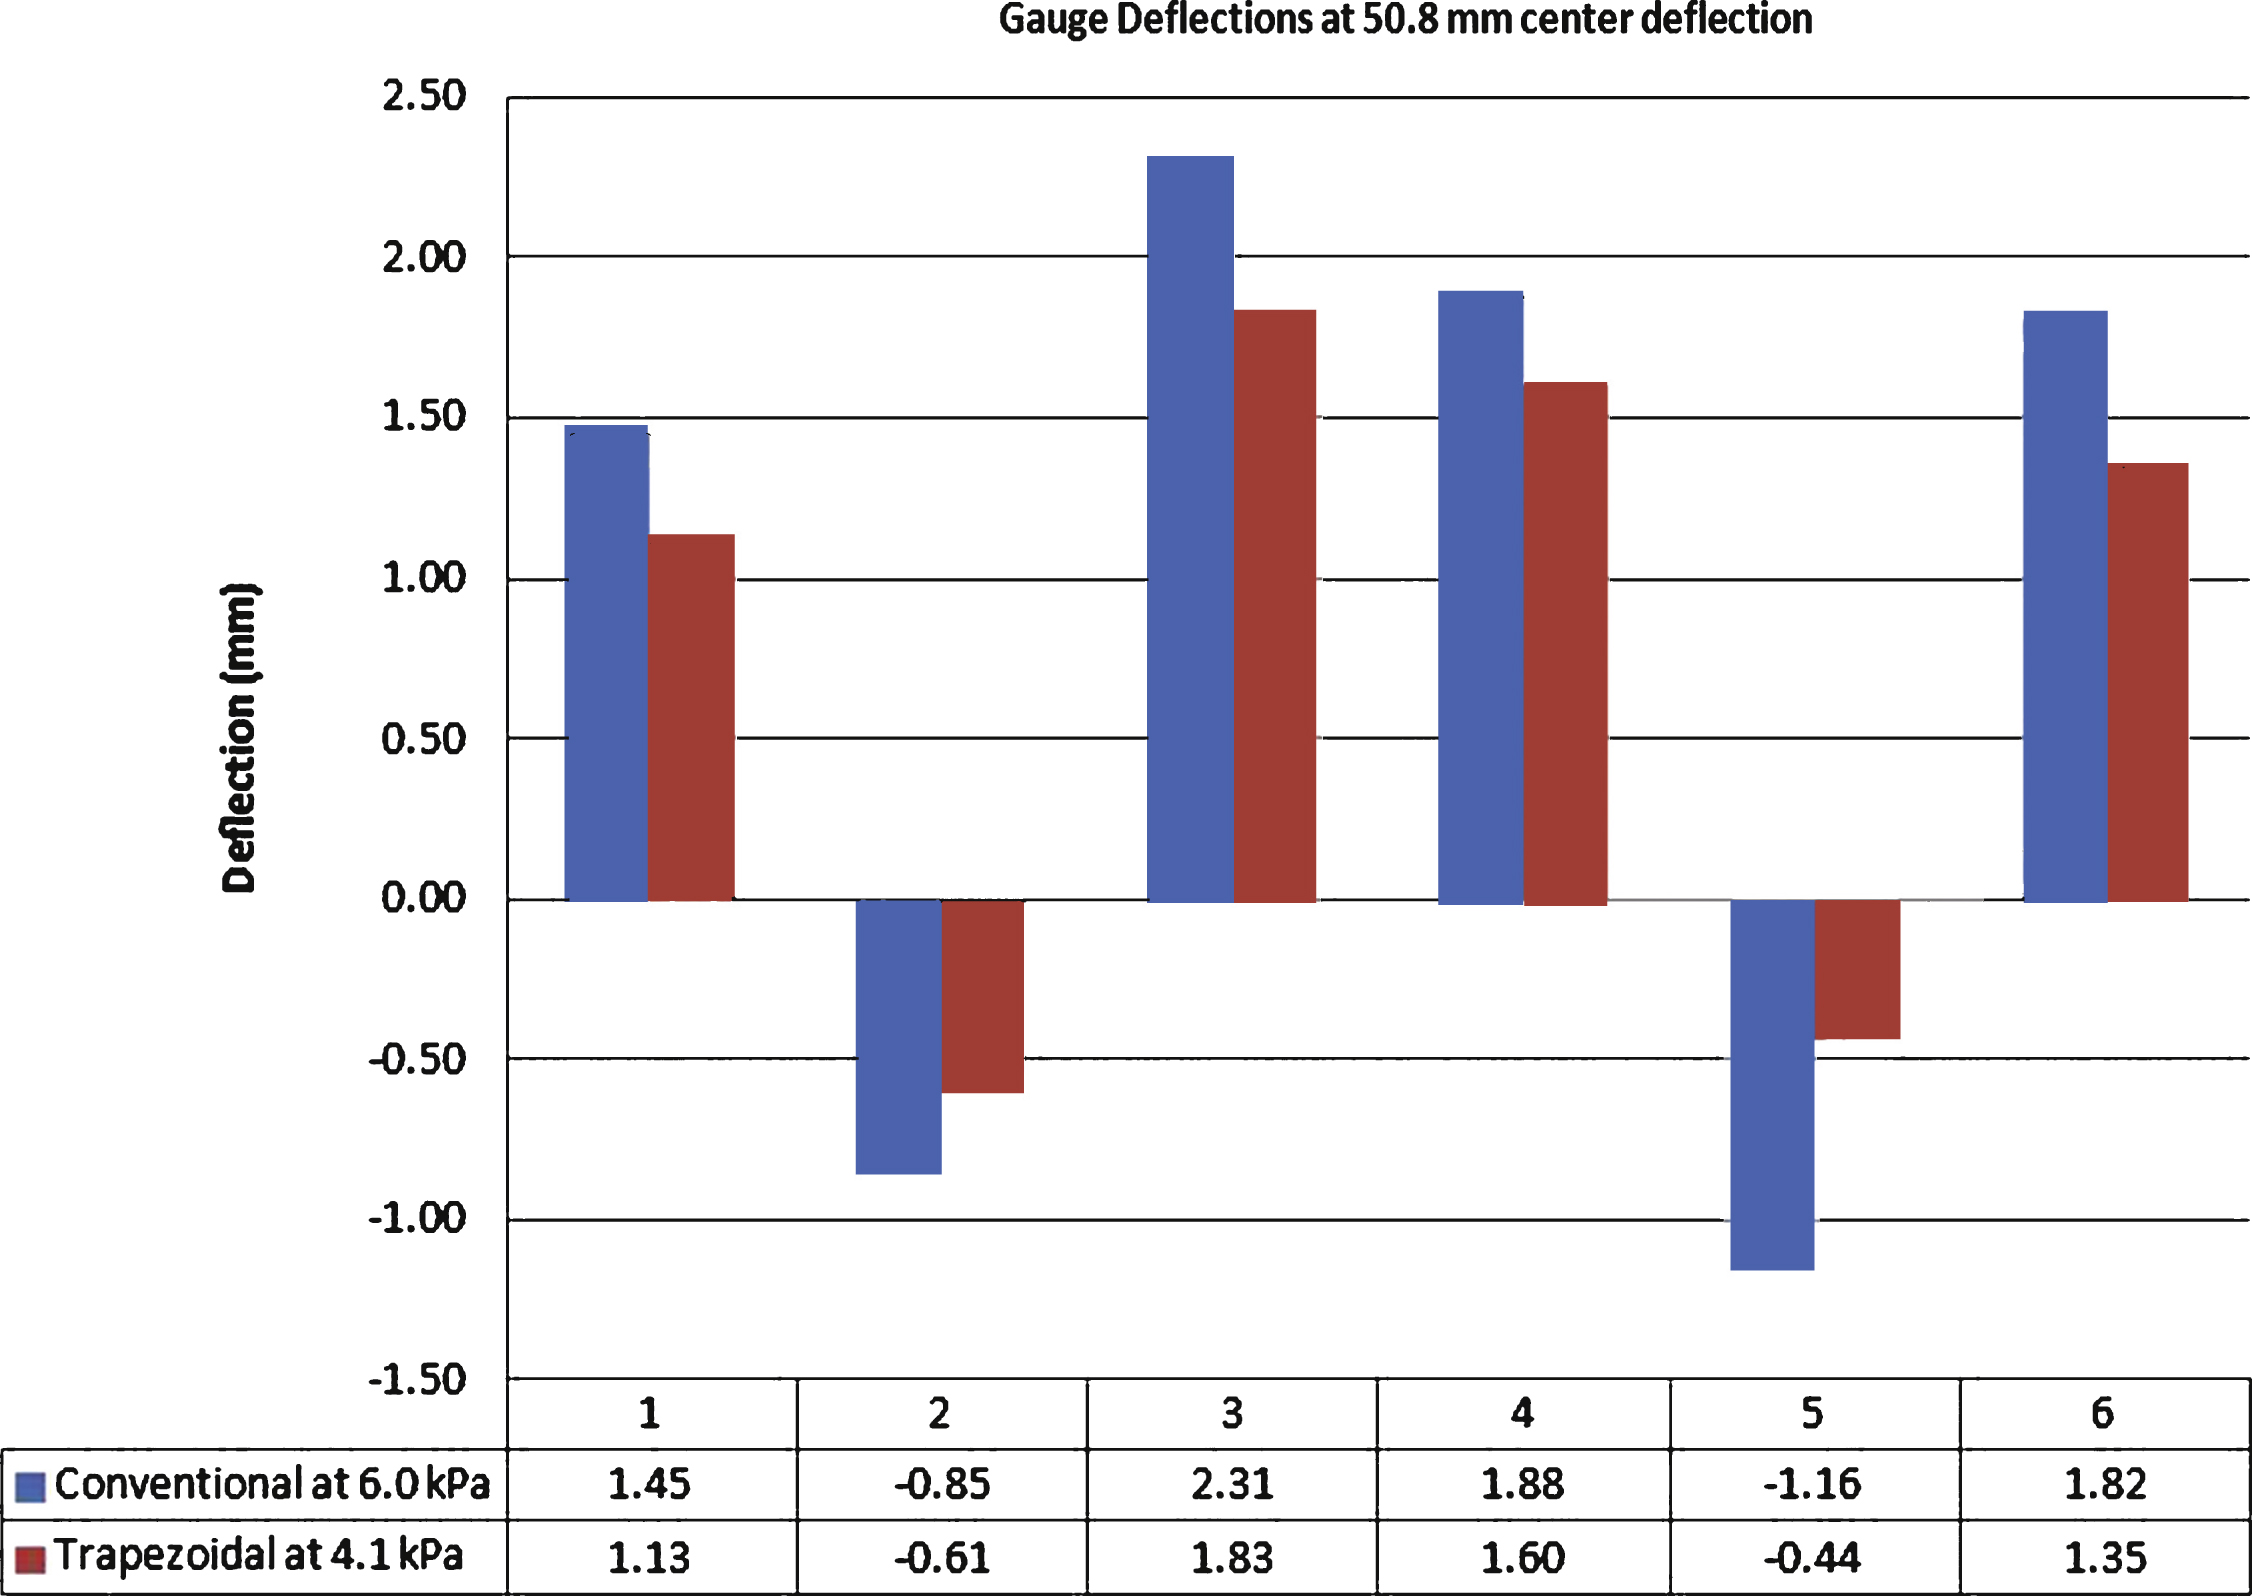
Fig.19
Glass Type 2 after reversal of pressure to −9.58 kPa (−200 psf) showing deglazing.
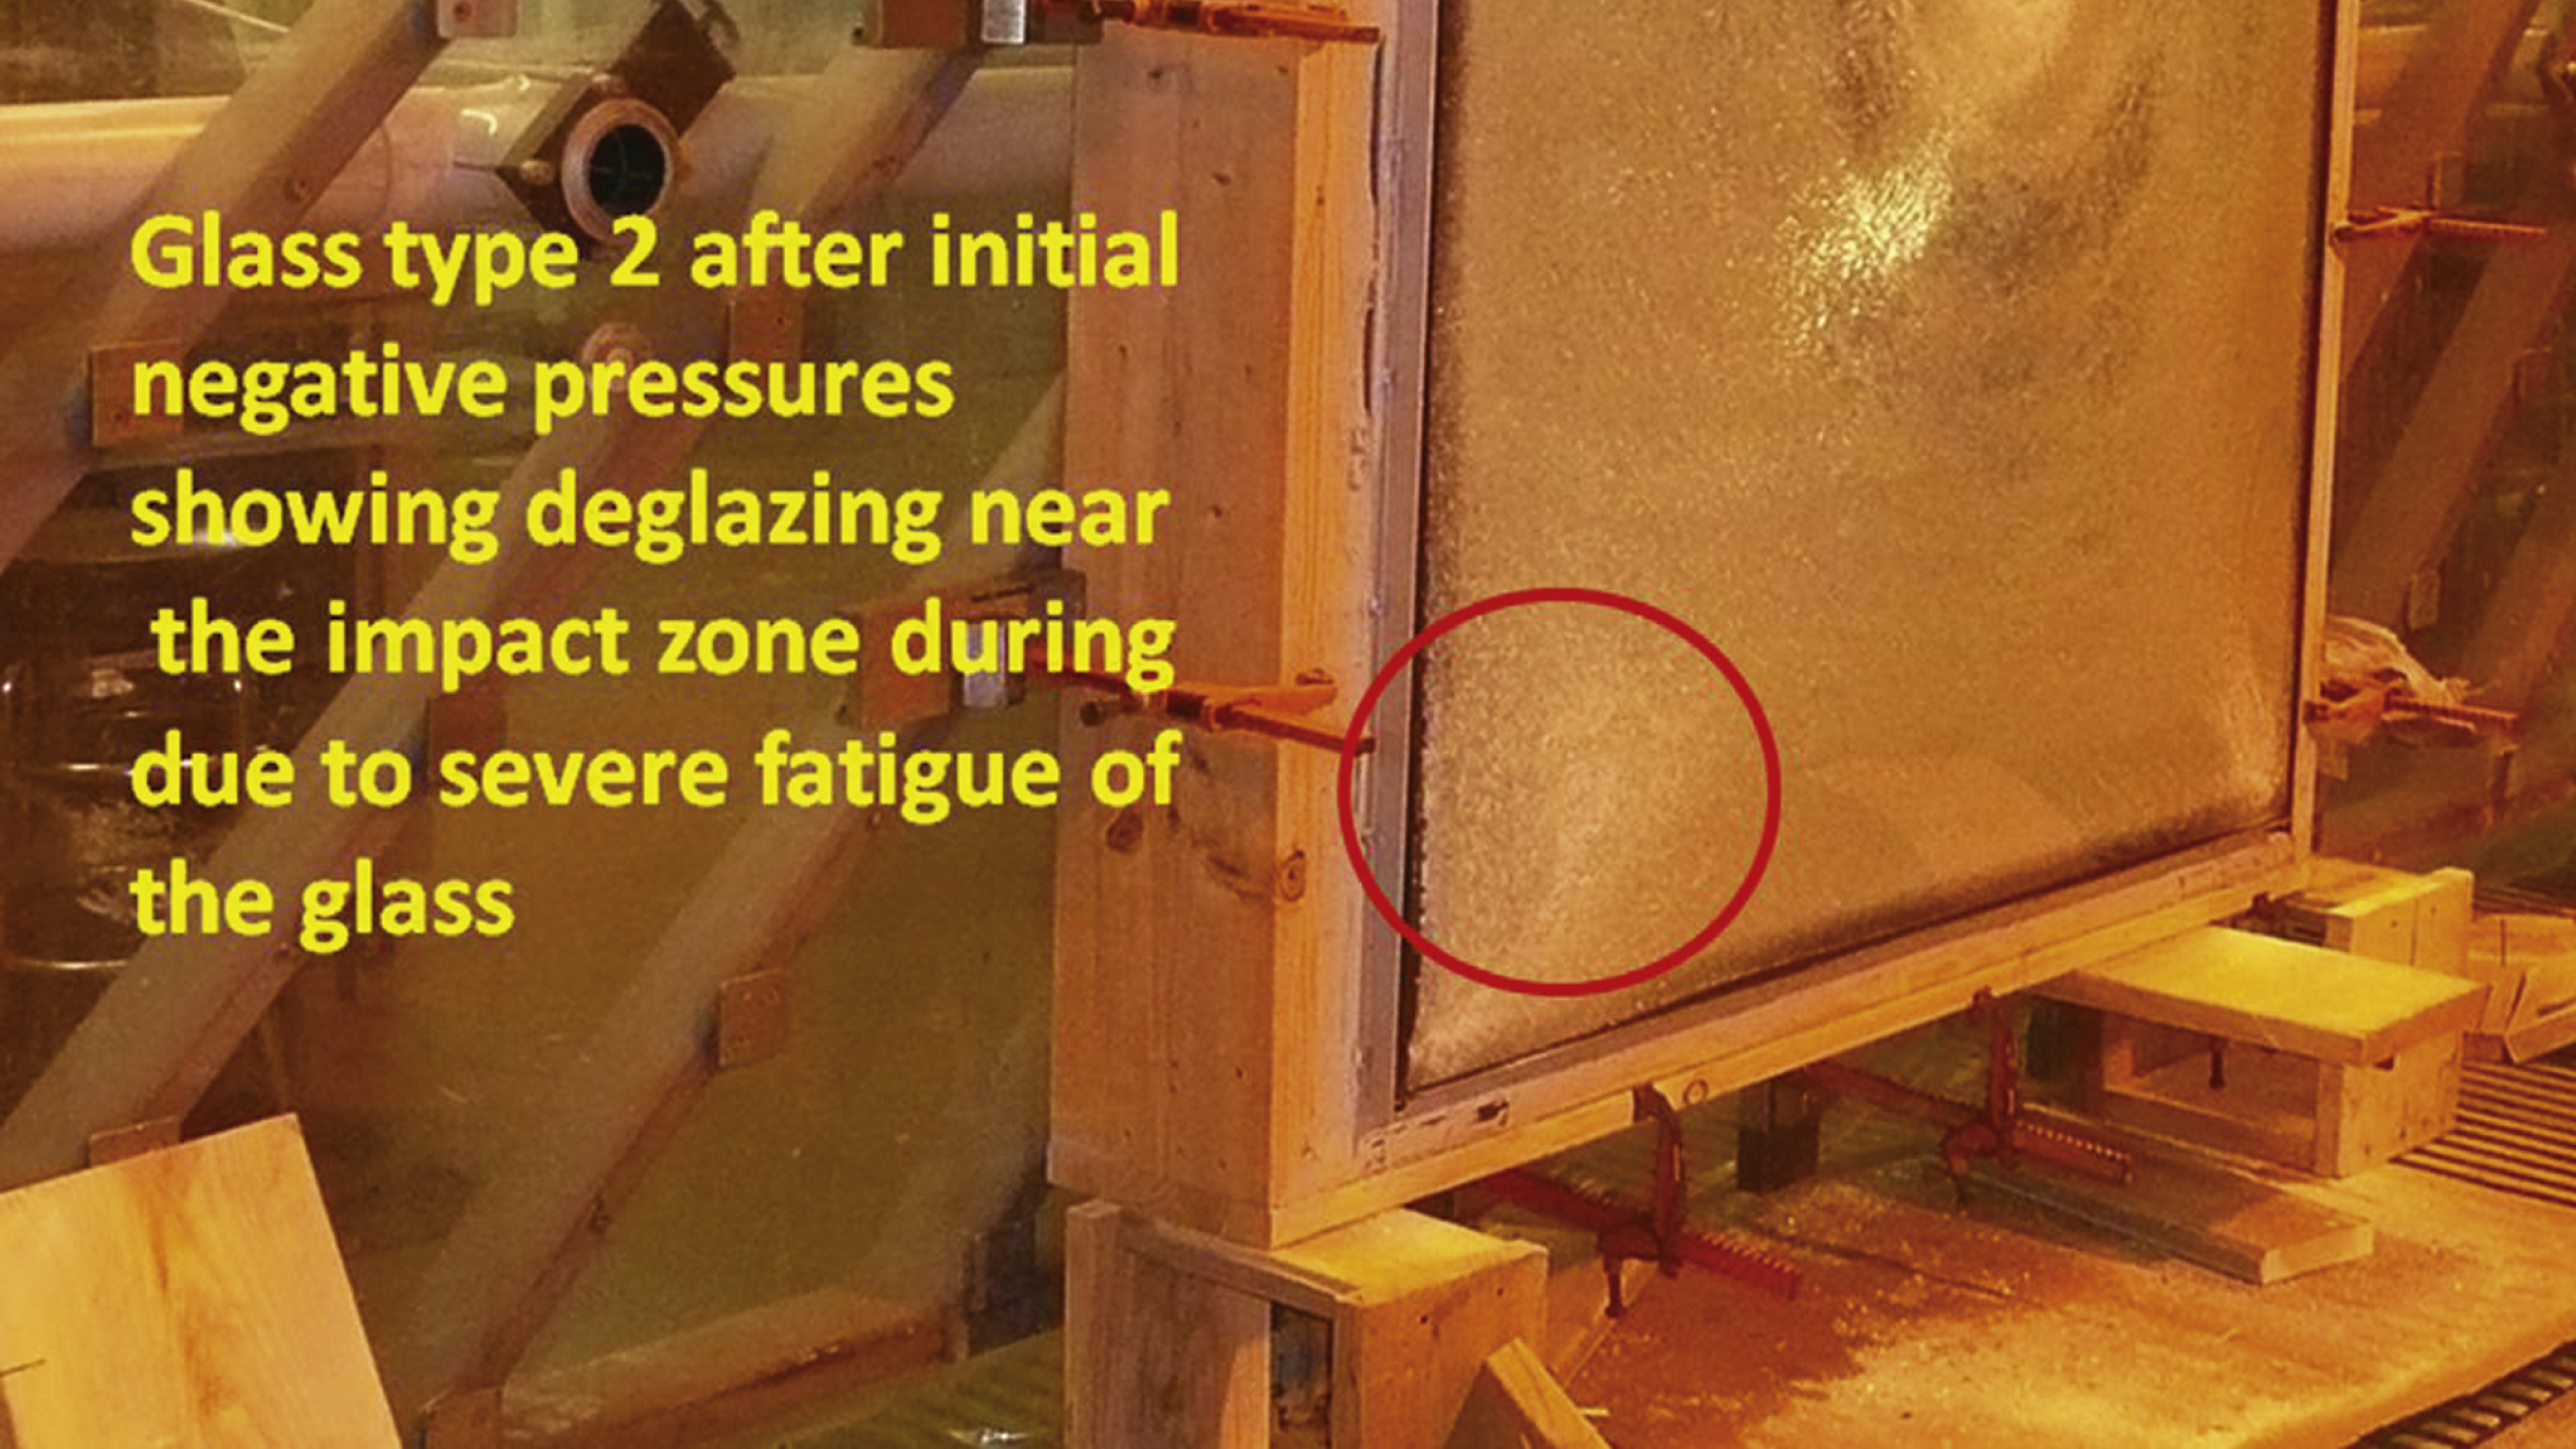
Fig.20
Test failure at −9.58 kPa (−200 psf) due to glass fatigue near the impact zone.
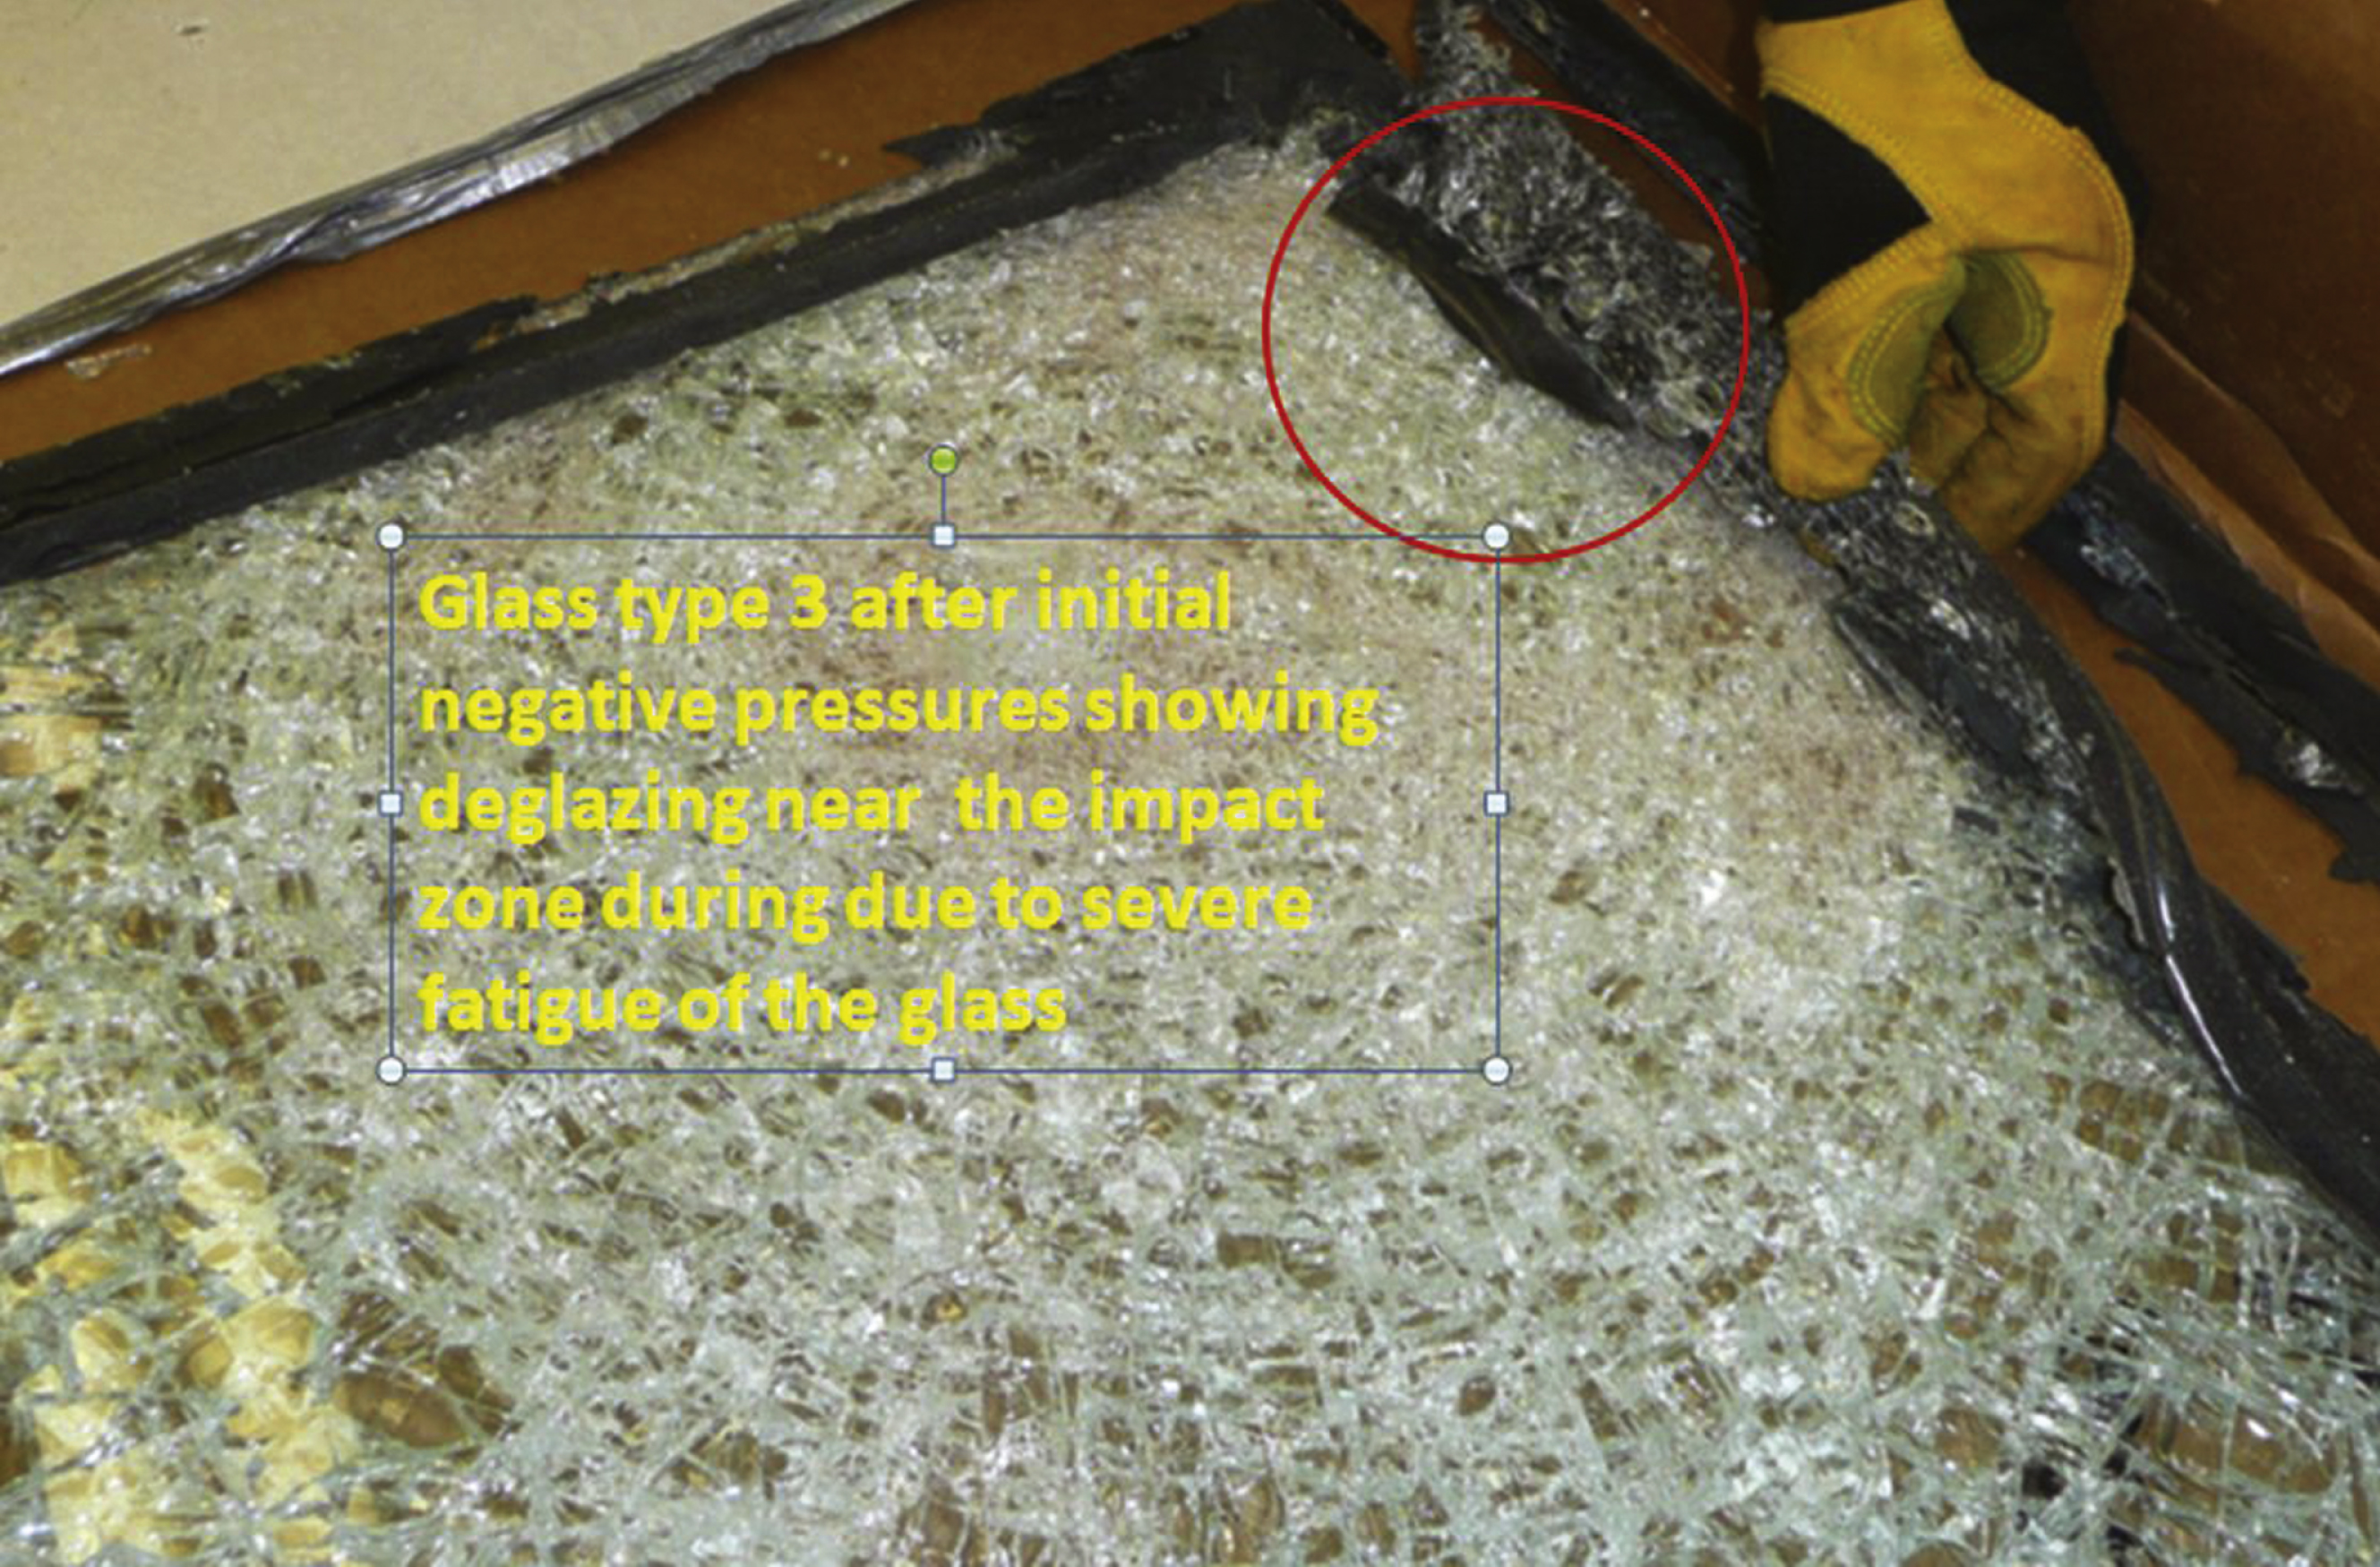
Fig.21
Visible location of impact of the small missiles into Glass Type 3.
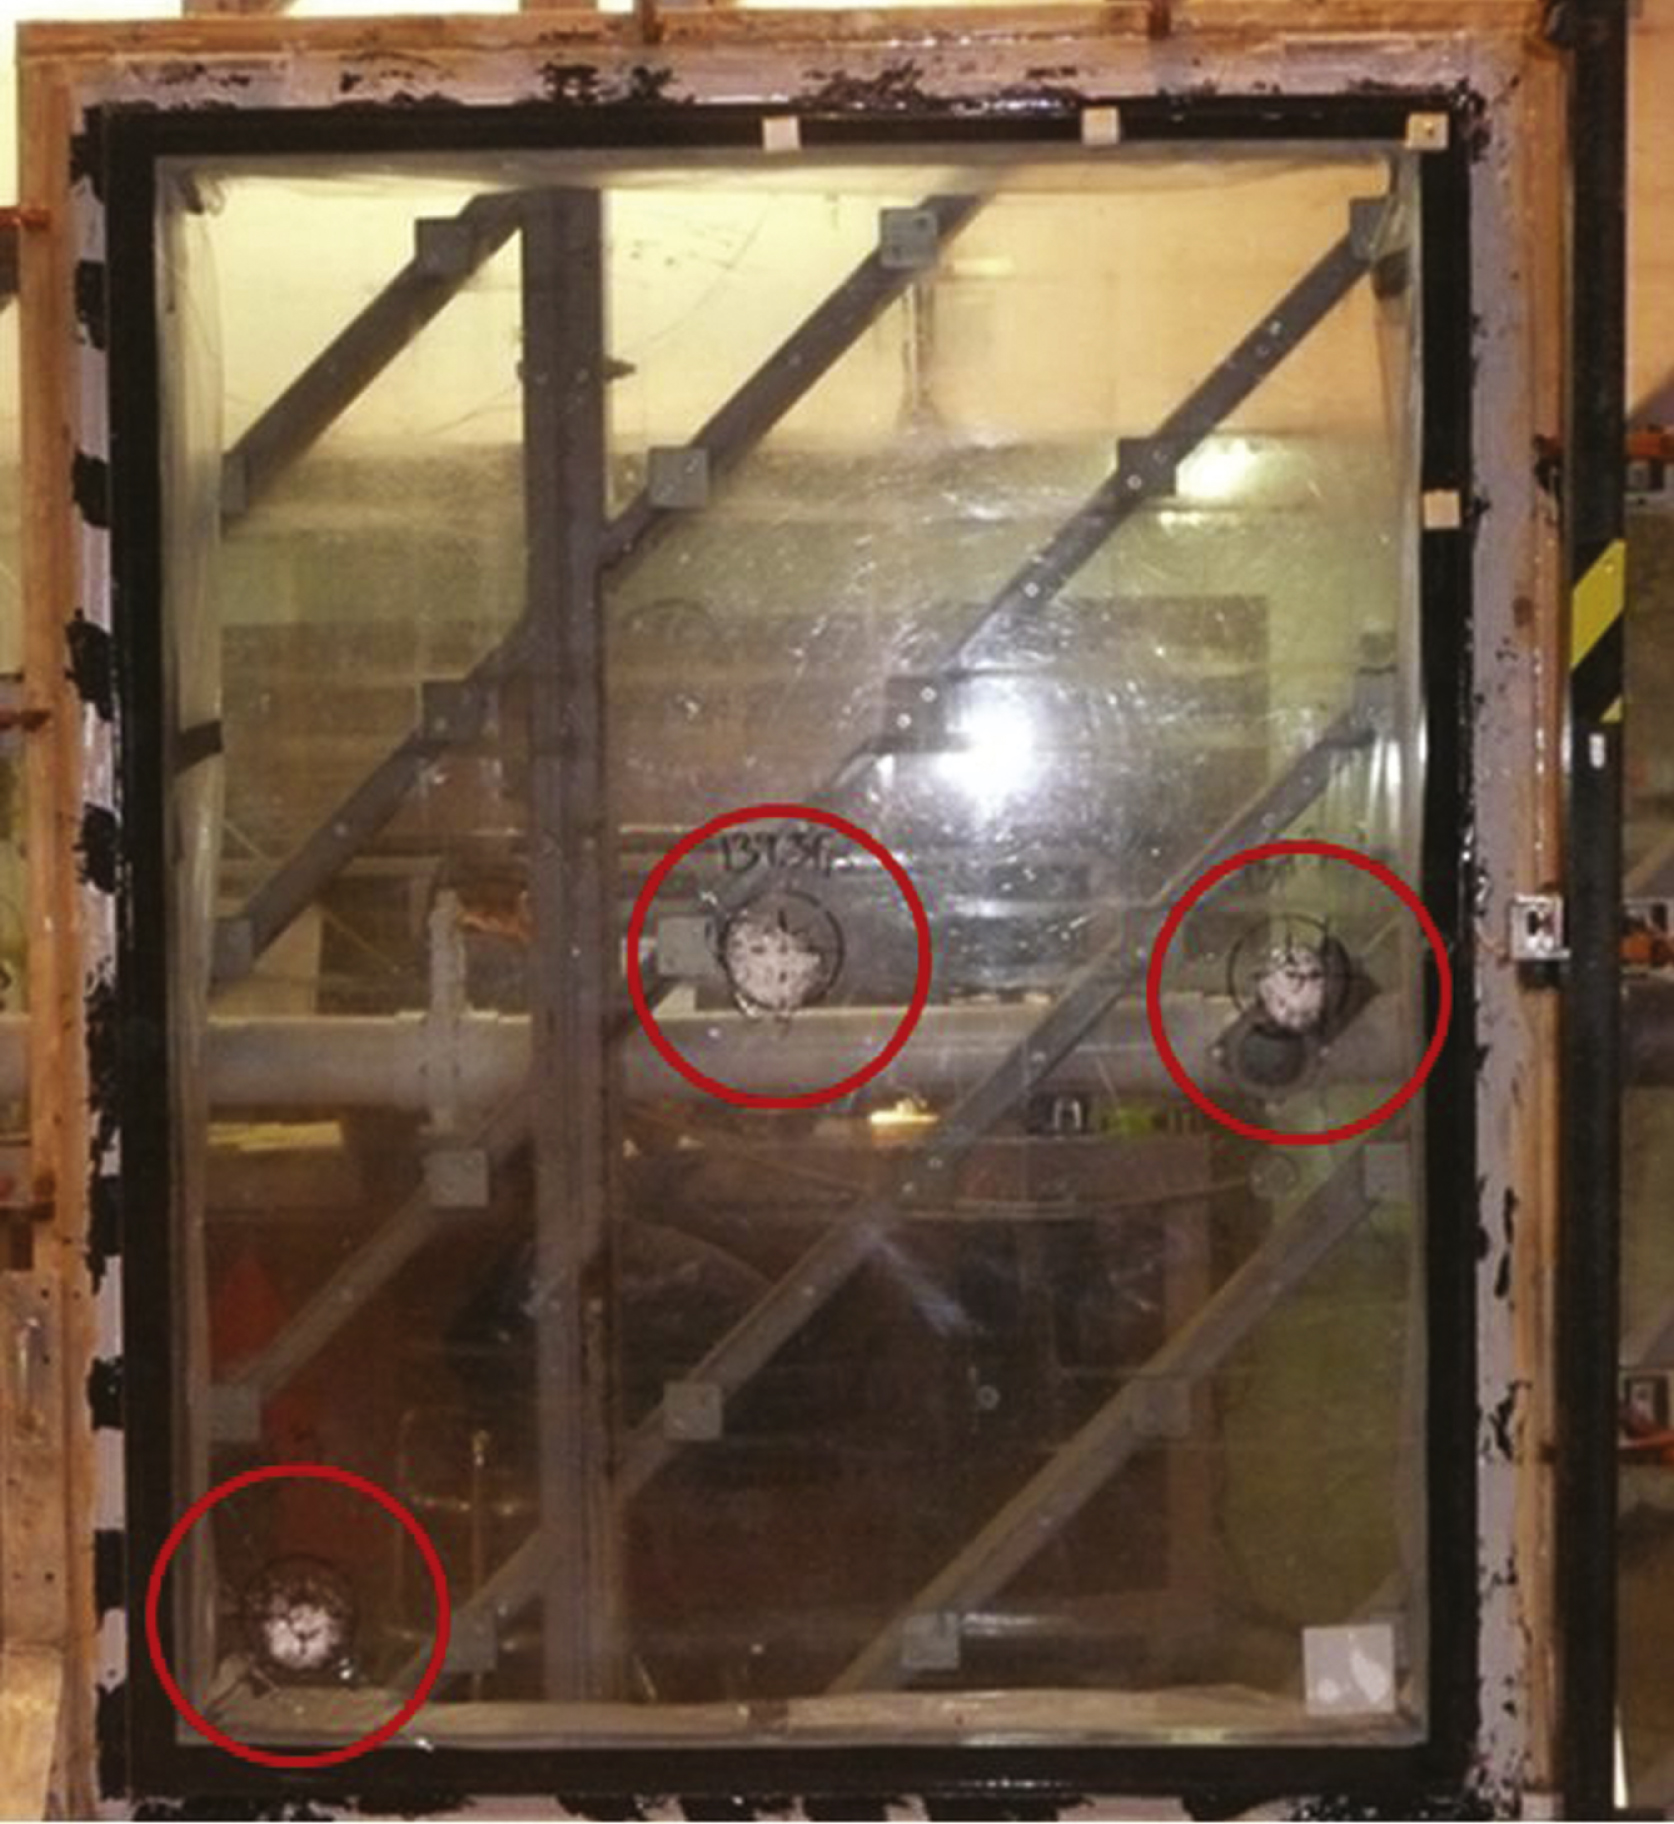
Fig.22
Small missile impact site after 9000 pressure cycles.
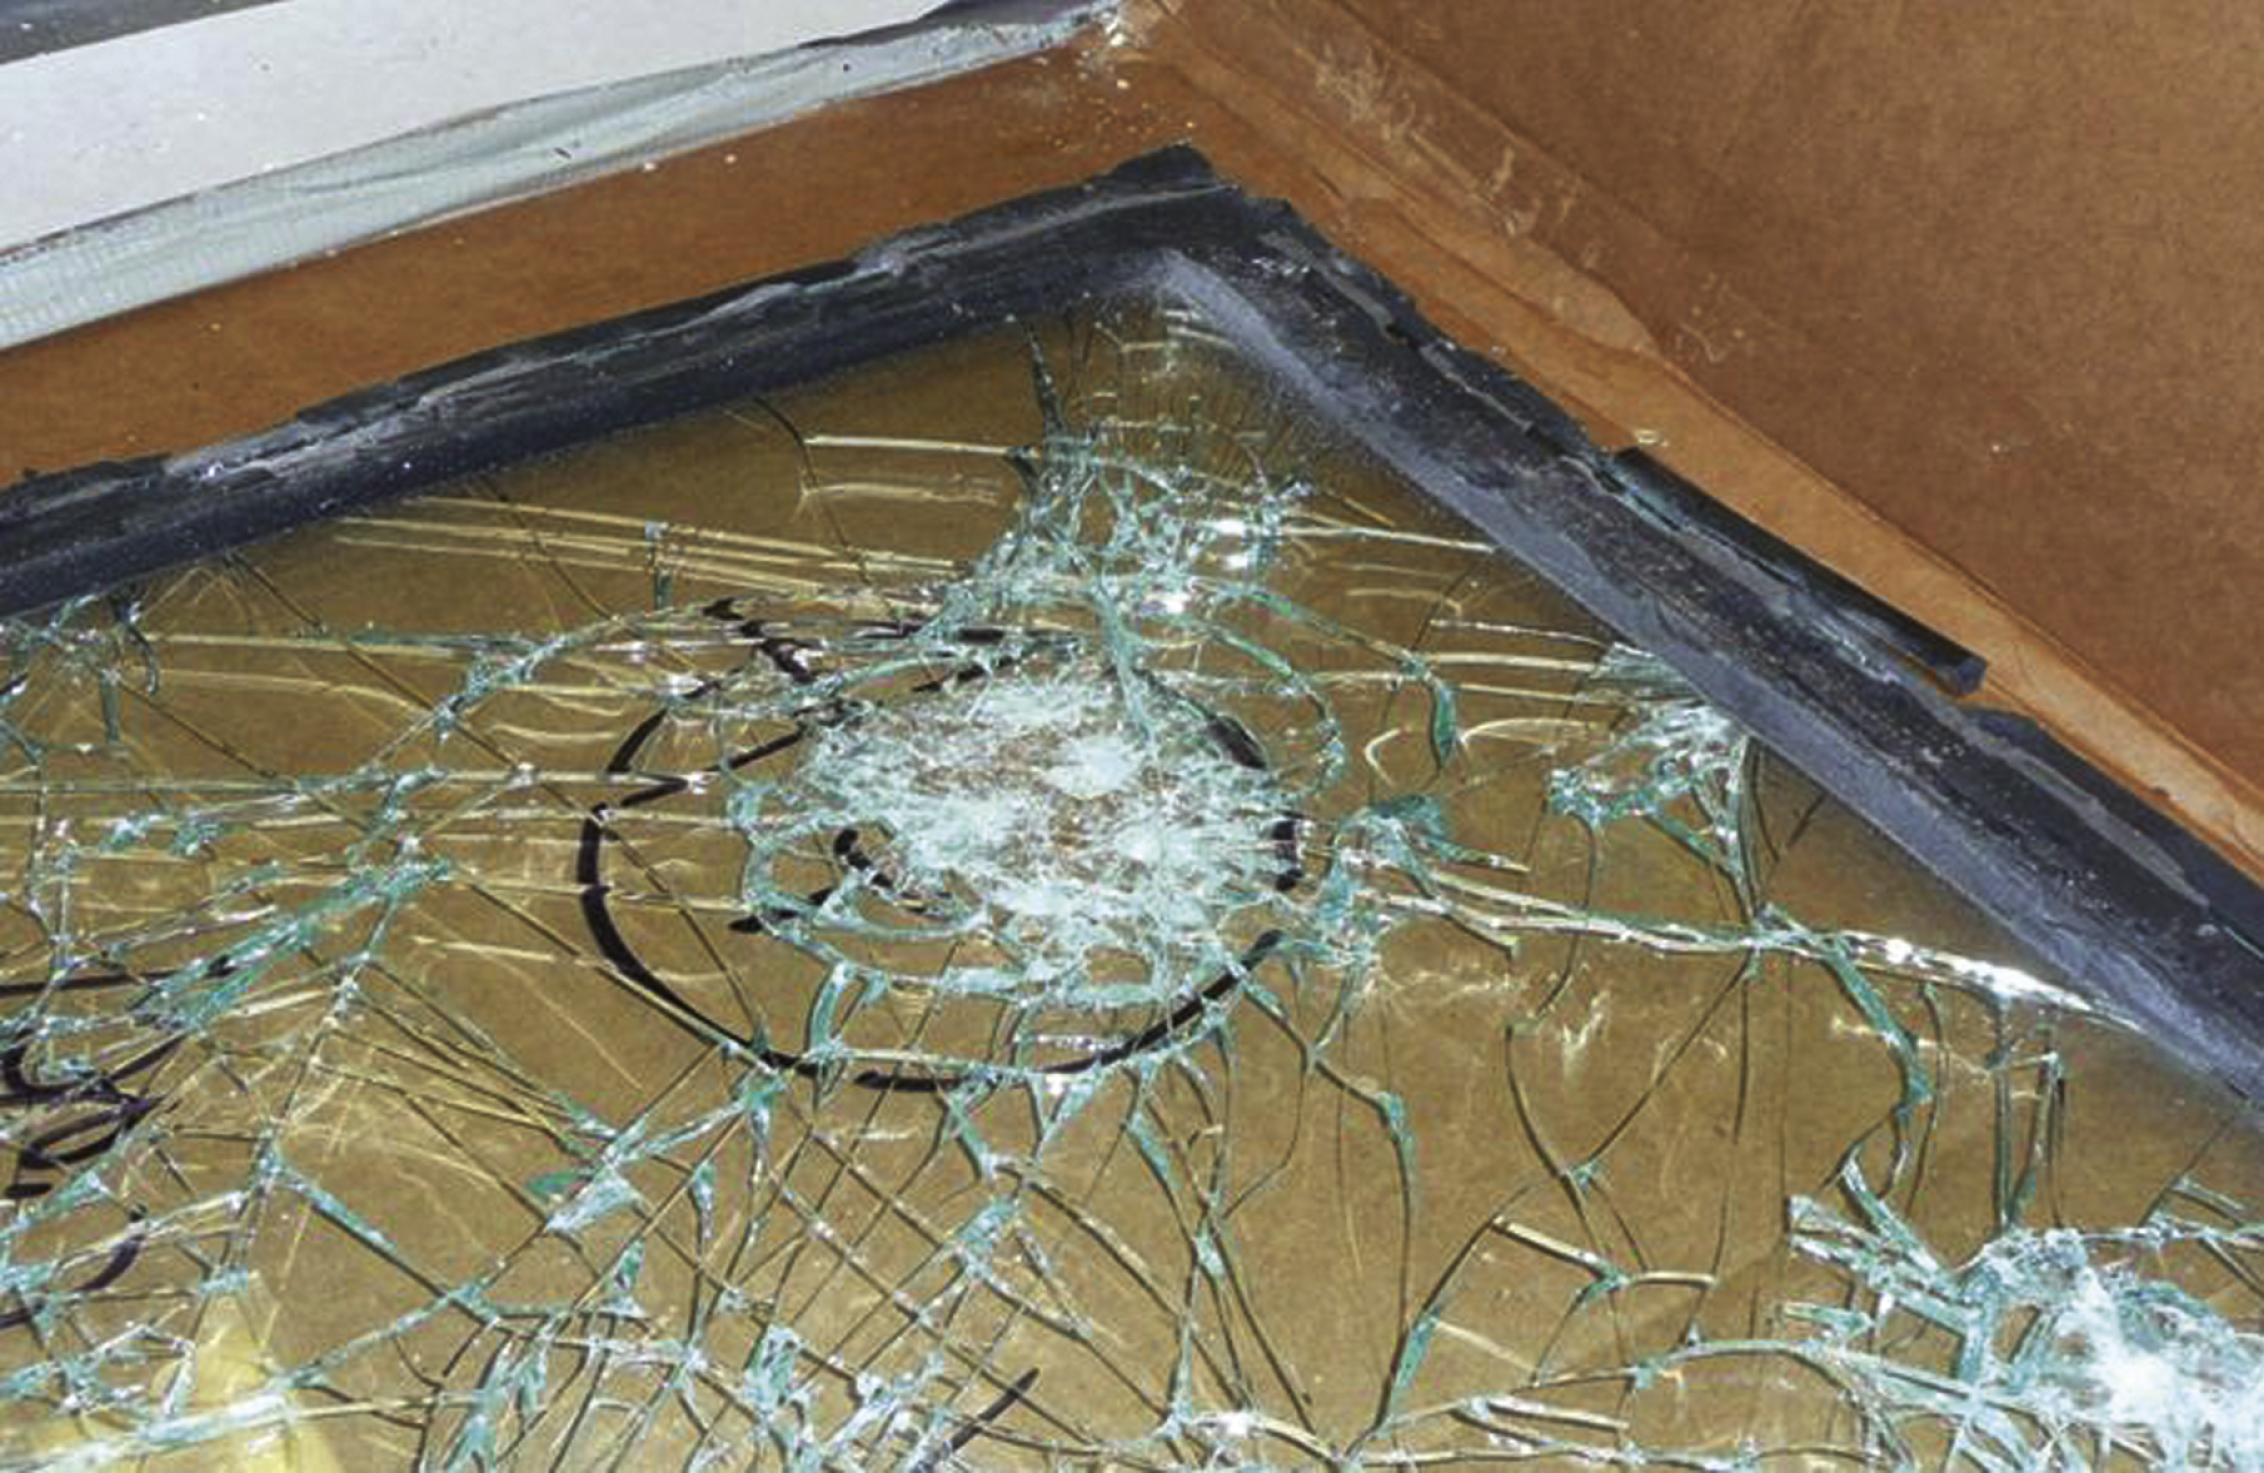
Table 1
Load error between FEA,model and silicone batch used to generate FEA data
| Error within silicone batch | |||
| Deflection [mm] | FEA Force [N] | Test Force [N] | Percent Error |
| 1.27 | 133 | 120 | 11.2 |
| 2.54 | 238 | 205 | 15.7 |
| 3.81 | 322 | 274 | 17.6 |
| 5.08 | 393 | 335 | 17.4 |
| 6.35 | 455 | 392 | 16.0 |
| 7.62 | 510 | 447 | 14.3 |
| 8.89 | 561 | 498 | 12.8 |
| 10.16 | 609 | 545 | 11.7 |
| 11.43 | 654 | 585 | 11.9 |
Table 2
Error between FEA C1135 results and results of historical silicone testing
| Error Between FEA and Silicone Batches | |||||||
| Strain (% ) | Force [N] | Percent Error | |||||
| FEA | Batch 1 | Batch 2 | Batch 3 | Batch 1 | Batch 2 | Batch 3 | |
| 25 | 133 | 173 | 200 | 162 | −22.9 | −33.3 | −17.6 |
| 50 | 290 | 352 | 347 | 282 | −17.7 | −16.4 | 2.7 |
| 75 | 455 | 573 | 533 | 429 | −20.6 | −14.6 | 6.1 |
Table 3
Cyclic pressure differential loading for 9.58 kPa (200 psf) design pressure
| Loading Sequence | Loading Direction | Air pressure cycles | Air pressure | Number of air pressure cycles |
| 1 | Positive | 0.2P–0.5P | 1.92–4.79 kPa (40–100 psf) | 3500 |
| 2 | Positive | 0.0P–0.6P | 0–5.75 kPa (0–120 psf) | 300 |
| 3 | Positive | 0.5P–0.8P | 4.79–9.58 kPa (100–160 psf) | 600 |
| 4 | Positive | 0.3P–1.0P | 2.87–9.58 kPa (60–200 psf) | 100 |
| 5 | Negative | 0.3P–1.0P | 2.87–9.58 kPa (60–200 psf) | 50 |
| 6 | Negative | 0.5P–0.8P | 4.79–9.58 kPa (100–160 psf) | 1050 |
| 7 | Negative | 0.0P–0.6P | 0–5.75 kPa (0–120 psf) | 50 |
| 8 | Negative | 0.2P–0.5P | 1.92–4.79 kPa (40–100 psf) | 3500 |
Table 4
Glass Type 1 tempered clear and PVB interlayer Protocol TAS 202–94, Static Air Pressure Tests Test Unit #1 Design Pressure: ± 9.58 kPa
| Title of test | Results | |||||
| Air Infiltration at 75.2 Pa (1.57 psf, 25 mph) | <0.18 m3/m2/hr (<0.01 cfm/ft2) | |||||
| Air Infiltration at 300 Pa (6.24 psf, 50 mph) | <0.18 m3/m2/hr (<0.01 cfm/ft2) | |||||
| Indicator Reading (mm) | ||||||
| Structural Loads | #1 Midpoint short span | #2 Top corner | #3 Quarter point long span | #4 Mid point long span | #5 Bottom corner | #6 Glass Center |
| 50% of Test Pressure 7.19 kPa (+150 psf) | ||||||
| Maximum Deflection | 2.8 | 3.0 | 3.8 | 4.3 | 3.8 | 26.9 |
| Permanent Set | 2.3 | 2.3 | 2.3 | 2.3 | 2.3 | 4.1 |
| Design Pressure 9.58 kPa (+200 psf) | ||||||
| Maximum Deflection | 3.3 | 3.6 | 4.8 | 5.6 | 4.8 | 31.8 |
| Permanent Set | 2.5 | 2.8 | 2.8 | 2.8 | 2.8 | 5.3 |
| 50% of Test Pressure −7.17 kPa (−150 psf) | ||||||
| Maximum Deflection | 4.3 | 5.1 | 5.3 | 6.1 | 5.3 | 34.5 |
| Permanent Set | 3.3 | 3.8 | 3.6 | 3.8 | 3.6 | 6.1 |
| Design Pressure −9.58 kPa (−200 psf) | ||||||
| Maximum Deflection | 4.8 | 6.1 | 6.1 | 7.9 | 6.9 | 39.9 |
| Permanent Set | 3.6 | 4.3 | 3.0 | 4.1 | 3.8 | 6.1 |
| Water Infiltration | ||||||
| 15% Positive Design Pressure | No Penetration | |||||
| 1.44 kPa (+30 psf) | ||||||
| Test Pressure 14.37 kPa (+300 psf) | ||||||
| Maximum Deflection | 7.9 | 9.4 | 11.2 | 12.4 | 10.9 | 44.5 |
| Permanent Set | 5.8 | 6.9 | 7.1 | 7.6 | 7.4 | 9.9 |
| Test Pressure −14.37 kPa (−300 psf) | ||||||
| Maximum Deflection | 3.8 | 5.6 | 7.4 | 8.1 | 6.9 | 45.5 |
| Permanent Set | 0.8 | 1.3 | 1.0 | 1.0 | 0.8 | 4.6 |
| Forced Entry - ASTM F 588–07 | Pass | |||||
Table 5
Glass Type 2 tempered clear and SGP interlayer Protocol TAS 202–94, Static Air Pressure Tests Test Unit #2 Design Pressure: ± 9.58 kPa
| Title of Test | Results | |||||
| Air Infiltration at 75.2 Pa (1.57 psf, 25 mph) | <0.18 m3/m2/hr (<0.01 cfm/ft2) | |||||
| Air Infiltration at 300 Pa (6.24 psf, 50 mph) | <0.18 m3/m2/hr (<0.01 cfm/ft2) | |||||
| Indicator Reading (mm) | ||||||
| Structural Loads | #1 Midpoint short span | #2 Top corner | #3 Quarter point long span | #4 Mid point point long span | #5 Bottom corner | #6 Glass Center |
| 50% of Test Pressure 7.19 kPa (+150 psf) | ||||||
| Maximum Deflection | 4.6 | 5.3 | 6.1 | 6.6 | 4.6 | 21.1 |
| Permanent Set | 2.8 | 3.3 | 3.0 | 3.3 | 2.8 | 3.0 |
| Design Pressure 9.58 kPa (+200 psf) | ||||||
| Maximum Deflection | 5.3 | 6.1 | 7.4 | 8.1 | 5.6 | 25.7 |
| Permanent Set | 3.3 | 3.8 | 3.8 | 3.8 | 3.0 | 3.6 |
| 50% of Test Pressure −7.17 kPa (−150 psf) | ||||||
| Maximum Deflection | 2.8 | 2.5 | 4.1 | 4.8 | 4.6 | 22.6 |
| Permanent Set | 1.5 | 0.8 | 1.3 | 1.8 | 2.5 | 2.3 |
| Design Pressure −9.58 kPa (−200 psf) | ||||||
| Maximum Deflection | 3.8 | 3.8 | 5.8 | 6.6 | 5.8 | 27.7 |
| Permanent Set | 1.8 | 1.5 | 2.0 | 2.3 | 2.8 | 3.0 |
| Water Infiltration | No penetration | |||||
| 15% Positive Design Pressure | ||||||
| 1.44 kPa (+30 psf) | ||||||
| Test Pressure 14.37 kPa (+300 psf) | ||||||
| Maximum Deflection | 6.9 | 8.1 | 10.2 | 11.2 | 7.9 | 33.3 |
| Permanent Set | 3.8 | 4.6 | 4.3 | 4.6 | 3.3 | 4.1 |
| Test Pressure −14.37 kPa (−300 psf) | ||||||
| Maximum Deflection | 6.4 | 7.4 | 9.7 | 11.2 | 8.6 | 36.6 |
| Permanent Set | 2.3 | 2.3 | 2.8 | 3.0 | 3.6 | 3.8 |
| Forced Entry - ASTM F 588–07 | Pass | |||||
Table 6
Glass type 3 heat strengthened clear and SGP interlayer protocol TAS 202–94, Static Air Pressure Tests test unit #3 design pressure: ± 9.58 kPa
| Title of Test | Results | |||
| Air Infiltration at 75.2 Pa (1.57 psf, 25 mph) | <0.18 m3/m2/hr (<0.01 cfm/ft2) | |||
| Air Infiltration at 300 Pa (6.24 psf, 50 mph) | <0.18 m3/m2/hr (<0.01 cfm/ft2) | |||
| Indicator Reading (mm) | ||||
| Structural Loads | #1 Top Corner | #2 Mid Point long span | #3 Bottom Corner | #4 Glass Center |
| 50% of Test Pressure 7.19 kPa (+150 psf) | ||||
| Maximum Deflection | 6.6 | 6.6 | 4.1 | 16.8 |
| Permanent Set | 1.0 | 1.3 | 1.5 | 1.3 |
| Design Pressure 9.58 kPa (+200 psf) | ||||
| Maximum Deflection | 7.1 | 8.1 | 5.6 | 21.1 |
| Permanent Set | 1.0 | 1.5 | 1.8 | 1.5 |
| 50% of Test Pressure −7.17 kPa (−150 psf) | 0.0 | |||
| Maximum Deflection | 2.8 | 5.8 | 6.4 | 19.6 |
| Permanent Set | 0.5 | 0.8 | 0.8 | 1.3 |
| Design Pressure −9.58 kPa (−200 psf) | ||||
| Maximum Deflection | 5.6 | 8.6 | 8.1 | 23.1 |
| Permanent Set | 1.5 | 1.5 | 1.5 | 1.5 |
| Water Infiltration | No Penetration | |||
| 15% Positive Design Pressure | ||||
| 1.44 kPa (+30 psf) | ||||
| Test Pressure 14.37 kPa (+300 psf) | ||||
| Maximum Deflection | 9.1 | 11.4 | 8.1 | 29.2 |
| Permanent Set | 1.3 | 1.5 | 1.5 | 2.0 |
| Test Pressure −14.37 kPa (−300 psf) | ||||
| Maximum Deflection | 7.6 | 11.9 | 10.2 | 29.7 |
| Permanent Set | 1.5 | 2.0 | 1.3 | 1.0 |
| Forced Entry - ASTM F 588–07 | Pass | |||

