
Innovative design tool for the optimization of blast-enhanced facade systems
Abstract
In current blast enhancement design strategies, to resist the effects of an accidental explosion, a facade system is commonly designed to behave in-elastically and undergo large deformations. The large deformation of the facade system leads to high blast energy dissipation, subsequently reducing the blast energy transferred to the main structure. In addition to the blast resistance of the facade system, human injuries due to glass fragmentation within the vicinity of the facade system should also be minimized in order to meet the required safety levels. Overall building safety can be optimized by balancing blast energy dissipation and glass fragmentation. Recently, Permasteelisa Group has developed an innovative design tool to optimize blast-enhanced facades using an equivalent MDOF approach. A novel fragmentation tool has been proposed to assist this design procedure. This paper presents various critical parameters considered in blast-enhanced facade analysis, the experimental validation of these parameters and their influence in the design optimization process.
1Introduction
Threats to building occupants due to blast loads generally result from a combination of blast overpressure injuries due to a breach of the facade system and glass fragmentation injuries. As witnessed in the Oklahoma City bombing in 1995, approximately 40% of laceration and abrasion injuries were attributed to glass fragmentation (Norville et al., 1999). Current blast design related practices commonly refer to achieving a balanced design that is essentially focused on strength limit states whereby in a structural system subjected to blast, no element is appreciably weaker than the element that it supports, thus minimizing the risk of progressive collapse (Hinman, 2011). From the perspective of both structural integrity and human safety, a true balanced design requires a combination of both energy dissipation and glass fragment retention (Zobec et al., 2012). The Polyvinyl Butyral (PVB) interlayer used in laminated glass exhibits substantial fragment retention and post-elastic viscous deformation capacity. Given the combination of these two behavioural effects, laminated glass is the preferred glazing solution for blast-enhanced facades.
Figure 1 describes the various glass hazard classification levels according to ISO 16933:2007(2007). As the glazing is ruptured by the blast shock wave, numerous glazing fragments are projected into the occupied room. Limits for Low and High hazard regions have been defined according to the kinetic energy of the glass shards and most frequently occurring physiological damage thresholds. Eye injuries are presumed to occur at energy levels as low as 0.06 J/mm2 or shard velocities of approximately 2 m/s (Low Hazard). Similarly, the potential for skin tissue penetration is presumed to occur at glass fragment kinetic energy levels of around 0.1 J/mm2 or approximately at shard velocities of 9 m/s (Marchand et al., 2006), although this value has been found to vary significantly between annealed and toughened glass tests. In blast resistant facade design, the fragmentation hazards or spall is often the limiting factor, whilst the viscous-elastic energy dissipation can be maximized by the use of the PVB laminates. As a result, second generation blast-enhanced facades are usually referred to as being dissipative due to beneficial effects in terms of mitigating impulse transfer, but whilst it is obvious that hazard protection is still the dominant blast performance requirement, conformance to this criterion may in certain circumstances be detrimental for design optimization. None the less, performance criteria definitions are required in terms of impulse and energy reduction as building owners and occupants are increasingly requesting that the facade system is designed such that in the event of a blast the magnitude of peak reactions transferred to the main structure are minimised.
Currently, there is no consensus on the ultimate failure mode of cracked laminated glass due to large displacements. WINGARD 5.5 considers the primary failure mechanism for laminated glass to occur when the lateral in-plane edge displacement of the glass membrane exceeds twice the framing rebate depth based on arena tests of non-structurally glazed windows. Ellis (1991) and Ellis & Beak (1992) undertook water-bag testing of laminated glass panes to failure and reported the failure displacements and modes. The most common failure mechanism was cutting of the PVB membrane at the glass-frame edge interface due to excessive end rotations (Morison, 1999), generally dependent on the short span of the laminated glass and of the total thickness of the interlayer.
To take into account the sensitivity of the glass strength to the strain rate, Norvillle & Conrath (2001) have proposed a method to equate blast loads with an equivalent three second wind gust, enabling glazing make-up selection based on the glazing design standard ASTM E 1300–12 (2012). The inclusion of monolithic and laminated glass into a single method assumes that glass sizing is based on surviveability up to or just at the point of cracking (Morison, 2007). The method does not take into account large PVB deformations and energy dissipation. Thus, the design approach is overly conservative and uneconomical. The design of individual facade elements based on a ‘safe’ equivalent static load is straight forward and allows the analysis to be carried out rapidly. However, this approach is not capable of taking into account the dynamic interaction between the components of the facade system. Dynamic FEM analysis is the most accurate analysis tool but it often requires long computation time. The reliability of results is also limited to the accuracy of the input parameters. Under dynamic and impulsive loads, materials used in facades exhibit marked strain-rate dependent behaviour that must be considered and accurately modelled.
Equivalent SDOF methods have been used to analyse glass plates subjected to blast since its inception by Newmark (1956). The method requires two important parameters: the mass transformation factor and the resistance function. An accurate displaced shape is required to estimate the mass transformation factor, whilst the resistance function is dependent on stiffness parameters and the ultimate failure displacement. For a true balanced design that considers both resistance and building occupant safety, a rapid design tool capable of incorporating a dynamic analysis as well as accurately assessing the projection of glass fragments is required. The Permasteelisa Group has recently developed a glass fragmentation hazard tool used in conjunction with a FEM code, in order to improve the design optimization process as shown in Fig. 2.
This paper initially outlines the distinctive background of the analysis method used with current approaches. Secondly, the results of original research outcomes derived from testing of laminated glasses of various thicknesses, treatments and aspect ratios and critical parameters affecting performance are established. The findings include equivalent interlayer post elastic properties, transformation factors and allowable post cracked laminated glass deflection limits. During dynamic analysis and subsequent hazard level assessment, the glass fragment size is identified as the key parameter affecting the results of the tests. This parameter also has a significant influence during the various stages of the design process. Finally, an original fragmentation model, implemented in the analysis tool is presented.
2SDOF approach and MDOF models
2.1SDOF & MDOF
The equivalent SDOF method commonly used in dynamic analysis is based on initial research work by Biggs (1964). Biggs defined transformation factors of several structural elements based on the hypothesis that the behaviour of an element under dynamic conditions can be represented by its deflected shape under static load. For a uniformly loaded plate with centre displacement w C , varying with time, a unique possible configuration for the displacement function U(x,y,w C ) could be derived at any displacement position w C . The instantaneous position of every point on the surface could be derived as a function of the centre position w C , knowing the free parameter or degree of freedom. The approach is a simple variation of the modal analysis method for the solution of the linear dynamic problem. Unlike the modal analysis method, one main advantage is that the SDOF method can easily be extended to account for inelastic system behaviour.
Once the proper constraint function is selected, U(x,y,w c ) (which expresses, under general non-linear conditions, the three components of the displacement vector at position (x,y), versus the centre deflection), by the principle of virtual work it can be shown that the equilibrium of the system can be represented by a single second order differential equation:
(1)
(2)
It can be demonstrated that (1) is applicable when damping and mass are distributed homogeneously along the surface or by the same distribution function. As stated by Biggs (1964), the resistance function is presented as the resistance of the plate under static load related to the static deflection matching the instantaneous centre deflection w C (t). However, equation (1) is an approximation because a second inertia term has not been taken into account.
The described approach for surface elements is used to reduce the continuous glass behaviour into a SDOF system. However, the concept can be extended by coupling the structural behaviour of various facade elements resulting in MDOF models representing the overall interactive facade behaviour (Fig. 3).
2.2SDOF: Laminated glass resistance function
When applied to laminated glass, the SDOF approach described by the equation (1) must consider its various behaviour phases. Figure 4 describes the static resistance versus displacement relationship of a typical single laminated glass pane. The glass behaves elastically up to point 1, where the deflection of the inner glass lite reaches its (non-linear) design strength limit. Subsequently, resistance is provided by the remaining external glass lite. Once the external lite breaks, the remaining polyvinylbutyral (PVB) interlayer resists the external load, in combination with the residual stress capacity and stiffening effect still exerted by the broken glass. In this region of the resistance curve, the experimental investigation plays a fundamental role for two main reasons:
• There are limited studies into the post cracking behaviour of laminated glass due to previous focus on the elastic behaviour of the material.
• Dynamic analysis is usually carried out considering elastic-plastic behaviour in lieu of viscoelastic.
Bennison et al. (2005), Morison et al. (2007), Hooper et al. (2012) and (Kuntsche et al. (2014) undertook testing of PVB samples under various strain rates. These tests showed that for increasing strain rate, the stress-strain behaviour undergoes a behavioural transition from viscous-elastic to bi-linear (distinct ‘yield’ transition and subsequent plateau). In order to effectively analyse membrane behaviour after point 2, a solver capable of analysing the bi-linear stress-strain behaviour must be adopted. The bi-linear behaviour of the PVB under high strain rates can be seen in Fig. 4, where the translationally restrained membrane resistance exhibits a resistance transition at point 4 due to progressive ‘yielding’ of the PVB membrane along the supports.
Morison (2007) compared the tensile properties of bare PVB membranes and cracked laminated glass under high strain rate tests. It was noted that the glass fragments have a stiffening effect on the membrane. Based on back analysis of blast arena tests of single laminated glass, he derived a mean glass fragment-stiffening ratio of 3.8. Based on water-bag testing of laminated glass panels undertaken by Ellis (1991) and Ellis & Beak (1992), Morison statistically derived the relative failure displacement (RFD) (point 4), as 27.8% of the short span based on a 90% confidence limit for 7 glass samples.
However, given the limited number of glass panes tested including dimensions, thicknesses and glass heat treatment, a need for further investigations remained; in particular the need to accurately define laminated glass resistance functions (particularly in the post-cracked region), which is fundamental for use in SDOF analysis.
Though post-cracked laminated glass behaviour under dynamic conditions differs significantly from the response under static loading, the results of water-bag tests are of major importance for the application of the SDOF approach to blast loading of laminated glass:
- The shape function used for the evaluation of the transformation factors is the deformed shape under static loading.
- The relative failure displacement under static loading is expected to be a safe estimation of the relative failure displacement under blast loading, as the average size of the fragments is larger and then the probability of cutting at the edge is higher.
- As shown by Morison (2007), an empirical correction method can be applied in order to derive the stiffened laminated glass properties under high strain rates, starting from the knowledge of the PVB high strain rate properties, the static properties of the laminated glass and the estimation of a bonding factor, which gives the percentage of the average surface area still ‘bonded’ by the interlayer during the post-breakage deformation.
3Experimental investigations into the post-cracking behaviour of laminated glass
Permasteelisa, in collaboration with the University of Technology of Sydney and The University of Melbourne, undertook an extensive water-bag testing program (Fig. 5). A statistically broad number of samples of various glass thicknesses and heat treatments have been considered in order to derive relative failure displacement values. Furthermore, the deflected shape of the glass was progressively mapped at various displacement intervals in order to derive the non-linear shape as well as the stiffening effects of glass fragmentation. Non-linearity effects as a result of non-uniform water pressure distribution due to the varying water head; g, over the glass surface were identified and corrected using a numerical FEM calibration procedure (Lumantarna et al., 2012). Current methods to derive the transformation factors in the post-cracked phase assume the PVB to behave as a pure membrane with no effects of glass fragmentation on shape.
3.1Relative failure displacement
The water-bag tests have highlighted the significance of glass fragment sizes on relative failure displacements (RFD). For annealed (ANN) glass, two primary modes of failure were noted; edge cutting due to excessive rotation and tearing of the PVB over the surface of the glass. The Cumulative Distribution Functions (CDF’s) for both failure modes displayed close statistical mean and standard deviation correlation. Hence, the RFD of the respective panels is derived based on the total number of samples.
It was observed that the fragmentation size has a significant influence. Smaller fully toughened (FT) glass fragments resulted in greater overall PVB strain distribution and hence lower local stress concentrations. Due to limitations in the test rig displacement measuring capacity, no failures were noted for FT glass with minimum RFD values of 36% of the short span. For annealed glass, as fragment sizes increased with thickness, RFD was noted to be inversely proportional to glass thickness.
3.2Shape and transformation factors
Incremental displacement plots of the broken laminate were mapped using photogrammetry techniques. A numerical FEM calibration technique was used to correct the variation in water pressure head across the glass surface and hence the non-uniform water pressure to derive the load-mass (K LM ) transformation functions. Equivalent stiffness values were derived from the FEM models by fitting the membrane displacements to the test displacements. Consequently, for uniform pressure, the equivalent cracked laminated glass stiffness values were used to calculate the displaced shape for progressive displacements and compared with a pure PVB membrane. The results show that for increasing displacements, K LM for the annealed glass approaches that of FT glass. For small displacements of 50 mm, K LM,ANN < K LM,FT = 0.88 whilst for large displacements of 400 mm, K LM,ANN = K LM,FT = 0.95. With regards to the effects of membrane shape, transformation factors for both cracked laminated FT & ANN glass exhibits close correlation with pure PVB membrane properties and hence when deriving post cracked non-linear PVB transformation factors under uniform loading, pure membrane analysis is valid. Fig. 7 at this purpose shows firstly how the K LM,ANN derived by the model for the water pressure is near to the value from the ANN glass experimental results and then how the Bare PVB model for uniform pressure and the ANN glass model for uniform pressure has a perfect correlation in terms of K LM trend versus the glass centre deflection.
3.3PVB stiffening effect
At low strain rates, Polyvinyl butyral (PVB), exhibits visco-elastic properties. Morison et al. (2007) , Iwasaki et al. (2006, 2007) and Bennison et al. (2005) undertook high strain rate testing of PVB and noted that as the strain rate increased the stress-strain relationship changes from viscous-elastic to bi-linear, exhibiting a distinct elastic range with a ‘plastic’ tangential plateau. These tests were carried out using bare PVB only without the effect of glass fragmentation. Layered laminated glass strip FEA models were analysed using LS-DYNA. In contrast to Morison (2007), who uses an arbitrary bonding factor that describes the percentage of PVB that would remain adhered to the glass fragments under minimal strain, the FEA models in the analysis consist of a layered glass-PVB tensile model with varying percentages of exposed PVB versus laminated glass ratio C, and is expressed as the initial ratio of PVB that can be effectively strained or mobilized. The cracks were set as gap elements with an initial 0.5 mm crack opening, which is consistent with the experimentalevidence.
Hence, C = 1 assumes that 100% of the PVB is unconstrained and thus will have bare PVB strain rate dependent properties. At C = 0, it was assumed that no PVB can strain and hence the stiffness of the model is that of the glass; E Glass = 70 000 MPa. Material properties used in the model are as presented by Morison et al. (2007) .
Three (3) PVB strain rate properties were modelled; quasi static 0.07 s−1, 16 s−1 and 30 s−1, with values for 16 s−1 hypothesised by Morison (2007) superimposed for bonding factors from 0 to 25% showing good correlation to the model.
For the normal range of glass spans and thicknesses loaded close to failure, PVB membrane strain rate is typically in the region of10 s−1. This value can be easily estimated evaluating the elongation of the membrane for a certain peak centre deflection in comparison with the time duration of the centre displacement time history up to the peak. Comparing back analysis from blast trials, Morison noted that the value of PVB glass fragment stiffening ratio varied from 0.6 to 7.1, with a mean value of 3.8. Based on a typical strain rate of approximately 10 s−1 for laminated glass plates under typical blast loads, this equates to mean PVB design properties corresponding to a strain rate of 38 s−1 (40 s−1 for simplicity). This is a rough initial estimation, which requires further research and states that a stiffened post breakage behaviour of a laminated glass can be expressed by means of a PVB equivalent Young’s modulus (for the first linear range of stress-strain behaviour) of around 264 MPa. In contrast WINGARD proposes a value of 345 MPa. For initial conservative analysis a value of 220–250 MPa is recommended.
4The dissipative role of the facade
Knowledge of the post cracking behaviour of laminated glass is important in order to design a facade that performs as required in terms of maximizing hazard protection and blast energy dissipation. Whilst maximizing hazard protection (which will be discussed in the subsequent chapter of this paper) is well understood and protection strategies and requirements have been defined by various statutory organizations over the past twenty years, blast energy dissipation is not yet clearly defined.
Although second generation blast-enhanced facades are currently being optimized emphasizing blast energy dissipation, clear guidelines on how to best evaluate dissipative effects do not yet exist. By contrast, building owners are currently defining in project specifications specific performance requirements in terms of reaction reduction, strictly related to actual specific limitations of the main structure in its ability to transfer facade loads. As a result, there is a real need for clarification and design criteria should be specified more effectively in order to classify the dissipative performance of blast-enhanced facades.
The initial question that needs to be addressed, is whether or not characterizing the facade in general terms, as being ‘dissipative’ is an appropriate term? How much quantifiable energy does the facade need to dissipate?.
It is true that a significant proportion of blast energy is dissipated through plastic and viscous-elastic deformations of the facade components as well as damping effects, but the most important role performed by the facade is the ‘postponement’ of energy transfer or rather effectively distributing the blast impulse over a longer time duration. This effect is particularly beneficial with regard to load transfer to the main structure. As a result each mechanical component of the facade is subject to less severe loading when the same impulse can be absorbed over a longer time (as can be evidenced by the iso-damage curves behaviour). Inertial effects play an important role in reducing the reaction transfer at the initial facade response phase, whilst the plastic/visco-elastic deformations are the primary factors that result in specific force reductions during the secondary phase, when the inertial effects commence to be detrimental.
In general the facade can be seen as a system capable of transforming the blast input duration and peak pressure over a different combination of the two parameters, but for the majority of cases without significant changes to their product (impulse). For this purpose Fig. 9 describes the effect of transfer from the Blast Load (BL) to an Equivalent Reaction Load (ERL) of a lower iso-damage level.
For instance, Fig. 10 and Fig. 11 describe the reaction time histories transferred to the structure for two different glazing configurations as well as differences in the complexity of the facade analytical model subjected to blast load condition, GSA D. The difference between the two glazing configurations remains in the use of annealed or tempered glass. The first three analytical models are (Multiple-Degree-of Freedom) MDOF whose component deformability is (1) only glass is deformable, (2) both glass and supporting mullions are deformable and (3) glass, mullions and bracket (dissipative) are deformable. Model 3 involves a bespoke two-step modelling procedure, combining the MDOF glazing reaction history analysis and subsequently using this load file to model the facade framing members behaviour using FEA.
Tables 1 and 2 summarize the results in terms of two indices:
- IR, the impulse ratio, that is the ratio between the blast input impulse and the reaction impulse (per square meter) output transferred by the facade, evaluated over the first half cycle in the event of oscillating reactions.
- RRR is the Reaction Root Mean Square (RMS) Ratio, that is the ratio between the RMS of the input pressure and the RMS of the reaction time history (per square meter) evaluated over the first half cycle in the event of oscillating reactions.
The use of annealed glass is interesting to note as the impulse ratio remains around a unitary value, whilst the beneficial effect increases proportionally as other deformable (retardant) components are also simulated. By contrast, the use of tempered or fully toughened (FT) glass reduces the beneficial effect of the facade in terms of RMS reaction reduction in addition to a certain degree of impulse amplification. Although different outlooks are present in the literature, the authors believe that for this reason tempered or FT glass is detrimental with respect to the mitigation strategies, at least in terms of blast reaction transfer. Obviously completely different evaluations of the two types of glass behaviour can be given according to protection performance requirements.
Finally it should be noted that the RRR parameter properly expresses the beneficial effect of the dissipative role of the facade when quasi-static criteria are used for the design of the support structure (main building structure), whilst additional considerations in terms of frequency behaviour must be addressed when dynamic responses are not negligible and critical resonances could be further excited.
5An original fragmentation model
Where applied to laminated glass, current flight models for glass hazard assessment have generally proven to be overly conservative (Marchand et al., 2006). This results in an uneconomical design with regards to both physical performance and architectural aesthetics.
In response to such cost impacts as well as hazard level assessment reliability, a fragmentation tool has been developed based on the stochastic behaviour of glass, fracture mechanics principles for crack tip opening and strain energy density in order to derive the major characteristics of the fracture pattern.
The targets of the investigation are to understand the:
- presence of the average number and initial depth of Griffith flaws in the glass
- properties of the local glass surface strength distribution function
- crack opening progression
- bifurcation condition.
Two factors are required in order to define the most important features for a new hazard level assessment model. They are:
- average size and distribution of the fragments
- fragment surface velocity and acceleration conditions.
5.1Fragmentation model fundamentals
The fragmentation model can be considered to follow three major phases: crack opening condition, crack progression and finally the checking of fragment detachment conditions. After fragment detachment (should detachment occur), a 4th phase consists of an assessment of shard projectile motion based on gravitational and initial velocity conditions at detachment.
The average number and distribution of Griffith flaws is a function of the glass surface area as shown in Haldimann (2006). During model simulation, the defined number of Griffith (1921) flaws is randomly and uniformly distributed over the glass surface. Each of these flaws is characterized by design strength, according to a normal strength distribution with mean value and standard deviation (Morison, 2007).
A dynamic FEM analysis is then executed. In contrast to conventional analytical approaches, importance lies in understanding velocity and acceleration conditions as well as the glass surface strain and stress distribution. It should be noted that the accuracy and hence reliability of the SDOF method diminishes with the influence of higher vibration modes.
During dynamic analysis, if local stresses exceed the glass strength, crack propagation is initiated. Propagation is governed by the Griffith Energy balance criterion:
(3)
If one or more fragments have an average inertial force greater than the interlayer-glass adhesive resistance, the fragment detaches with a projectile path in accordance with the translational and rotational components derived from the velocity distribution over the fragment surface. Roughly the condition can be expressed as:
(4)
5.2Compliance comparison with previous research
The accuracy of the fractal approach used to simulate the fracture pattern has been compared to previous research using the fragment distribution versus the average size (root square of the area) (Grady, 2008), (Neda et al., 1993) and is shown to closely correlate with the typical distribution exponential.
5.3Comparisons
A set of 87 experimental blast tests (WINGARD (ARA), 2005; VIRACON, 2004; Beauchamp and Matalucci, 1998) of structurally silicone retained single and double glazed units compared the test samples GSA hazard level ratings with the simulated hazard assessments derived using the proposed new fragmentation tool. Results show good correlation, and it should be noted that the model was calibrated based on small-medium sized glass window samples. Further simulation using larger glass sizes typical of building modulations and floor heights is necessary. Glass panel heights of 6 m are not uncommon for bespoke commercial buildings particularly foyer and entrance areas.
Final comparative statistics are described in Fig. 14, where the GSA error is the difference between the predicted hazard and tested hazard levels; a negative number denoting under prediction of glass hazard levels. More than 52% of the estimations resulted in no error, with analysis correlating closely to testing. Less than 10% resulted in unsafe predictions, whilst less than 5% of the predictions were deemed to be extremely unsafe (−3 levels). Those error magnitudes are comparable with the errors reported by WINGARD technical manual and they appear adequate for a quick assessment tool, especially when considering the large number of random variables influencing the phenomenon.
6Beyond current standards
Current standards used for hazard level assessment in commercial buildings, have origins based on common experimental military applications. Direct application to continuous facades should consider typical civilian occupancy and usage in terms of the number of persons, relative positions and distances from the facade. There should be a distinction in hazard level classification for podium facades typically characterized by large vertically spanning glass units with crowded though transient movement of persons in contrast to typical office conditions where occupants may be stationary for extended time periods.
Figure 15 represents the Isodamage curves B/S (breaks safely), interlayer rupture and high hazard according to the new fragmentation tool for a 1220 × 1520 × 6.6.4AN-glass. The figure shows that the impulsive region of the P-I curves background is the region where the ‘loss of design threat area’ is most significant. The reason is clear. In the impulsive region (constant impulse), acceleration conditions are more favourable for shard detachment from the interlayer with different levels of shard velocities possible, with the consequence of every possible outcome within different hazard levels. For quasi-static behaviour (constant pressure), the high hazard curve intersects the interlayer failure curve. This occurs because ‘no-spall’ high hazard is reached without significant acceleration conditions. In this case, shard detachments are unlikely.
The chart highlights how the ‘threat area lost’ region corresponds to the most typical Satchel bomb conditions according to ISO16933. However in this specific case a more typical vehicle bomb threat such as ISO-EXV19 lies within the transition area. It can be easily understood that applying overly restrictive limitations on fragmentation within the proximity of the facade (as per GSA, assuming spall effects) results in expensive solutions. These solutions generally exhibit stiffer behaviour with less blast energy dissipation and subsequently higher risk of overall facade structural collapse due to excessive bracket reactions to the main structure. Similarly, structural collapse risk is greater due to non-optimisation of facade blast energy dissipation capabilities.
As shown in Fig. 16, under the blast load ISO-EXV19, the single glass 6.6.4AN would be inadequate as it results in high hazard levels. In order to maintain the glass performance within the hazard region with a high degree of confidence, a 10.10.4AN is preferable. In terms of reactions to the main structure through the facade connection bracket, this would result in an approximate 50% increase in reactions assuming rigid quasi-static behaviour of the bracket system.
Other benefits of the fragmentation model would be to create a new perception of probable hazard levels in order to improve design cost effectiveness without loss of safety. Estimation of fragment size and velocity is also an important tool for injury assessment once the specific occupant working (or living) conditions within the vicinity of the facade are defined. Given that blast effects on facades are not uniform and high pressure-impulse loads are generally localized, further significant risks of structural collapse can also be found by balancing enhanced levels of facade energy dissipation with acceptable injury probability.
7Conclusions
In this paper, the features of the design optimization process assessed by a numerical tool developed by the Permasteelisa Group have been presented. Experimental testing to determine the post-cracking behaviour, failure modes and limits of laminated glass shows that the PVB membrane provides significant levels of protection against breach of the blast wave and hence overpressure injuries. The limiting factor though for the design of blast-enhanced glass is the risk of injury due to glass fragmentation. Current models are overly conservative, resulting in not only oversized glass but also higher reactions to the main structure with less possibility of effectively utilizing the energy dissipation potential of the facade. A new fragmentation modelling approach assuming Griffith energy balance criteria shows excellent correlation with blast arena tests. A design balance between PVB membrane dissipation le-vels and acceptable glass fragmentation hazards is required for both sufficiently safe yet economical design of blast-enhanced glazing.
References
1 | Applied Research Associates. (2005). WINdows Glazing Analysis Response and Design (WINGARD). Property of the United States Government. |
2 | ASTM E1300-12 (2102). Standard Practice for Determining Load Resistance of Glass in Buildings, ASTM International. |
3 | Bennison, S. J., Sloan, J. G., Kristunas, D. F., Buehler, P. J., Amos, T., & Smith, C. A. (2005). Laminated glass for blast mitigation: Role of interlayer properties, Proc Glass Processing Days: The 9th international glass conference, Tampere, Finland, pp. 17-20. |
4 | Biggs JM(1964) Introduction to Structural DynamicsMc Graw-HillNew York |
5 | Beauchamp EK, Matalucci RV(1998) Dynamics of Window Glass Fracture in ExplosionsSandia National Laboratories Report SANDSAND98-0598Albuquerque, NM |
6 | Bouchbinder E, Mathiesen J, Procaccia I(2005) Branching Instabilities in Rapid Fracture: Dynamics and GeometryPhysical Review E71: 5056118 |
7 | Ellis, B. R. (1991). Static Testing of Glazing for Property Services Agency, Report no. TCR28/91, BRE Structural Performance Division Garston, Watford. |
8 | Ellis, B. R., & Beak, M. (1992). Static Testing of Glazing phase II, Client report GIO 451, BRE Structural Performance Division. |
9 | Grady DE(2008) Fragment Size Distributions from the Dynamic Fragmentation of brittle solidsInternational Journal of Impact Engineering35: 15571562 |
10 | Griffith A(1921) The phenomena of rupture and flow in solids,Philosophical Transactions of the Royal Society of London Series AContaining Papers of a Mathematical or Physical Character221: 163198 |
11 | Haldimann, M. (2006). Fracture strength of structural glass elements-analytical and numerical modelling, testing and design, These EPFL No 3671, Ercole Polytechnique Federale de Lausanne (EPFL). |
12 | Hinman, E. (2011). Blast Safety of the Building Envelope. In: Whole Building Design Guide, National Institute of Building Sciences. |
13 | Hooper PA, Blackman BRK, Dear JP(2012) The mechanical behaviour of polyvinyl butyral at different strain magnitudes and strain ratesJournal of Material Science47: 35643576 |
14 | ISO 16933:2007 (2007). Glass in building - Explosion-resistant security glazing - Test and classification for arena air-blast loading, 22. |
15 | Iwasaki R, Sato C(2006) The influence of strain rate on the interfacial fracture toughness between PVB and laminated glassJournal de Physique IV (Proceedings)134: 11531158 |
16 | Iwasaki R, Sato C, Lataillade JL, Viot P(2007) Experimental study on the interface fracture toughness of PVB (polyvinyl butyral)/glassat high strain ratesInternational Journal of Crashworthiness12: 3293298 |
17 | Kuntsche J, Schneider J(2014) Mechanical behaviour of polymer interlayers in explosion resistant glazingChallenging Glass 4 & Cost Action TU0905 Final Conference447454 |
18 | Lumantarna R, Nguyen C, Zobec M, Ngo T(2012) Pressure Correction in Water-bag Testings to Investigate Post Cracked Behaviour of Laminated GlassAustralasian Conference on the Mechanics of Structures and Materials (ACMSM)22AustraliaSydney |
19 | Marchand KA, Conrath EJ, Stevens DJ, Meyer B(2006) Blast induced glass hazards: A comparison of design approaches and recent researchIn: Structures under Shock and ImpactIX: SUSI IX259268 |
20 | Morison C(1999) Response of Glazed Facades to Blast Loading. MSc DissertationUniversity of WestminsterWestminster, UK |
21 | Morison, C. (2007). The resistance of laminated glass to blast pressure loading and the coefficients for single degree of freedom analysis of laminated glass, PhD Thesis, Cranfield University, Cranfield, UK. |
22 | Morison, C., Zobec, M., & Frenceschet, A. (2007). The measurement of PVB properties at high strain rates, and their application in the design of laminated glass under bomb blast, International Symposium on the Interaction of the Effects of Munitions with Structures |
23 | Neda Z, Mocsy A, Bako B(1993) Structures obtained by mechanical fragmentation of glass platesMaterial Science and EngineeringA169: L1L4 |
24 | Newmark NM(1956) An engineering approach to blast resistant designAmerican Society of Civil Engineers Transactions121: 45Paper No. 2786. |
25 | Norville HS, Harvill N, Conrath EJ, Shariat S, Mallonee S(1999) Glass related injuries in the Oklahoma City BombingJournal of Performance of Constructed Facilities, ASCE13: 25056 |
26 | Norville HS, Conrath EJ(2001) Considerations for blast-resistant glazing designJournal of Architectural Engineering7: 38086 |
27 | VIRACON (2004) Laminated Glass for Blast MitigationOwatonna |
28 | Wang, J. (1986). Fracture and stress Pattern Correlations in Glass Plates, MSc Thesis, Texas Tech University. |
29 | Wang, J., & McDonald, J. R. (1986). Fracture and Stress Pattern Correlations in Window Glass Plates, Submitted to Eastern Space and Missile Center (ESMC/SEM) Patrick Air Force Base Florida 32925, Glass Research and Testing Laboratory, Texas Tech University, Lubbock, TX. |
30 | Zobec, M., Lori, G., & Ngo, T. (2012). Blast Enhanced Facades for Tall Buildings – A True Balanced Integrated Design Approach, Proceedings of the Council for Tall Buildings and Urban Habitat (CTBUH) 9th World Congress; Shanghai, PRC (pp. 867-87). |
Figures and Tables
Fig.1
Cross-section through witness area for arena test (ISO 16933:2007).
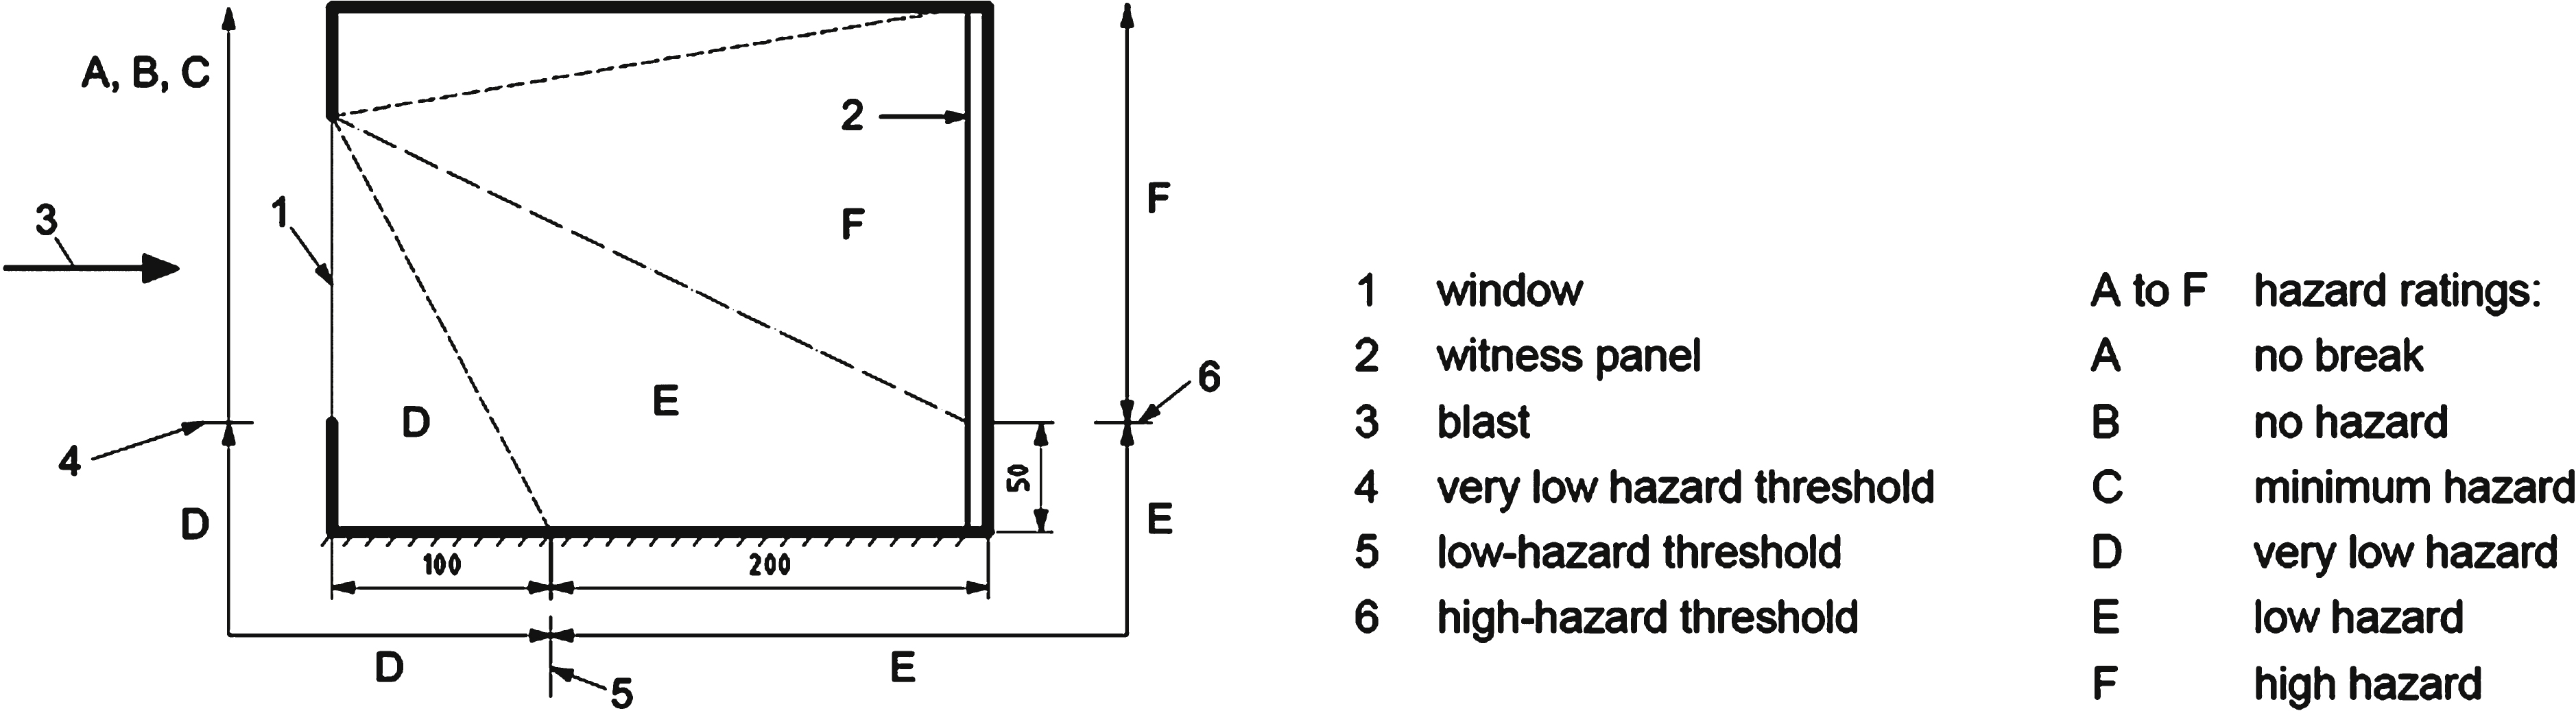
Fig.2
Schematic of the analysis process in TestudoTM.
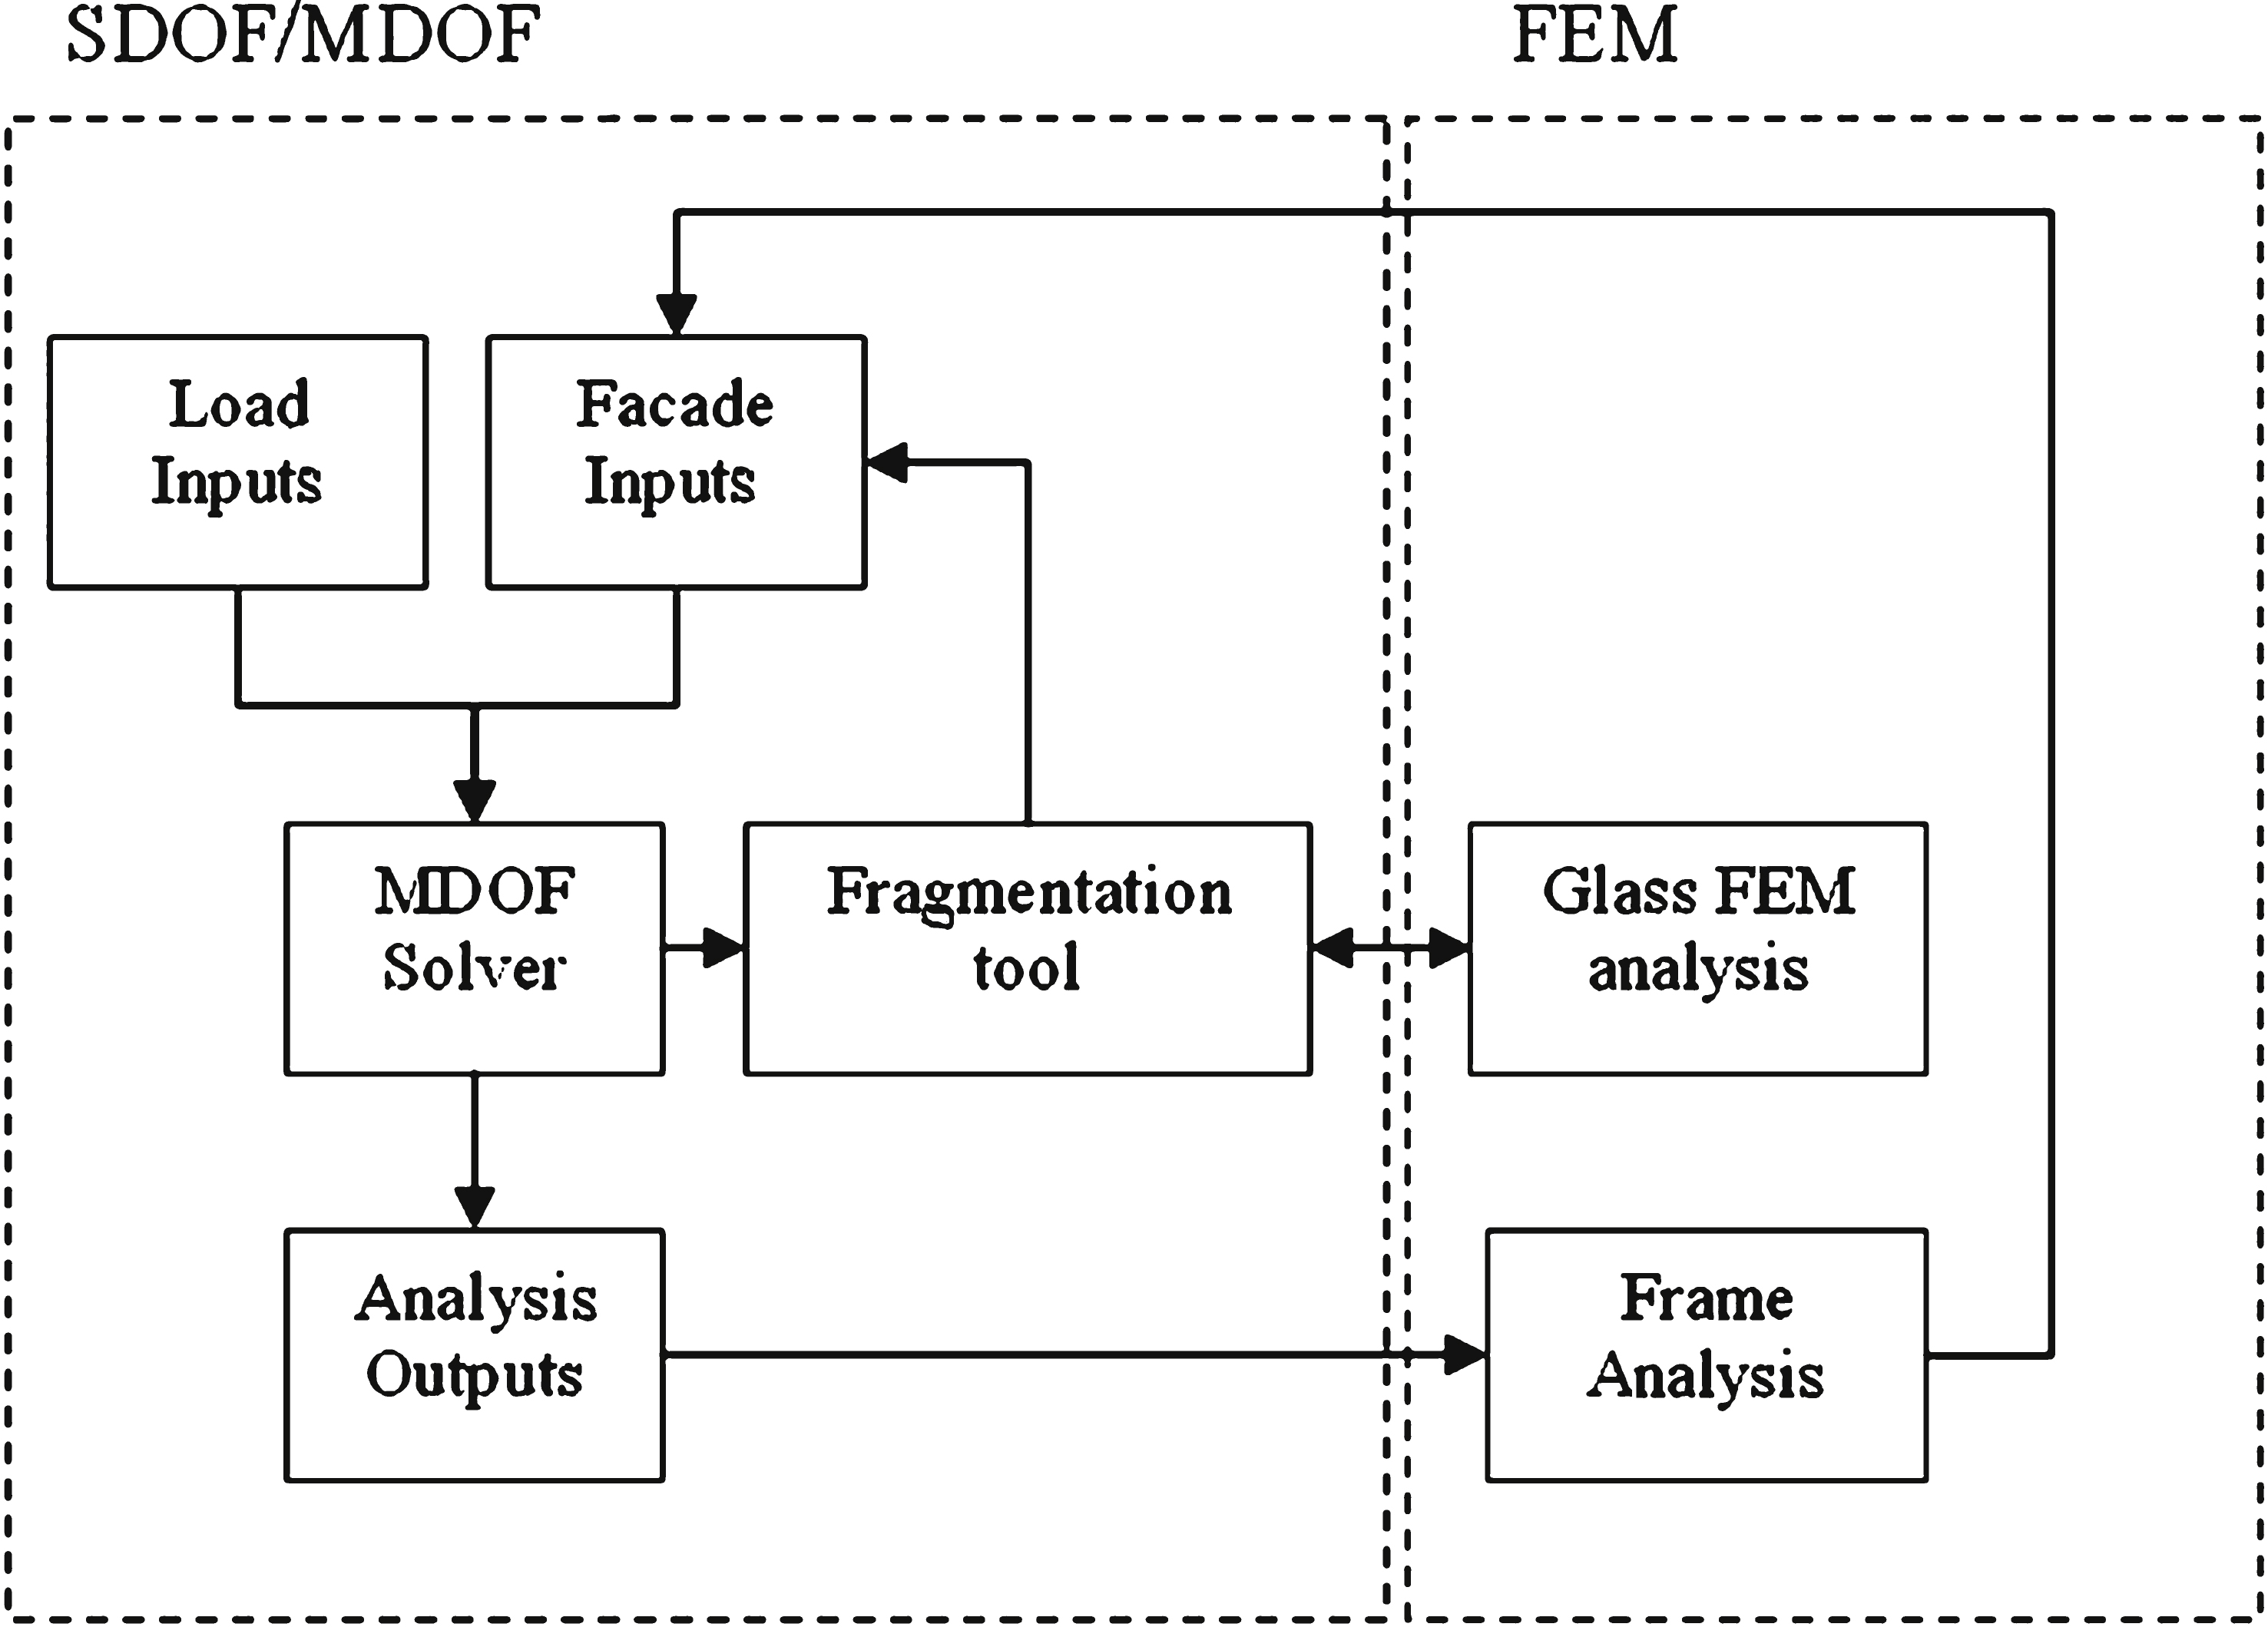
Fig.3
MDOF facade models.
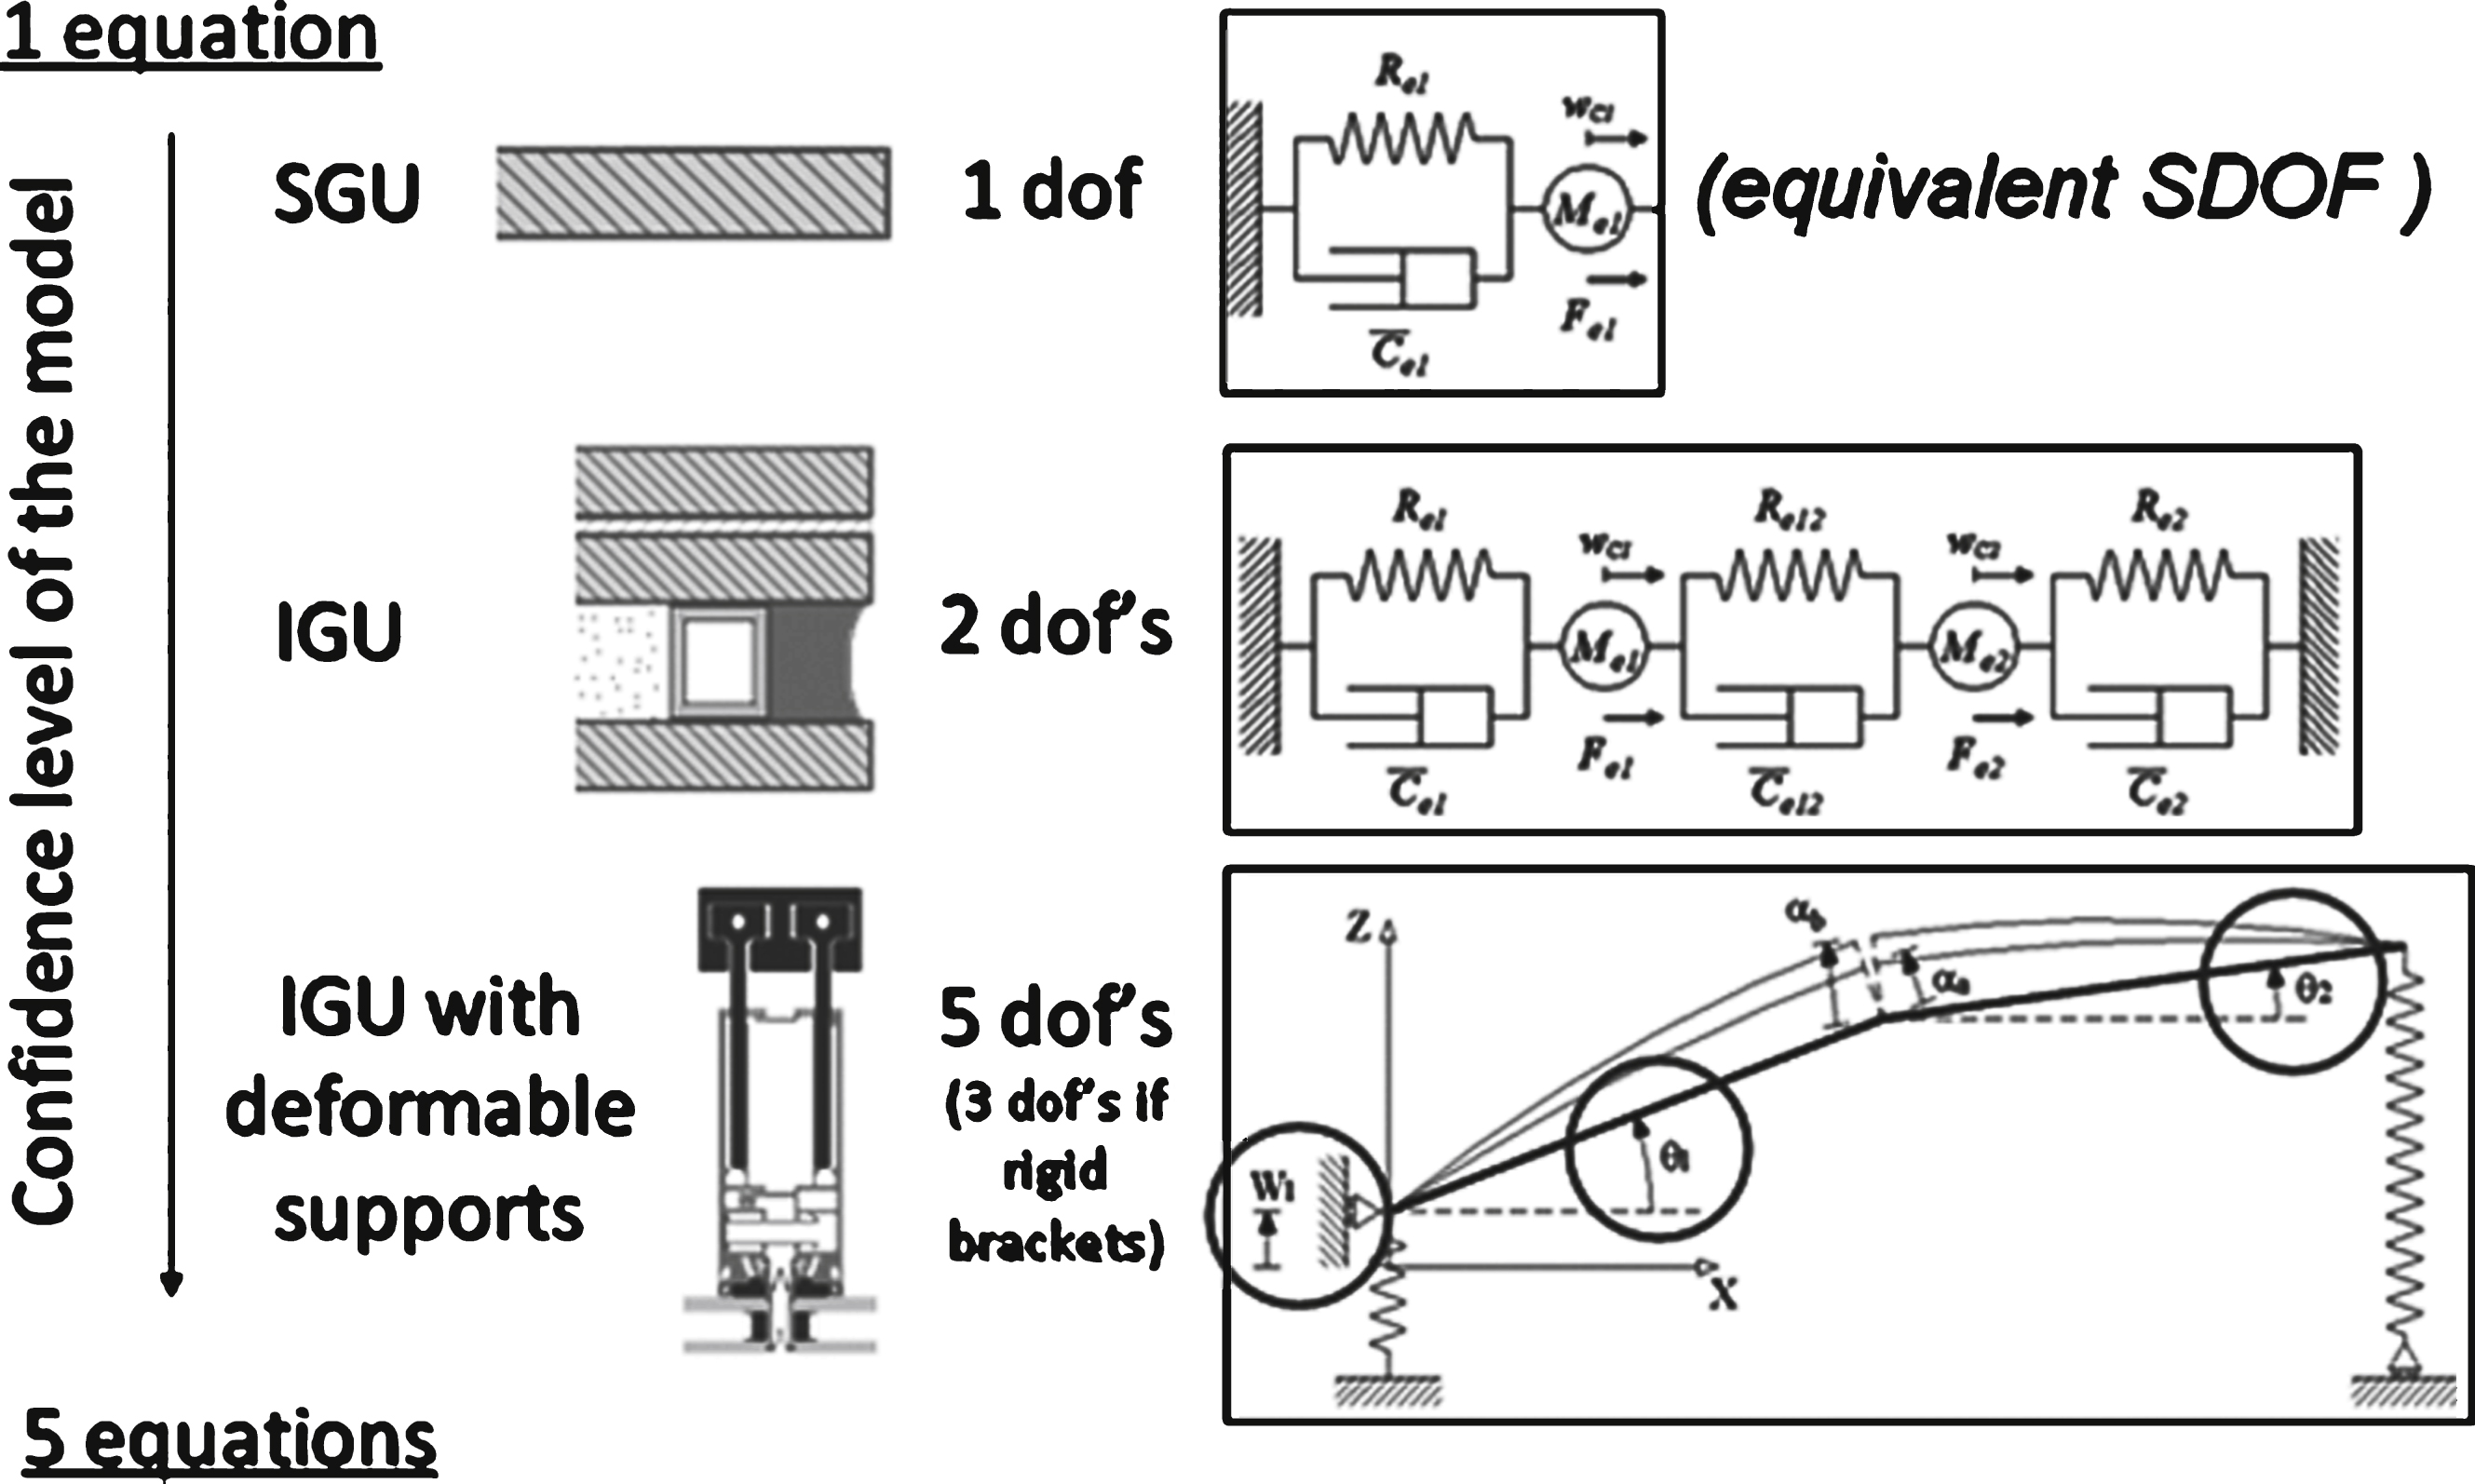
Fig.4
Typical laminated glass resistance curve.

Fig.5
Water-bag test of laminated glass.
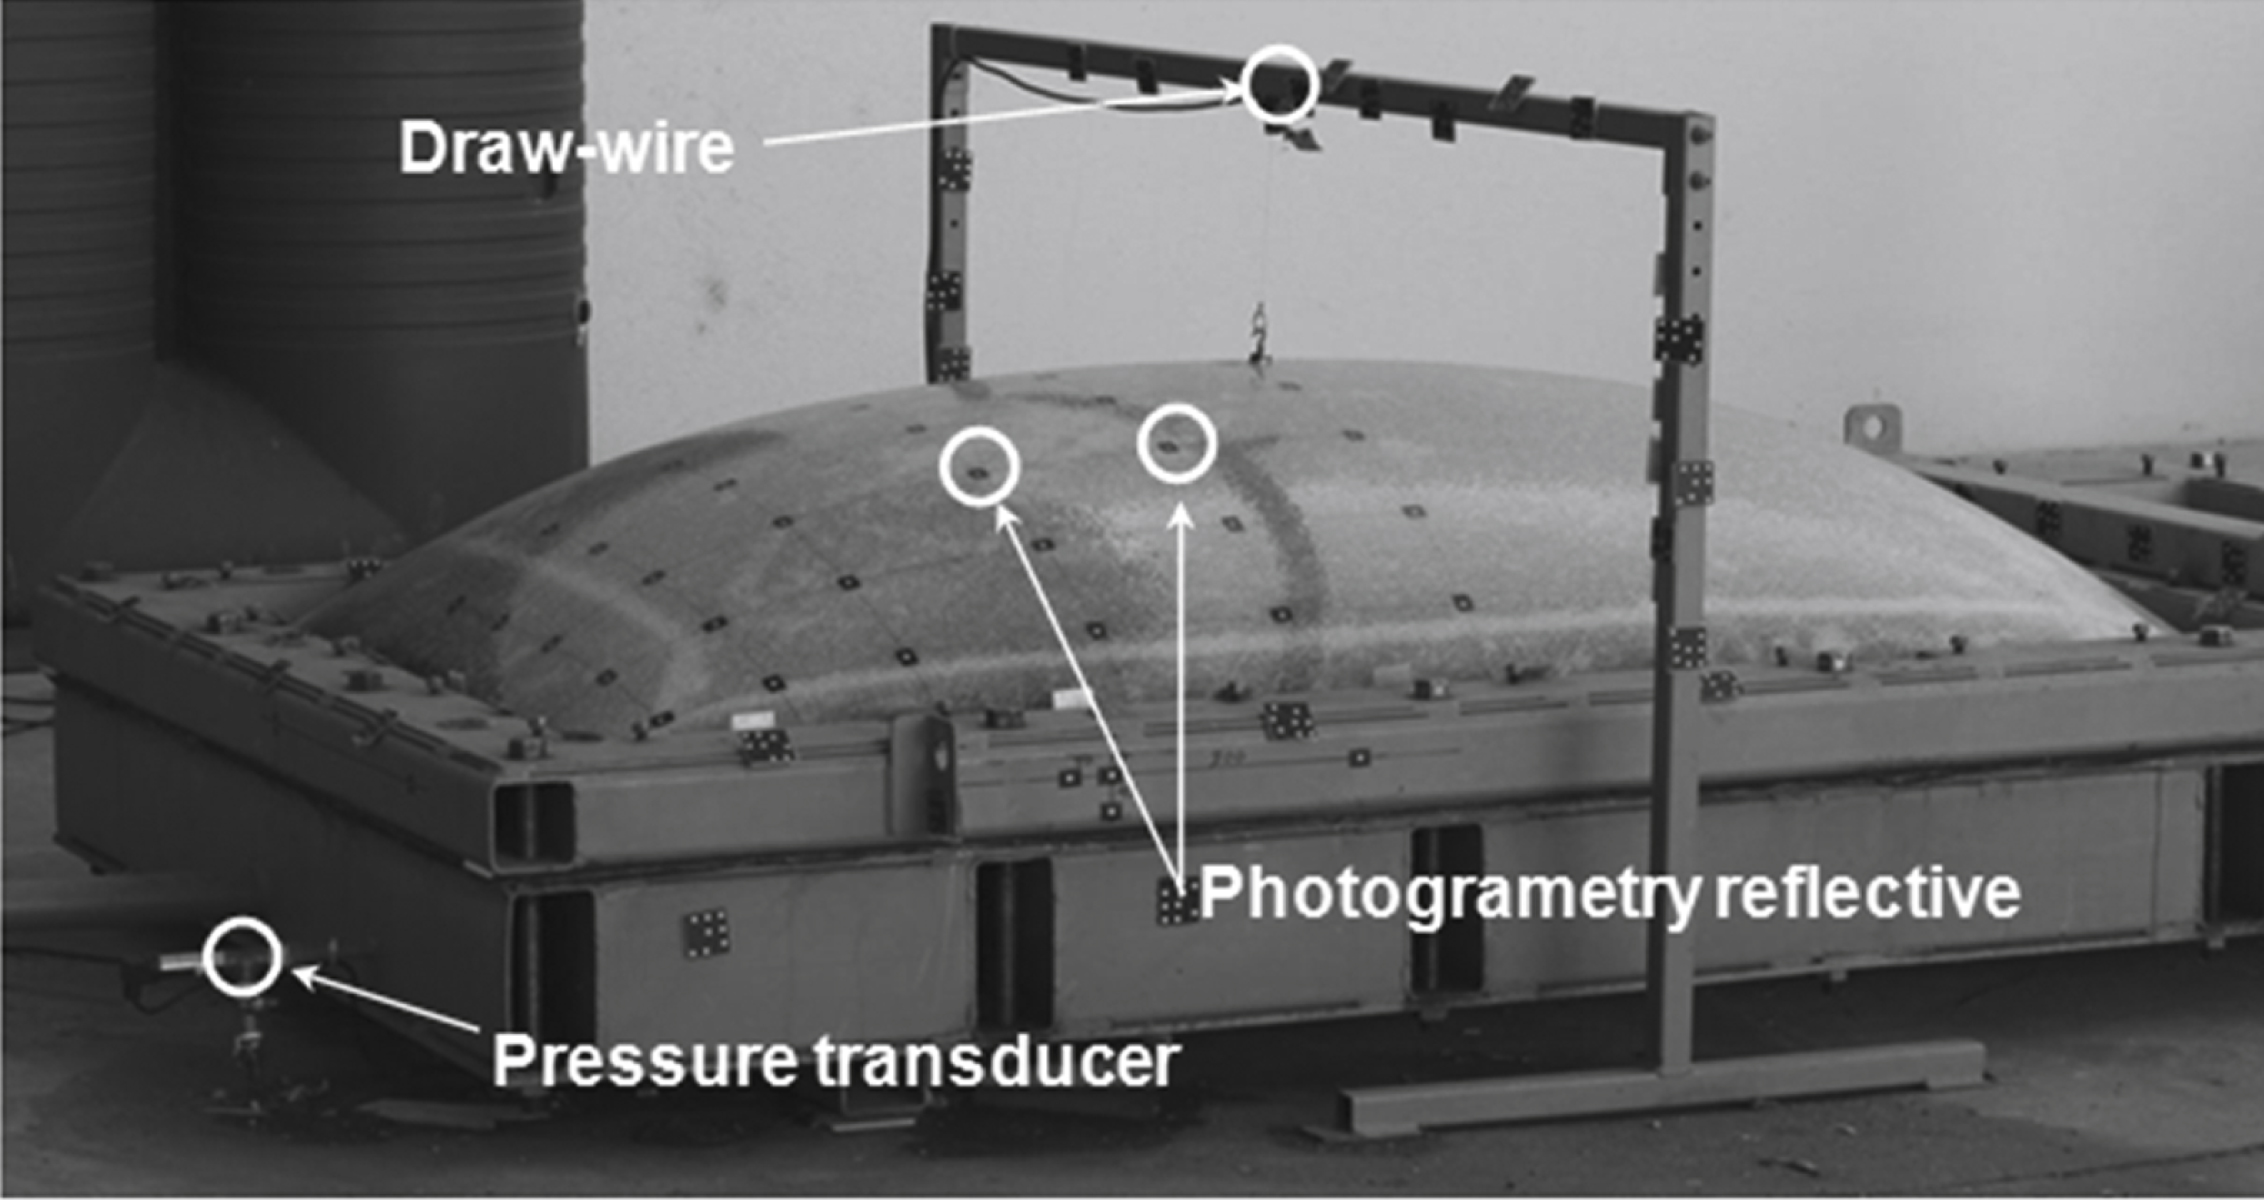
Fig.6
CDF vs. RFD for edge cutting and tearing failure modes.
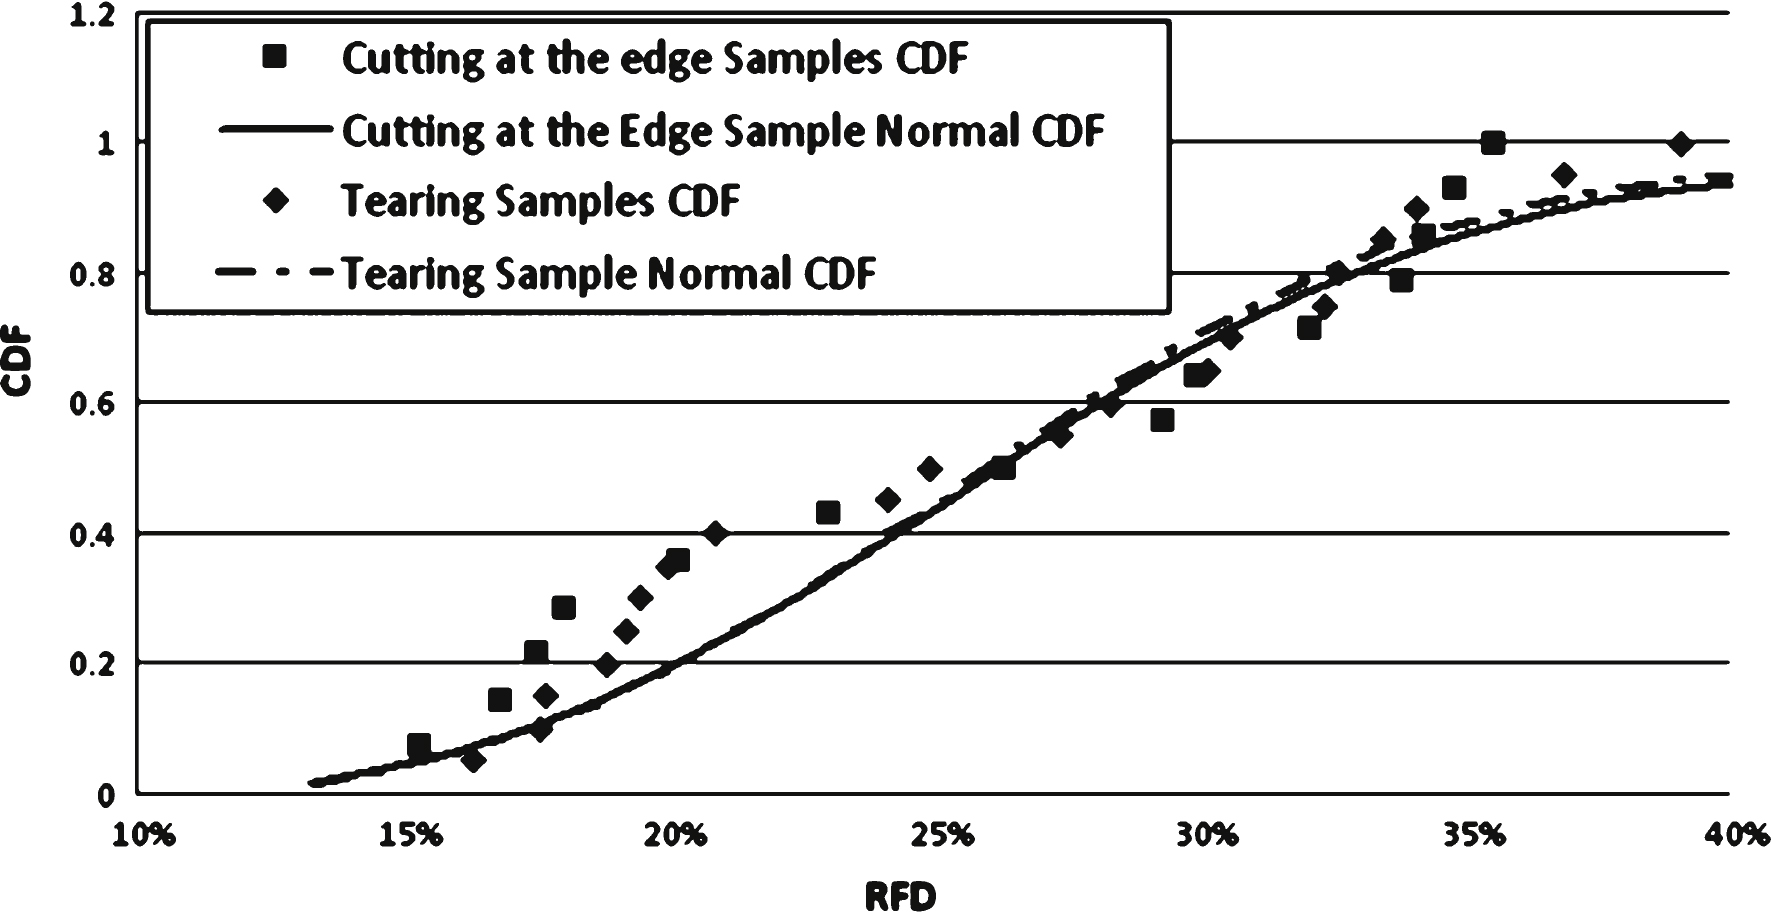
Fig.7
9.52 mm ANN KLM curves for hydrostatic and uniform pressure models.
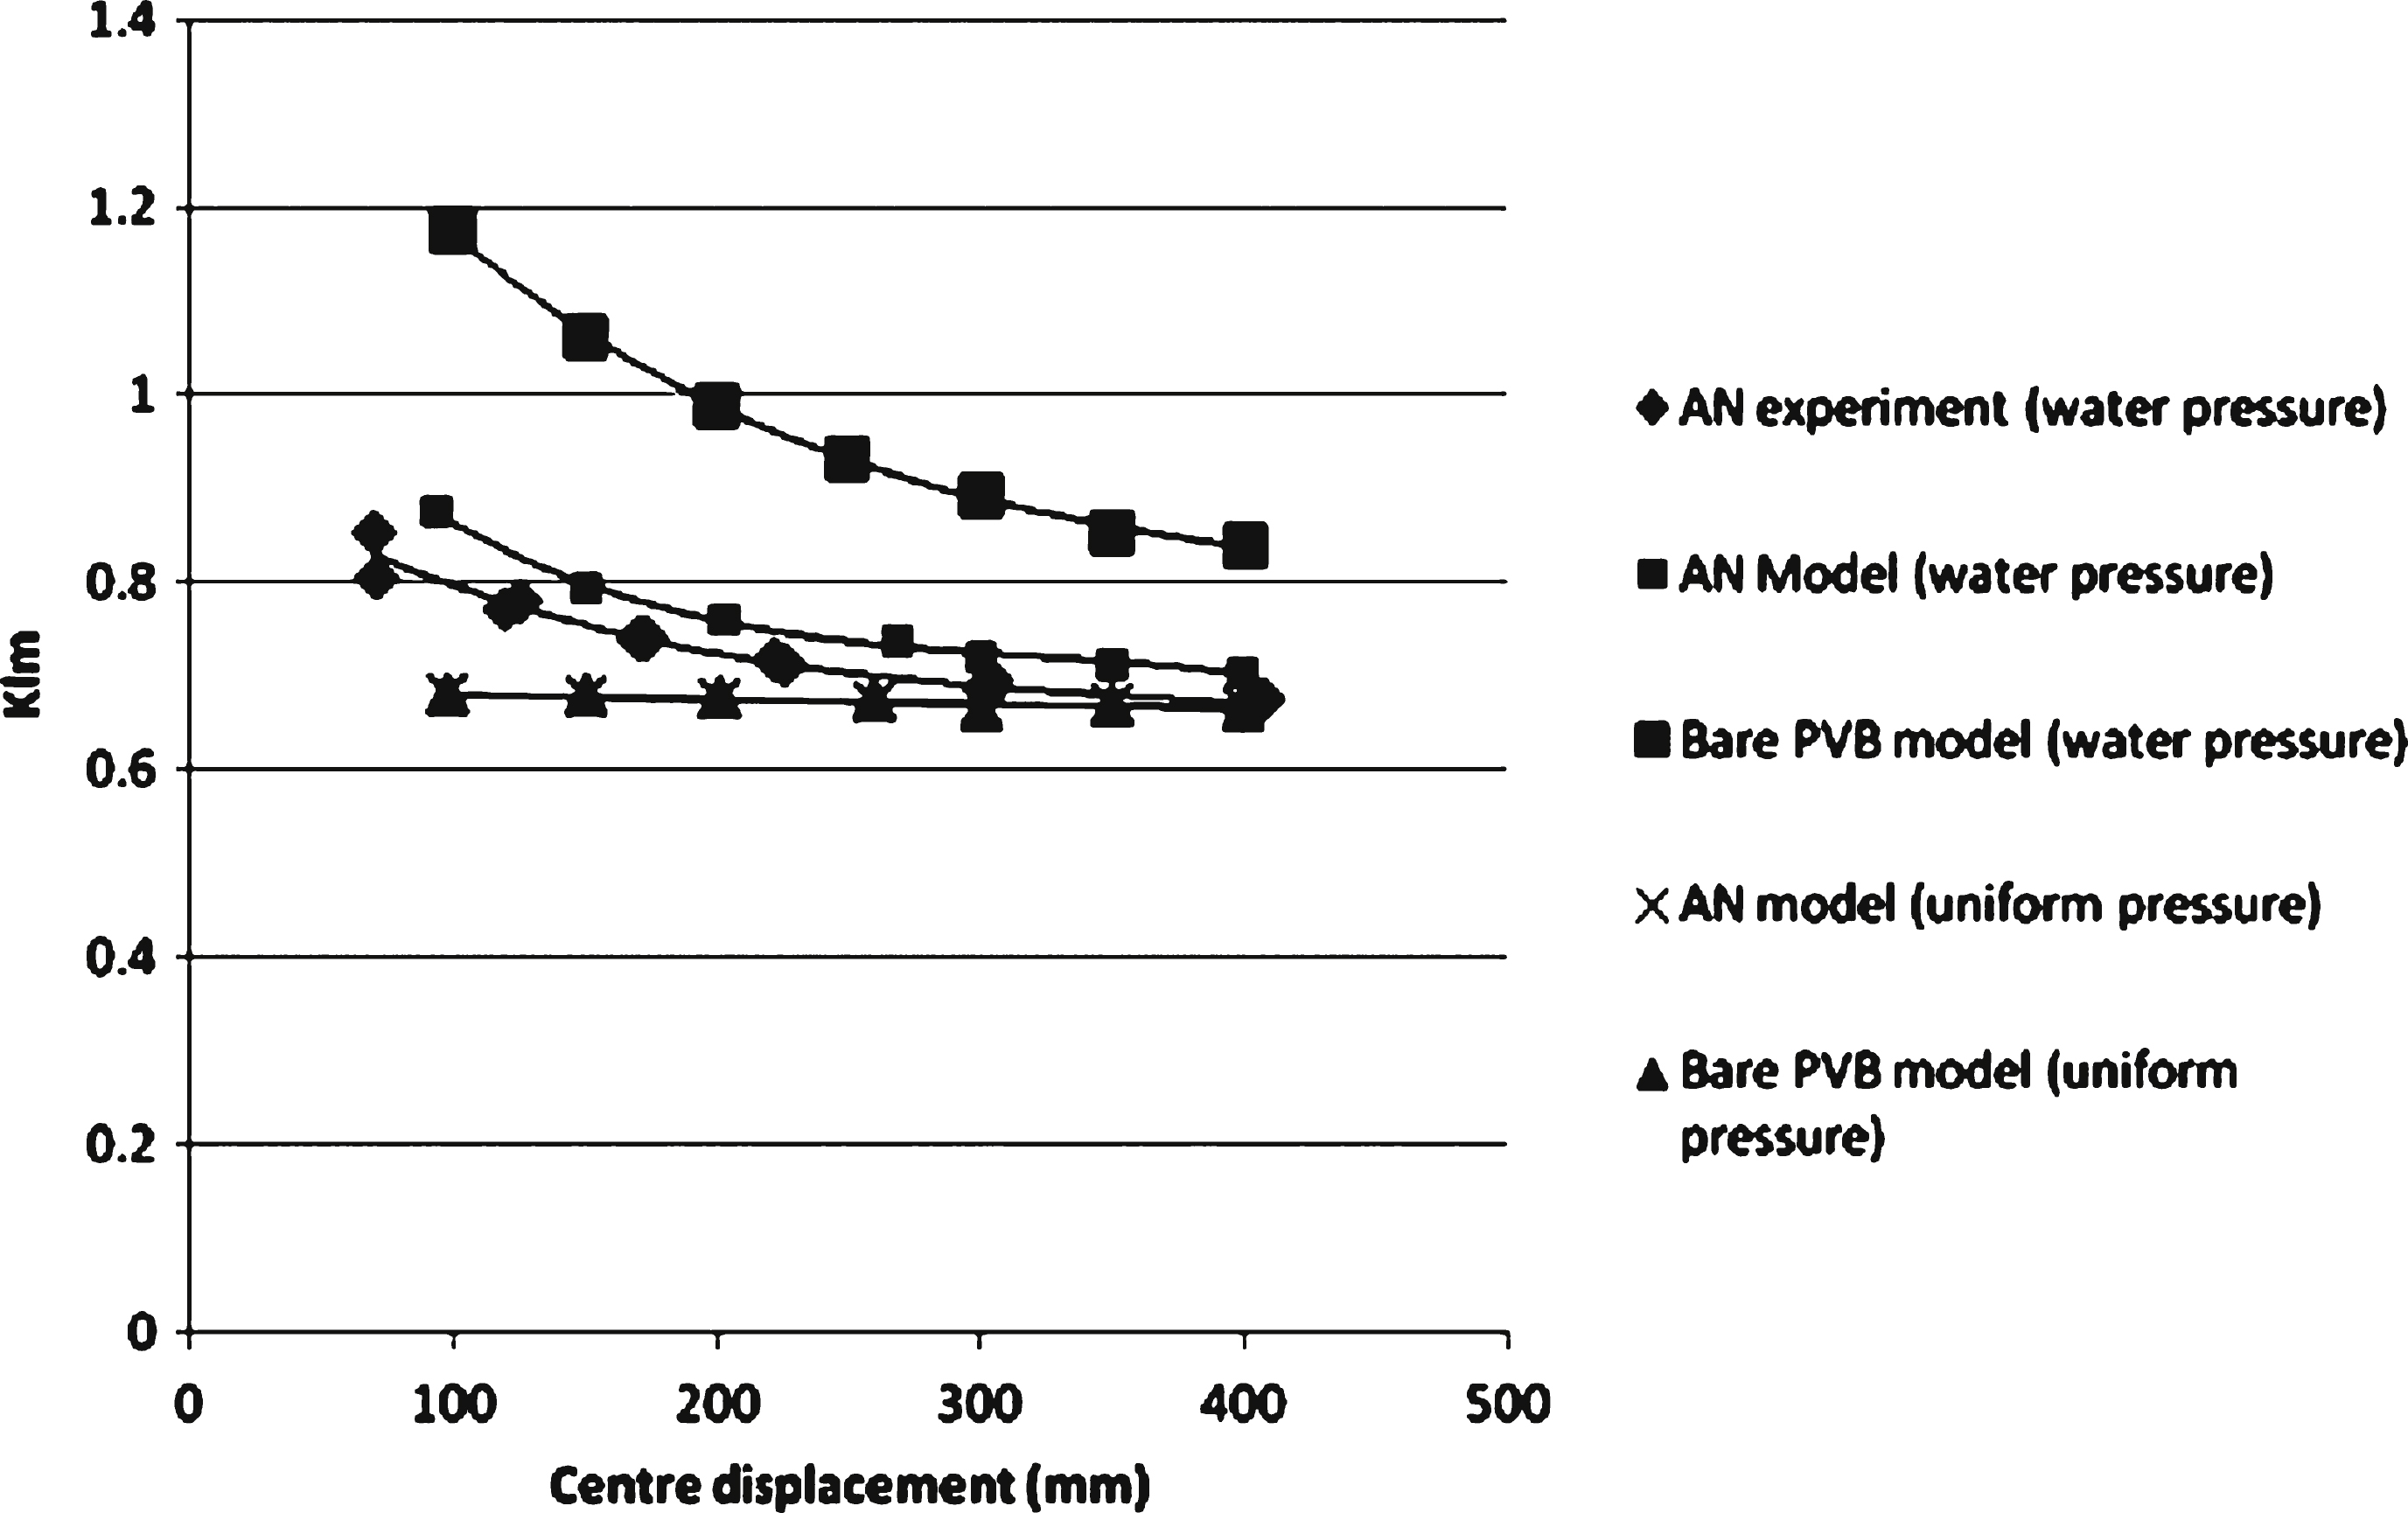
Fig.8
Effective PVB stiffened elastic modulus versus C (exposed PVB glass ratio).
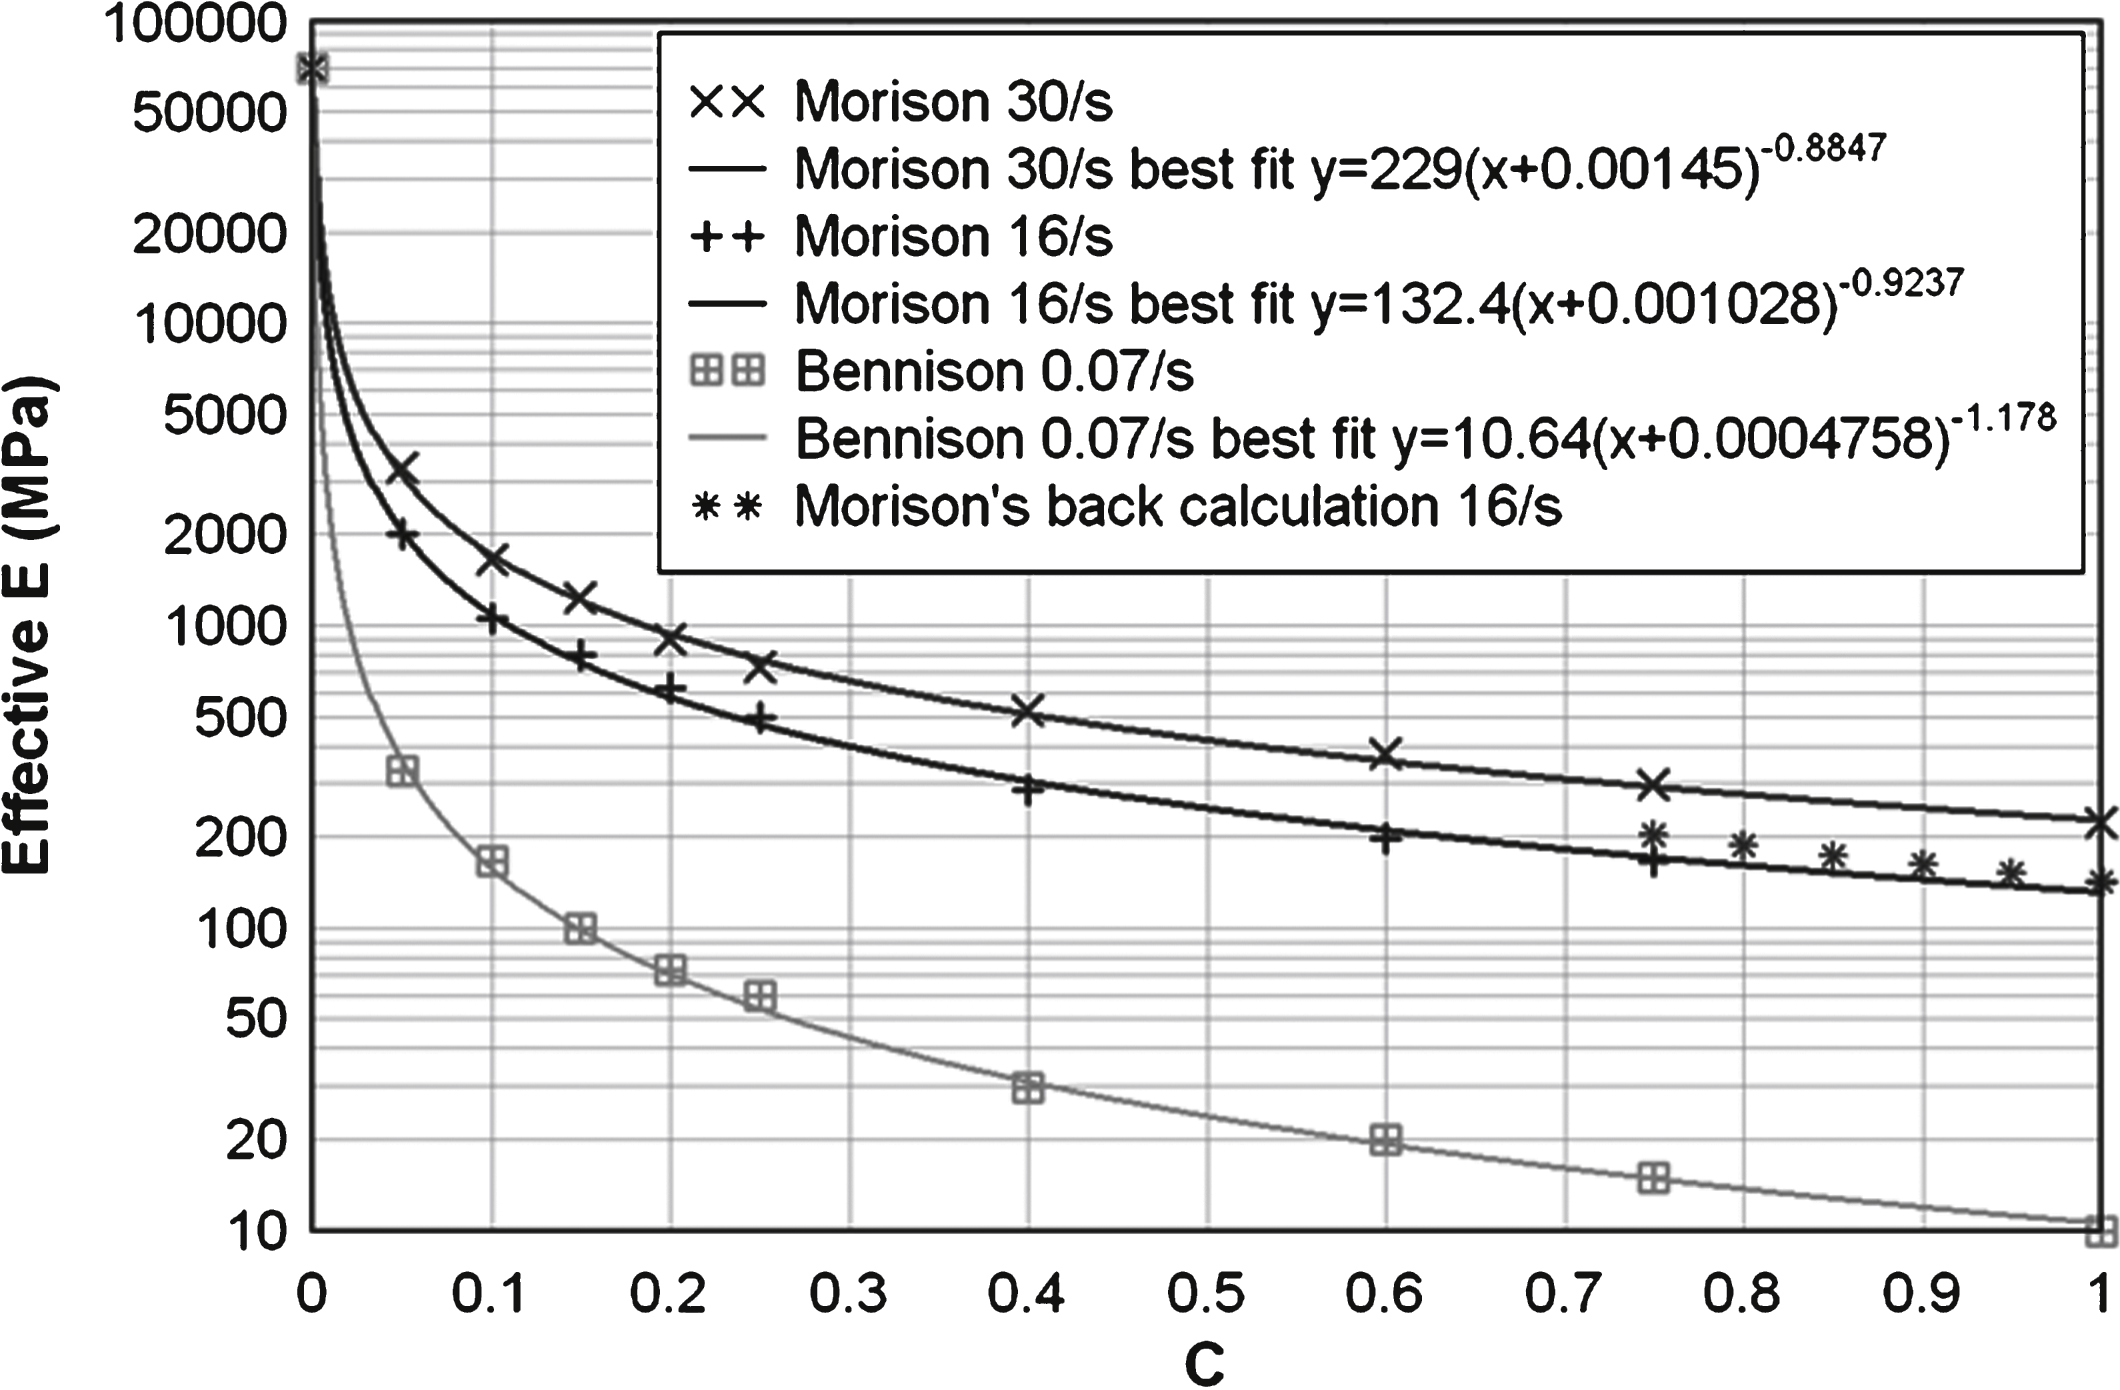
Fig.9
Facade impulse mitigation effect shown on the typical P-I curve background.
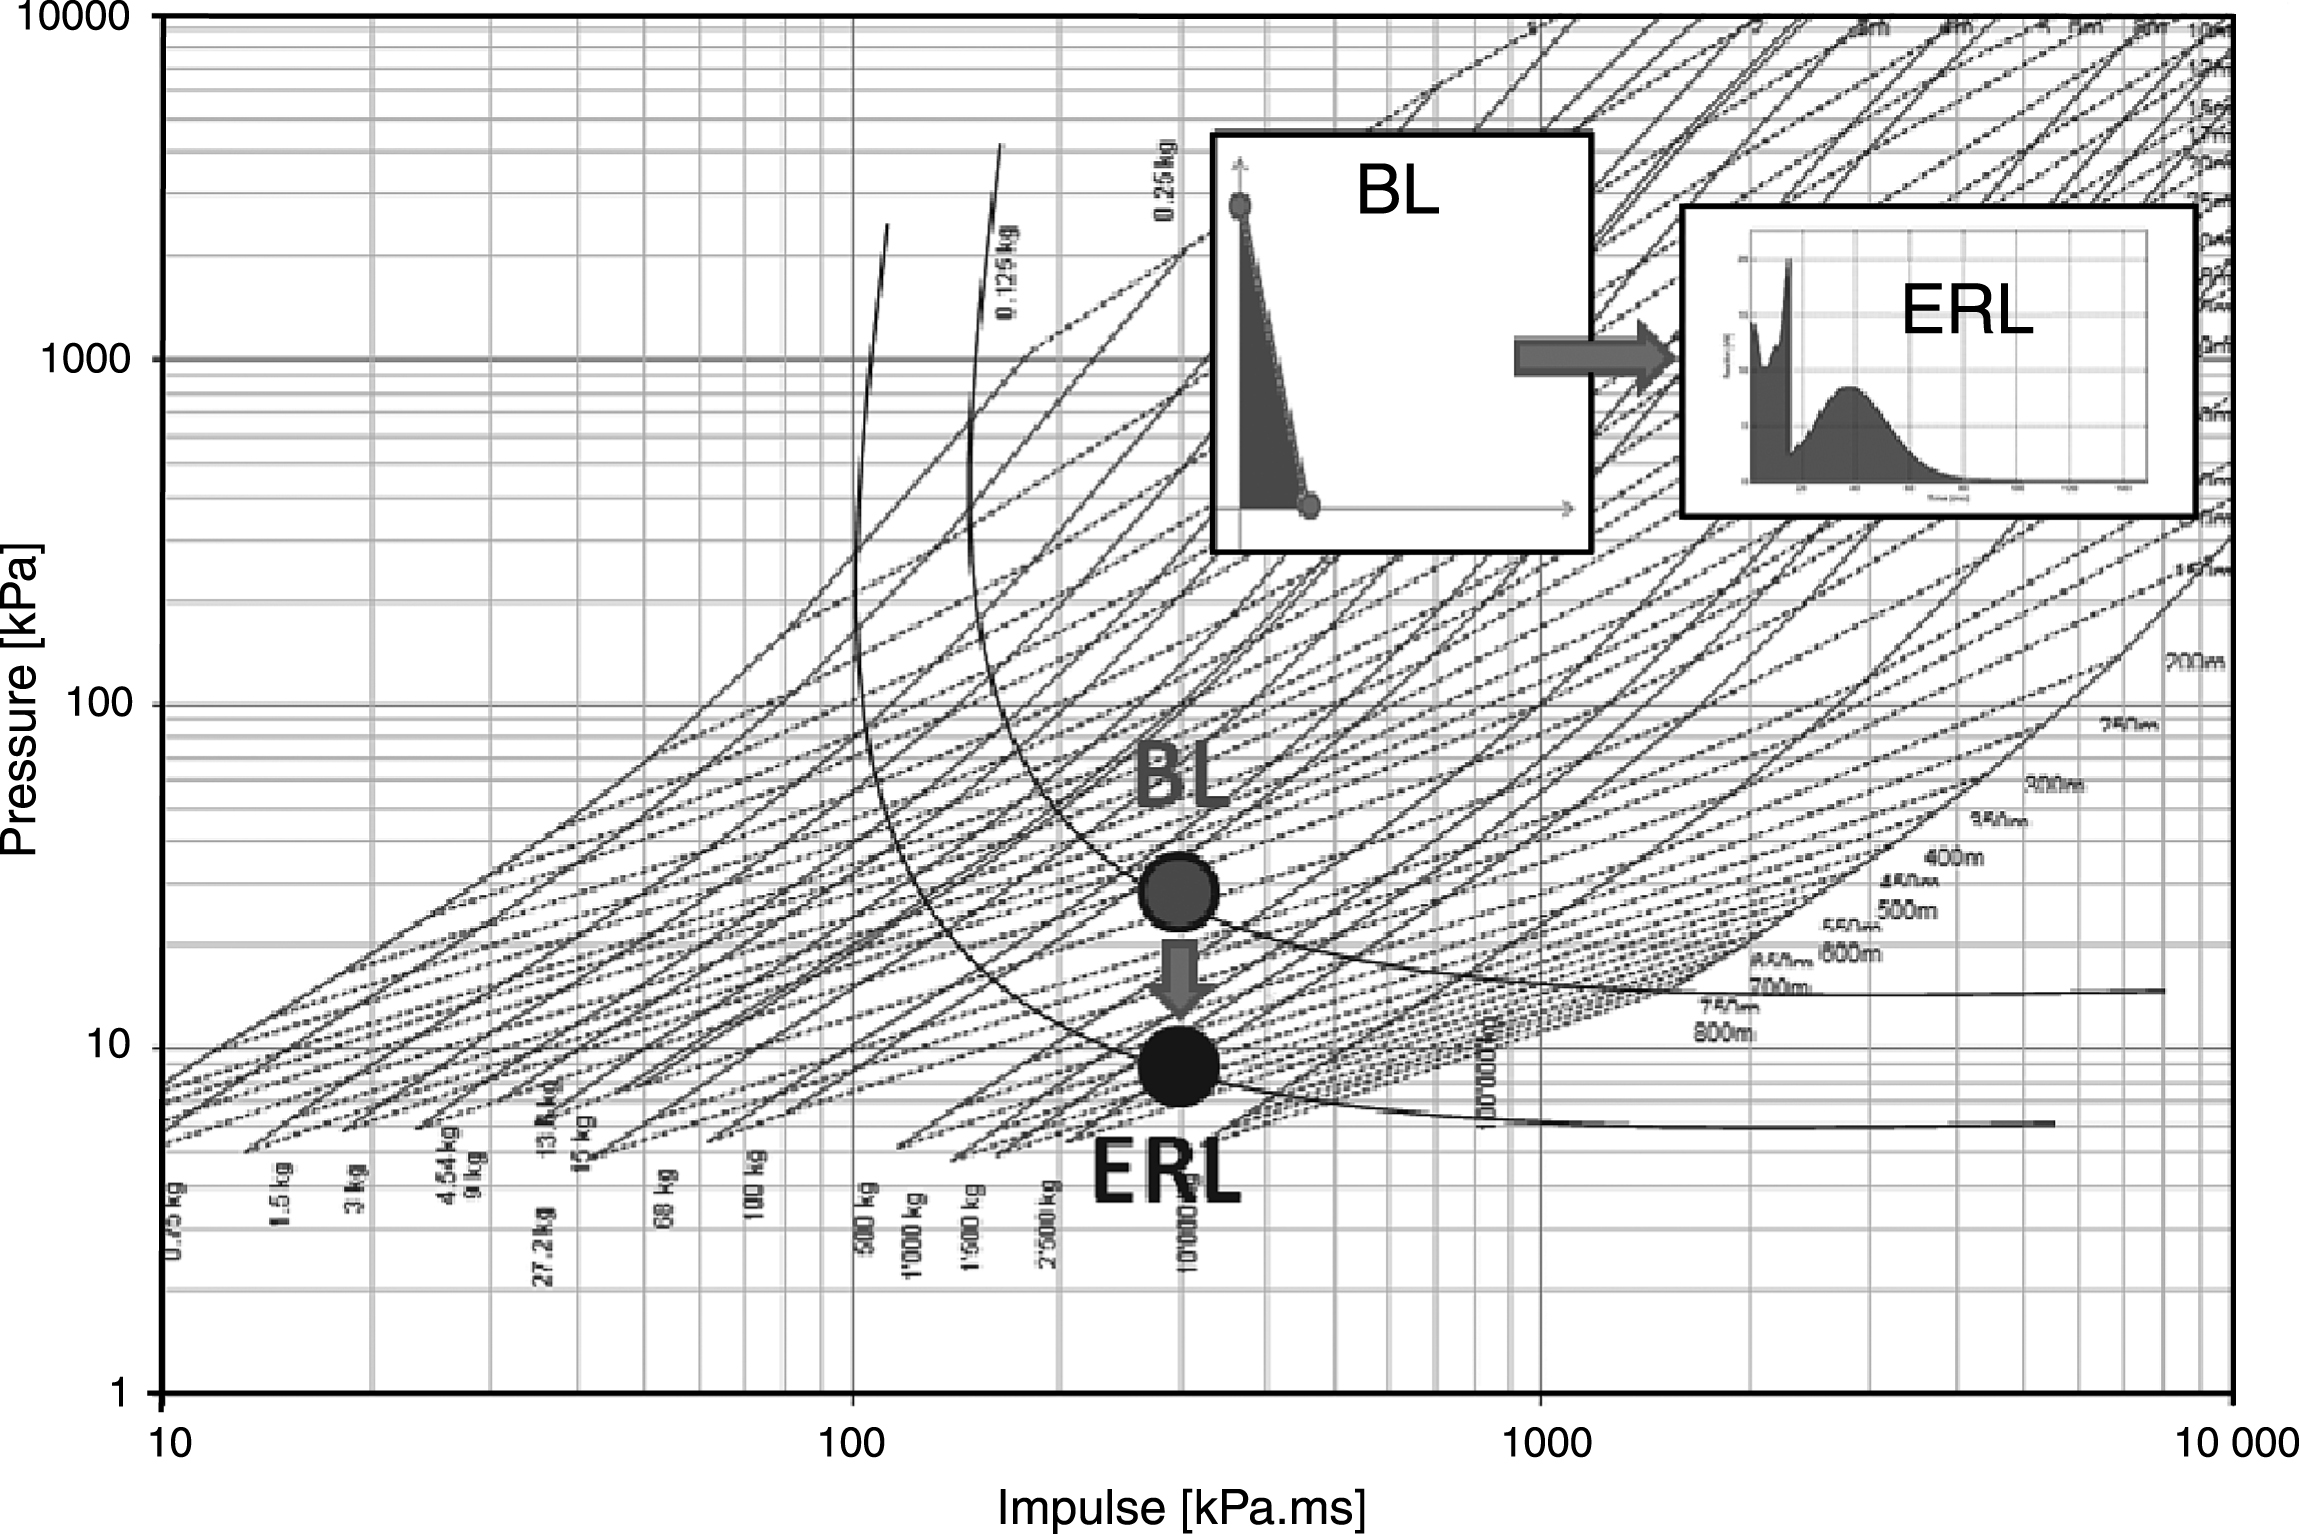
Fig.10
Reaction per square meter of 1500 × 4200 × 8AN-16-3.3.4AN (by facade models of different complexity) compared with GSA D blast load.
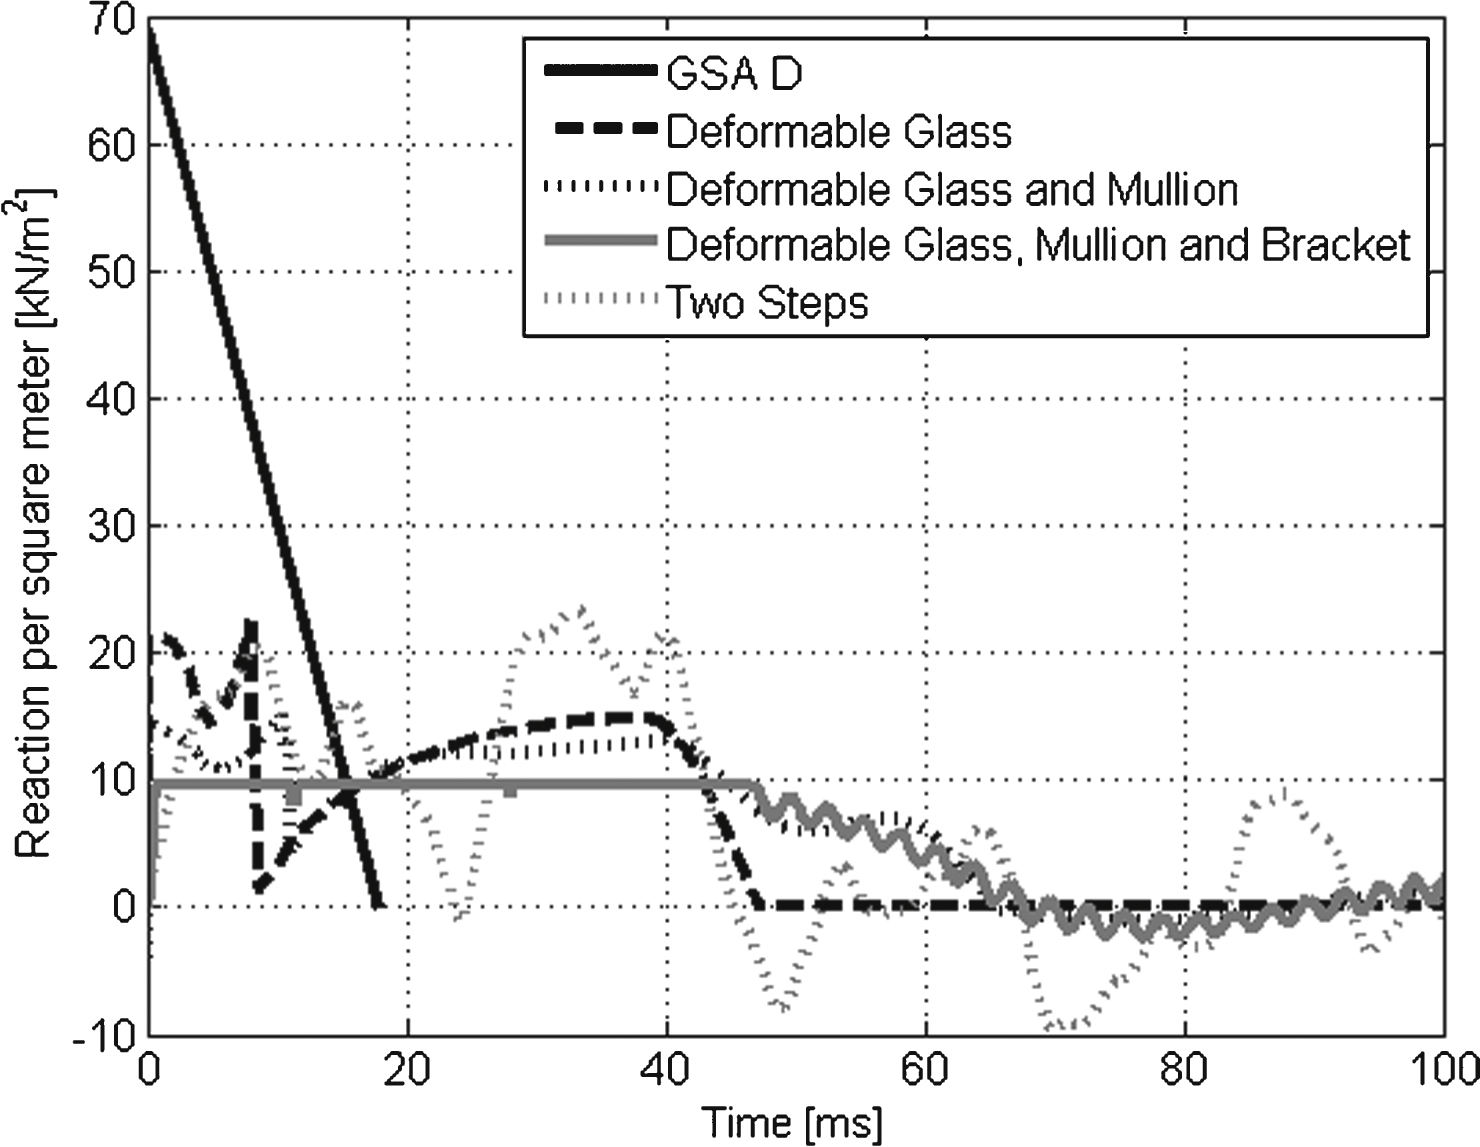
Fig.11
Reaction per square meter of 1500 × 4200 × 8FT-16-3.3.4FT (by facade models of different complexity) compared with GSA D blast load.
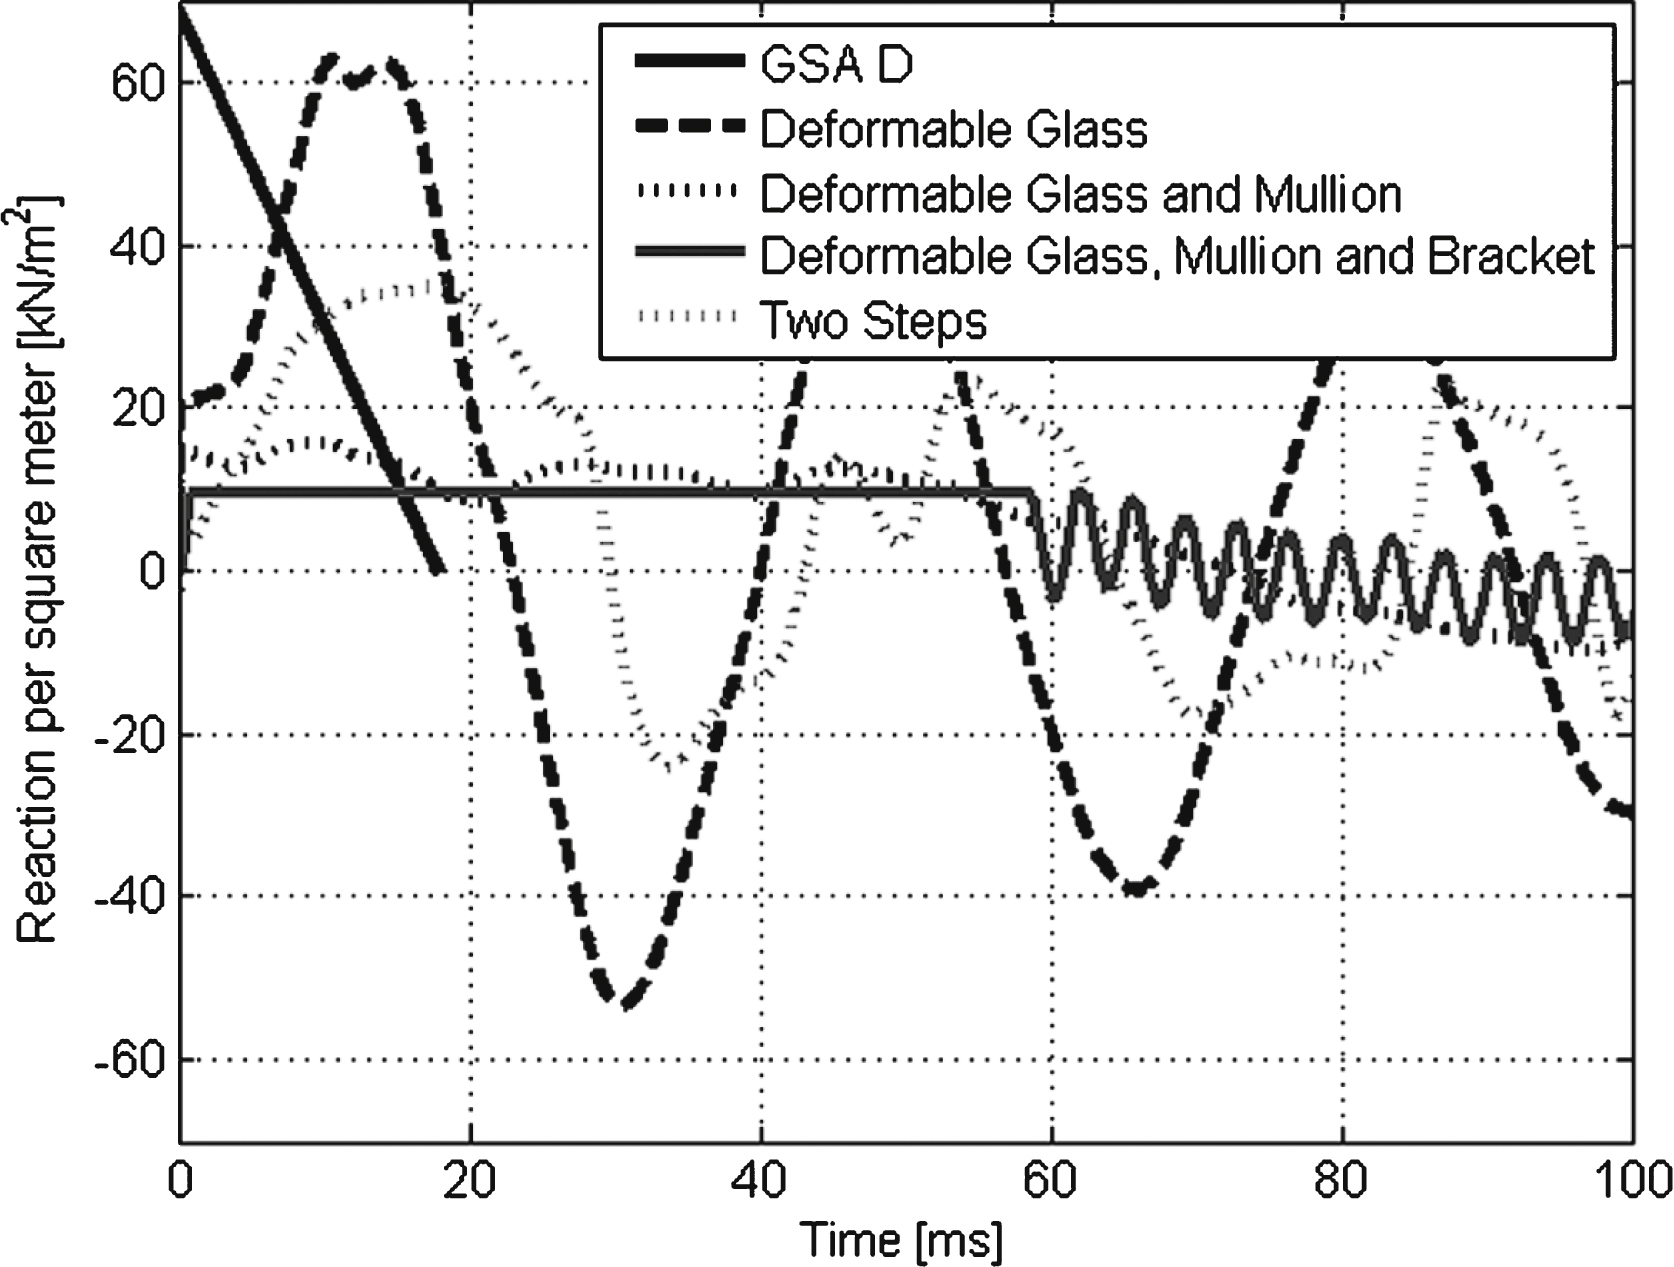
Fig.12
Fracture pattern and similarity with the stress pattern.
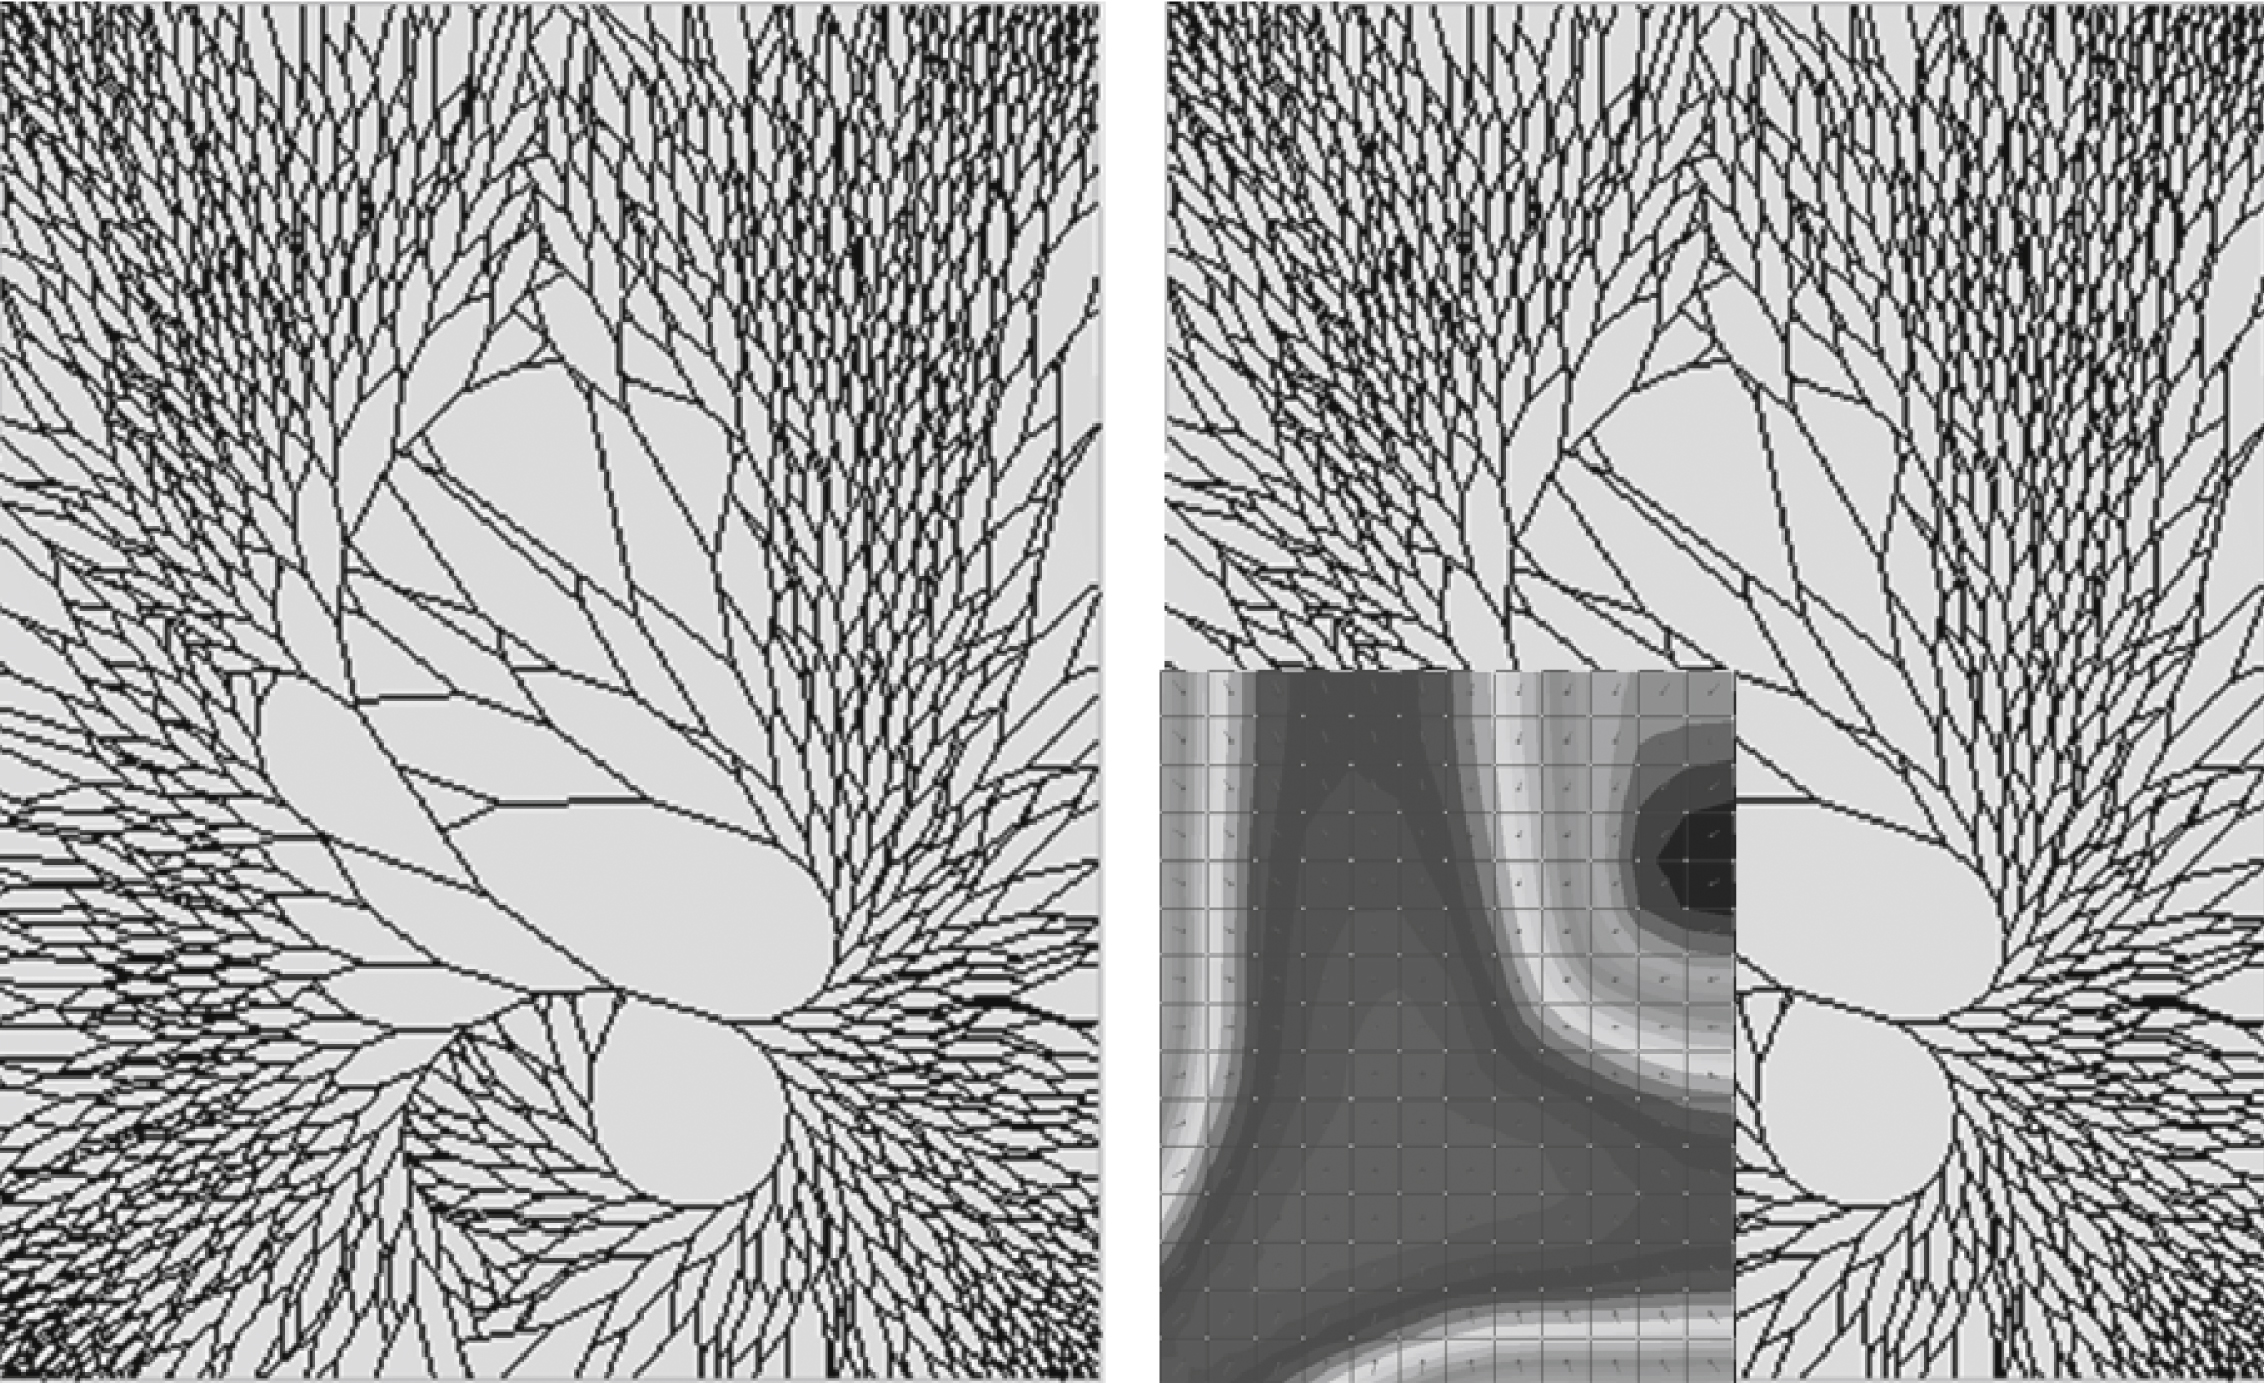
Fig.13
Typical PDF and CDF of the average fragment size [in mm].
![Typical PDF and CDF of the average fragment size [in mm].](https://ip.ios.semcs.net:443/media/fde/2014/2-3,4/fde-2-3-4-fde0019/fde-2-3-4-fde0019-g013.jpg)
Fig.14
Experimental test result comparison.
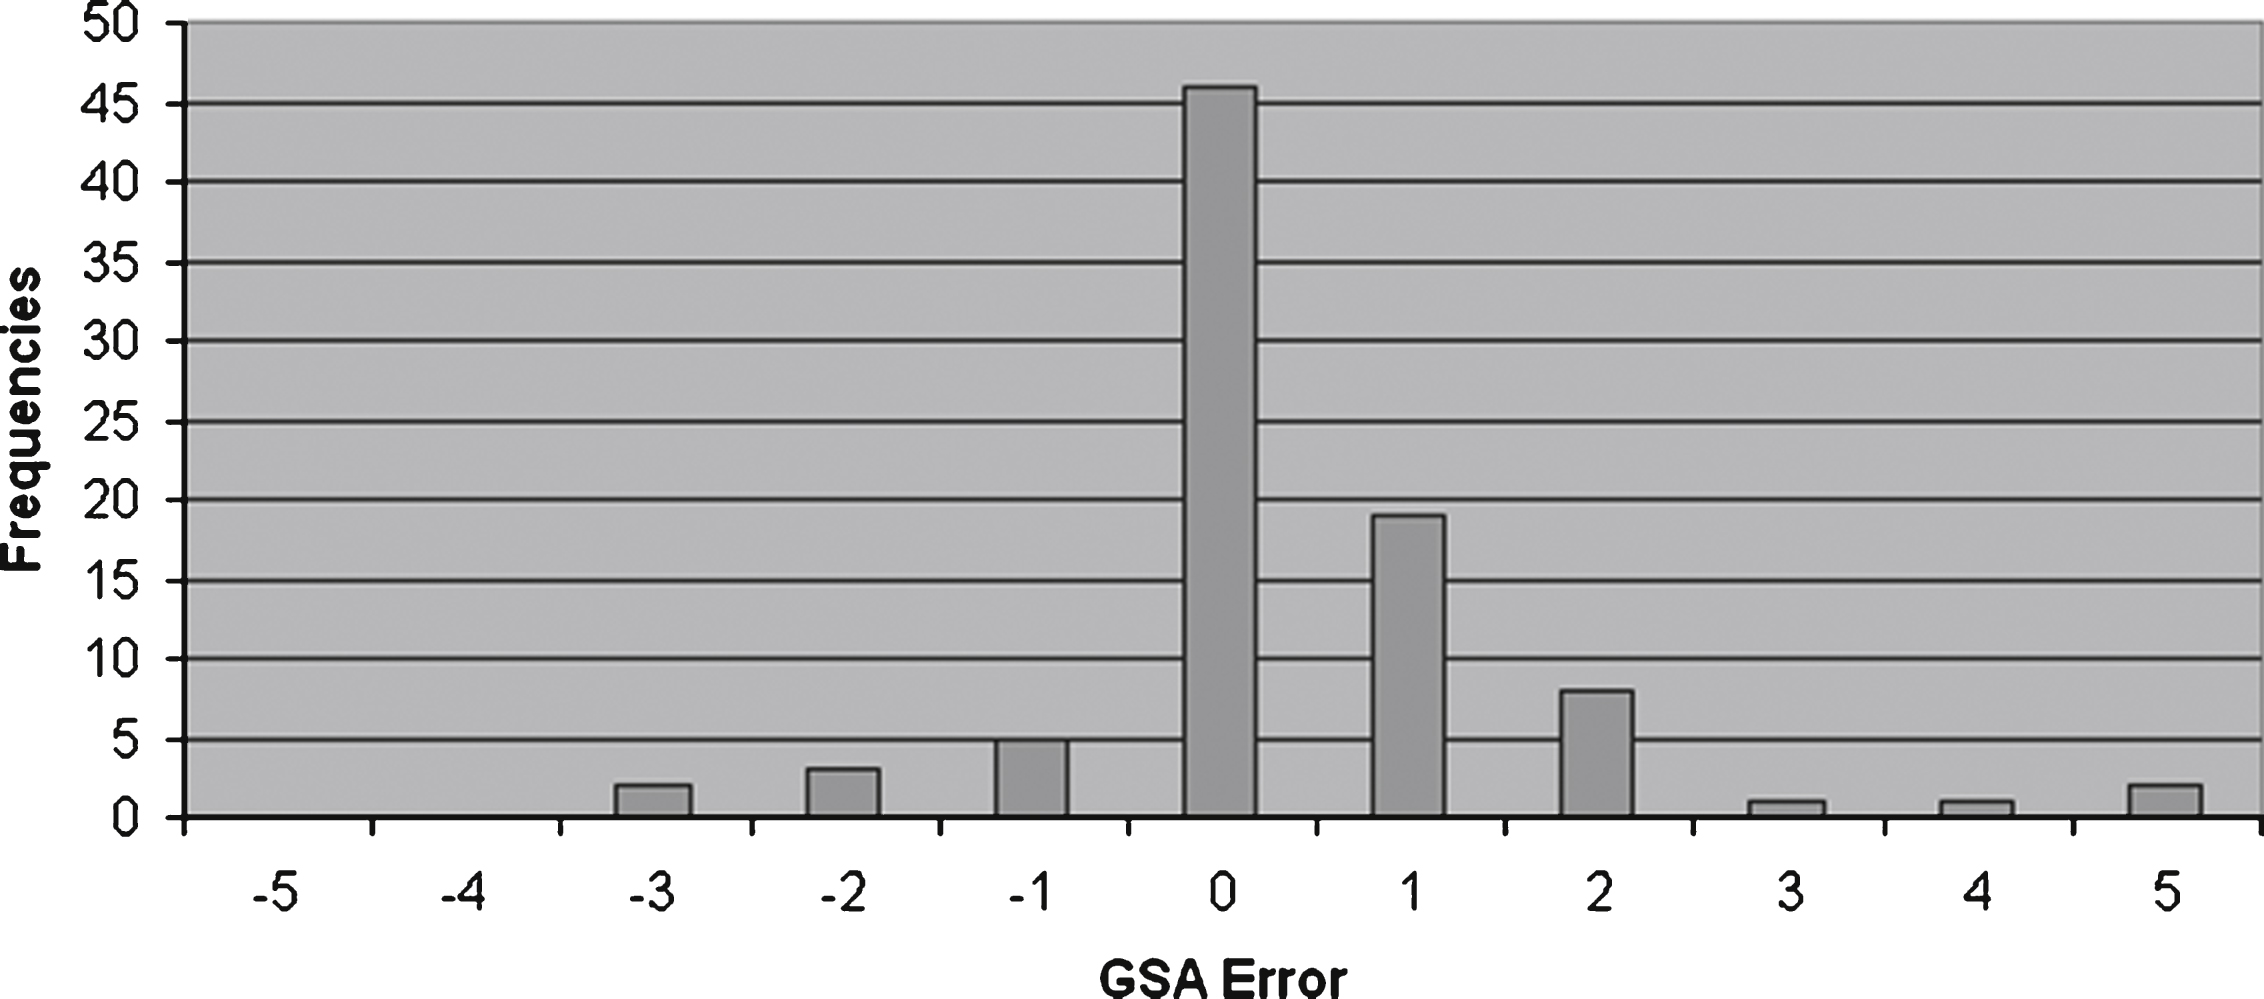
Fig.15
Isodamage curve High Hazard and Interlayer failure compared.
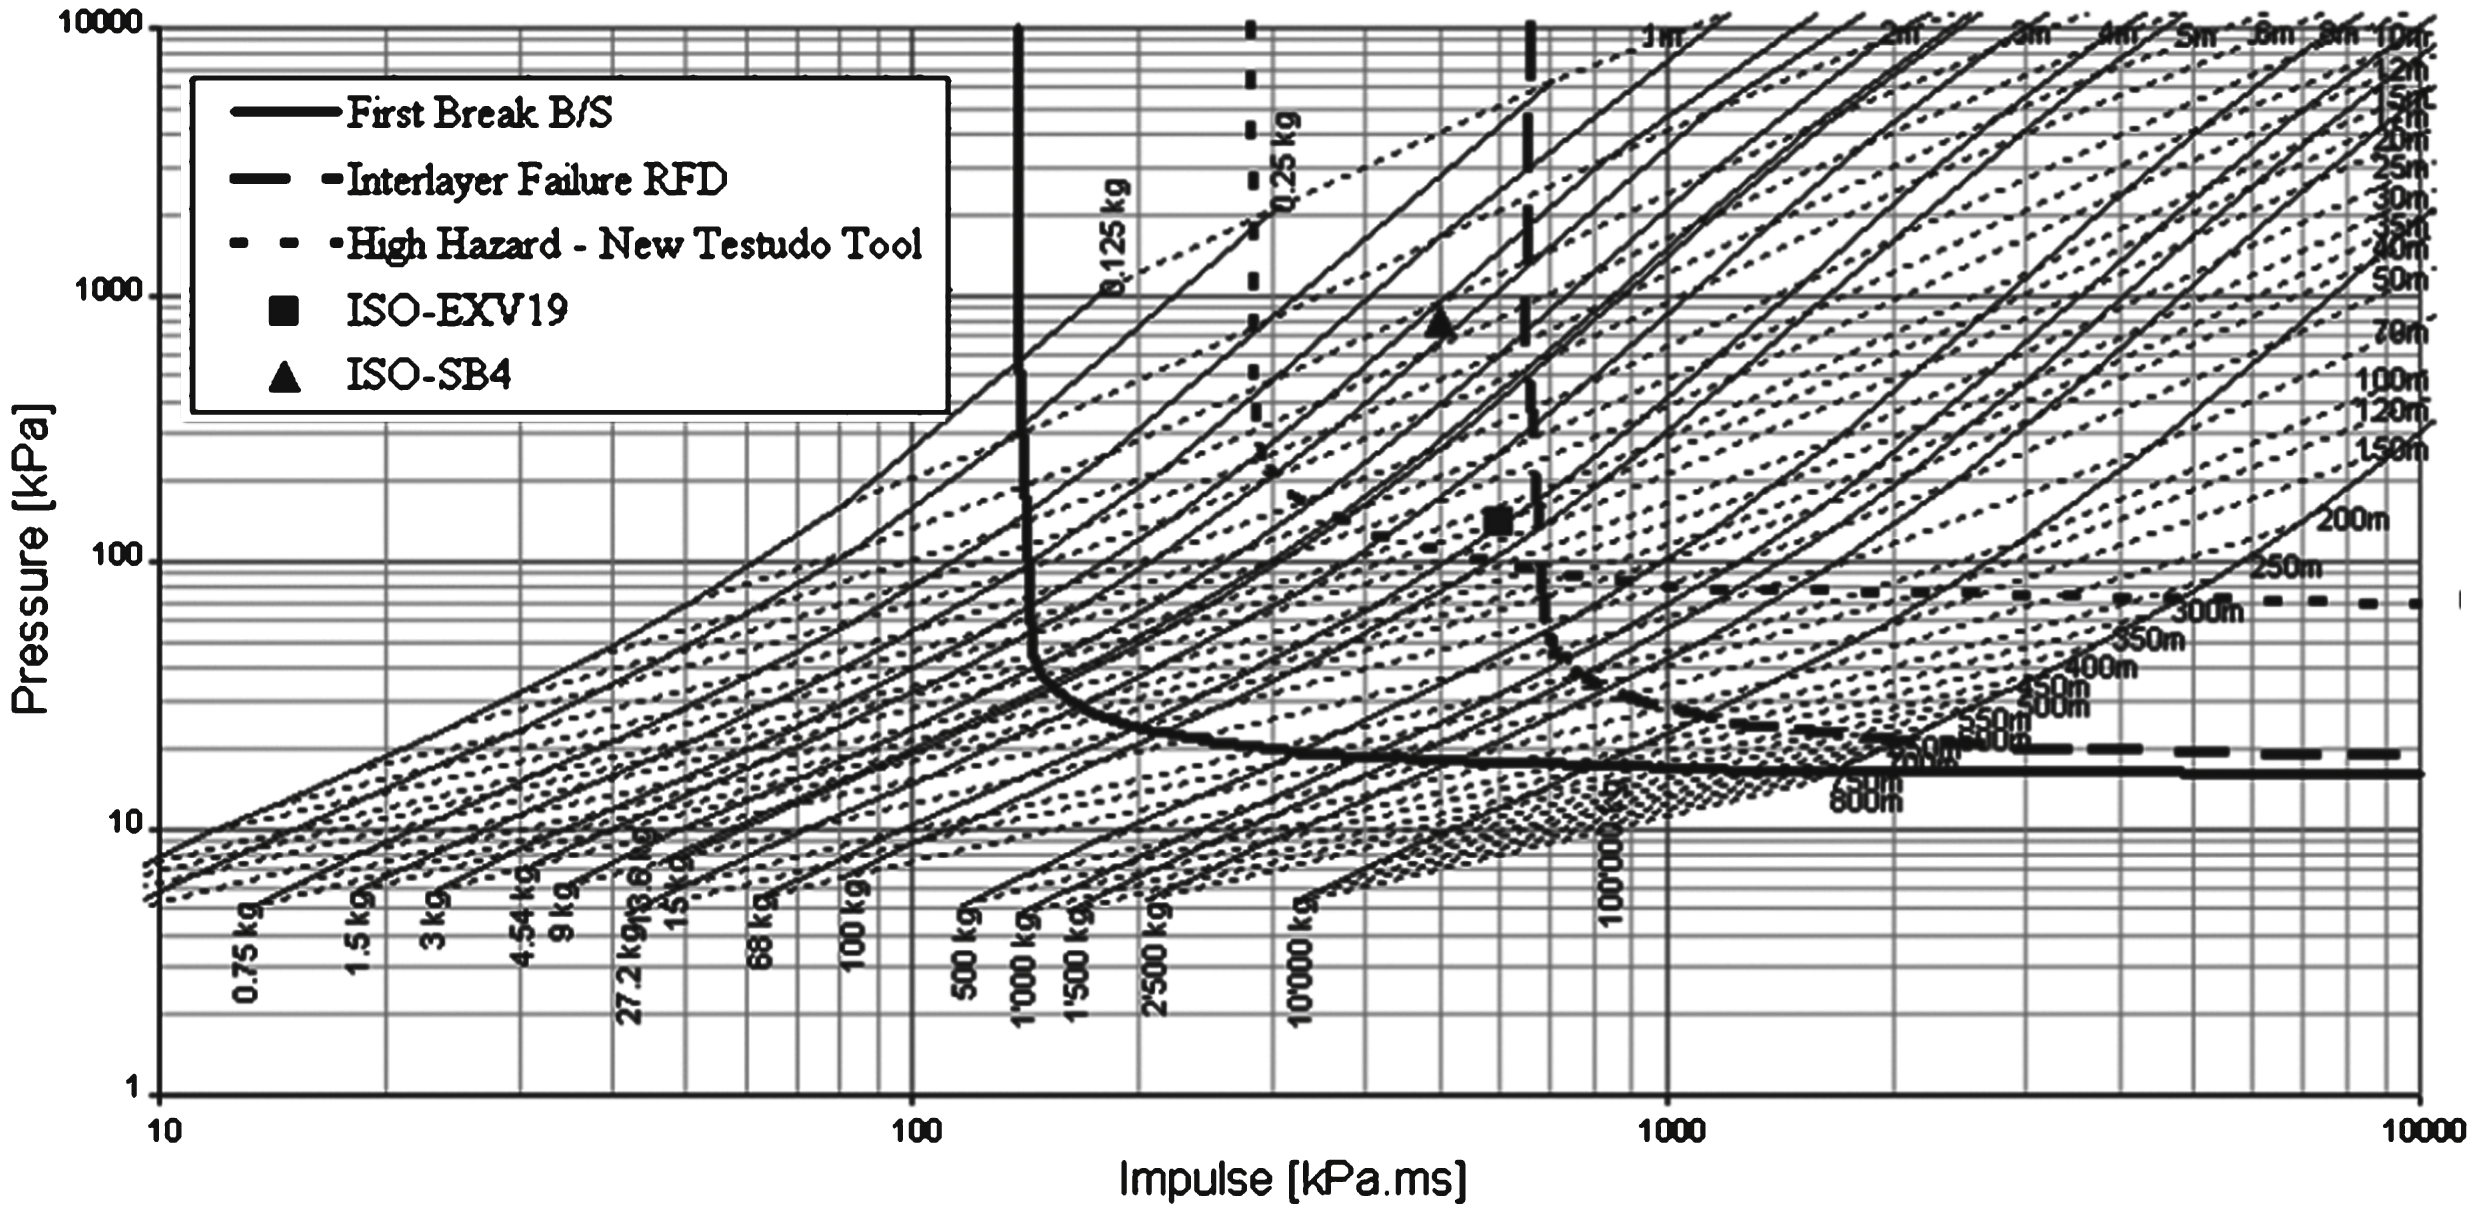
Fig.16
Increase in reactions under non-optimized hazard assessment.
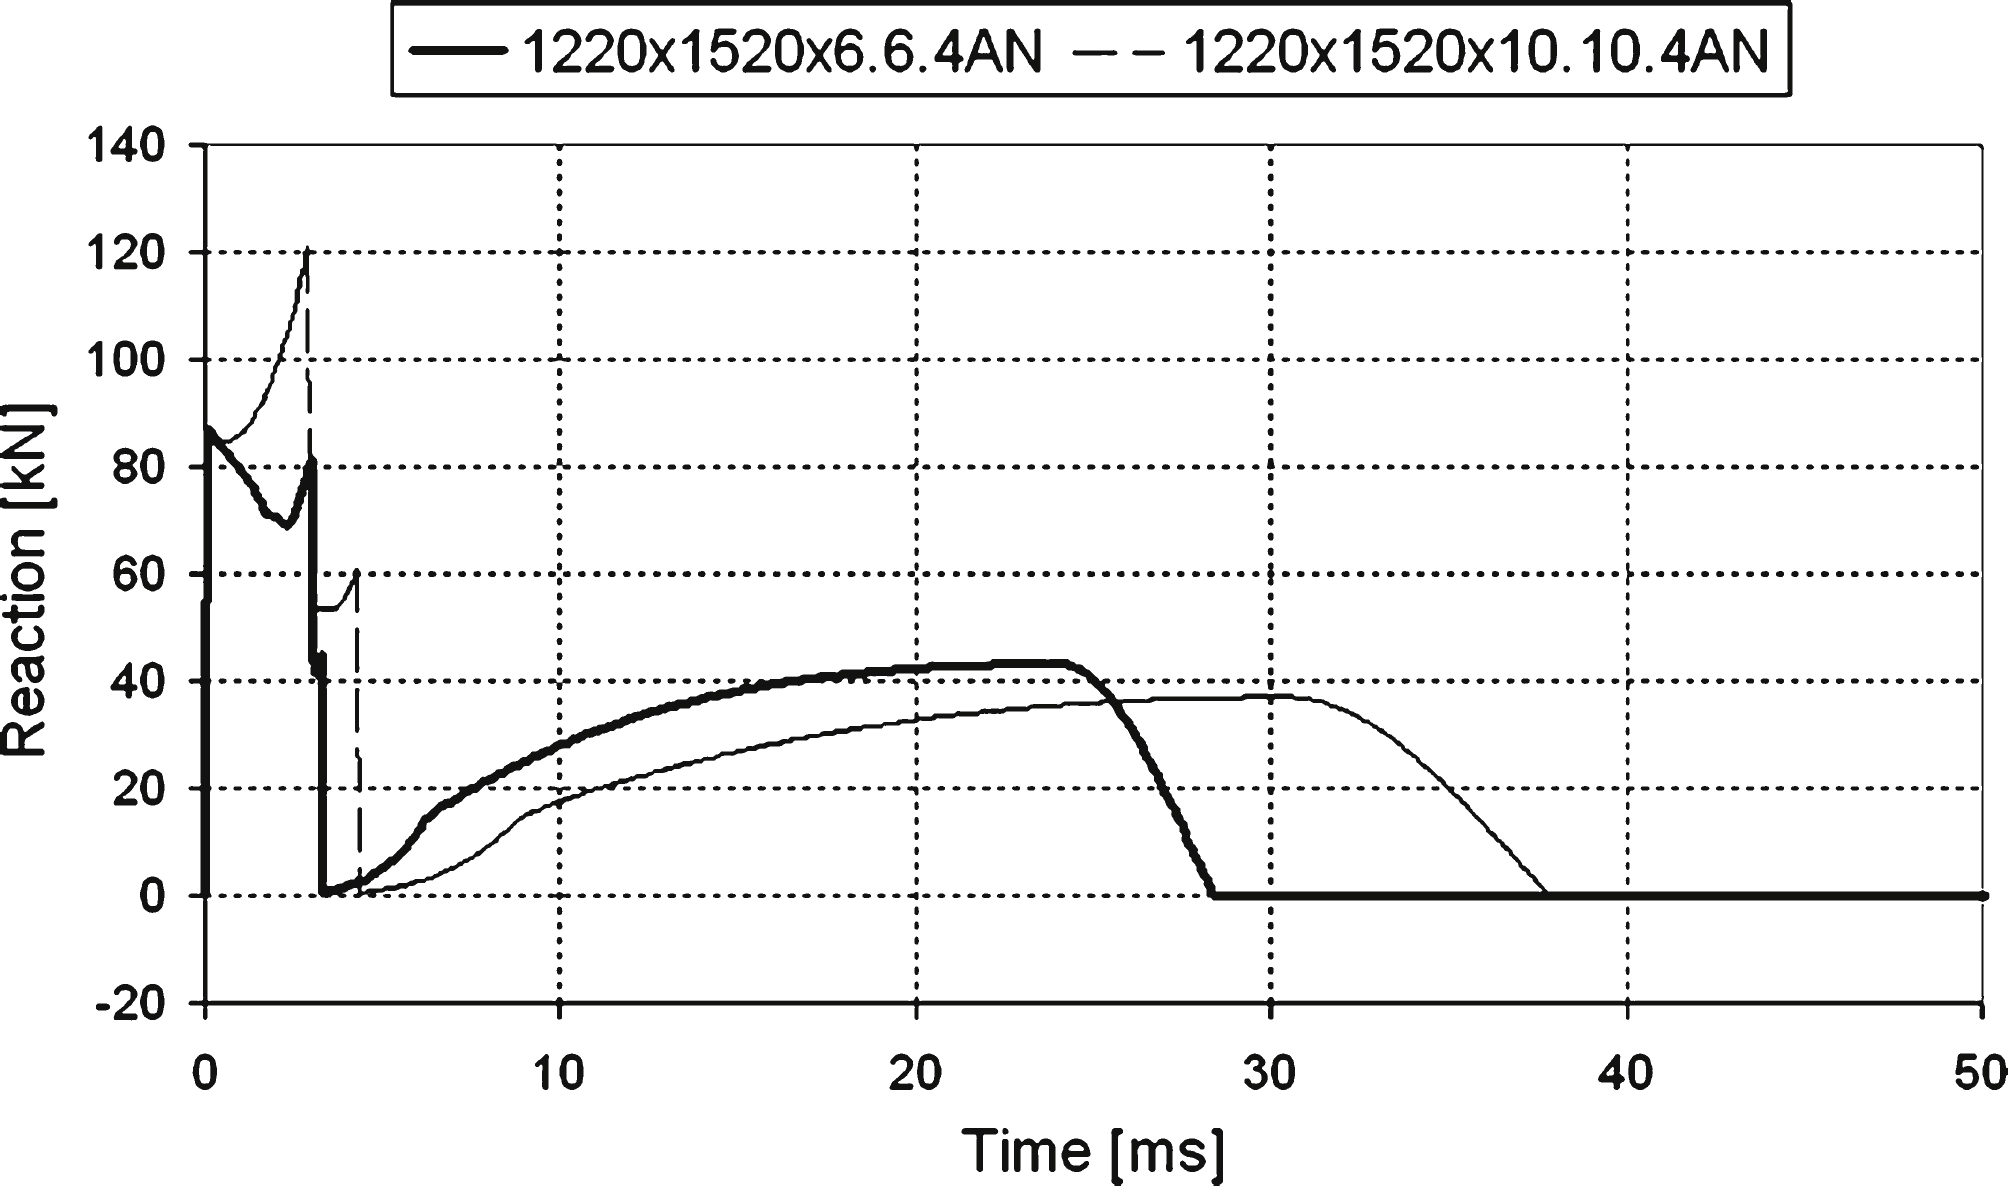
Table 1
Impulse mitigation effect of a 1500 × 4200 × 8AN-16-3.3.4AN under GSA D
| Lay-out | Specific reaction impulse [kN/m2.ms] | IR | Specific reaction RMS [kN/m2] | RRR |
| Deformable Glass | 570 | 0.93 | 4.67 | 0.23 |
| Deformable Glass and Mullion | 641 | 1.04 | 3.39 | 0.17 |
| Deformable Glass, Mullion and Bracket | 545 | 0.89 | 2.73 | 0.14 |
| Two Step (MDOF+FEM) | 618 | 1.01 | 6.4 | 0.32 |
Table 2
Impulse mitigation effect of a 1500 × 4200 × 8FT-16-3.3.4FT under GSA D
| Lay-out | Specific reaction impulse [kN/m2.ms] | IR | Specific reaction RMS [kN/m2] | RRR |
| Deformable Glass | 894 | 1.46 | 18.85 | 0.95 |
| Deformable Glass and Mullion | 738 | 1.02 | 3.65 | 0.18 |
| Deformable Glass, Mullion and Bracket | 559 | 0.91 | 3.15 | 0.15 |
| Two Step (MDOF+FEM) | 714 | 1.16 | 10.42 | 0.52 |

