
Digestion of preserved and unpreserved fish intestines for microplastic analysis with emphasis on quality assurance
Abstract
BACKGROUND,
Different preservation media used on fish samples may influence the digestion of organic matter for microplastic (MP) particle detection. Comparison of fresh and conserved fish is thereby problematic.
OBJECTIVE,
For quality assurance purposes and comparability of MP research, a method for digestion of preserved tissue like intestine with little impact on most MP particles was implemented.
METHODS,
Conserved fish samples were digested using SDS, KOH and Fenton’s reagents. The effect of the different chemicals used on different MP particles was then analyzed using Raman hit quality. Therefore, different filter materials were investigated using PMMA particles.
RESULTS,
Moist grided nitrocellulose filter was found best suited for this study. The effects of this digestion protocol on different polymer particles differed among polymers. Two of the used polymer particles dissolved during SDS + KOH treatment. PVC hard showed the highest loss of Raman hit quality (29.5 %). Some fish showed residues of sand or chitin from insects depending on their feeding strategy which could not be digested using this protocol.
CONCLUSION,
Not every polymer could be detected reliably using this protocol. For residues like sand or chitin, a density separation and enzymatic chitin degradation using chitinase may be needed, which could be implemented into this protocol.
1Introduction
Plastic pollution is increasingly becoming a major global environmental issue, which is due to the various physical, chemical and biological degradation steps that change larger fragments of plastics into micro- and nanoplastics [1, 2]. Microplastics are ubiquitous environmental contaminants and a hazard for vast numbers of organisms [3–10] and their eco-systems [11–20]. For example, polystyrene microplastic particles were found to penetrate the blood-brain barrier in mice [21] and produce inflammation and other lung-injuries in rats [22]. Humans, the responsible agents for this environmental contamination, are also afflicted by this problem of micro- and nanoplastic contamination as microplastics have been found in human stools [23], lungs, [24] and blood, [25] and are suspected to be able to penetrate the placenta [26]. Although several studies have been conducted on ingested plastics in marine fish [27, 28], seafood [29, 30], bivalves [31] and other sea life [30, 32] there has been relatively little research carried out on microplastic in freshwater ecosystems and organisms [33–36].
Before the analysis of the micro- and nanoplastic particles can proceed, the associated biological matrix must be removed. To this end, differing methods incorporating both enzymatic and chemical agents were used [37–40]. Existing methods for the extraction of microplastic from bivalve tissues were considered and evaluated for use on our fish samples [38]. The use of acids was not considered due to their ability to corrode some plastic types. The authors Thiele et al concluded that 10% KOH (potassium hydroxide) would be the most suitable digesting technique for bivalves, especially in comparison to enzymes and H2O2 (hydrogen peroxide) because of its alkaline cleavage of fats and proteins which leads to a high efficacy (>95%) without damaging most plastic types [38]. Another research group published a validation of microplastic extracting methods identifying Fenton’s reagents as the best and KOH solution as unsuitable for removing organic matter in microplastic studies. This statement is based on the resistance of cellulosic and chitinous material to dissolution by KOH and the degradation of some of the investigated plastic types [39]. Recent work on microplastics in riverine fish successfully employed wet peroxide oxidation with Fe(II)sulfate (Fenton’s reagents) as a catalyst to dissolve organic material [34]. Masura et al. give a detailed description of the synthesis procedure and the application of the Fenton’s peroxide digestion protocol [41].
To date only one publication has been conducted so far on preserved freshwater fish [42]. Perspectival no publication on biological tissue like human or other animal has been conducted. Thus, there are currently no known data on whether existing extraction methods are suitable for micro- and nanoplastic analysis in preserved biological samples such as fish, insects, other animals, and humans. As microplastic (MP) particles were found in human lungs [43], stool [23], blood [44], and placenta [26], these data would be of great interest regarding preserved human samples to detect MP particles and to compare their occurrence in human tissue over time. Furthermore, it is not known whether and how the different compositions of preservation and fixation materials influence the micro- and nanoplastic analysis in terms of detachment from the tissue, degradation, morphology, detection, and characterization with methods such as thermal desorption gas chromatography-mass spectrometry (TDS-GC–MS) [45, 46], Transform Infrared Spectrometer (FTIR) [47–49], Raman spectroscopy [50, 51] and other methods like fluorescence lifetime imaging microscopy (FLIM) [52–54].
Extensive collections of preserved fish at different institutes such as the Tennessee Aquarium natural history collections (TNACI) provide an important window into past MP pollution that spans decades and can potentially provide trends in pollution over time. Ingested MP found in fish guts can be considered as a MP pollution indicator of freshwater systems [35]. The type of chemicals used by ichthyologists in the preservation process can affect the tissues, cells, and proteins of the organism. It is reported that the small formaldehyde molecule with its electrophilic character can easily penetrate into tissue to form covalent cross-links with structural proteins, where it builds protein-DNA or other complex structures causing higher molecular weight aggregates with higher density so that fixation in the tissue is achieved [55–57]. During this crosslinking process between functional reactive side groups like amido, guanidine, thiol, phenol, imidazolyl and indolyl of the polypeptides strong methylene bridges are formed [58–63]. These reactions and cross-links between biomolecules can potentially be problematic for the enzymatic as well as chemical digestion of biological samples.
As these two digestion methods may interact with the plastic particles, these methods had to be analyzed regarding their effects on plastic polymers. Therefore, in this study the two digestion methods were scrutinized in order to detect any impact on the polymers. The effect of the conservation and digestion reagents (Fe(II) and H2O2) on MP particles was not investigated in the work by Hour et al. [64]. We therefore investigated any potential influences of these reagents, including KOH, on MP polymers in detail.
To determine any impact of the digestion processes on the MP particles, fresh fish samples, conserved fish samples and untreated MP particles (virgin) serving as control materials were digested using a combination of KOH and Fenton reaction with heat-treatment. Afterwards the samples were filtered, washed with ethanol (95 %) and dried at 60°C. The MP particles could then be detected using Raman-spectrometry.
2Materials and methods
2.1Sampling of fresh fish and feeding mechanism
The freshwater fish, Bluegill (Lepomis macrochirus), Carp (Cyprinus carpio), Channel Catfish (Ictalurus punctatus), Gizzard Shad (Dorosoma), Largemouth Bass (Micropterus salmoides) and White Bass (Morone chrysops), were caught via electrofishing (Supporting information Fig. S1) from the Tennessee River, 1 mile upstream from the Suck Creek (n = 24). The fish were measured regarding their length (standard length SL from 82.4 mm to 590,6 mm in Table 1). The 6 tested fish species do have different feeding strategies related to depth (Table 1) possibly resulting in variations in the MP contamination levels [65].
Table 1
Feeding strategy of different fish caught at the Tennessee River
| Fish type | Standard Length (SL) | Feeding mechanism |
| Bluegill | 82.4-15.8 mm | Sight feeder |
| Carp | 546.1–590.6 mm | bottom feeders but also eat aquatic plants |
| Channel Catfish | 396.8–463.5 mm | some are bottom feeders (but not exclusively bottom feeders) |
| Gizzard Shad | 196.9–260.4 mm | primarily a filter feeder and bottom feeder |
| Largemouth Bass | 190.5–349.3 mm | sight feeder, takes food from the surface, in the water column and off the bottom. |
| White Bass | 288.4–325.2 mm | visual feeders |
2.2Reference material
The different plastics acrylonitrile-butadiene-styrene copolymer (ABS –Novodur P2MC, Bayer), Cellulose acetate CA (Milliporetrademark, Merck KGaA, Darmstadt, Germany), polyamide (PA - BASF SE, Ludwigshafen, Germany), polycarbonate (PC –Makrolon HP 501 H, Basel), polyethylene (PE - BASF SE, Ludwigshafen, Germany), polyethylene terephthalates (PET –Plastic bottle, transparent), polylactides (PLA –plastic drinking cup), polymethyl methacrylate (PMMA - Spheromeres, Microbeads AS, Skedsmokorset, Norway), polypropylene (PP –Moplen HP 501 H, Basel), polystyrene (PS -Duni GmbH, Bramsche, Germany), polyurethane (PU -MINIWAX, fast-drying polyurethane, clear gloss, Walmart), polyvinyl chloride hard (h) and soft (s) (PVC - BASF SE, Ludwigshafen, Germany) and styrene-acrylonitrile copolymers (SAN –Lustran. INEOS Styrolution) were included in the study as reference materials. These plastics were selected based on their environmental relevance, different chemical resistance to acids, oils and solvents, and different stability to UV radiation. The defined cross-linked mono sized PMMA beads (data sheet in the appendix) were included in all parts of the study with a defined size distribution of 15μm, 30μm, 40μm and 60μm.
Thin film production
For quality assurance, the influences of various treatments such as the preservatives were tested for their effect on the various plastics and their ability to be identified with the Raman. For this purpose, thin film sections with a film thicknesses of 50 and 100μm were produced from 13 types of plastic via microtomy (RM2255, Leica). The thin film plastics ABS, SAN, PA, PC, PE, PLA, PP, PS, PET, PU, PVC (hard & soft) were only included in the investigation in chapter 2.4 (Influence of the preservative on different plastics).
2.3Sample preparation of fresh and preserved fish
The fresh fish samples were frozen after dissection of the digestive tracts in contrary to the preserved fish samples (see Supporting Information Fig. S2). Several types of preserved fish samples (Bighead Carp, Hog Sucker, Striped Shiner, Gizzard Shads, Flathead Chub) with a standard length between 64 mm and 120 mm were investigated in order to determine the most effective chemical digestion protocol for their guts (gut weight between 90 mg and 1215 mg). The preserved fish were stored mainly in 70% ethanol over years or 50 % isopropanol once they have finished the first preservation step in a 10 % formaldehyde solution (Fisher Scientific). For the formaldehyde solution one part of full-strength formaldehyde (37 % formaldehyde by weight (stabilized with 12 –15 % methanol) equals 100 % formaldehyde) was diluted in ten parts of river water. For fish longer than 100 mm a stronger mixture was used (1:1 Formaldehyde: water) or an incision was made in the stomach walls in order to preserve the stomach and intestines. The formaldehyde was removed after at least two weeks by soaking the fish in freshwater for two or three days during which time the water was changed several times. After that the specimens are stored first in 50 % isopropylalcohol or 70 % ethylalcohol for which 95 % ethyl alcohol in either a 55-gallon (208.2 L) metal drum or 5 –20-gallon (18.9–75.7 L) plastic drum was diluted to 70 % using tap water and a hydrometer adjusting the temperature of the liquids. Many collections, including the one from Tulane University, store the samples in 50 % isopropanol rather than 70 % ethanol. As ethanol is better suited for a long-term preservation of fish samples, most museums including Tulane replaced the isopropanol with 70 % ethanol in the 1990 s and early 2000 s.
2.4Influence of preservative and digestion chemicals on different plastics
An important consideration when examining preserved fishes for contamination with micro- and nanoplastics is whether these can still be identified and characterized with appropriate methods after a specified exposure time in the preservative. For this reason, the detection rate of the particles after digestion must be tested as a control for the experiments and also to determine whether the preservation has an influence on the morphology or the spectral identification. Although it has been established that the aging of the plastics can generate spectral variations [66], the behavior of plastics that have been exposed to light or not exposed to light and have been in contact with the preservative solution is not known.
To investigate these factors in more detail, the thirteen plastics (2.2 thin film production) were treated to conditions comparable to those in preserved fish samples (2.3 Sample preparation of fresh and preserved fish). De-ionized water was used after the treatment with 10 % formaldehyde and the polymers were transferred into 50 % isopropanol for a minimum of 2 weeks with a small amount of formaldehyde (1:100) to replicate residual formaldehyde left in specimens after washing with de-ionized water. Afterwards the specimens were again rinsed in de-ionized water. The water was exchanged for 70 % ethanol for a minimum of five months without formaldehyde and dried at room temperature. The particles were then examined for significant differences in morphology and spectral conditions under the Raman microspectrometer and compared to the time zero results.
2.5Digestion and extraction
Different reagents (Fenton, KOH, H2O2) were tested for their efficacy in the digestion of samples. Some of these reagents were ultimately combined (Fig. 1).
Fig. 1
Schematic representation of the treatment process of the developed method.
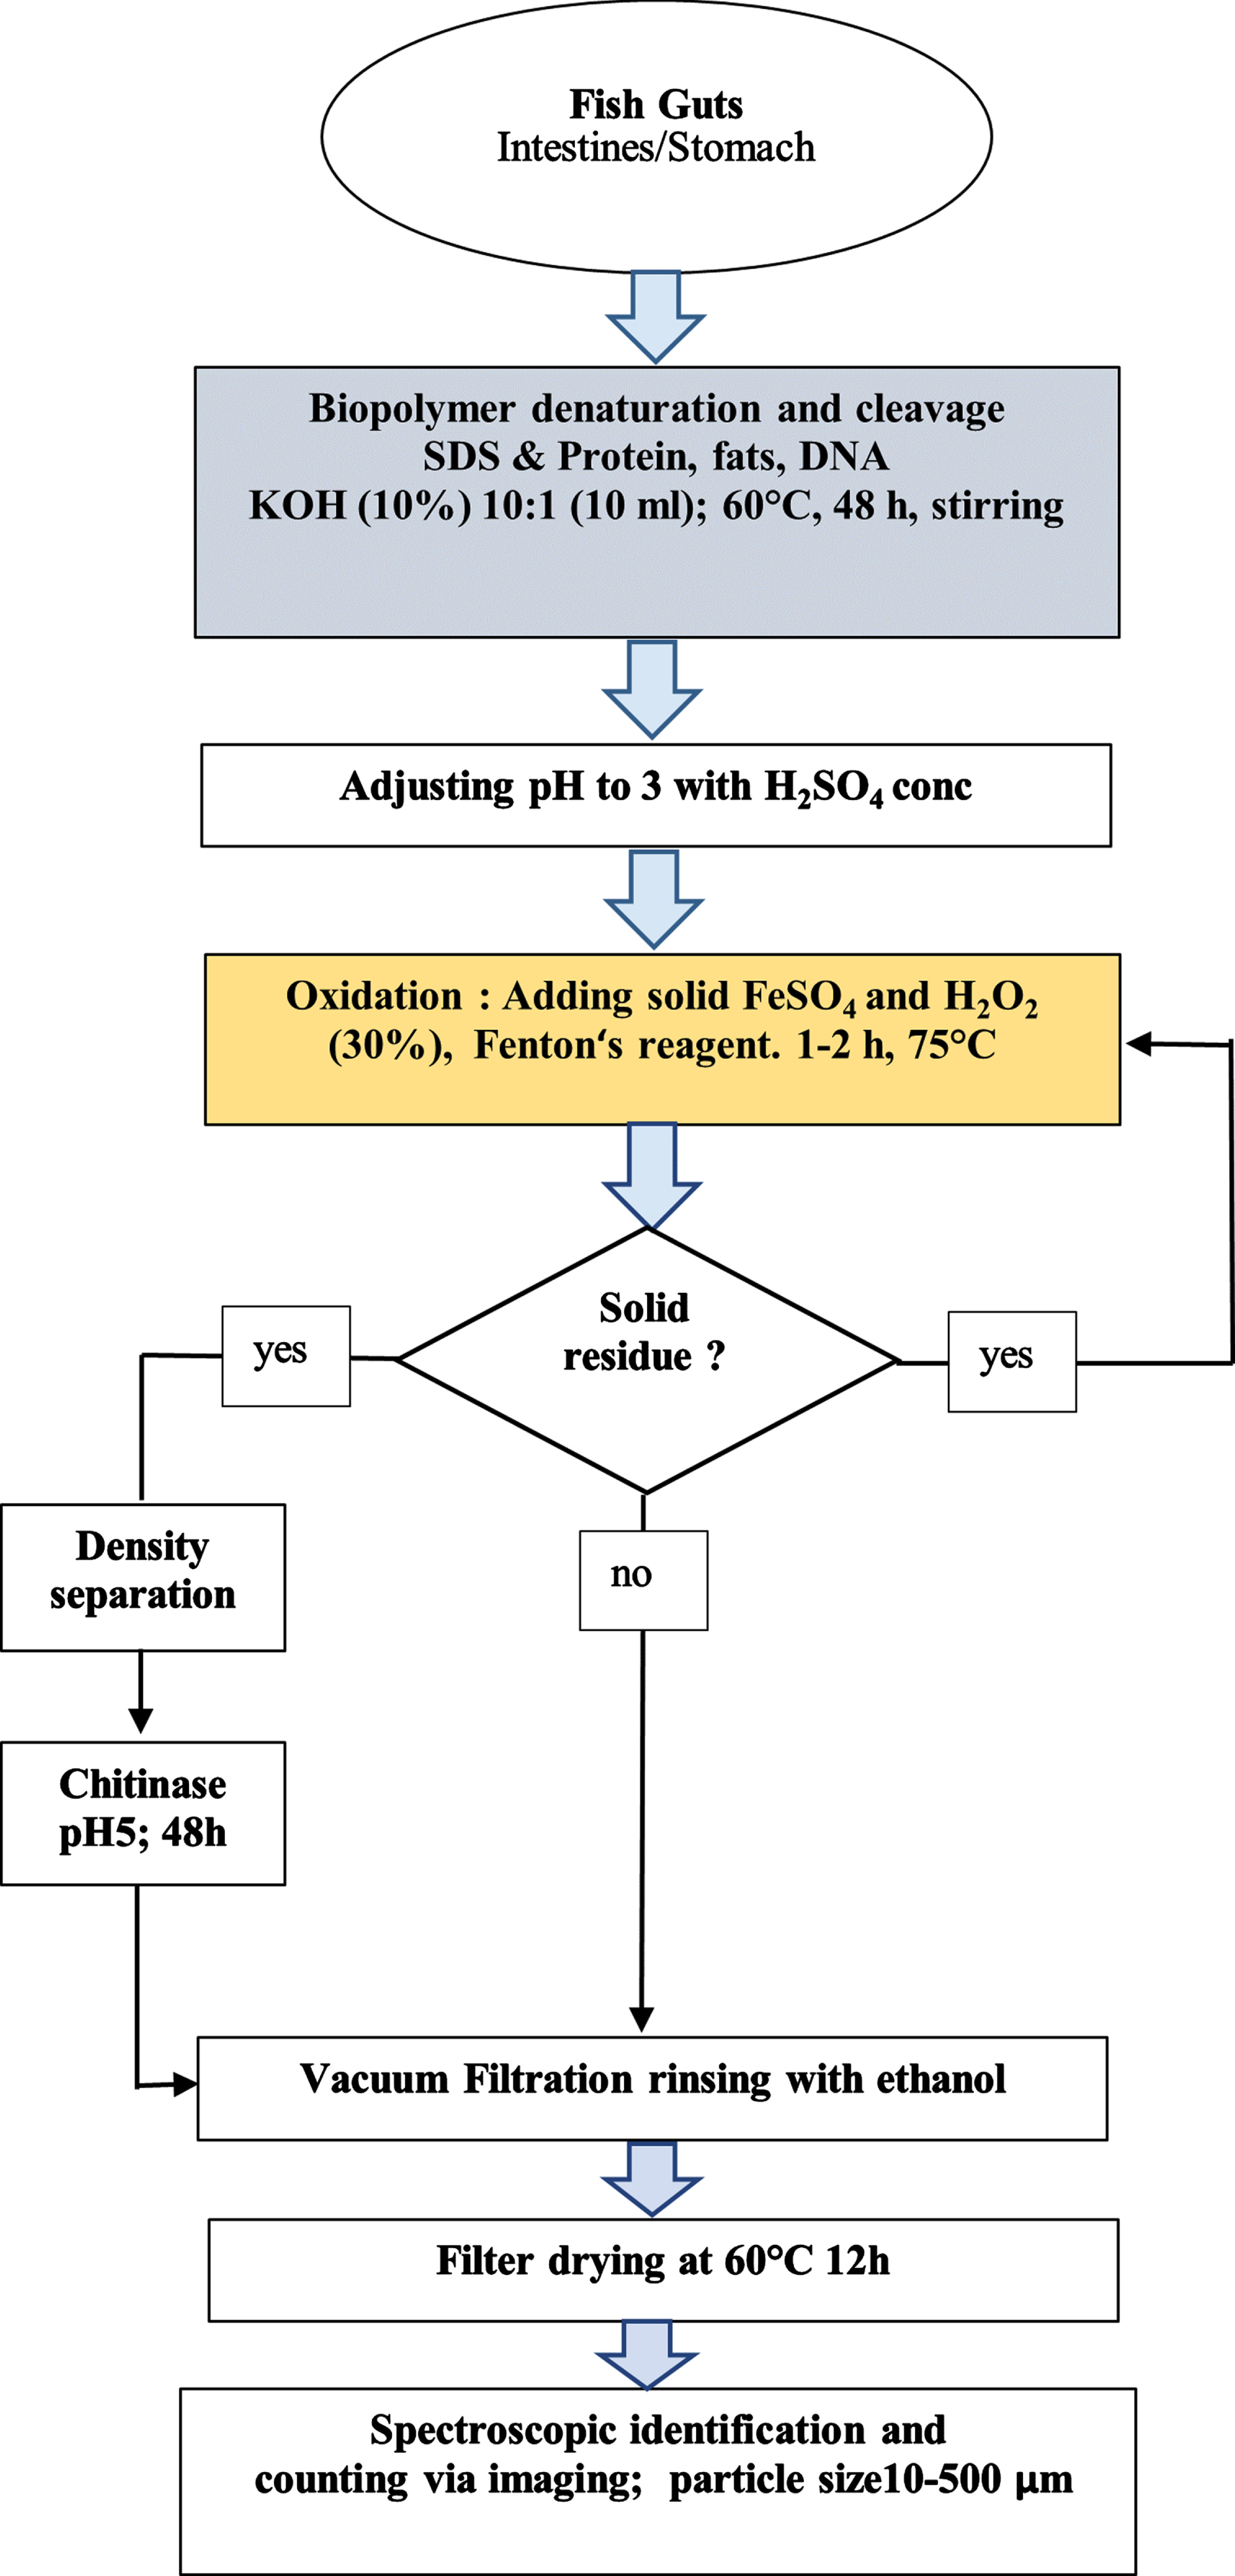
Three gut specimens (200–770 mg) from Flathead Chubs (Platygobio gracilis; origin: Pecos River, Guadalupe, New Mexico, March 2014, SL 92–103 mm) were treated with a mixture of Fenton’s reagents (20 ml Fe (II) sulfate solution (AppliChem GmbH, Darmstadt, Germany); makeup procedure: 7.5 g FeSO4·7H2O (AppliChem GmbH, Darmstadt, Germany) in 500 ml water, 3 ml conc. 96 % H2SO4) and hydrogen peroxide solution (30% (w/v), (AppliChem GmbH, Darmstadt, Germany). The start of the reaction is noticeable by the appearance of gas bubbles (caution: the oxidizing reaction could lead to a strong foaming with overcooking even without heating, so the amount of MP could differ because of attachment to the glass wall or leaving the receptacle. After the reaction slowed, the solution was heated at 75°C for an hour on a hotplate while stirring. Another 20 ml of peroxide were added and heated again if organic material was left in the beaker. Once again, 20 ml of hydrogen peroxide (AppliChem GmbH, Darmstadt, Germany) were added and heated for 12 hours. The intestines of all three gut samples were still visible and showed no signs of chemical degradation.
The samples were filtered afterwards on a grided nitrocellulose filter (0.45μm pore size, Sartorius) using a vacuum system (weights of the three samples with the filter: 80.1 mg, 80.5 mg, 80.2 mg). The filters were washed with ethanol 95 % (Fisher Scientific) and dried for 12 hours (60°C) (weights: 8.8 mg, 60.3 mg, 12.9 mg). If further contamination occurs, density separation or enzymatic chitin degradation using chitinase could be used followed by Raman spectrometry or further analysis methods (Fig. 1).
2.6Evaluation of digestion efficacy
As some of the chemicals used could degrade MP particles the digestion efficacy has to be tested. Therefore, the weight of the sample (gastrointestinal tracts) must be related to the removal of organic material. The following equation was used to calculate the relative removal of organic material expressing the efficacy (%) of de digestion process (1).
(1)
The dry weight on filter paper represents the filtrate after filtration and washing steps and the wet weight entire gut tissue stands for the sample weight before the filtration.
Accumulation of undigested organic material (gut tissue) on the filter material, results in a lower efficacy and, could negatively affect the study of MPs in fish guts. As a result efficacies above 95% were attempted.
2.6.1Density separation
To separate possible solid components after the Fenton reaction (see Fig. 3B), another Fenton reaction can be conducted, or interfering components can be removed via a density separation. To adjust the solution for the density separation with a density of 1.54 g/cm3, zinc(II) chloride (Acros Organics, Geel, Belgium) was used. This value was chosen to achieve a quick separation of the polymers. PET displayed the highest density of all polymers observed with 1.4 g/cm3 and sand had a density between 1.8 and 2.2 g/cm3. Here, 10 g, 15 g and 20 g of zinc(II) chloride were added to 20 mL of deionized water (density = g/cm3), respectively, and the change in density was measured in triplicates using a balance (Sartorius, Göttingen, Germany) and a volumetric glass cylinder (Pyrex, Sigma-Aldrich, Missouri, US) and documented (Supporting information Fig. S3).
2.7Selection of suitable filter materials for spectroscopic identification of MPs
Another important aspect that was focused on this study was the composition of the filter that would work best for the Raman analysis. The composition of the filter can have an influence on the hit quality of the analysis and thus on the determination of the type of plastic. We also investigated to what extent five months of preservation and subsequent extraction in combination with different filter materials had on analytical results. To that end, six different filter materials were included in the analysis and are listed in Table 2 together with the manufacturers. For a relevant statistical comparison, in each case triplicates of the reference plastics (PMMA) were examined on the different materials with Raman microspectroscopy. Supporting information Fig. S5 shows PMMA particles on cellulose nitrate filter before and after Raman analysis demonstrating the burned filter after measurement.
Table 2
Listing of the filter materials used for Raman analysis with their corresponding properties and information on the manufacturer. *PMMA particles (60μm) on polycarbonate filter are detected as PET
| Filter material | Properties | Manufacturer |
| Anodisc (Al2O3) | 0.2μm pore size, 25 mm diameter | Whatman |
| Cellulose acetate | 0.45μm pore size, 47 mm diameter | Millipore |
| Cellulose nitrate backside &gridside | 0.45μm pore size, 47 mm diameter | Sartorius |
| Glass fiber | 1.6μm pore size, 47 mm diameter | Whatman |
| Polycarbonate* | 0.4μm, 47 mm diameter | Whatman |
| Steel | 10μm pore-size, 47 mm diameter | Haver &Boecker |
2.8Contamination prevention
Reducing contamination during sample preparation and analysis is of paramount importance. To limit contamination, no synthetic gloves were worn during sample manipulation, extraction, or transfer of the different materials for Raman analysis. Furthermore, only 100% cotton clothing and pink 100% cotton lab coats were worn. The working surfaces were cleaned before and after work. The equipment for the preparation and extraction was washed in a dish washer, then rinsed with 70% ethanol with deionized water and dried. The deionized water was filtered two times to remove MP contamination from the filtration system. The lab room were accessed only by required personnel. Sample preparation, extraction, and the transfer to the different filter materials for the Raman analysis were performed under a laminar flow cabinet.
2.9Statistics
Statistics on the quality (hit quality) of Raman measurements were performed in three measurements of each sample (filter) at variable locations on the treated plastic. Statistical analysis of the generated spectroscopic data was performed using GraphPad Prism 9 statistical software ((version 9.4.0), GraphPad Software, Inc. San Diego, USA). First, we tested the null hypothesis of the mean values (hit quality) of Raman measurements within individual groups of treated plastic with a one-way ANOVA (Supplementary Information Table S1). This permitted a significant differentiation of the treatments and their influence on the individual plastics and thus help determine which of the plastics used were unsuitable for this method because of the possibility that they could not be detected or identified in later tissue examinations. The critical value for significance was set at p = 0.05 for statistical evaluation for the hit quality.
3Results
3.1Quality control
3.1.1Selection of suitable filter materials for spectroscopic identification of MPs
Table 3 shows the Raman hit quality data of different filters (specifications shown in Table 2), for the samples which were each run three times. Their mean and standard deviations (SD,±) are also indicated. The steel grid filter, pore size 10μm, shows the highest SD with 90, followed by glass fiber (75) and anodisc (62), which demonstrates the smallest mean of Raman hit quality (387). Cellulose nitrate gridside demonstrates the smallest SD with 34 then brass with 38. Cellulose nitrate backside shows the highest Raman hit quality (736), thereafter steel 55 with 720 and brass with 708.
Table 3
Listing of the Raman hit quality data from different filters (triplicates) (view table 2)showing the mean of single spectra with standard deviations (SD,±)
| Material | Single spectrum | Mean+ SD of | ||
| single spectrum | ||||
| Anodisc (Al2O3) | 447 | 413 | 302 | 387 (±62) |
| Cellulose nitrate gridside | 653 | 732 | 671 | 685 (±34) |
| Cellulose nitrate backside | 716 | 719 | 772 | 736 (±26) |
| Glass fiber | 713 | 533 | 588 | 611 (±75) |
| Steel grid | 818 | 694 | 597 | 703 (±90) |
| Steel 55 | 702 | 657 | 802 | 720 (±61) |
| Brass | 761 | 685 | 677 | 708 (±38) |
3.1.2Influence of the preservative on different plastics
Figure 2 shows the Raman hit quality analysis of the different MP samples from Table 4. Remaining polymer types are shown in supporting information Table S6. The statistical analysis was conducted using Prism 9.4.0 showing the significance of the differences between the treatments using one-way ANOVA. PP, PS and SAN showed no significant (ns) quality loss after all treatments even though the treatments differed among each other for PP (extremely significant, p < 0.0001). ABS and PET show a very significant (p < 0.01) change of hit quality among the three treatments, among which SDS + KOH treatment display the greatest difference of all treatments (ABS virgin 828, SDS + KOH 966; PET virgin 759, SDS + KOH 979). The remaining MP particles prove an extremely significant (p < 0.0001, except PC p < 0.001) difference in hit quality among all treatments. PC and PLA particles dissolved during the treatment with SDS + KOH, therefore new polymer particles were used for the Fenton reaction.
Fig. 2
Raman hit quality analysis of MP samples (triplicates) for all treatments (virgin, conserved, SDS+KOH and Fenton) showing the mean and standard deviation. Significance of results using one-way ANOVA with Prism 9.4.0 is presented as: NS: not significant, *: p < 0.05, **: p < 0.01, ***: p < 0.001 and ****: p < 0.0001.
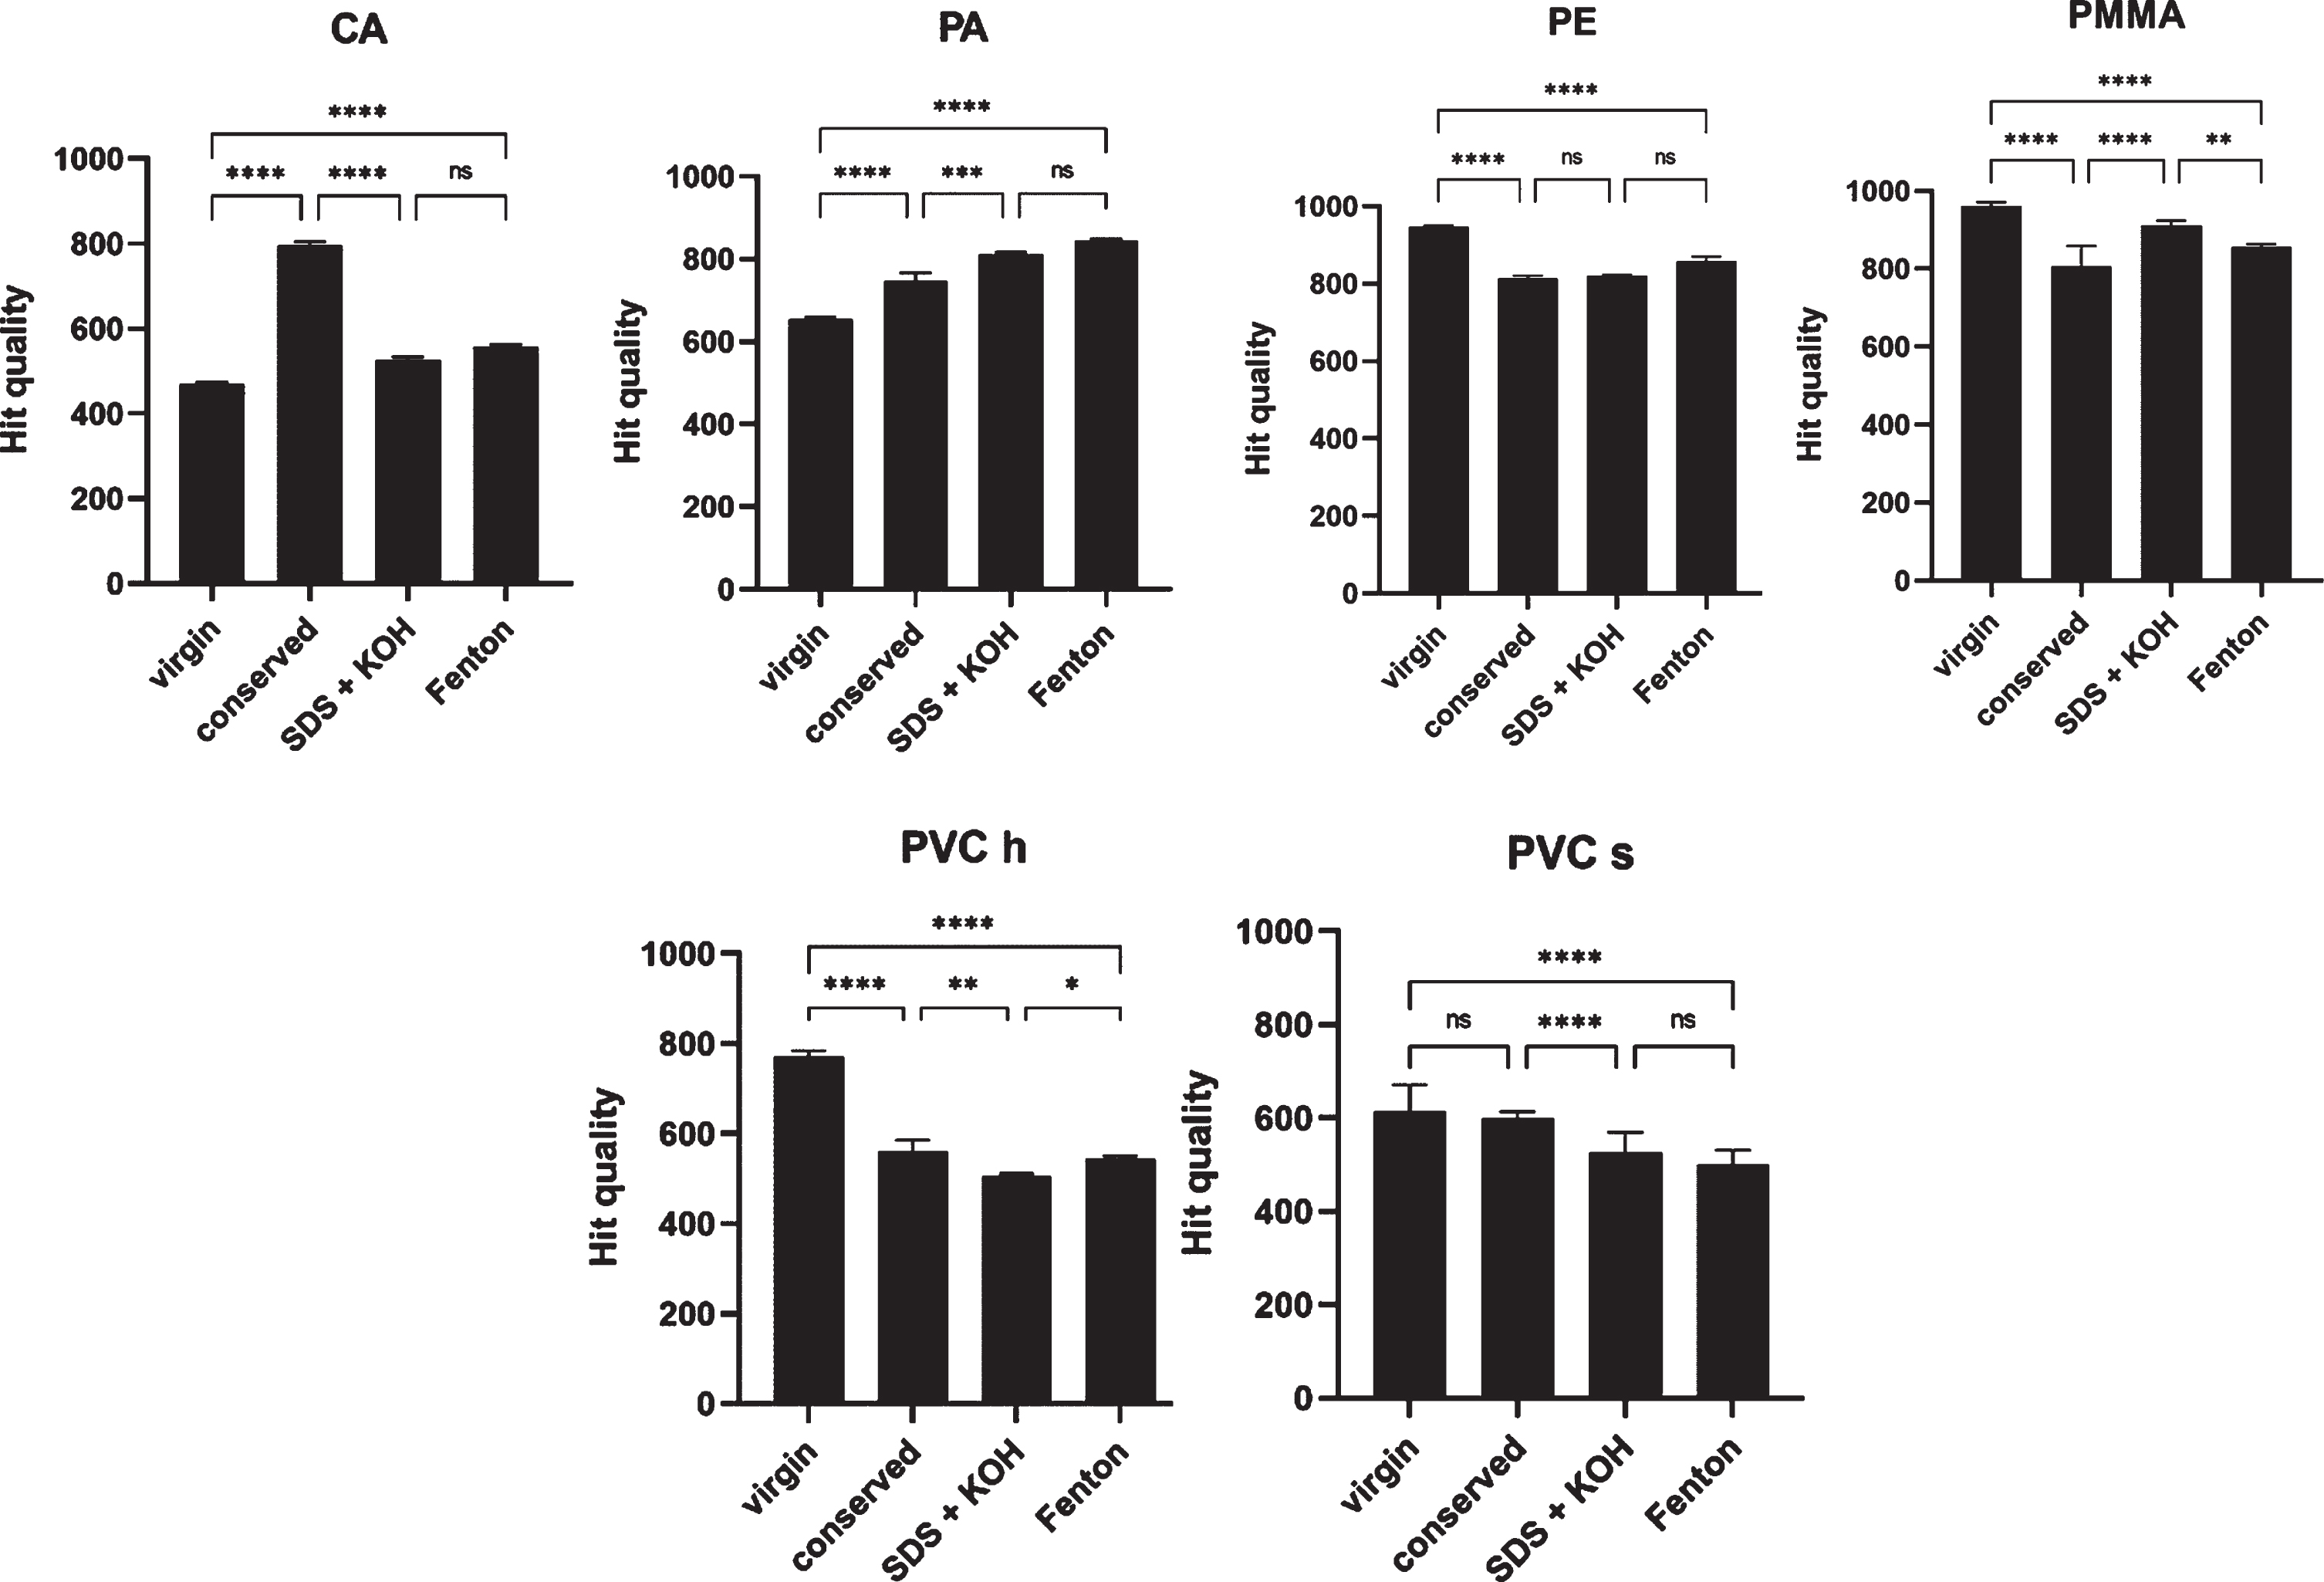
Table 4
Listing of the Raman hit quality data on MP samples (triplicates) showing the mean and standard deviation (±) of different treatment steps of the chemical digestion protocol. Total quality variation (%) shows difference in Raman hit quality between virgin samples and post-digestion protocol (Fenton)
| Polymer type | Virgin | Conserved | SDS+KOH | Fenton | Total quality |
| type | variation (%) | ||||
| ABS | 828 (±5) | 938 (±9) | 966 (±4) | 878 (±17) | +6 |
| CA | 469 (±4) | 796 (±7) | 527 (±5) | 558 (±4) | +19 |
| PA | 653 (±5) | 748 (±16) | 810 (±5) | 844 (±4) | +29.2 |
| PC | 799 (±4) | 870 (±5) | dissolved | 733 (±10) | –8.3 |
| PE | 947 (±3) | 814 (±5) | 821 (±2) | 859 (±9) | –9.3 |
| PET | 759 (±7) | 786 (±39) | 979 (±5) | 813 (±4) | +7.1 |
| PLA | 874 (±1) | 917 (±27) | dissolved | 943 (±5) | +7.9 |
| PMMA | 962 (±7) | 806 (±43) | 912 (±10) | 856 (±5) | –11 |
| PP | 881 (±2) | 986 (±2) | 916 (±6) | 849 (±4) | –3.6 |
| PS | 971 (±11) | 969 (±4) | 970 (±12) | 973 (±6) | +0.2 |
| PU | * | * | * | * | none |
| PVC h | 772 (±10) | 562 (±20) | 505 (±5) | 544 (±6) | –29.5 |
| PVC s | 613 (±47) | 599 (±12) | 527 (±35) | 501 (±24) | –18.3 |
| SAN | 832 (±9) | 830 (±6) | 805 (±5) | 821 (±16) | –1.3 |
*PU not in Database but all four show identical peak pattern (ppt slights). Total quality loss shows Raman hit-quality loss from virgin to post-treatment (Fenton).
The standard deviation (SD) of the triplicates is above 5 % for virgin PVC s (7.7%), SDS + KOH PVC s (6.6 %) and PMMA conserved (5.3 %) (Table 4). Significant differences between treatments do not necessarily indicate a loss of Raman hit quality, as in the case for PP virgin (881) and conserved (986) or PA (virgin: 653, conserved: 748, SDS + KOH: 810, Fenton: 844). It was observed that PVC h, PVC s and PMMA demonstrated an extremely significant loss of Raman hit quality, up to 29.5 % for PVC h (PVC s: 18.3 %, PMMA: 11 %), suggesting that these were the most vulnerable polymers tested in these settings regarding the Raman hit quality. PE shows a loss of Raman hit quality of 9.3 %, followed by PC with 8.3 % and PP with 3.6 %. The remaining polymers showed either extremely significant loss of Raman hit quality or no loss at all. Complete data of ANOVA analysis are shown in supporting information Table S1.
3.2Digestion, extraction and evaluation of digestion efficiency
Figure 3 shows samples after KOH treatment (pH 2) (A) and partially digested intestines of Flathead Chub after treated only with Fenton‘s reagent (B). In (C) residues of Striped Shiner are shown after the chemical digestion protocol. (D) shows chitin residue from residues of Hog Sucker intestines that were not decomposed by the chemical digestion protocol. The digestion efficacies of the images C and D are shown in Table 5.
Fig. 3
(A) Samples treated with KOH (pH 2). Intestines of Flathead Chub (B) after treatment with Fenton‘s reagents and of Striped Shiner (C) and Hog Sucker (D) after chemical digestion protocol. (D) shows undecomposed insect chitin parts.
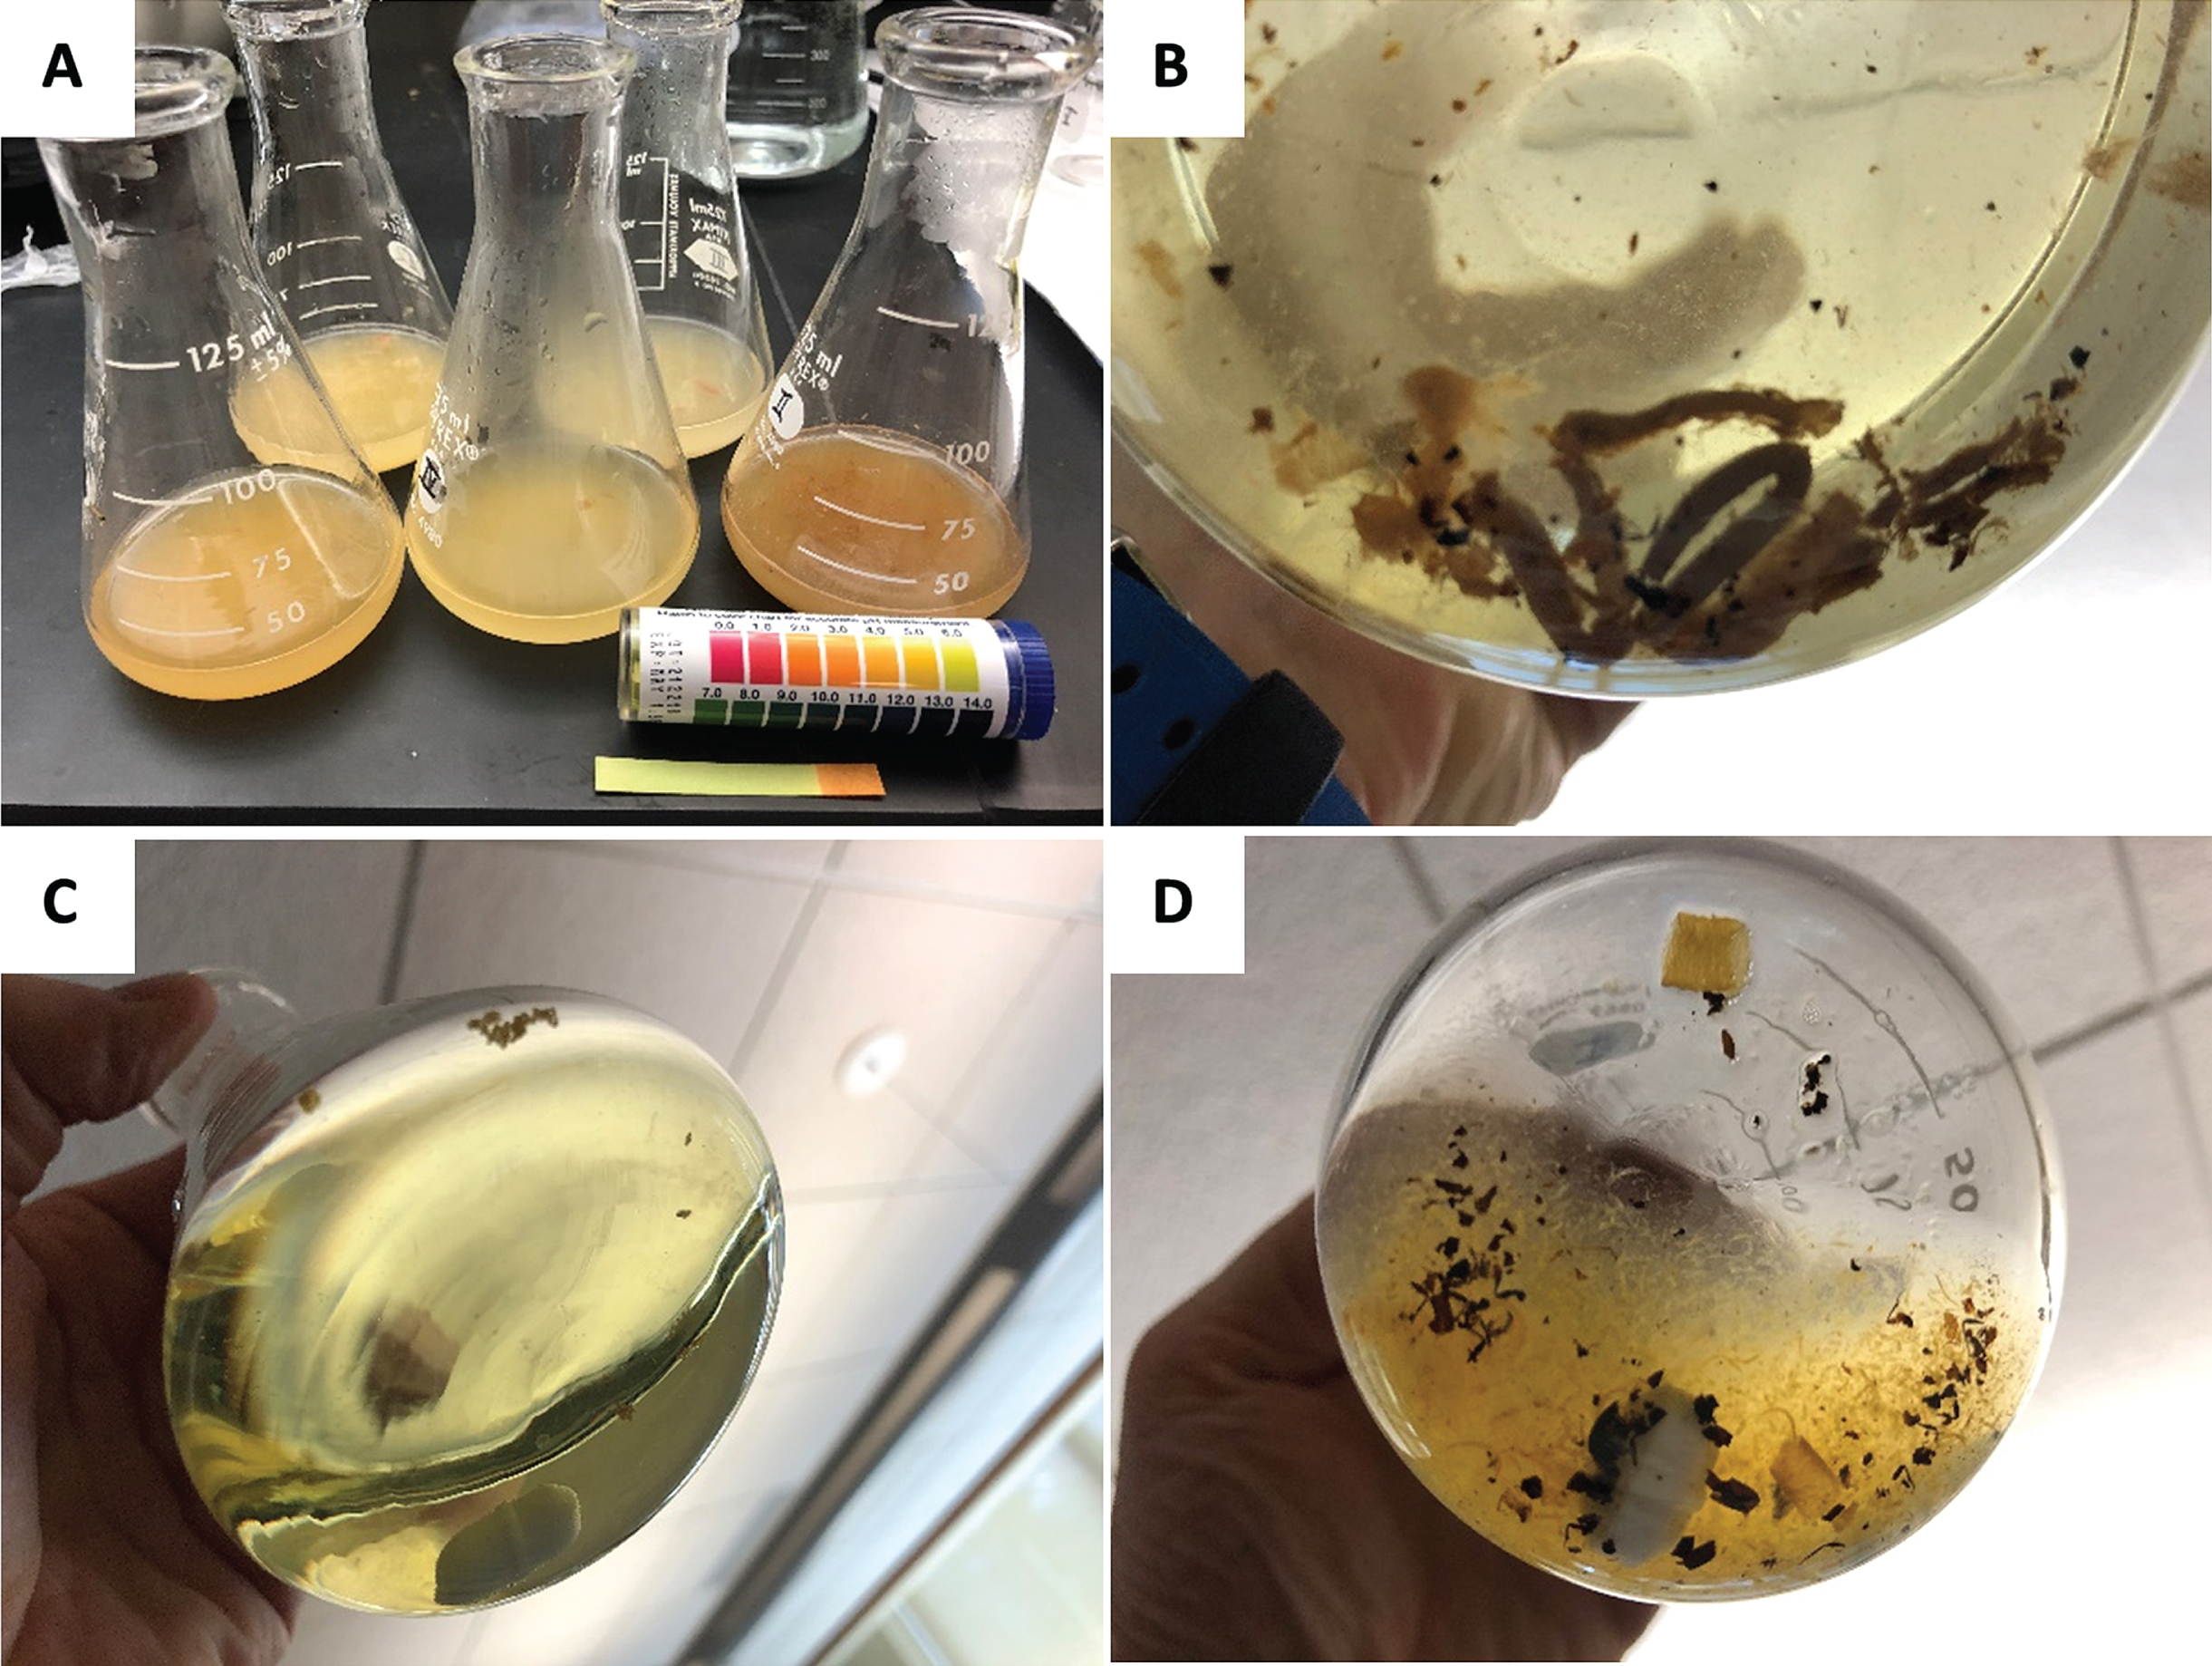
Table 5
Digestion efficacies with their means and standard deviations (SD,±) for fish guts in mg, calculated using formula 1 (2.6)
| Species | Gut weight [mg] | Efficacy (%) | Mean (±SD) |
| Flathead Chub (Platigobio Gracilis) | 571.8 | 99.63 | 98.26 (±0.84) |
| 1214.5 | 98.17 | ||
| 624.3 | 97.85 | ||
| 607.7 | 97.37 | ||
| 944 | 90.84* | ||
| Striped Shiner (Luxilus Chrysocephalus) | 250 | 96.48 | 97.64 (±1.12) |
| 1070.1 | 98.79 | ||
| Hog Sucker (Hypentelium nigricans) | 671.2 | 91** |
Flathead Chub and Striped shiner were preserved fish (caught in 2003), Hog Sucker was caught in 2020. SD was calculated for uncontaminated samples (*, **) * for samples with a high volume of undecomposed chitin, and ** for samples with a high volume of sand.
Table 5 shows the efficacies (%) of gut weight in mg of different preserved and non-preserved fresh fish samples after the chemical digestion protocol. In these cases, silicate-removing density separation and the chitinase enzyme were not employed. Cellulose nitrate filters were the most commonly used filters on the samples. Flathead Chub (Platigobio Gracilis) was caught in 2003 in Pecos River Mexico and conserved. Hog Sucker (Hypentelium nigricans) was caught in February 2020 in Tennessee River near Chattanooga. Means and standard deviations (SD) were calculated for different samples of the same fish, except outliers with a high amount of chitin (*). All samples except outliers show a low loss of efficacy below 3.52 %.
4Discussion
4.1Filter material analysis for MP detection
For contamination control no gloves were worn during measurement taking. This may have resulted in impurities from the skin of researchers contaminating the filters and thereby interacting with the Raman spectrometer. This could explain the differences in SD-values in Table 3.
The quality of the Raman analysis depends not only on the nature of the sample material but can also be influenced by the type of filter that is used. For example, the combination of the polycarbonate filter with the plastic PMMA lead the Raman to falsely identify the plastic as PET (Table 2). Additionally, cellulose nitrate filters burned during Raman measurement (supporting information Fig. S5) when dry, which is why only moist filters can be used. Oßmann et al. emphasize the importance of the filter material in Raman spectrometry. The filter should ideally be unstructured, provide a high contrast to the sample and not produce its own significant Raman spectrum [67]. An aluminium-covered PC membrane was further identified as the best filter material for Raman analysis even though Käppler et al. state a silicon filter is best suited to identify most polymer particles using Raman spectrometry [68].
A further consideration involves the variable cost of the different types of filters. Appropriately priced filters should be chosen based on the aims of the research and the level of measurement quality needed. For this study, for example, the relatively inexpensive cellulose nitrate filters showed the highest Raman hit quality (Table 3) and were thus quite suitable for analyses of MP.
4.2Influence of chemicals on MP particles
The material group of plastics is very versatile and characterized by different types of plastics with variable properties, including varying resistance (often specified in resistance lists) to known chemicals such as acids, oils, and solvents. When developing different methods of MP separation with different process steps and chemicals, the influences on the material and on the quality of the subsequent analyses must be checked as part of the quality assurance protocol. Within the scope of this work, the preservation or conservation steps and the subsequent physical chemical digestion of the samples were checked for the hit quality of the plastics. Single substances for the digestion step like KOH [38, 69] and Fenton [39] have already been tested by several studies for their influence on MP, but in this study a synergetic digestion process was developed which may have resulted in a combination of effects on the plastics. Therefore, the Raman hit quality of different polymer types was analyzed after different treatment steps (virgin, conserved, SDS + KOH and Fenton) (Table 4, Fig. 2 and Supporting information Fig. S6). The differences in Raman hit quality between treatments such as CA (Table 4 and Fig. 2) may be a result of contamination of samples with proteins or lipids from human skin since no gloves were used to reduce cross-contamination by latex. As PC and PLA particles dissolved after treatment with SDS + KOH, new particles were used, which is why the significance level between KOH and Fenton treatment are not comparable.
It should be noted that not every facility preserves fish samples in the same way as described in this paper. Additionally, the procedure described here may not be appropriate for all conserved fish samples and might affect MPs found in fish differently. Thus, the polymers found in preserved and non-preserved fish which were digested using the protocol of this paper were scrutinized closely. The influence of the chemicals used necessitate further investigation since the preserved samples were between 20–60 years old and the control polymer particles in our experiments shown in Table 4 could not be exposed to chemicals for that length of time. This presents the possibility that polymers already strongly influenced by the conservation medium (e.g. PVC h) might even dissolve if exposed for longer time periods. In this context further studies must be conducted to be fully able to compare preserved and non-preserved fish regarding their polymer contamination.
Furthermore, the processes taking place in the digestive tract can influence plastic and therefore the detection and identification of plastic particles. This consideration is beyond the scope of this study. This potential eventuality was considered by Krasucka et al. in their paper “Digestion of plastics using in vitro human gastrointestinal tract and their potential to adsorb emerging organic pollutants” [70].
Chamas et al. confirmed that plastics undergo different degradation rates in different types of environments, such as terrestrial or marine and used the specific surface degradation rate (SSDR) for temporal extrapolation [71]. In terms of our study, it is unknown how the specific surface degradation rate (SSDR) of plastics in the preservation fluids behaves over the years in museums, or how different environmental influences such as temperature variations or sunlight and room light (UV radiation) affect the samples.
On the other hand, it may be possible that due to tissue and biomolecule corona formation [72–74] around the plastic particles, long-term stability and thus a direct influence on SSDR in the preservation samples is achieved. A biomolecule corona on MP particles may influence the digestion efficacy of chemicals and the analysis using Raman spectrometry. The influence of such coronas on spectrometry methods needs to be further analyzed. Subsequently, the question remains open as to how the identification quality of the plastics from the samples behaves after long periods of time or under variable environmental influences, as investigated by Fernández-González et al. [49].
In contrast to the methodology in the work of L. Hou et al. [42] we employed a digestion protocol of SDS + KOH followed by Fenton‘s reaction. We also conducted an analysis of different filter materials, leading to the best suited material for this study. In contrast to Hou et al.’s work, our study found that grided filters were unsuited for Raman spectrometry analysis. Furthermore, the Raman hit quality of different polymers after digestion was not reviewed as H2O2 was found to show no effect on most polymers [75, 76].
4.3Efficacy of the digestion protocol
A method is assumed suitable with an efficiency of ≥95% [69] which is neither achieved with only Fenton‘s nor with only KOH treatment (Fig. 3B, A). Only the combination of both methods in this digestion protocol accomplishes the goal to efficiently digest organic matter (Fig. 3C). The high amount of sand in the Hog Sucker (Table 5) results from their bottom feeding strategy. The sand cannot be decomposed using our chemical digestion protocol which is why a density separation had to be conducted for those samples. Platigobio Gracilis, (Flathead Chub), feeds predominantly on insects and thus shows a high amount of undecomposed chitin (Table 5) leading to a loss of digestion efficacy [78]. Figure S4 in the supporting information shows the sand residues on cellulose nitrate filter (A) and chitin residues of Flathead Chub on steel filter (B).
For these residues an additional treatment step with chitinase (Fig. 1) could be added. These results demonstrate that this digestion protocol is better suited to completely digesting organic matter than Fenton‘s reagent alone. Since chitin is not present in human tissue, this protocol is suitable for use in investigating human tissue and the additional step of using chitinase can be omitted. The effect of chitinase on different polymers on its own or as an additional step following the digestion protocol was not investigated here. In the publication by Kallenbach et al. it was shown that a protocol of KOH and chitinase had an effect on different polymers like PET, which showed no negative effect to KOH in this study (supporting information Table S4) [77].
Chitin or mineral particles can interfere with the MP particle identification using Raman spectroscopy, and this interference is dependent on the amount of contaminant. Therefore, further purification steps may be needed to achieve a higher efficacy in case of sand or chitin residues, in this case a density separation and the enzyme chitinase could be added. In this study the solid residue amounts were negligible and therefore did not interfere with MP detection via Raman spectroscopy. Instead of using the protocol of Kallenbach et al. (Protocol 1, KOH and Chitinase) which is known to have an influence on several polymer species (protocol in Fig. 1) the gut samples could be soaked in chitinase solution before usage of SDS and KOH [77] to further optimize digestion.
During this protocol, only intestines of fish were used and therefore experimentally only the influence of preservation and effectiveness of the chemicals used during the digestion protocol on this kind of tissue (intestines) and cell compounds was investigated. With which limitations this protocol may be applied on other tissues remains to be investigated.
Furthermore, whether our results from fish intestines can be applied to mammals and their intestines needs to be investigated. Different parts of organs from different mammals could be preserved and statistically compared for the effectiveness of degradation using known methods which could be useful for further MP analysis of different species.
Author contributions
The manuscript was written through contributions of all authors. All authors have given approval to the final version of the manuscript.
Funding
The authors report no funding.
Supplementary material
[1] The supplementary material is available in the electronic version of this article: http://dx.doi.org/10.3233/JCB-220076.
References
[1] | Cole M , Lindeque P , Halsband C , Galloway TS Microplastics as contaminants in the marine environment: A review. Marine Pollution Bulletin. (2011) ;62: :2588–97. https://doi.org/10.1016/j.marpolbul.2011.09.025. |
[2] | Karbalaei S , Hanachi P , Walker TR , Cole M Occurrence, sources, human health impacts and mitigation of microplastic pollution. Environ Sci Pollut Res Int. (2018) ;25: :36046–63. https://doi.org/10.1007/S11356-018-3508-7. |
[3] | Cole M , Lindeque P , Fileman E , Halsband C , Goodhead R , Moger J , et al Microplastic ingestion by zooplankton. Environmental Science & Technology. (2013) ;47: :6646–55. https://doi.org/10.1021/es400663f. |
[4] | Lusher AL , McHugh M , Thompson RC Occurrence of microplastics in the gastrointestinal tract of pelagic and demersal fish from the English Channel. Marine Pollution Bulletin.. (2013) ;67: :94–9. https://doi.org/10.1016/j.marpolbul.2012.11.028. |
[5] | Codina-García M , Militão T , Moreno J , González-Solís J Plastic debris in Mediterranean seabirds. Marine Pollution Bulletin. (2013) ;77: :220–6. https://doi.org/10.1016/j.marpolbul.2013.10.002. |
[6] | Devriese LI , van der Meulen MD , Maes T , Bekaert K , Paul-Pont I , Frère L ,et al Microplastic contamination in brown shrimp (Crangon crangon, Linnaeus from coastal waters of the Southern North Sea and Channel area. Marine Pollution Bulletin. (2015) ;98: :179–87. https://doi.org/10.1016/j.marpolbul.2015.06.051. |
[7] | Graham ER , Thompson JT Deposit- and suspension-feeding sea cucumbers (Echinodermata) ingest plastic fragments. Journal of Experimental Marine Biology and Ecology. (2009) ;368: :22–9. https://doi.org/10.1016/j.jembe.2008.09.007. |
[8] | Green DS Effects of microplastics on European flat oysters, Ostrea edulis and their associated benthic communities. Environmental Pollution. (2016) ;216: :95–103. https://doi.org/10.1016/j.envpol.2016.05.043. |
[9] | Winkler AS , Cherubini A , Rusconi F , Santo N , Madaschi L , Pistoni C , et al Human airway organoids and microplastic fibers: A new exposure model for emerging contaminants. Environment International. (2022) ;163: :107200. https://doi.org/10.1016/j.envint.2022.107200. |
[10] | Fan Z , Xiao T , Luo H , Chen D , Lu K , Shi W , et al A study on the roles of long non-coding RNA and circular RNA in the pulmonary injuries induced by polystyrene microplastics. Environment International. 2022;163. https://doi.org/10.1016/j.envint.2022.107223. |
[11] | Horton AA , Walton A , Spurgeon DJ , Lahive E , Svendsen C Microplastics in freshwater and terrestrial environments: Evaluating the current understanding to identify the knowledge gaps and future research priorities. Science of The Total Environment. (2017) ;586: :127–41. https://doi.org/10.1016/j.scitotenv.2017.01.190. |
[12] | Murphy F , Ewins C , Carbonnier F , Quinn B Wastewater treatment works (WwTW) as a source of microplastics in the aquatic environment. Environmental Science & Technology. (2016) ;50: :5800–8. https://doi.org/10.1021/acs.est.5b05416. |
[13] | Ziajahromi S , Neale PA , Leusch FDL Wastewater treatment plant effluent as a source of microplastics: Review of the fate, chemical interactions and potential risks to aquatic organisms. Water Science and Technology. (2016) ;74: :2253–69. https://doi.org/10.2166/wst.2016.414. |
[14] | Eriksen M , Mason S , Wilson S , Box C , Zellers A , Edwards W , et al Microplastic pollution in the surface waters of the Laurentian Great Lakes. Marine Pollution Bulletin. (2013) ;77: :177–82. https://doi.org/10.1016/j.marpolbul.2013.10.007. |
[15] | Kanhai LDK , Officer R , Lyashevska O , Thompson RC , O’Connor I Microplastic abundance, distribution and composition along a latitudinal gradient in the Atlantic Ocean. Marine Pollution Bulletin. (2017) ;115: :307–14. https://doi.org/10.1016/j.marpolbul.2016.12.025. |
[16] | Karlsson TM , Vethaak AD , Almroth BC , Ariese F , van Velzen M , Hassellöv M , et al Screening for microplastics in sediment, water, marine invertebrates and fish: Method development and microplastic accumulation. Marine Pollution Bulletin. (2017) ;122: :403–8. https://doi.org/10.1016/j.marpolbul.2017.06.081. |
[17] | Van Cauwenberghe L , Vanreusel A , Mees J , Janssen CR Microplastic pollution in deep-sea sediments. Environmental Pollution. (2013) ;182: :495–9. https://doi.org/10.1016/j.envpol.2013.08.013. |
[18] | Waller CL , Griffiths HJ , Waluda CM , Thorpe SE , Loaiza I , Moreno B , et al Microplastics in the Antarctic marine system: An emerging area of research. Science of The Total Environment. (2017) ;598: :220–7. https://doi.org/10.1016/j.scitotenv.2017.03.283. |
[19] | Lusher AL , Tirelli V , O’Connor I , Officer R Microplastics in Arctic polar waters: The first reported values of particles in surface and sub-surface samples. Scientific Reports. (2015) ;5: :14947. https://doi.org/10.1038/srep14947. |
[20] | Piehl S , Leibner A , Löder MGJ , Dris R , Bogner C , Laforsch C Identification and quantification of macro- and microplastics on an agricultural farmland. Scientific Reports. (2018) ;8: :1–9. https://doi.org/10.1038/s41598-018-36172-y. |
[21] | Kwon W , Kim D , Kim HY , Jeong SW , Lee SG , Kim HC , et al Microglial phagocytosis of polystyrene microplastics results in immune alteration and apoptosis in vitro and in vivo. Sci Total Environ 2022:807. https://doi.org/10.1016/J.SCITOTENV.2021.150817. |
[22] | Fan Z , Xiao T , Luo H , Chen D , Lu K , Shi W , et al A study on the roles of long non-coding RNA and circular RNA in the pulmonary injuries induced by polystyrene microplastics. Environment International. 2022:163. https://doi.org/10.1016/j.envint.2022.107223. |
[23] | Schwabl P , Köppel S , Königshofer P , Bucsics T , Trauner M , Reiberger T , et al Detection of various microplastics in human stool. Annals of Internal Medicine. (2019) ;171: :453. https://doi.org/10.7326/M19-0618. |
[24] | Jenner LC , Rotchell JM , Bennett RT , Cowen M , Tentzeris V , Sadofsky LR Detection of microplastics in human lung tissue using μFTIR spectroscopy. Science of The Total Environment. (2022) ;831: :154907 https://doi.org/10.1016/j.scitotenv.2022.154907. |
[25] | Leslie HA , van Velzen JMM , Brandsma SH , Vethaak D , Garcia-Vallejo JJ , Lamoree MH Discovery and quantification of plastic particle pollution in human blood. Environment International. 2022:107199. https://doi.org/10.1016/j.envint.2022.107199. |
[26] | Ragusa A , Svelato A , Santacroce C , Catalano P , Notarstefano V , Carnevali O , et al Plasticenta: First evidence of microplastics in human placenta. Environment International.74. (2021) ;146: :106274. https://doi.org/10.1016/j.envint.2020.106274. |
[27] | Savoca MS , McInturf AG , Hazen EL Plastic ingestion by marine fish is widespread and increasing. Glob Chang Biol. (2021) ;27: :2188–99. https://doi.org/10.1111/GCB.15533. |
[28] | Barboza LGA , Vethaak AD , Lavorante BRBO , Lundebye AK , Guilhermino L Marine microplastic debris: An emerging issue for food security, food safety and human health. Mar Pollut Bull. (2018) ;133: :336–48. https://doi.org/10.1016/J.MARPOLBUL.2018.05.047. |
[29] | Smith M , Love DC , Rochman CM , Neff RA Microplastics in Seafood and the Implications for Human Health. Curr Environ Health Rep. (2018) ;5: :375–86. https://doi.org/10.1007/S40572-018-0206-Z. |
[30] | Hantoro I , Löhr AJ , Van Belleghem FGAJ , Widianarko B , Ragas AMJ Microplastics in coastal areas and seafood: Implications for food safety. Food Addit Contam Part A Chem Anal Control Expo Risk Assess. (2019) ;36: :674–711. https://doi.org/10.1080/19440049.2019.1585581. |
[31] | Ringwood AH Bivalves as biological sieves: Bioreactivity pathways of microplastics and nanoplastics. Biol Bull. (2021) ;241: :185–95. https://doi.org/10.1086/716259. |
[32] | Li WC , Tse HF , Fok L Plastic waste in the marine environment: A review of sources, occurrence and effects. Sci Total Environ. (2016) ;566–567: :333–49. https://doi.org/10.1016/J.SCITOTENV.2016.05.084. |
[33] | Pinheiro C , Oliveira U , Vieira NR Occurrence and impacts of microplastics in freshwater fish. Journal of Aquaculture & Marine Biology. 2017;5. https://doi.org/10.15406/jamb.2017.05.00138. |
[34] | McNeish RE , Kim LH , Barrett HA , Mason SA , Kelly JJ , Hoellein TJ Microplastic in riverine fish is connected to species traits. Scientific Reports. 2018;8. https://doi.org/10.1038/s41598-018-29980-9. |
[35] | Collard F , Gasperi J , Gabrielsen GW , Tassin B Plastic particle ingestion by wild freshwater fish: A critical review. Environmental Science and Technology. 2019. https://doi.org/10.1021/acs.est.9b03083. |
[36] | Li C , Busquets R , Campos LC Assessment of microplastics in freshwater systems: A review. Science of The Total Environment. (2020) ;707: :135578. https://doi.org/10.1016/j.scitotenv.2019.135578. |
[37] | Monteleone A , Schary W , Fath A , Wenzel F Validation of an extraction method for microplastics from human materials. Clinical Hemorheology and Microcirculation. 2019:1–15. https://doi.org/10.3233/ch-199209. |
[38] | Thiele CJ , Hudson MD , Russell AE Evaluation of existing methods to extract microplastics from bivalve tissue: Adapted KOH digestion protocol improves filtration at single-digit pore size. Marine Pollution Bulletin. (2019) ;142: :384–93. https://doi.org/10.1016/j.marpolbul.2019.03.003. |
[39] | Hurley RR , Lusher AL , Olsen M , Nizzetto L Validation of a method for extracting microplastics from complex, organic-rich, environmental matrices. Environmental Science and Technology. (2018) ;52: :7409–17. https://doi.org/10.1021/acs.est.8b01517. |
[40] | Masura J , Baker J , Foster G , Arthur C Laboratory Methods for the Analysis of Microplastics in the Marine Environment: For quantifying synthetic particles in waters and sediments. 2015. |
[41] | Masura J , Baker J , Foster G , Arthur C Laboratory Methods for the Analysis of Microplastics in the Marine Environment: For quantifying synthetic particles in waters and sediments. 2015. |
[42] | Hou L , McMahan CD , McNeish RE , Munno K , Rochman CM , Hoellein TJ A fish tale: A century of museum specimens reveal increasing microplastic concentrations in freshwater fish. Ecological Applications. (2021) ;31: :1–14. https://doi.org/10.1002/ea2320. |
[43] | Jenner LC , Rotchell JM , Bennett RT , Cowen M , Tentzeris V , Sadofsky LR Detection of microplastics in human lung tissue using μ FTIR spectroscopy. Science of The Total Environment. (2022) ;831: :154907. https://doi.org/10.1016/j.scitotenv.2022.154907. |
[44] | Leslie HA , van Velzen JMM , Brandsma SH , Vethaak D , Garcia-Vallejo JJ , Lamoree MH Discovery and quantification of plastic particle pollution in human blood. Environment International. 2022;107199. https://doi.org/10.1016/j.envint.2022.107199. |
[45] | Dümichen E , Eisentraut P , Bannick CG , Barthel A-K , Senz R , Braun U Fast identification of microplastics in complex environmental samples by a thermal degradation method. Chemosphere. (2017) ;174: :572–84. https://doi.org/10.1016/j.chemosphere.2017.02.010. |
[46] | Dümichen E , Barthel A-K , Braun U , Bannick CG , Brand K , Jekel M , et al Analysis of polyethylene microplastics in environmental samples, using a thermal decomposition method. Water Research. (2015) ;85: :451–7. https://doi.org/10.1016/j.watres.2015.09.002. |
[47] | Shim WJ , Hong SH , Eo SE Identification methods in microplastic analysis: A review. Analytical Methods. (2017) ;9: :1384–91. https://doi.org/10.1039/C6AY02558G. |
[48] | Huppertsberg S , Knepper TP Instrumental analysis of microplastics— benefits and challenges. Analytical and Bioanalytical Chemistry. (2018) ;410: :6343–52. https://doi.org/10.1007/s00216-018-1210-8. |
[49] | Fernández-González V , Andrade-Garda JM , López-Mahía P , Muniategui-Lorenzo S Impact of weathering on the chemical identification of microplastics from usual packaging polymers in the marine environment. Analytica Chimica Acta. (2011) ;1142: :179–88. https://doi.org/10.1016/j.aca.2020.11.002. |
[50] | Shim WJ , Hong SH , Eo SE Identification methods in microplastic analysis: A review. Analytical Methods. (2017) ;9: :1384–91. https://doi.org/10.1039/C6AY02558G. |
[51] | Huppertsberg S , Knepper TP Instrumental analysis of microplastics— benefits and challenges. Analytical and Bioanalytical Chemistry. (2018) ;410: :6343–52. https://doi.org/10.1007/s00216-018-1210-8. |
[52] | Sancataldo G , Avellone G , Vetri V Nile Red lifetime reveals microplastic identity. Environmental Science: Processes & Impacts. (2020) ;22: :2266–75. https://doi.org/10.1039/D0EM00348D. |
[53] | Monteleone A , Wenzel F , Langhals H , Dietrich D New application for the identification and differentiation of microplastics based on fluorescence lifetime imaging microscopy (FLIM). Journal of Environmental Chemical Engineering. (2021) ;9: :104769. https://doi.org/10.1016/j.jece.2020.104769. |
[54] | Monteleone A , Schary W , Wenzel F , Langhals H , Dietrich D Label-free identification and differentiation of different microplastics using phasor analysis of fluorescence lifetime imaging microscopy (FLIM)-generated data. Chemico-Biological Interactions. 2021:109466. https://doi.org/10.1016/j.cbi.2021.109466. |
[55] | Gill TA , Keith RA , Lall BS Textural deterioration of Red Hake and Haddock muscle in frozen storage related as related to chemical parameters and changes in the myofibrillar proteins. Journal of Food Science. (1979) ;44: :661–7. https://doi.org/10.1111/j.1365-2621.1979.tb08470.x. |
[56] | Crawford DL , Law DK , BabbitT JK , McGill LA Comparative stabilityand desirability of frozen Pacific Hake fillet and minced flesh blocks. Journal of Food Science. (1979) ;44: :363–7. https://doi.org/10.1111/j.1365-2621.1979.tb03790.x. |
[57] | Hoffman EA , Frey BL , Smith LM , Auble DT Formaldehyde crosslinking: A tool for the study of chromatin complexes. Journal of Biological Chemistry. (2015) ;290: :26404–11. https://doi.org/10.1074/jbc.R115.651679. |
[58] | Hayat MA Principles and techniques of electron microscopy: Biological applications. 1989. |
[59] | Gavrilov A , Razin SV , Cavalli G In vivo formaldehyde cross-linking: It is time for black box analysis. Briefings in Functional Genomics. (2015) ;14: :163–5. https://doi.org/10.1093/bfgp/elu037. |
[60] | Fraenkel-Conrat H , Cooper M , Olcott HS The reaction of formaldehyde with proteins. J Am Chem Soc. (1945) ;67: :950–4. https://doi.org/10.1021/ja01222a023. |
[61] | Fraenkel-Conrat H , Olcott HS The reaction of formaldehyde with proteins. V. cross-linking between amino and primary amide or guanidyl groups. J Am Chem Soc. (1948) ;70: :2673–84. https://doi.org/10.1021/ja01188a018. |
[62] | Fraenkel-Conrat H , Olcott HS Reaction of formaldehyde with proteins; cross-linking of amino groups with phenol, imidazole, or indole groups. J Biol Chem. (1948) ;174: :827–43. https://doi.org/10.1016/S0021-9258(18)57292-6. |
[63] | French D , Edsall JT The reactions of formaldehyde with amino acids and proteins. Advances in Protein Chemistry. (1945) ;2: :277–335. https://doi.org/10.1016/S0065-3233(08)60627-0. |
[64] | Hou L , McMahan CD , McNeish RE , Munno K , Rochman CM , Hoellein TJ A fish tale: A century of museum specimens reveal increasing microplastic concentrations in freshwater fish. Ecological Applications. (2021) ;31: :1–14. https://doi.org/10.1002/ea2320. |
[65] | Ricciardi M , Pironti C , Motta O , Miele Y , Proto A , Montano L Microplastics in the aquatic environment: Occurrence, persistence, analysis, and human exposure. Water (Basel). (2021) ;13: :973. https://doi.org/10.3390/w13070973. |
[66] | Fernández-González V , Andrade-Garda JM , López-Mahía P , Muniategui-Lorenzo S Impact of weathering on the chemical identification of microplastics from usual packaging polymers in the marine environment. Analytica Chimica Acta. (2021) ;1142: :179–88. https://doi.org/10.1016/j.aca.2020.11.002. |
[67] | Oßmann BE , Sarau G , Schmitt SW , Holtmannspötter H , Christiansen SH , Dicke W Development of an optimal filter substrate for the identification of small microplastic particles in food by micro-Raman spectroscopy. Analytical and Bioanalytical Chemistry. (2017) ;409: :4099–109. https://doi.org/10.1007/s00216-017-0358-y. |
[68] | Käppler A , Windrich F , Löder MGJ , Malanin M , Fischer D , Labrenz M , et al Identification of microplastics by FTIR and Raman microscopy: A novel silicon filter substrate opens the important spectral range below cm–1 for FTIR transmission measurements. Analytical and Bioanalytical Chemistry. (2015) ;407: :6791–801. https://doi.org/10.1007/s00216-015-8850-8. |
[69] | Karami A , Golieskardi A , Choo CK , Romano N , Ho Bin Y , Salamatinia B A high-performance protocol for extraction of microplastics in fish. Science of the Total Environment. (2017) ;578: :485–94. https://doi.org/10.1016/j.scitotenv.2016.10.213. |
[70] | Krasucka P , Bogusz A , Baranowska-Wójcik E , Czech B , Szwajgier D , Rek M , et al Digestion of plastics using in vitro human gastrointestinal tract and their potential to adsorb emerging organic pollutants. Science of The Total Environment. (2022) ;843: :157108. https://doi.org/10.1016/j.scitotenv.2022.157108. |
[71] | Chamas A , Moon H , Zheng J , Qiu Y , Tabassum T , Jang JH , et al Degradation rates of plastics in the environment. ACS Sustainable Chemistry and Engineering. (2020) ;8: :3494–511. https://doi.org/10.1021/acssuschemeng.9b06635. |
[72] | Junaid M , Wang J Interaction of nanoplastics with extracellular polymeric substances (EPS) in the aquatic environment: A special reference to eco-corona formation and associated impacts. Water Research. 2021;201. https://doi.org/10.1016/j.watres.2021.117319. |
[73] | Liu S , Junaid M , Liao H , Liu X , Wu Y , Wang J Eco-corona formation and associated ecotoxicological impacts of nanoplastics in the environment. Science of the Total Environment. 2022;836. https://doi.org/10.1016/j.scitotenv.2022.155703. |
[74] | Witzmann T , Ramsperger AFRM , Wieland S , Laforsch C , Kress H , Fery A , et al Repulsive interactions of eco-corona-covered microplastic particles quantitatively follow modeling of polymer brushes. Langmuir. 2022. https://doi.org/10.1021/acs.langmuir.1c03204. |
[75] | Lusher AL , Welden NA , Sobral P , Cole M Sampling, isolating and identifying microplastics ingested by fish and invertebrates. Analytical Methods. (2017) ;9: :1346–60. https://doi.org/10.1039/c6ay02415g. |
[76] | Munno K , Helm PA , Jackson DA , Rochman C , Sims A Impacts of temperature and selected chemical digestion methods on microplastic particles. Environmental Toxicology and Chemistry. (2018) ;37: :91–8. https://doi.org/10.1002/etc.3935. |
[77] | Kallenbach EMF , Hurley RR , Lusher A , Friberg N Chitinase digestion for the analysis of microplastics in chitinaceous organisms using the terrestrial isopod Oniscus asellus L. as a model organism. Science of the Total Environment. 2021;786. https://doi.org/10.1016/j.scitotenv.2021.147455. |
[78] | Rahel FJ , Thel LA Flathead chub (Platygobio gracilis): A technical conservation assessment. American Fisheries Society. 2004;54. |

