
Effect of the preventative allopurinol therapy within the framework of the peripheral blood stem cell donation
Abstract
Nowadays the importance of the peripheral blood stem cell (PBSC) donation is continuously increasing. It is therefore crucial to determine all side effects for donors. This clinical trial deals with the preventative therapy using Allopurinol (300 mg/d) in order to prohibit the increase in serum uric acid as a result of rhG-CSF injections (10 μg/kg Lenograstim over 5d). It comprises 72 donors (m/f: 57/15) passing through 3 examinations. The initial measurement of uric acid serves as clue to categorize the donors into groups. Donors with high uric acid are summarized as group 1 (30: m/f: 27/3), which obtained Allopurinol, whereas donors with normal uric acid are part of group 4 (42: m/f: 30/12). This group is additionally divided into groups 2 and 3 (dependent on the way of G-CSF administration). The mean serum uric acid of group 1 decreased from 7.01 to 5.03 mg/dl. In contrast, the value of group 4 increased from 5.16 to 6.15 mg/dl.
1Introduction
The amount of executed stem cell transplantations is steadily increasing – approximately 3,000 allogeneic transplantations are annually performed in Germany (status 2014) [1, 2]. The PBSC donation has virtually replaced bone marrow harvest [3, 4]. This method is based on the G-CSF mediated release of CD34+ progenitor cells into peripheral blood by triggering the proliferation and differentiation of the granulocyte line. Its administration happens through subcutaneous injections over a period of 4–6 days with the standard dosage of 10 μg per kg donor body weight. 5×10⁶ CD34+ cells per kg donor body weight are necessary to perform a successful transplantation, which is commonly reached within 1–2 apheresis on day 5 [3, 5, 6].
The willingness to donate stem cells is collateral increasing to the rising importance of stem cell transplantations. The worldwide number of new registrations proves this fact. The amount of registrations has nearly doubled between 2011 (293,541) and 2012 (526,512) [7].
Consequently, it is of major importance to enable the elucidation of all potential side effects. They are in most cases acceptable and of a transient period; severe events are unusual. Their thorough examination is required to prevent the development of unpredictable consequences [3, 4].
One potential side effect is the increase of uric acid, whose saturation value amounts to 6.5 mg/dl (37°C, blood pH 7.4). Concentrations above this value lead to sedimentations in form of uric acid crystals. Sedimentary depositions in joints can finally trigger a gout disease [8].
A means of preventing the increase of uric acid is the use of Allopurinol, an analog of the purine base hypoxanthine. It inhibits the enzyme xanthine oxidase, which regularly oxidizes hypoxanthine to uric acid. The average dosage of this uricostatic is 100–300 mg/d [9].
2Design and methods
2.1Study design
The study included 72 allogeneic peripheral blood stem cell donors (m/f: 57/15), who are divided into four different groups. Group 1 compromises 30 (m/f: 27/3) peripheral stem cell donors with uric acid serum concentrations in the upper sector with a range from 5.7 to 8.3 mg/dl in males and from 5.8 to 8.9 mg/dl in females (mean uric acid: 7.01 mg/dl). They therefore obtained a preventative Allopurinol therapy (300 mg/d). Groups 2 and 3 consist of peripheral blood stem cell donors with uric acid serum concentrations within the normal range - they only differ in the kind of G-CSF administration. Group 2 (mean uric acid: 4.79 mg/dl) with 15 members (m/f: 9/6) got G-CSF injected by a mobile nursing service. Group 3 (mean uric acid: 5.37 mg/dl) with 27 members (m/f: 21/6) received the drug by self-administration. In order to have a comparison cohort to group 1, the groups 2 and 3 are additionally summarized as group 4 with 42 members (m/f: 30/12). This group represents all donors with normal initial uric acid concentrations.
The determination of the blood values followed at three dates: the pre-examination (PE) (4 weeks before apheresis; the division of the donors is based on these results), the second examination (SE) (directly before the PBSC donation, after the subcutaneous injection of G-CSF over a period of five days (10 μg/kg donor weight)) and follow-up examination (FE) (4 weeks after the PBSC donation).
2.2Donor characteristics
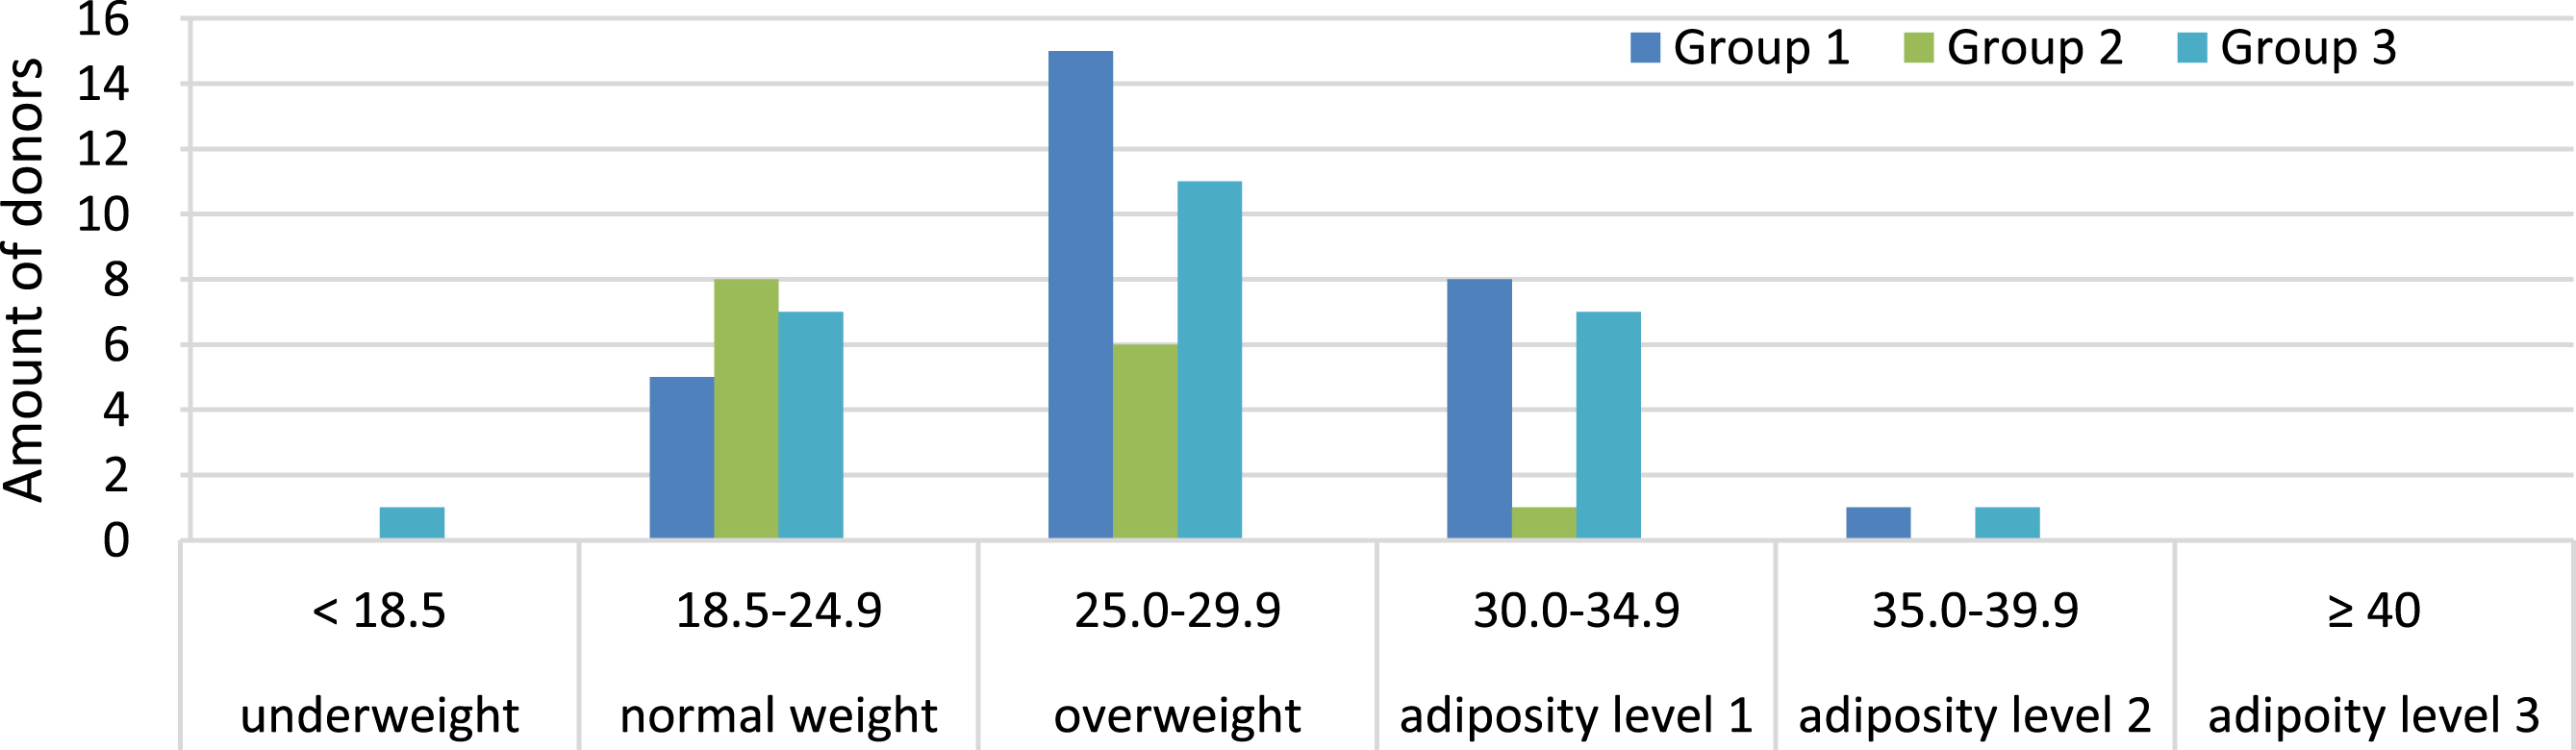
The mean age of all donors is 41.97 years (group 1/group 2/group 3:42.27/43.58/ 40.93). The average BMI amounts to 26.85 kg/m2 (group 1/ group 2/ group 3:28.18/ 24.62/26.27). The distribution of the BMI is illustrated in Fig. 1.
Fig.1
Classification of all donors in BMI categories.
Further basic laboratory parameters correspond to the particular normal ranges.
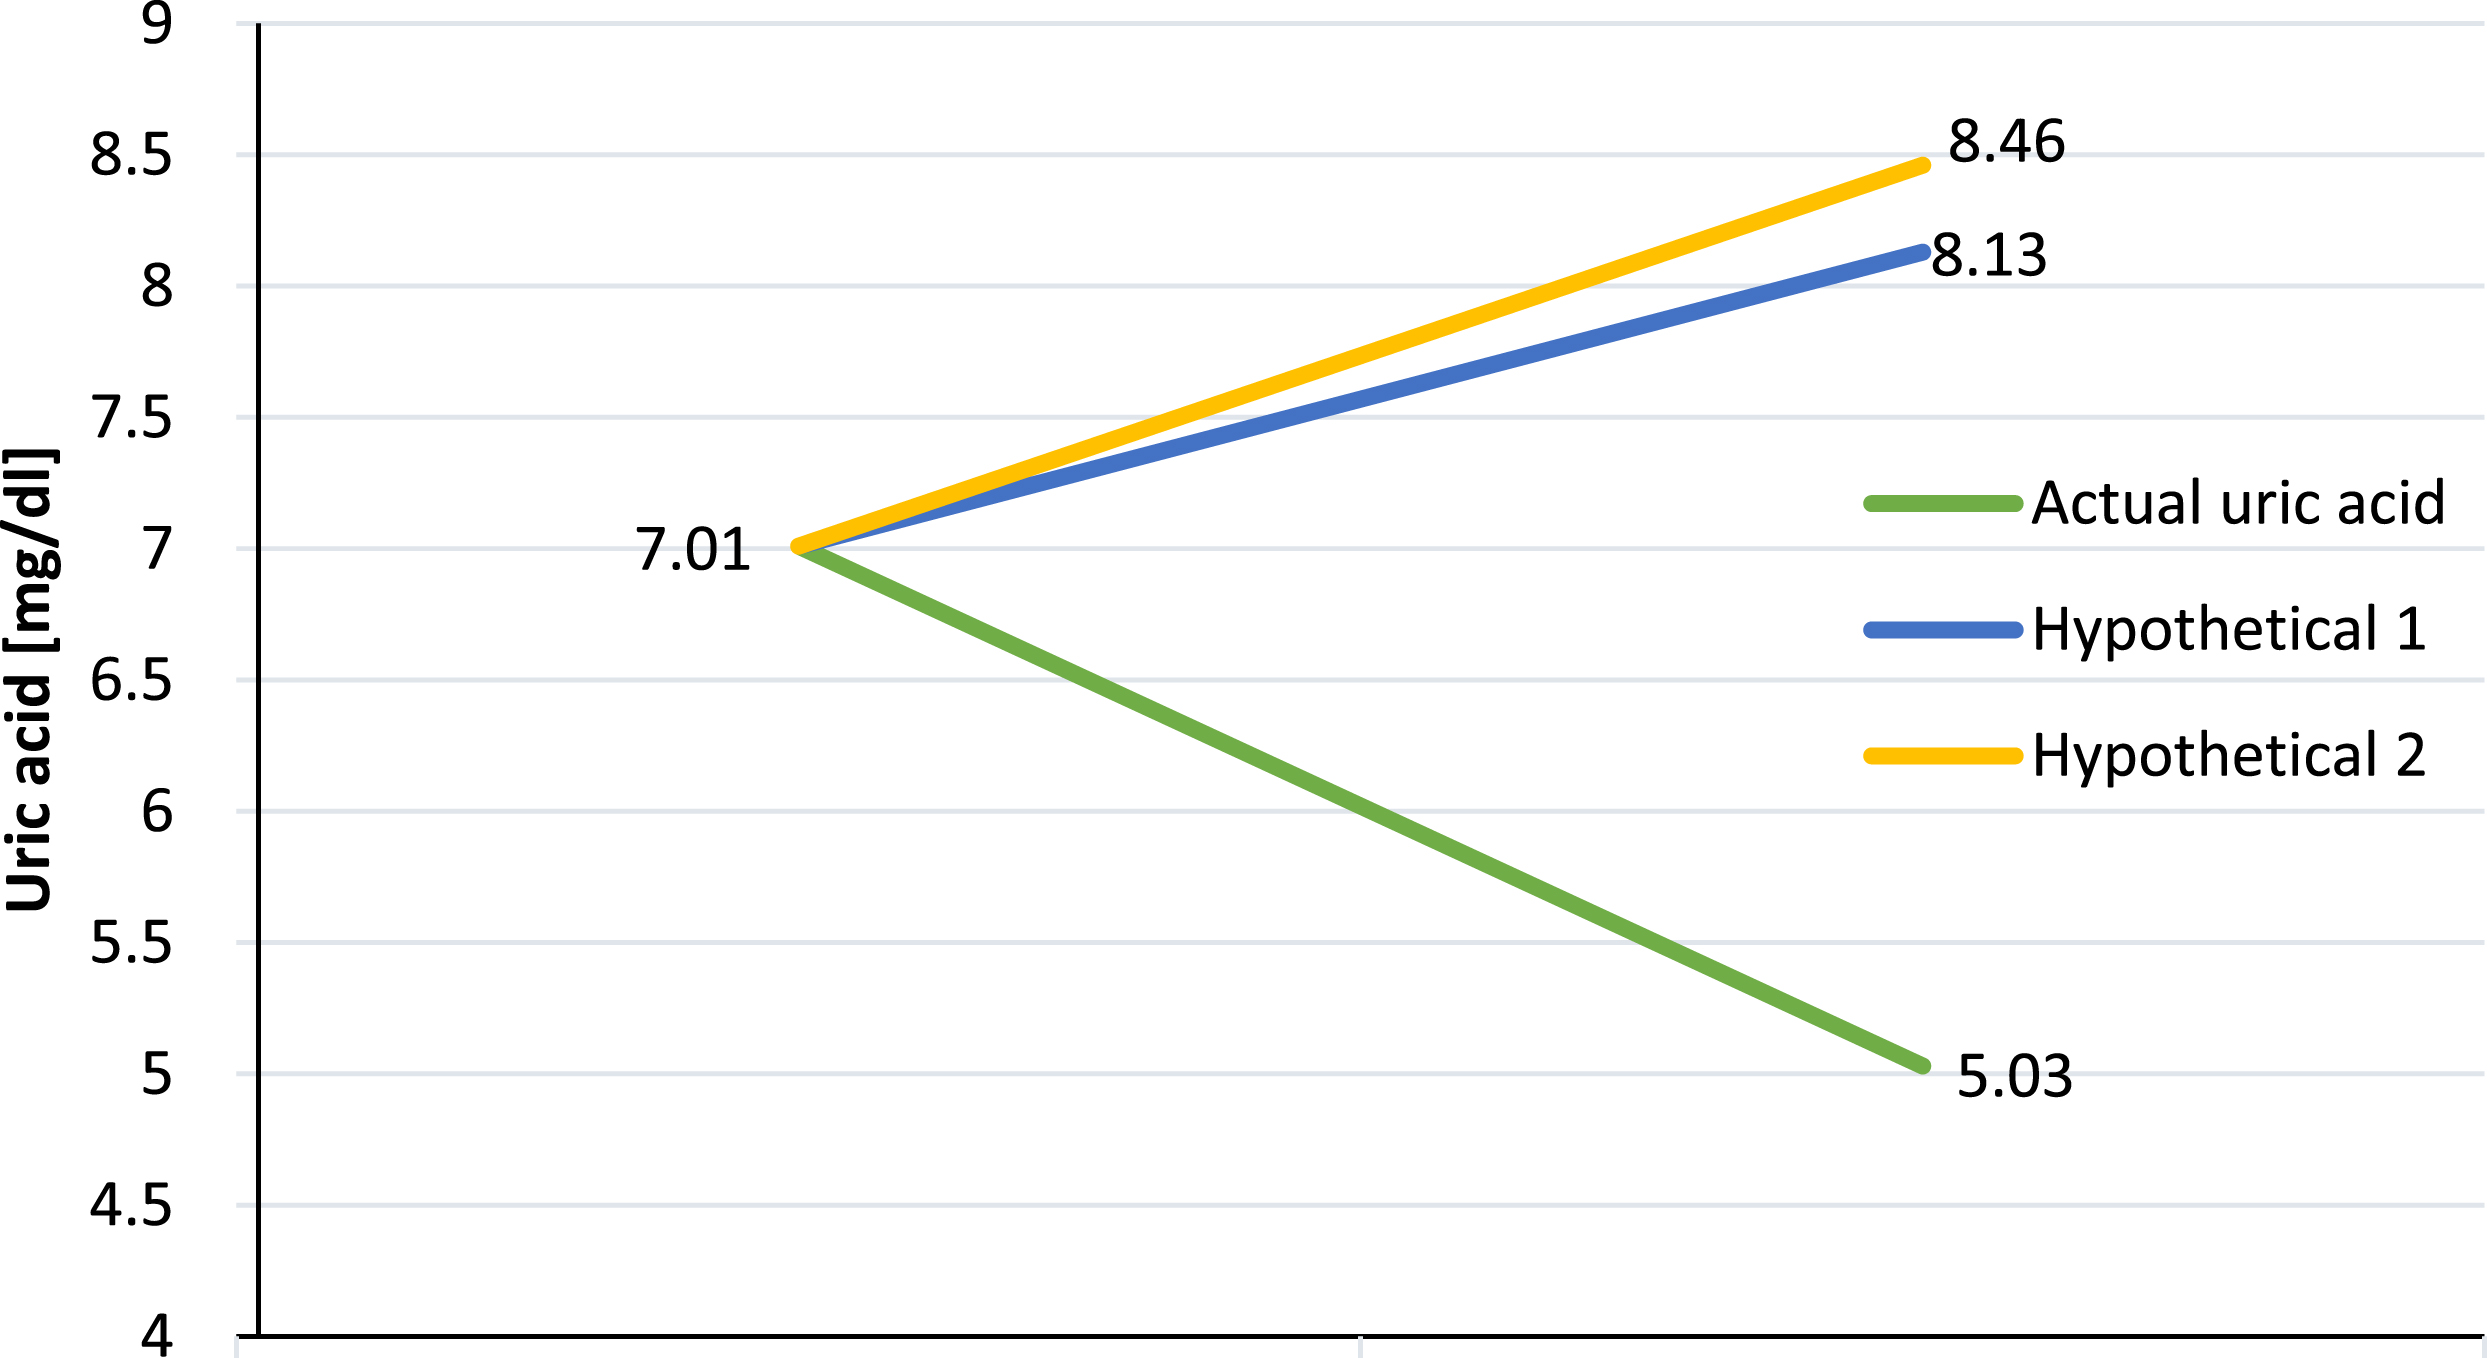
2.3Hypothetical uric acid
In order to demonstrate the beneficial effect of the Allopurinol therapy in group 1, hypothetical growth rates of the uric acid concentration without an Allopurinol therapy were calculated. This was conducted in 2 ways: The first calculation is based on the average deviation of the uric acid concentration per 103 WBC (hypothetical value 1) of group 4, which is 0.02923868 mg/dl per 103 WBC. The other calculation is predicted on the percentage deviation of the uric acid concentration (hypothetical value 2) of group 4, which amounts to 0.20742047 mg/ dl. The respective average deviations have to be multiplied with the WBC deviation values of every group 1 donor.
3Results
3.1Alteration of white blood cells (WBC)
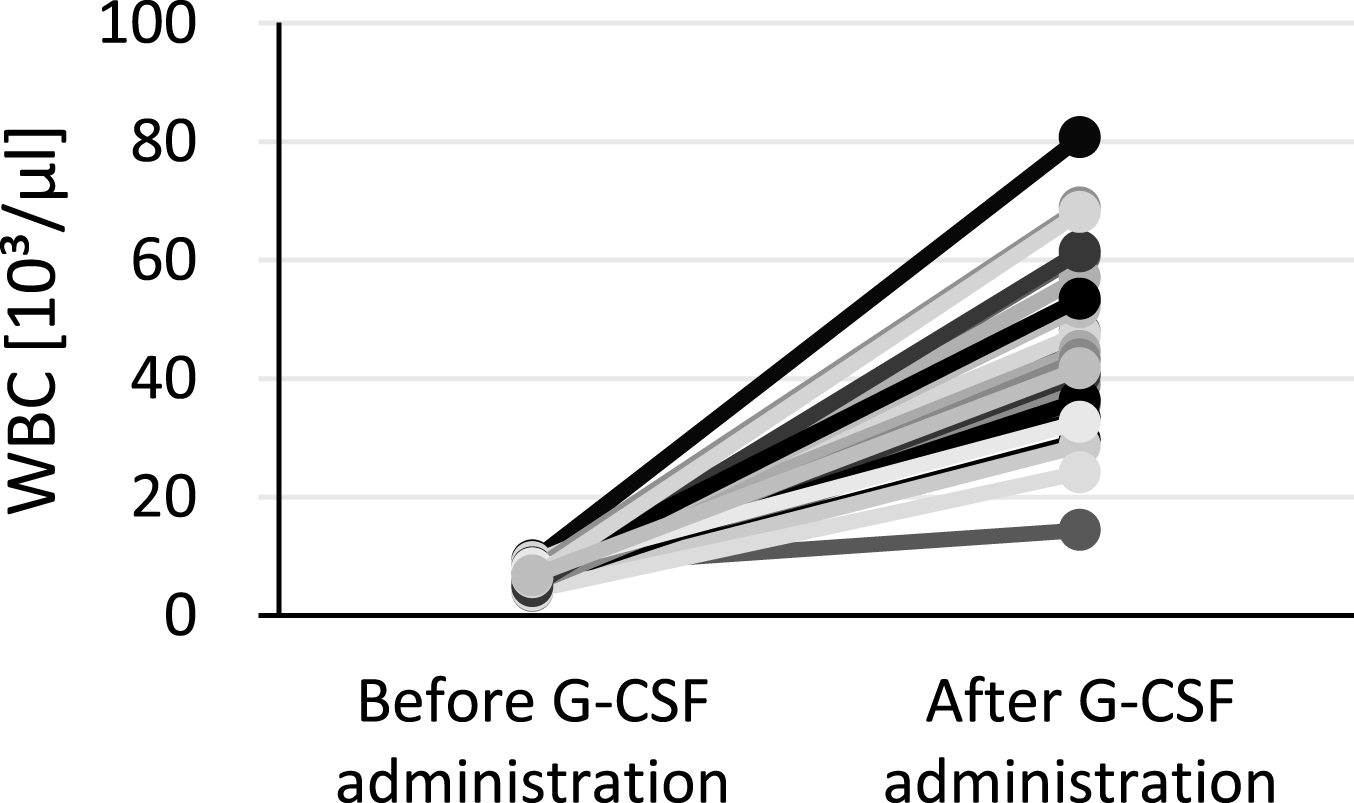
WBC are measured at PE and SE. Figure 2–4 represent the growth rates of WBC between both examinations for every donor. All groups show a similar development – every donor exhibits a rise in WBC but in an individual dimension. The development of WBC for group 1 is shown in Fig. 2. The mean increase of WBC amounts to 643.38%. The minimum percentage alteration is 333.13% and the maximum one is 934.48%. Figure 3 represents the rise of WBC for group 2 with a minimum value at 329.87% and a maximum one at 1049.11%; the average percentage increase is 662.57%. The alteration of WBC of group 3 is illustrated by Fig. 4. The mean elevation adds up to 639.48% with a minimum at 79.10% and a maximum at 1155.62%.
Fig.2
Alteration of WBC between pre- and second examination for group 1 donors.
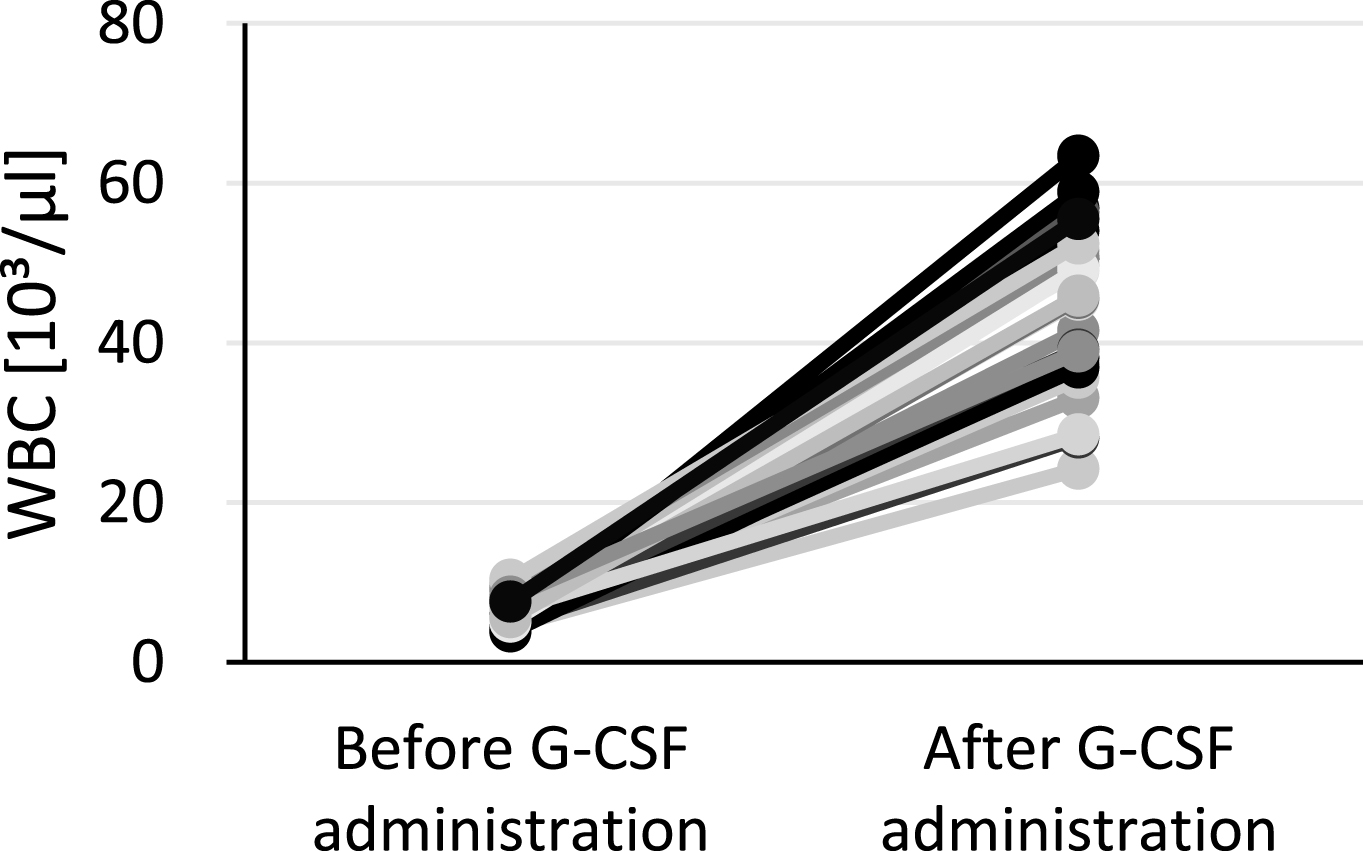
Fig.3
Alteration of WBC between pre- and second examination for group 2 donors.
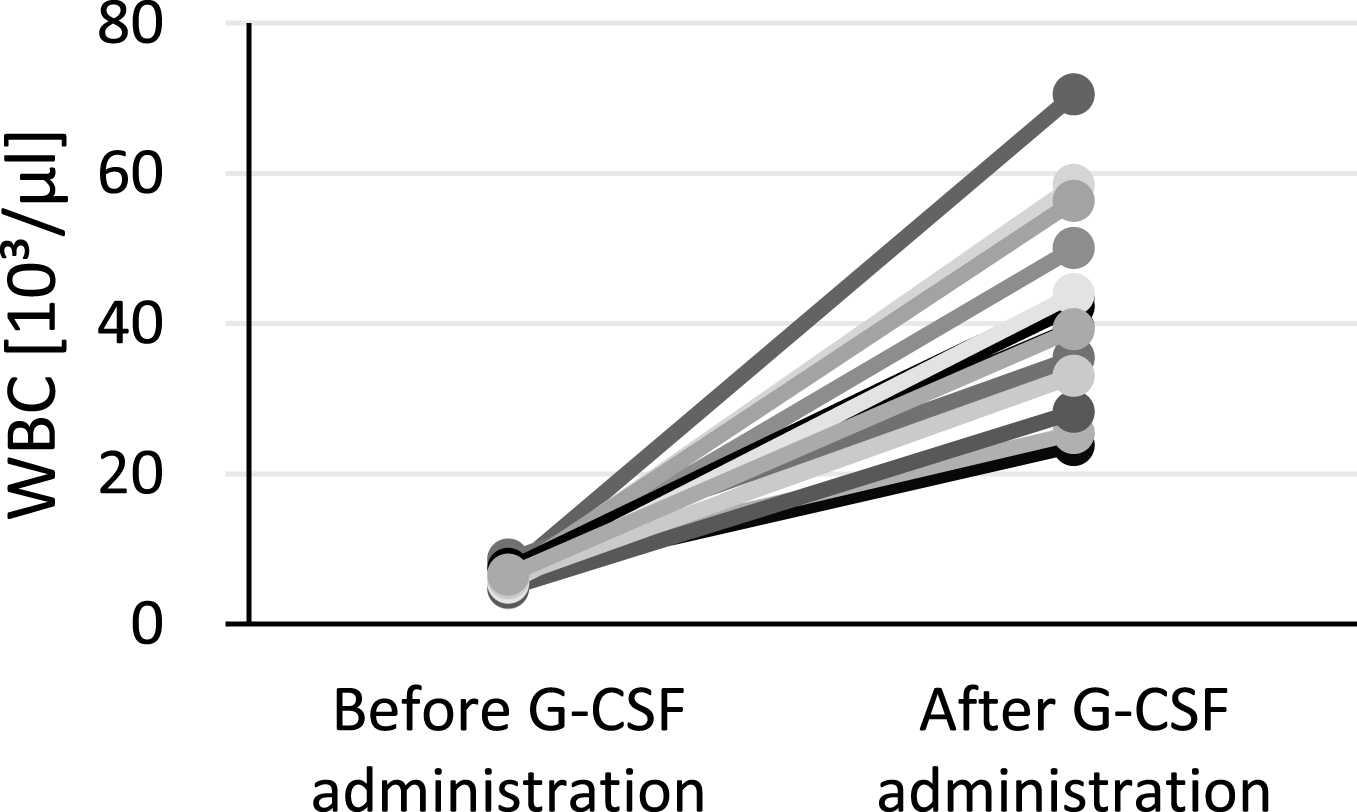
Fig.4
Alteration of WBC between pre- and second examination for group 3 donors.
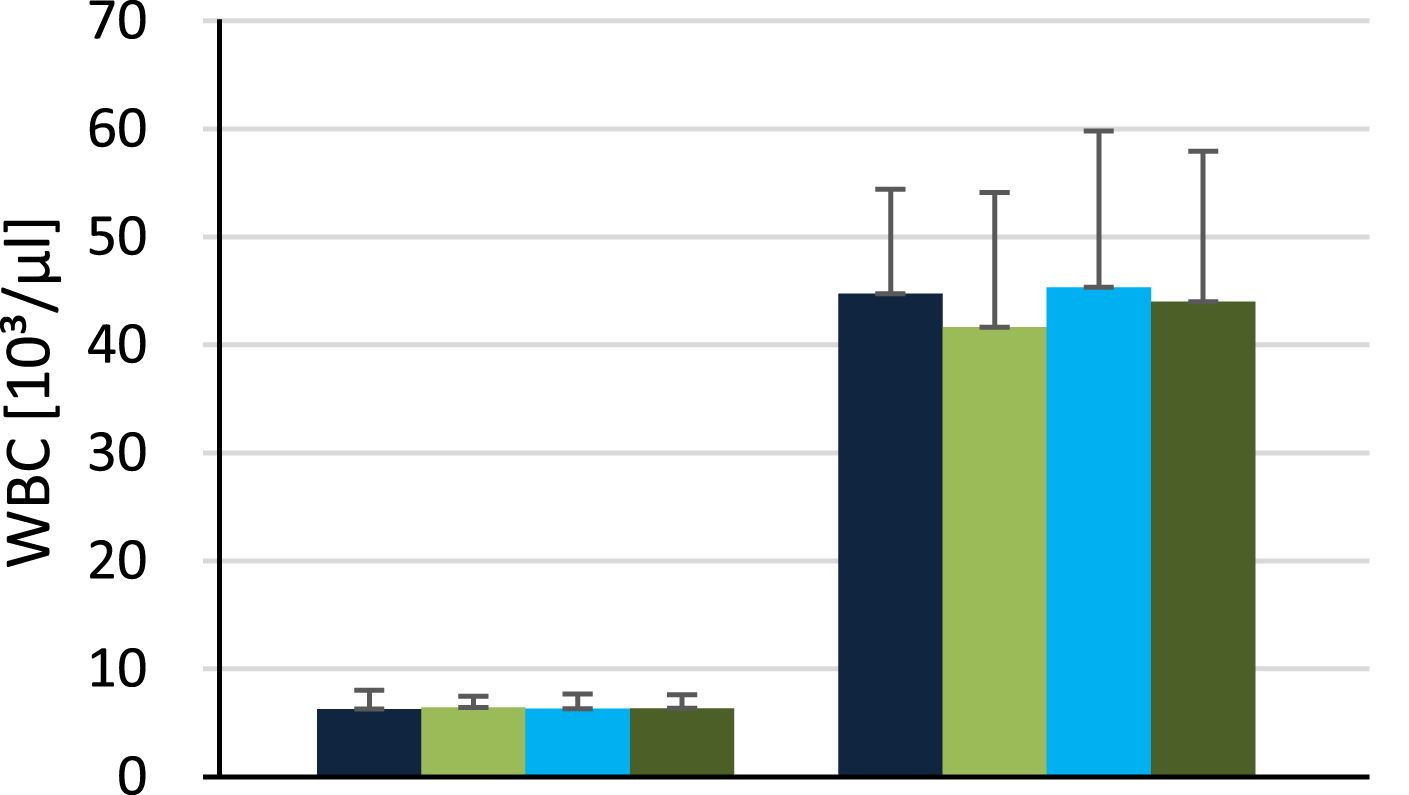
Figure 5 summarizes the development of WBC of all groups. The bars to the left represent the values of the PE, while these to the right show the values of the SE.
Fig.5
Quantity of WBC at the pre-examination (4 bars to the left) and second examination (4 bars to the right).
3.2Alteration of uric acid
The ascertainment of the serum uric acid concentration is crucial for the evaluation of this clinical trial. They are therefore measured during PE and FE. The growth rates between both examinations are used to examine the influence of the supplementary Allopurinol therapy. Figure 6–8 represent the alterations of uric acid for every donor of all groups. The average percentage deviation of group 1 amounts to –27.35% (PE/FE: 7.01/5.03 mg/dl). The decrease of uric acid is reflected in the amount of donors out of the normal range. At the PE there are 3 donors out of range, whereas at the FE none of them is above. Figure 9 illustrates the decrease of uric acid from group 1, though there is an inhomogeneity among the single donors; there is a span between –53.42 and 4.23%. There are 2 donors with an uric acid without alteration (4.23%, 1.59%). The development of uric acid from group 2 is shown by Fig. 6. There is a mean percentage increase of 17.47% (PE/FE: 4.79/5.58 mg/dl). The values ranges between –27.27 and 45.24%. There is only one donor with a decreasing value and one with a constant uric acid concentration. All donors are within the normal range at both examinations. Figure 7 visualizes the percentage deviation of group 3. There is a mean increase of 22.56% (PE/FE: 5.37/6.47 mg/dl), although there is a great variation between 1.67 and 68.89%. At the PE every donor is still within range, but at the FE there are 3 donors with elevated concentrations.
Fig.6
Alteration of uric acid between pre- and follow-up examination for group 2 donors.
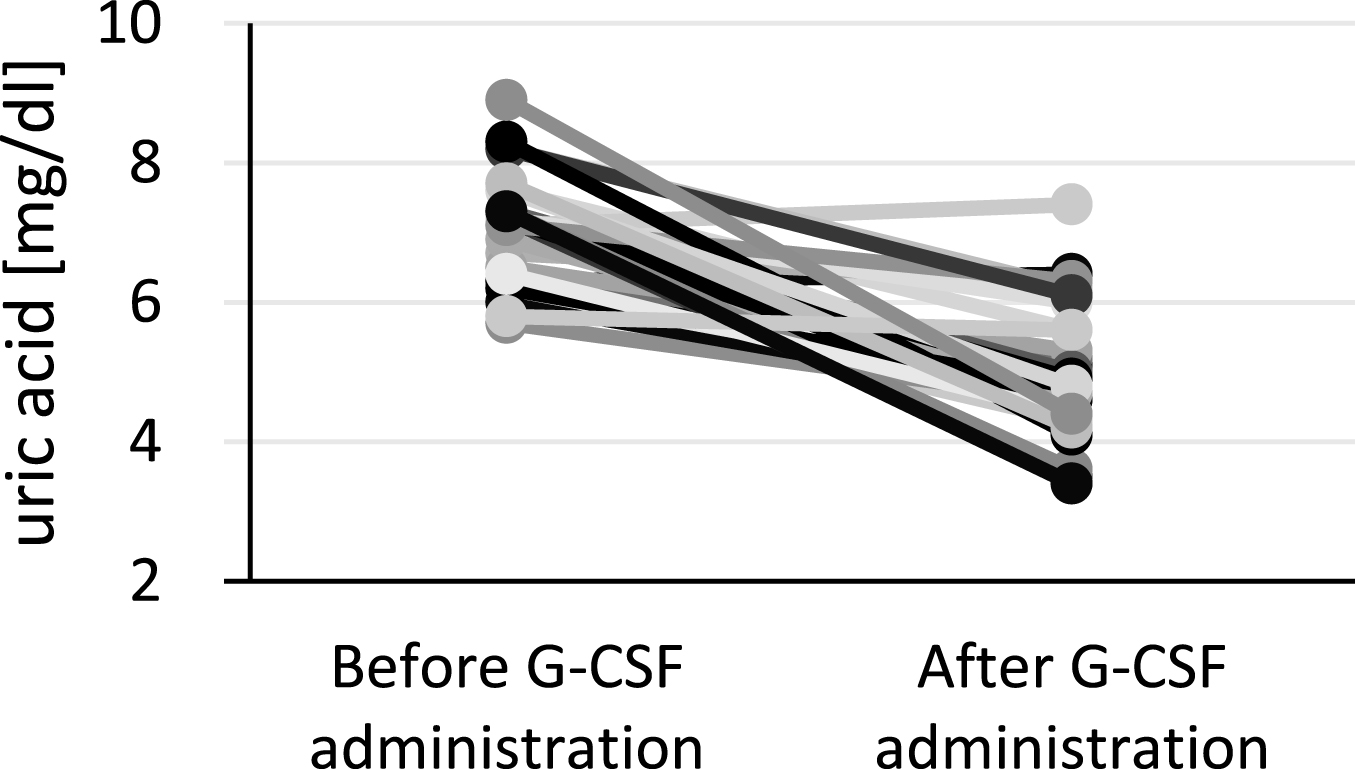
Fig.7
Alteration of uric between pre- and follow-up examination for group 3 donors.
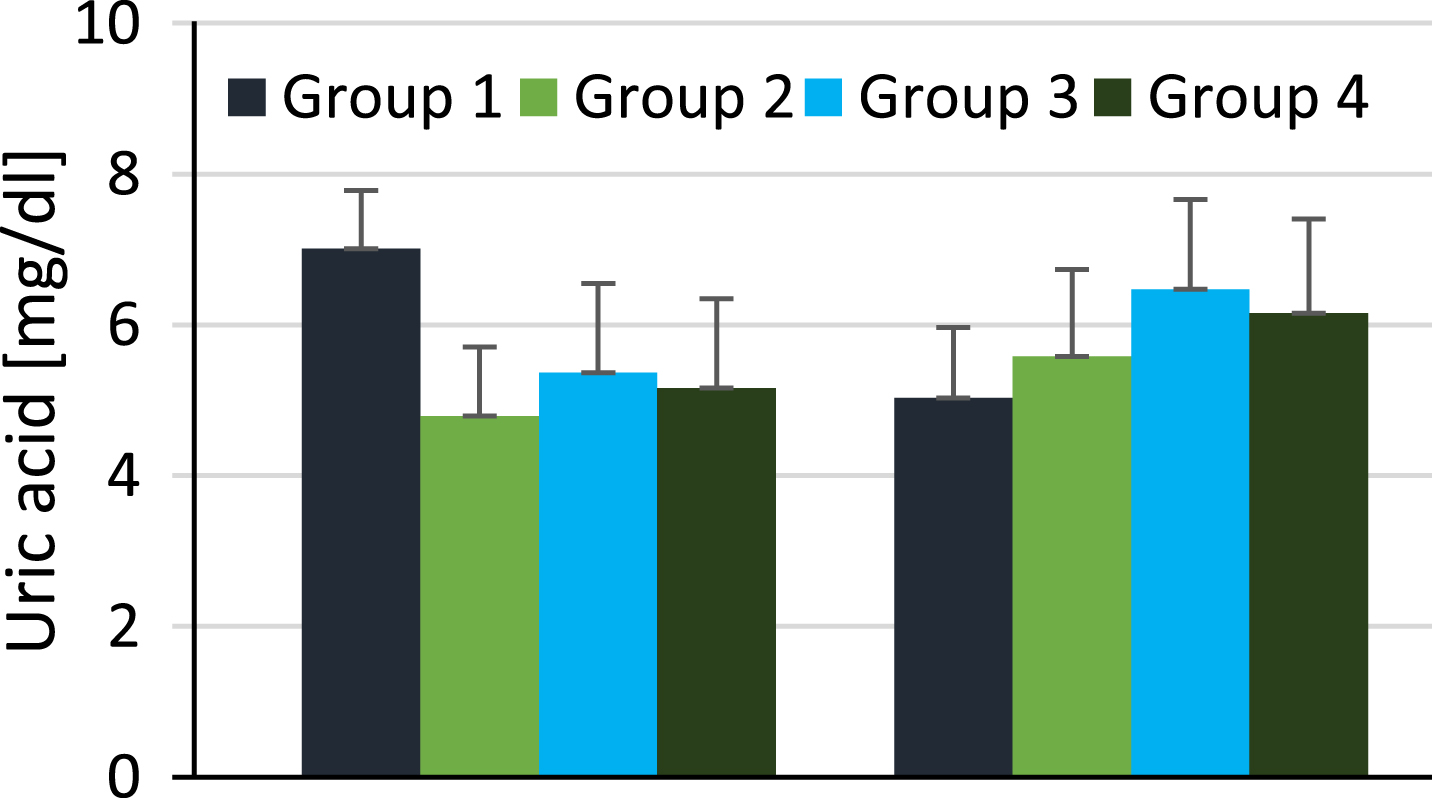
Fig.8
Alteration of uric acid between pre-examination (4 bars tot he left) and follow-up examination (4 bars to the right).
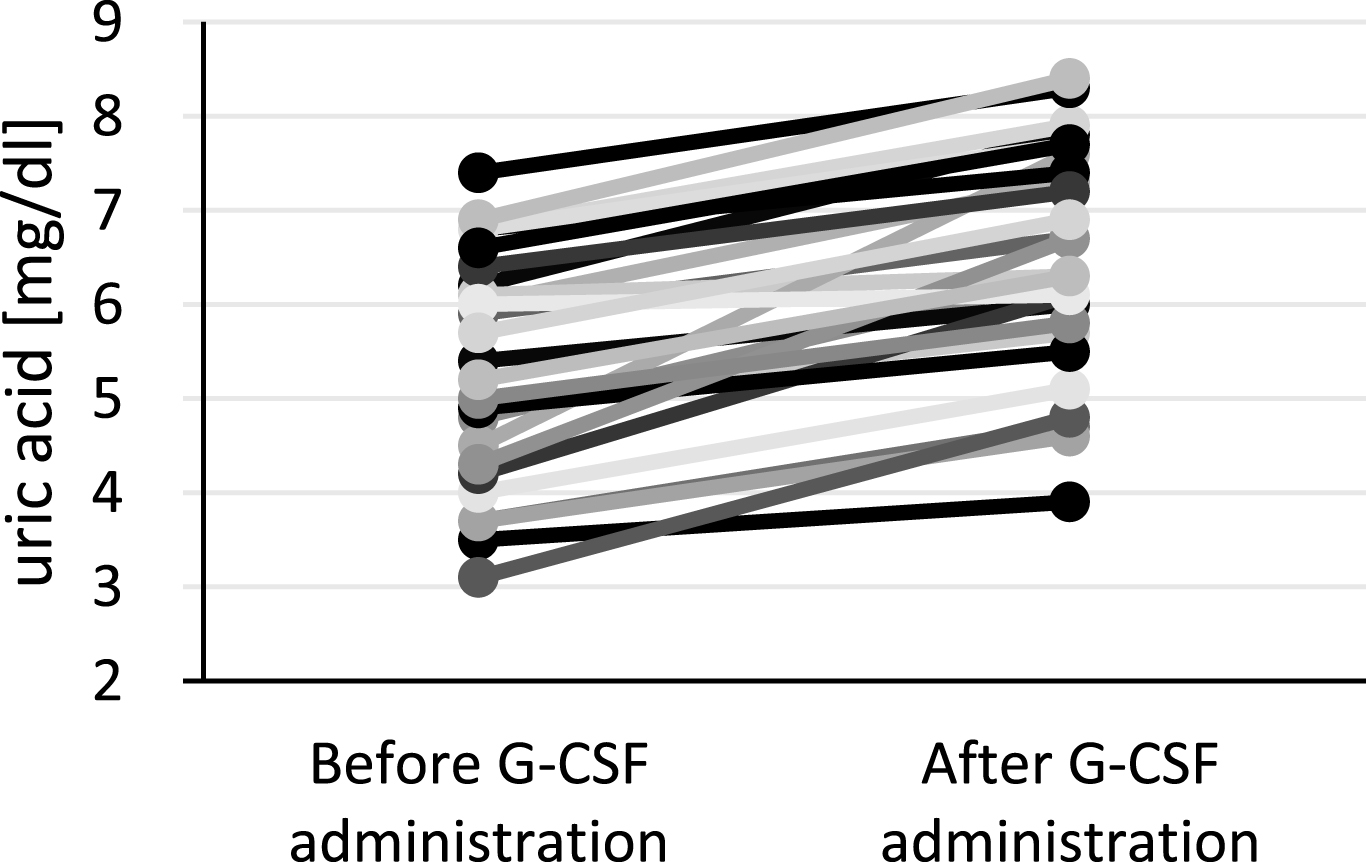
Fig.9
Alteration of uric acid between pre- and follow-up examination for group 1 donors.
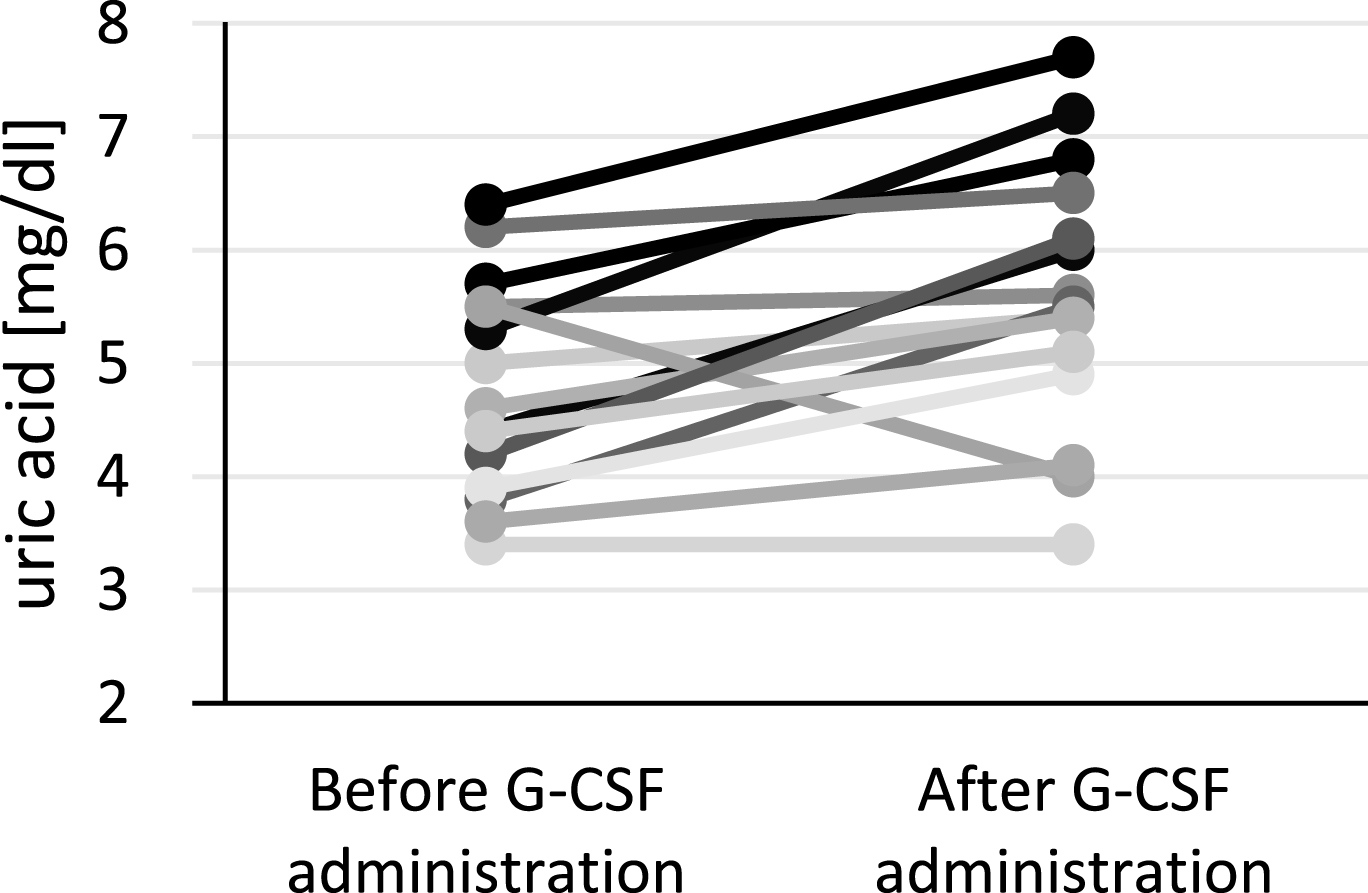
Figure 8 recapitulates all deviations between PE and FE, which strengthens the distinction among the groups. The mean value of group 1 is the only one that is declining by 27.35%, the mean values of the other groups are augmenting to higher values. Group 3 shows the highest increase.
3.3Comparison with hypothetical uric acid
Figure 10 represents the actual uric acid development with a preventative Allopurinol therapy in comparison with the calculated hypothetical developments. The hypothetical value 1 at FE increases to 8.13 mg/dl with a minimum concentration at 6.75 and a maximum one at 9.80 mg/dl. The hypothetical value 2 raises to 8.46 mg/dl with a range between 8.33 and 10.75 mg/dl. The factor of both mean hypothetical values mirrors the similarity of them, as the average of all factors amounts to 0.96. This is why, the calculated theoretical uric acid concentrations represent acceptable values, which explain, how the PBCs could have developed for every donor of group 1 without Allopurinol. According to the hypothetical value 1 50% of group 1 donors would show abnormal elevated uric acid concentrations after the G-CSF administration. Based on the hypothetical value 2 even 63% would lie above the upper border of the normal range.
Fig.10
Comparison of the actual uric acid with the hypothetical values of group 1.
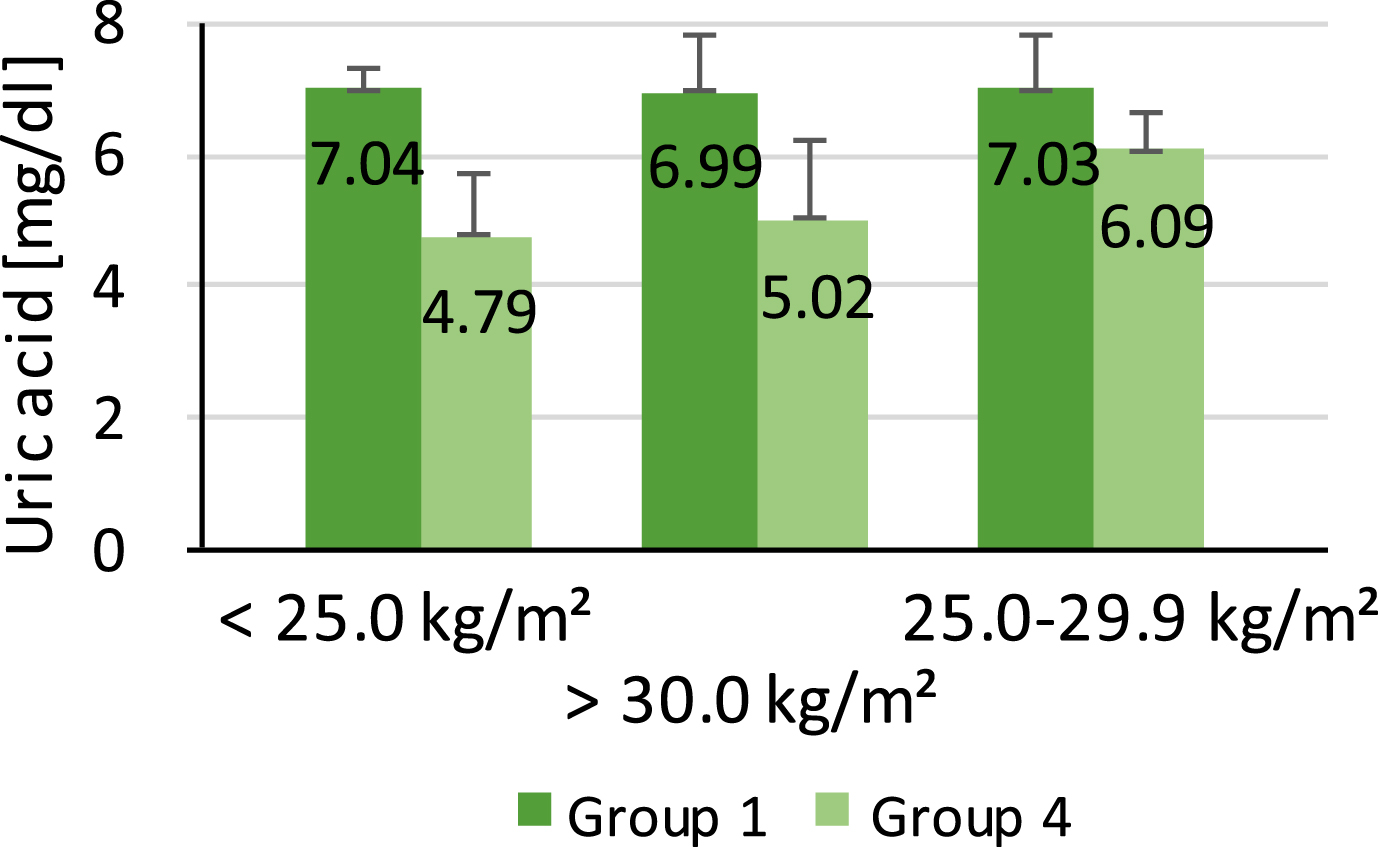
3.4Influence from BMI/age
The percentage amount of overweight donors with a BMI above 25 kg/m2 adds up to 69.44%. Group 1 exhibits with 80% a higher amount of overweight donors than group 4 with 61.9%. The connection of this information with the mean uric acid concentrations of both groups allows a first assumption of a weight-associated increase in uric acid. Group 4 includes more normal weight donors, and thus, the mean uric acid concentration is lower (5.16 mg/dl) than the value of group 1 (7.01 mg/dl). The mean uric acid concentration of group 1 and group 4 in dependence of the BMI is illustrated in Fig. 11. The bars correlate with the different BMI classifications (normal weight, overweight, adiposity). The mean uric acid concentration for normal weight donors (BMI < 25.0 kg/m2) is 7.04 mg/dl for group 1 and 4.79 mg/dl for group 4. In contrast, the average value of the overweight donors (BMI 25.0–29.9 kg/m2) is 6.99 mg/dl in group 1 and 5.02 mg/dl in group 4. The donors with adiposity (>30.0 kg/m2) show a mean uric acid concentration of 7.03 mg/dl in group 1 and 6.09 mg/dl in group 4. It can clearly be seen that there is a dependence between both parameters in group 4 – the greater the weight the higher the uric acid concentration. In contrast to that, the values of group 1 does not show any dependence – they stay similar for all weight classifications.
Fig.11
Correlation between uric acid BMI of group 1 and 4.
As the mean ages of group 1 (42.27 years) and group 4 (41.74 years) are very similar it is difficult to identify a relation between the mean ages and mean uric acid concentrations. Although the uric acid concentration of group 1 (7.01 mg/dl) is higher than of group 4 (5.15 mg/dl), a correlation should be carefully considered due to the small difference in age between both groups.
4Discussion
The administration of G-CSF bears a multitude of effects on the donors such as the increase in WBCs as a result of the stimulated proliferation and differentiation of the granulocyte line [5]. However, there are significant differences among the individuals. The wing-span varies between 79.10% and 1155.62%. They could depend on age, BMI or on a genetic basis. Another parameter that undergoes a distinct alteration is serum uric acid. Group 1 exhibits a significant decrease (–27.35%), whereas group 4 shows a significant increase (20.74%). This is the first hint of a successful Allopurinol therapy, as it influences the uric acid concentrations of group 1 in a positive way. At the PE 66.67% of all group 1 donors are above the saturation value of uric acid and are therefore endangered in developing a gout disease. At the FE the amount falls to 3.33%; the evidence of the lowering effect through Allopurinol. In contrast, 14.29% of group 4 members are above 6.5 mg/dl at the PE, but at the FE the amount rises to 40.48%.
The increase of uric acid is mainly caused by the G-CSF injections as they trigger a copious proliferation of WBC. This effect simultaneously leads to an elevated cell turnover, finally causing an increase of uric acid. Concentrations above the saturation value can provoke the emergence of uric acid crystals due to precipitating uric acid [10]. Consequently, a preventative therapy to avoid such increases in uric acid are particularly suitable for donors with hyperuricemia. Any further increase could trigger an acute gout seizure, thus the emergence of gout [8]. Actually, the degree of hyperuricemia is tightly connected to the probability of developing a gout disease [11].
There are already several reports about gout seizures in connection to G-CSF therapies. Spitzer et al. (1998) reported on the emergence of an acute gouty arthritis in a 65-year-old man within the limits of a rhG-CSF therapy (dosage: 10 μg/kg donor weight). He had no history of gout, though he already exhibited a high uric acid concentration at the beginning of the procedure (8.2 mg/dl). The symptomatology started on day 2 and worsened over the following days of G-CSF administration (swelling, erythema, warmth and tenderness concerning his left foot). An aspiration biopsy proved the existence of urate crystals. Only the treatment with Colchicine improved his condition [12]. Another case is described by Yamamoto et al. (1999). The medication of a granuloytopenia in an 82-year-old woman led to a pseudogout exacerbation by being treated with G-CSF in a dosage of 75 g over 5 days [13]. As a consequence, it is absolutely necessary to observe PBSC donors with high uric acid concentrations or hyperuricemia. Unfortunately, it is not unproblematic to identify concerned donors, as only one measurement (PE) leads as the criterion to determine whether they obtain a preventative therapy or not. Furthermore, less than 10% of hyperuricemia patients develop symptoms; the major part stays within an asymptomatic phase [14].
In fact, the importance of a preventative therapy is rising, because the prevalence as well as the incidence of gout and hyperuricemia is ascending worldwide. This tendency is mainly based on the contemporary lifestyle – purine-rich nutrition, the distinct spread of obesity as wells as the growing life expectation [11, 15].
Group 4 did not obtain a preventative Allopurinol therapy, as their uric acid was within the normal range. These donors are not expected to be at risk in developing a gout disease, although their values showed a distinct increase. This is why the elevated uric acid in the context of the PBSC donation is regularly a self-limited laboratory parameter in non-prestressed donors [16].
The calculated hypothetical values demonstrate the supposable development of uric acid concentration in group 1, in case they would not have received Allopurinol. With a preventative Allopurinol therapy all group 1 donors show uric acid values within the normal range, whereas according to the hypothetical values the uric acid concentration would have increased at least in 50% of the donors to an abnormal level. Based on this results, the potential of Allopurinol as preventative therapy in donors with marginal elevated uric acid blood levels could be proven.
Despite the promising results, this study has to be judged charily as the collective of 72 donors was too small, not randomly but selectively ordered and besides this, the sexual distribution within the groups has been irregular. It is therefore necessary to conduct another optimised clinical trial to confirm the beneficial effect of Allopurinol as well as to exclude serious side effects. Furthermore, the developing of the uric acid concentration should be examined in several time intervals after FE, to observe the duration until the uric acid blood level has normalized.
The G-CSF administration leads to an enormous increase of the uric acid concentration, which is particularly dangerous for donors, who already feature a hyperuricemia. A further rise of uric acid through the G-CSF administration could potentially trigger an acute gout seizure, which is often the beginning of a chronic gout. The problem of the PBSC donation is that there is only one single measurement at the PE of the donors’ uric acid blood level and only this parameter is used to decide whether the donors receive Allopurinol or not. In order to diagnose hyperuricemia, however, it is necessary to have long term values of every donor to get reliable values, which is difficult to realize. As the number of patients with hyperuricemia constantly rises in the Western affluent society, it is of prime importance to consider preventative solutions for the affected donors during the G-CSF taking.
Based on the results of our clinical trial, Allopurinol seems to have a lot of potential, as it does not interact with G-CSF and therefore has no negative effect to the CD34+ cell yield as well as to the other parameters. A further positive criterion is that Allopurinol involves generally low side effects and moreover a marginal low uric acid concentration does not have an impact to the health of donors.
An alternative medicament to Allopurinol may represent Febuxostat, which is a non-purine selective inhibitor of the xanthine oxidase. A study of Becker et al. (2005) compared the effect of Febuxostat with Allopurinol in 762 patients with hyperuricemia and gout. The results showed that smaller doses from 80 mg or 120 mg of Febuxostat lowered the serum urates more effectively than higher standard doses of 300 mg Allopurinol. For the future, long-term studies should be conducted, in order to evaluate all side effects arising through Febuxostat [17].
On the basis of the findings presented in our paper, further studies will be required to extend the knowledge concerning preventative methods in order to ensure donors’ safety in the PBSC donation. It is therefore desired to prove the potential of Allopurinol as well as further potential therapeutic agents like Febuxostat. As the G-CSF administration causes the most frequent side effects during the PBSC dontion so far, it will also be necessary to investigate the entire regulatory circuit of G-CSF, which has not been fully elucidated to date [5].
In conclusion, the clinical trial could prove the effectivity of Allopurinol in lowering the serum uric acid concentration in donors with increased uric acid concentrations without affecting the outcome of G-CSF and therefore could prevent the raise of marginal increased uric acid concentrations in donors up to alarming levels.
References
[1] | Blazar BR , Abedi M , Murphy WJ . Advances in graft-versus-host disease biology and therapy. Nature Rewievs Immunology. (2012) ;443–58. |
[2] | Beelen DW , Mytilineos J , Bornhäuser M , Ottinger H , Stähle M . Jahresbericht 2014, DRST Deutsches Register für Stammzelltransplantationen e.V., August 2015 [Online]. Available: http://www.drst.de/download/jb2014.pdf. [access on 25 December 2015]. |
[3] | Wiesneth M . Transfusionsmedinzin und Immunhämatologie, Berlin Heidelberg: Springer-Verlag. (2011) , pp. 245–60. |
[4] | Chen S-H , Wang T-F , Yang K-L . Hematopoietic stem cell donation. International Journal of Hematology. (2013) ;446–55. |
[5] | Watanabe T , Suzuya H , Onishi T , Kanai S , Kaneko M , Watanabe H , Nakagawa R . Effect of Granulocyte Colony–Stimulating Factor on Bone Metabolism during Peripheral Blood Stem Cell Mobilization. International Journal of Hematology. (2002) ;75–80. |
[6] | Hiddemann W , Bartram CR . Zytokine, in Die Onkologie, Berlin Heidelberg, Springer-Verlag. (2010) , pp. 514–28. |
[7] | Krischer H . Der Westen, 1 Januar 2013. [Online]. Available: http://www.derwesten.de/region/westfalen/so-viele-stammzellenspender-wie-noch-nie-registriert-id7439210.html. [access on 14 February 2016]. |
[8] | Reuss-Borst MA . Hyperurikämie - Wann und wie behandeln? Der Internist, Arzneimitteltherapie (2016) ;1–7. |
[9] | Mutschler E , Geisslinger G , Kroemer H , Menzel S , Ruth P . Arzneimittelwirkungen, Pharmakologie, klinische Pharmakologie, Toxikologie, Stuttgart: Wissenschaftliche Verlagsgesellschaft Stuttgart. (2012) , 10. edition. |
[10] | de la Rubia J , de Arriba F , Arbona C , Pascual MJ , Zamora C , Insunza A , Martinez D , Paniagua C , Diaz MA , Sanz MA . Follow-up of healthy donors receiving granulocyte colony-stimulating factor for peripheral blood progenitor cell mobilization and collection. Results of the Spanish Donor Registry, Haematologica. (2008) ;735–40. |
[11] | Luk AL , Simkin PA . Epidemiology of Hyperuricemia and Gout. The American Jounral Of Managed Care. (2005) ;435–42. |
[12] | Spitzer T , McAfee S , Poliquin C , Colby C . Acute gouty arthritis following recombinant human granulocyte colony-stimulating factor therapy in an allogeneic blood stem cell donor. Bone Marrow Transplant. (1998) ;966–7. |
[13] | Yamamoto H , Teramoto S , Matsui H , Matsuse T , Toba K , Ouchi Y . An elderly case with pseudogout exacerbated by the administration of granulocyte-colony stimulating factor during drug-induced granulocytopenia, Nippon Ronen Igakkai Zasshi. Japanese Journal of Geriatrics. (1999) ;572–5. |
[14] | Winzer M , Tausche A-K , Aringer M . Kristallinduzierte Inflammasomaktivierung: Gicht und Pseudogicht, Zeitschrift für Rheumatologie. (2009) ;733–9. |
[15] | Zhu Y , Pandya BJ , Choi HK . Prevalence of gout and hyperuricemia in the US general population: The National Health and Nutrition Examination Survey 2007-2008. Arthritis & Rheumatism. (2011) ;3136–41. |
[16] | Atkinson K , Champlin R , Ritz J , Fibbe WE , Ljungman P , Brenner MK . Clinical Bone Marrow And Blood Stem Cell Transplantation, Cambridge: Cambridge University Press, 2004, third edition. |
[17] | Becker MA , Schumacher R , Wortmann RL , MacDonald PA , Eustace D , Palo WA , Streit J , Joseph-Ridge N . Febuxostat compared with Allopurinol in Patients with Hyperuricemia and Gout. The New England Journal of Medicine. (2005) ;2450–60. |

