
Protein spectrum of blood plasma in patients with diabetes mellitus type II
Abstract
BACKGROUND:
The cumulating long-term changes in stable macromolecules, including non-enzymatic glycosylation of proteins and oxidative stress, are main fundamental reasons for development of late complications in patients with diabetes mellitus type II.
OBJECTIVE:
To evaluate some high-sensitive and specific proteins as early diagnostic tool and prognostic biomarkers of late complications of diabetes mellitus type 2 (T2DM).
METHODS:
Proteomic studies of blood plasma in patients with T2DM were performed through one- and two-dimensional electrophoresis of proteins in polyacrylamide gel, in the presence of sodium dodecyl sulfate - according to Laemmli (SDS PAGE).
RESULTS:
The spectrum of 70 proteins was proposed as tools in clinical/laboratory diagnostics and as independent prognostic biomarkers - predicting early development of disease complications.
CONCLUSIONS:
The identified proteomic biomarkers in blood plasma of patients with T2DM could serve as drug targets for early prevention and successful treatment of disease complications.
1Introduction
According to forecasts of WHO, in 2030 more than 500 million people worldwide will suffer from diabetes mellitus. Thus, the development of new diagnostic tools and effective therapy for diabetes mellitus and its complications could be of enormous medico-social and economic importance. The bulk of patients with impaired glucose metabolism are people suffering from type II diabetes mellitus - more than 85% of the entire population of patients with diabetes mellitus. Currently, one of the main problems of medical control in patients with diabetes mellitus is the early detection of late complications of disease (micro- and macroangiopathy, neuropathy, retinopathy, nephropathy, encephalopathy) as well as elucidation of the risk factors for their development, with a view to in time and successful pharmacological treatment [1, 2]. Recently it was evaluated that only achieving the glycemic targets is not enough to prevent the development- and|or to reduce manifestation of the late complications in patients with T2DM.
Two main cellular and molecular mechanisms play major role in the pathogenesis of diabetes mellitus: metabolic disorders and microcirculatory vascular lesions. Starting as a metabolic syndrome (MS), diabetes mellitus becomes vascular disease - due to the endothelial dysfunction and impaired blood rheology causing cell ischemia and hypoxia [3]. The most significant factor for development of atherosclerosis is the metabolic syndrome in diabetes mellitus. Disturbances of the cerebral circulation in diabetes mellitus are more expressed and often could be fatal for patients even without hyperglycemia [4–7, 11]. This finding suggests a mechanism for the development of cerebro-vascular complications in diabetes mellitus [5–7].
Under conditions of hyperglycemia in patients with diabetes mellitus, non-enzymatic modification of proteins by glucose can occur (Meyyara reaction), causing structural and functional restructuring of the protein molecules [3]. Non-enzymatic glycation of proteins is one of the fundamental reasons for the formation of late complications of diabetes mellitus [9]. Currently, the study of post-translational modifications of the protein profile in clinical laboratory practice is hardly used, possibly due to insufficient knowledge of the matter. However, it is believed that long-term changes in the cumulative stable macromolecules could be main risk factor for development of late complications in the diabetes mellitus patients.
The aim of the present study is to examine a wide spectrum of blood plasma proteins as high-sensitive and specific diagnostic and prognostic biomarkers for early appearance of late complications in T2DM.
2Subjects and methods
2.1Subjects
To implement the objectives of the study a group of patients with type II diabetes mellitus was examined, which is a major part of the patients with an increased risk of acute cerebrovascular events. 12 patients with type II diabetes mellitus, aged between 38–74 years and with a 12 year mean duration of the disease, and 10 clinically healthy subjects (controls) were investigated. The diagnosis of the patients was based on the clinical examination and estimation of blood glucose, insulin and HbA1C and was established by endocrinologist, ophthalmologist and neurologist, laboratory blood tests (clinical and biochemical analysis, glucose, glycosylated hemoglobin determination), and electroneuromyographic examination of the dynamics of pathological processes. The clinical characteristics of the examined patients are shown in Table 1. They all received different oral anti-diabetic treatment and/or insulin. Only one patient (# 8) received an antiplatelet agent - anticoagulant Warfarin in a dose 2.5 mg, 2 tablets/day. Based on clinical data and laboratory results, patients were divided in two groups - with angioretinopathy (n = 7) and neuropathy (n = 5). All patients were treated in the Department of Endocrinology at First Moscow State Medical University (MGMU) I. M. Sechenov, Moscow, Russia.
Table 1
Clinical characteristics of the T2DM patients
| No of patient | Fasting blood glucose + glycohemoglobin (HbA1c) | Therapy (insulin/oral glucose-lowering medications) | Arterial blood pressure | Accompanying diseases Changes in the ocular fundus, liver/kidney functions |
| 1 | 8,5 (HbA1c-7,9%) | OGLM | 130/90 | DPN, HHD II-d. |
| 2 | 7,5 (HbA1c-7,6%) | OGLM | 130/80 | AH III-d. |
| 3 | 7,6 (HbA1c-7,5%) | Insulin | 130/80 | Proliferative retinopathy, nephropathy, DPN, HHD II-d; hypothyroidism (compensated) |
| 4 | 8,0 (HbA1c-9%) | Insulin+ OGLM | 120/80 | Pre-proliferative retinopathy OS, DPN, primary hypothyroidism (compensated) |
| 5 | 6,4 (HbA1c-7,2%) | OGLM | 130/80 | HHD II – d. |
| 6 | 8,6 (HbA1c-10%) | Insulin+ OGLM | 130/80 | DPN, DFS. HHD I-d. |
| 7 | 7,4 (HbA1c-6,7%) | Insulin+ OGLM | 140/80 | Congenital heart disease, violation of rhythm and conduction; Radiofrequency ablation of the pulmonary veins, HHD II-d, III-d |
| 8 | 8,0 (HbA1c-8,8%) | Insulin prolong.+ OGLM | 110/70 | DPN, HHD II-d. III-d., IHD. Rheumatic heart disease. CHF IIA |
| 9 | 7,3 (HbA1c-6,9%) | Insulin+ OGLM | 100/60 | Non-proliferative retinopathy OU, DPN, IHD, CHF IIA, HHD III-d. |
| 10 | 6,0 (HbA1c-6,8%) | Insulin+ OGLM | 130/80 | AH II- d. |
| 11 | 9,2 (HbA1c-8,8%) | OGLM | 120/80 | – |
| 12 | 9,0 (HbA1c-8,6%) | Insulin+ OGLM | 125/70 | DPN, HHD II-d. |
Abbreviations: OGLM – oral glucose-lowering medications, HHD – hypertensive disease, DFS – diabetic foot syndrome, CHF – chronic heart failure, AH – arterial hypertension, DPN – diabetic polyneuropathy.
2.2Proteomic studies of blood plasma in T2DM patients. Electrophoresis of proteins in polyacrylamide gel in the presence of sodium dodecyl sulfate according to Laemmli (SDS PAGE)
Proteins electrophoresis was performed for 60 min at 200 mA current strength and voltage of 200 V, using electrophoretic cell Mini-Protean Tetra System made by “Bio-Rad”, USA, with power source of “Elf-8”, DNA Technology, Russia. Blood from the cubital vein of patients was used. In order to prevent protein cleavage by serine proteases 5μl of PMSF for every 1000μl of blood was added to each sample (glass tube).
Delipidation plasma was obtained by centrifugation for 15 minutes at 18,000×g, at 4 °C, using Centrifuge 5810R made by Eppendorf company, Germany. The supernatant liquid was diluted with 1:2.5 buffer (0.25 ml of plasma + 0.375 ml buffer): 10 mM Tris-HCl, pH 7,4, 0,15 M NaCl. Aggregates and particles were also separated by centrifugation (15 min, 18,000×g at 4 °C). To 20μl the supernatant 20μl of TES was added (50 mM Tris-HCl, pH 6,8, 1 mM EDTA, 2% SDS) and 40μl of dye samples (100 mM Tris-HCl, pH 6,8, 20% glycerol, 8% SDS, 0,002% BrPh), warmed up for 5 minutes at 95 °C in an oven “Gnome” DNA Technology, Russia and after that warmed up for 20 minutes at 37 °C Termo-Shaker TS 100C, BioSan, EU [9].
The gel images were scanned with the fluorescence scanner PharosFX (“Bio-Rad”, USA). The samples of the compared groups were mixed with fluorescent dyes Cy3 Protein Labeling Kit and Cy5 Protein Labeling Kit (Jena Bioscience) in equal proportions and separated using two-dimensional electrophoresis. Two-dimensional electrophoresis was performed according to standard protocol [12] with slight modifications. Isoelectric focusing was performed in glass tubes (“Bio-Rad”, USA) with an inner diameter of 1.5 mm, an outer diameter of 7.5 mm and a length of the gel of 17 cm, using Protean 2-D Cell Components equipment (“Bio-Rad”, USA). The samples were adjusted to no more than 200μg of total protein per 1 tube. After isoelectric focusing tube were equilibrated for 30 minutes in a buffer containing 0.5 M TRIS (pH 8.8), 6 M urea, 30% glycerol, sodium dodecyl sulfate (20 g/l) and 20 mM dithiothreitol. Separation in the second direction was performed on Protean Multi-Cell (“Bio-Rad”, USA).
After staining with silver nitrate - with a regular scanner at 300 dpi samples are analyzed by the PDQuest Basic 8.0.1 Advanced 2-D Analysis program (“Bio-Rad”, USA). After analyzing 2D-gel images PDQuest program formed a report, in which all protein spots, characterized by a significant (p < 0,05) difference in the fluorescence intensity between the compared groups, were found. The ratio of fluorescence intensities (Cy5/Cy3) of protein spots corresponds to the ratio of the respective proteins in the samples of compared groups.
Protein spots that have a difference in fluorescence intensity by more than 1.5 times, were cut from the gel and placed into microtubes in a small volume of water for chromatography. Trypsin digestion and peptide extraction were performed according to standard protocol [13]. Then 1μl of the mixture was stirred with the target peptides and with the matrix solution (20 mg/ml 2,5-dihydroxybenzoic acid, 50% acetonitrile and 0.1% trifluoroacetic acid). Mass spectra were obtained on the +instrument MALDI Time-of-flight (Ultraflex TOF/TOF, Bruker Daltonik GmbH; Bremen, Germany) in reflective registration regime of positive mode ions in the mass range of 500–5000 Da. Data were processed using the programs FlexAnalysis 3.3 (Bruker Daltonics), and autocatalytic cleavage trypsin peaks contained in the samples, were explored for calibration of the method used. The following parameters were performed for the proteomic analysis: accuracy of the weight determination - 100 ppm, SwissProt database, taxonometric category Human, an assumption that one site of specific cleavage by trypsin was missed. If the value reliability of the identification of evaluation (score), calculated for each sample is greater than 56, then the identification is considered to be reliable (p < 0,05). Calculating method of the reliability identification of evaluation is described in the electronic site at: http://www.matrixscience.com/help/scoring_help.html.
3Results and discussion
3.1Proteomic assays of blood plasma in patients with Diabetes mellitus type II by 1D electrophoresis
At the initial stage of the investigation the protein spectrum of blood plasma was determined by 1-D electrophoresis in 14% SDS PAGE and 8% SDS PAGE for each patient individually, according to Laemmli (Figs. 1 and 2; Figs. 3 and 4).
Figs.1–4
1-D electrophoresis of plasma of 14% and 8% SDS PAGE. Figures 1 and 2 Individual plasma samples 14% SDS PAGE. Figures 1 and 2 1-D-electrophoretogram plasma proteins. 1st track - proteins - markers MW. 2nd track - control pools of blood plasma. 3rd track - a clinically healthy subject 1. 4th track - a clinically healthy subject 2. 5th track - patient 3. 6th track - patient 4. 7th track - patient 5. 8th track - patient 6. 9th track - patient 7. 10th track - patient 8. Figures 3 and 4 Individual plasma samples 8% SDS PAGE. Figures 3 and 4 1-D electrophoretogram plasma proteins of the blood of D2TM patients of the blood of D2TM patients. 1st track - control pools of blood plasma. 2nd track - a clinically healthy subject 1. 3rd track - a clinically healthy subject 2. 4th track - markers MW. 5th track - patient 9. 6th track - patient 10. 7th track – patient 11. 8th track – patients 12. 9th track - patients 13. 10th track - patients 14.
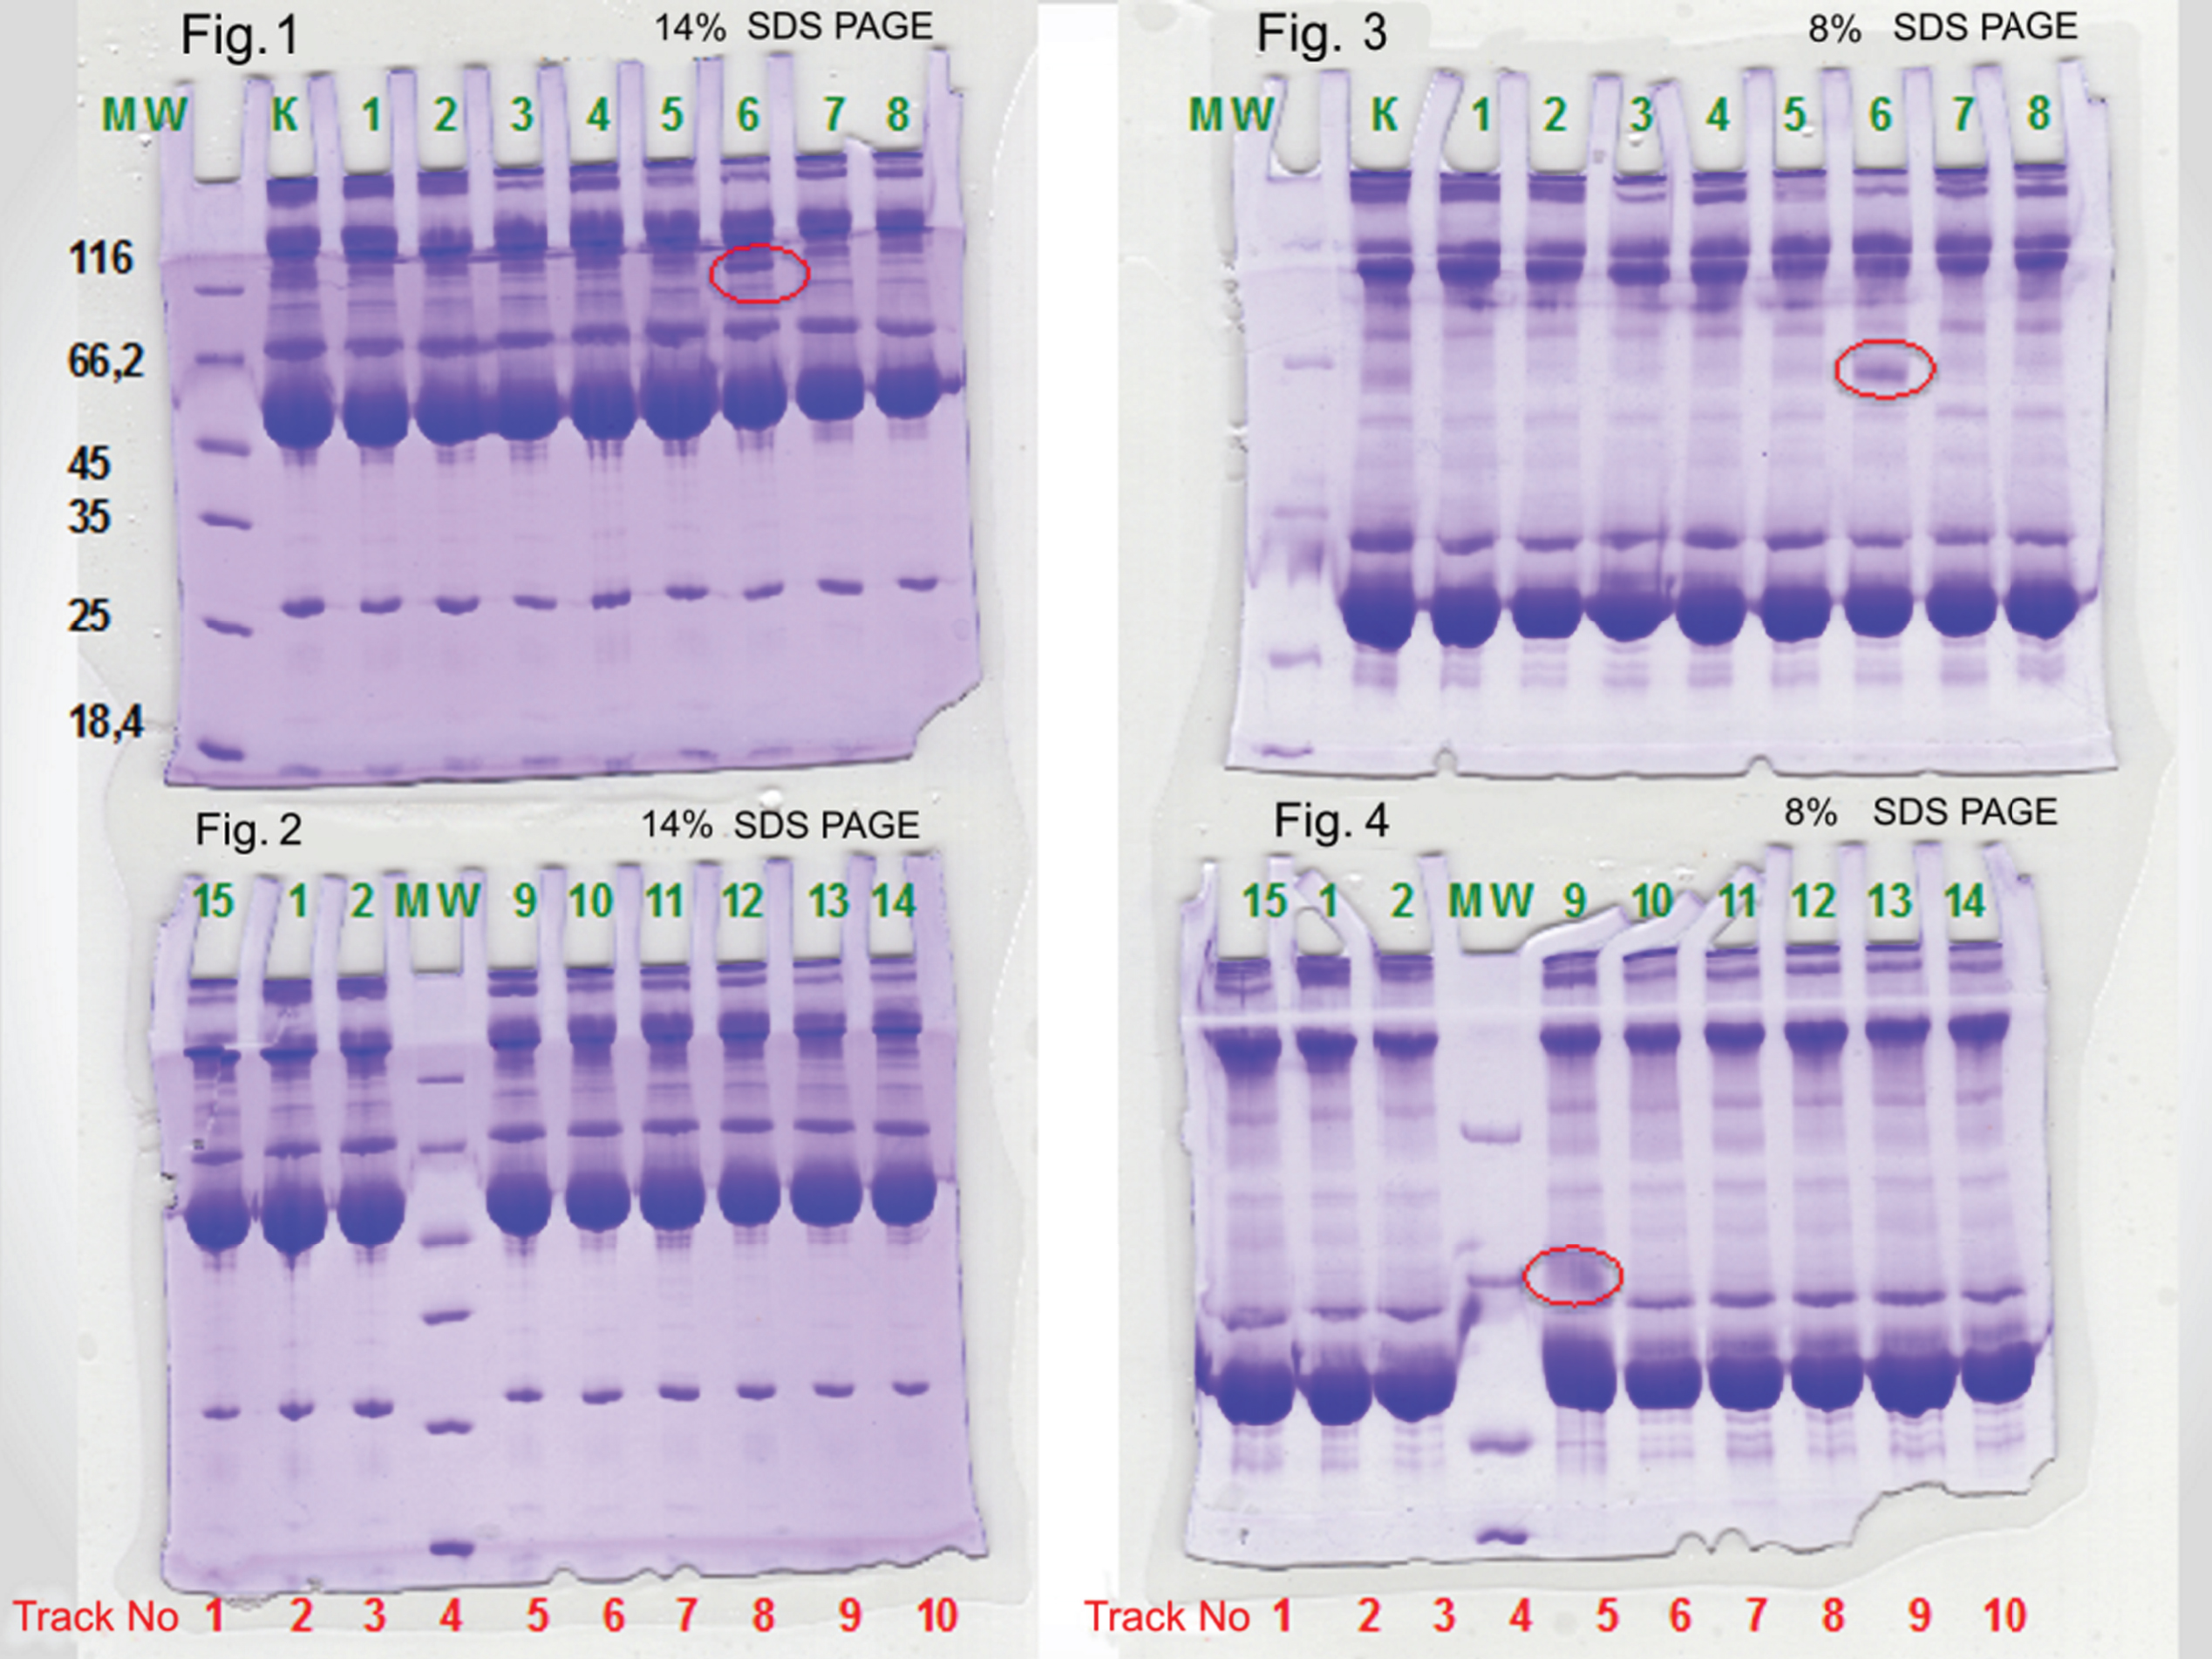
The analysis of the 1-D electrophoregrams of the blood plasma revealed that the protein spectrum includes proteins (8 to 10 of protein bands) with a molecular weight (MW) of 13 to 160 kDa. In the group of patients with complicated diabetes mellitus type II lack or greatly reduced concentration of 2 proteins with MW of 130 and 100 kDa was found.
When analyzing the gels the following features were detected. There were three protein bands visualized for three patients: one with MW 116 kDa were visualized for patient (6), and two - with 66 kDa, for patients (13) and (9). In these patients, glycated hemoglobin levels were above 7%, data of clinical examination revealed a persistent increase in blood pressure and the presence of complications such as retinopathy and nephropathy too. Uncleaved haptoglogin (HPT), also known as zonulin, plays a role in intestinal permeability, allowing intercellular tight junction disassembly, and controlling the equilibrium between tolerance and immunity to non-self antigens [10]. Haptoglobin is a potential immunological marker and biomarker of oxidative stress. It was evaluated in patients with clinically ineffective thrombolysis, autoimmune myasthenia gravis and patients with diabetes mellitus -complicated by neuropathy and angiopathy [8, 10].
Apolipoprotein A is a prognostic marker of atherosclerosis and indirect laboratory indicators to characterize vascular disease (VD) progression. Keratin, type II cytoskeletal 1 (K2C1_HUMAN) may regulate the activity of kinases such as PKC and SRC, via binding to integrin beta-1 (ITβ1) and the receptor of activated protein C kinase 1 (RACK1). In complex with C1QBP is a high affinity receptor for kininogen-1/HMWK [14].
The protein spectrum of blood plasma was studied by electrophoresis according to Laemmli (Figs. 5 and 6) and compared to the content of the main proteins by two-dimensional electrophoresis with differential staining with fluorescent dyes (Figs. 7 and 8). Mass spectral analysis of the proteomic of patients with type II diabetes mellitus was performed. The studies were conducted by a trypsin digestion of protein in polyacrylamide gel and further analysis of the peptide mass fingerprint method. The analysis revealed the following proteins: haptoglobin and its post-translational modifications.
Fig.5 and 6
1-D electrophoresis of plasma samples of 14% and 8% SDS PAGE. Figure 5 Pools of blood plasma samples 14% SDS PAGE. Figure 6 Pools of blood plasma samples 8% SDS PAGE. 1st and 2nd track – control. 3rd track - blood plasma pools of patients with type II diabetes mellitus without complications. 4th track - pools of blood plasma of patients with type II diabetes mellitus with complications (angio-, retino- and neuropathy). 5th track - pools of blood plasma of patients with type II diabetes (glycosylated hemoglobin 6.4%). 6th track - blood plasma pools of patients with type II diabetes (glycosylated hemoglobin level of 8%).
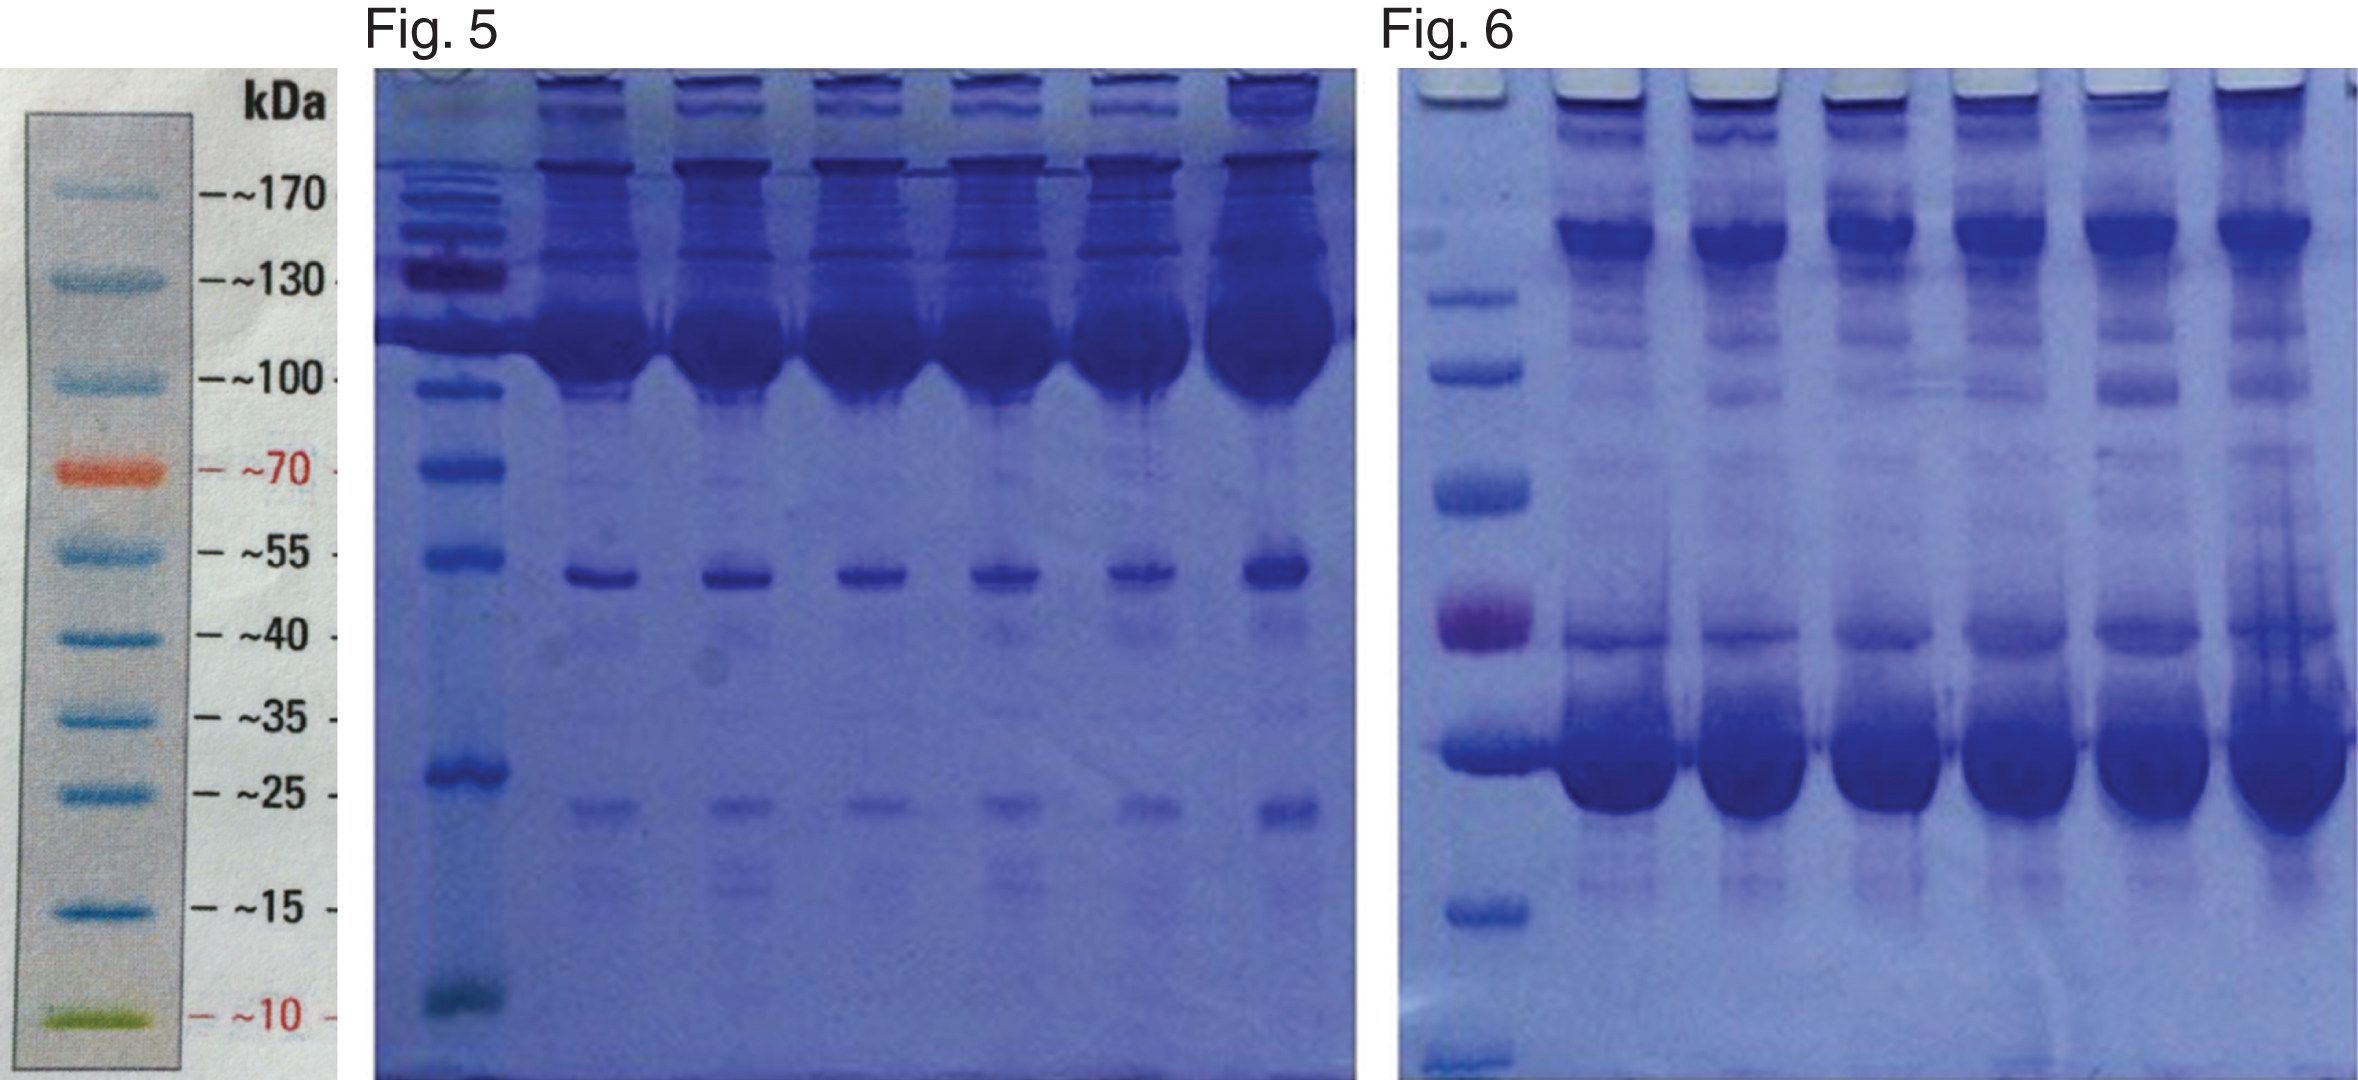
Fig.7
The scanned image of the gel, obtained by two-dimensional electrophoresis and differential fluorescent staining with Cy3 Protein Labeling Kit and Cy5 Protein Labeling Kit (Jena Bioscience). The results of the comparison of the groups I – II. (Group I: blood plasma of D2TM patients with complications. Group II: blood plasma of diabetic patients without complications.)
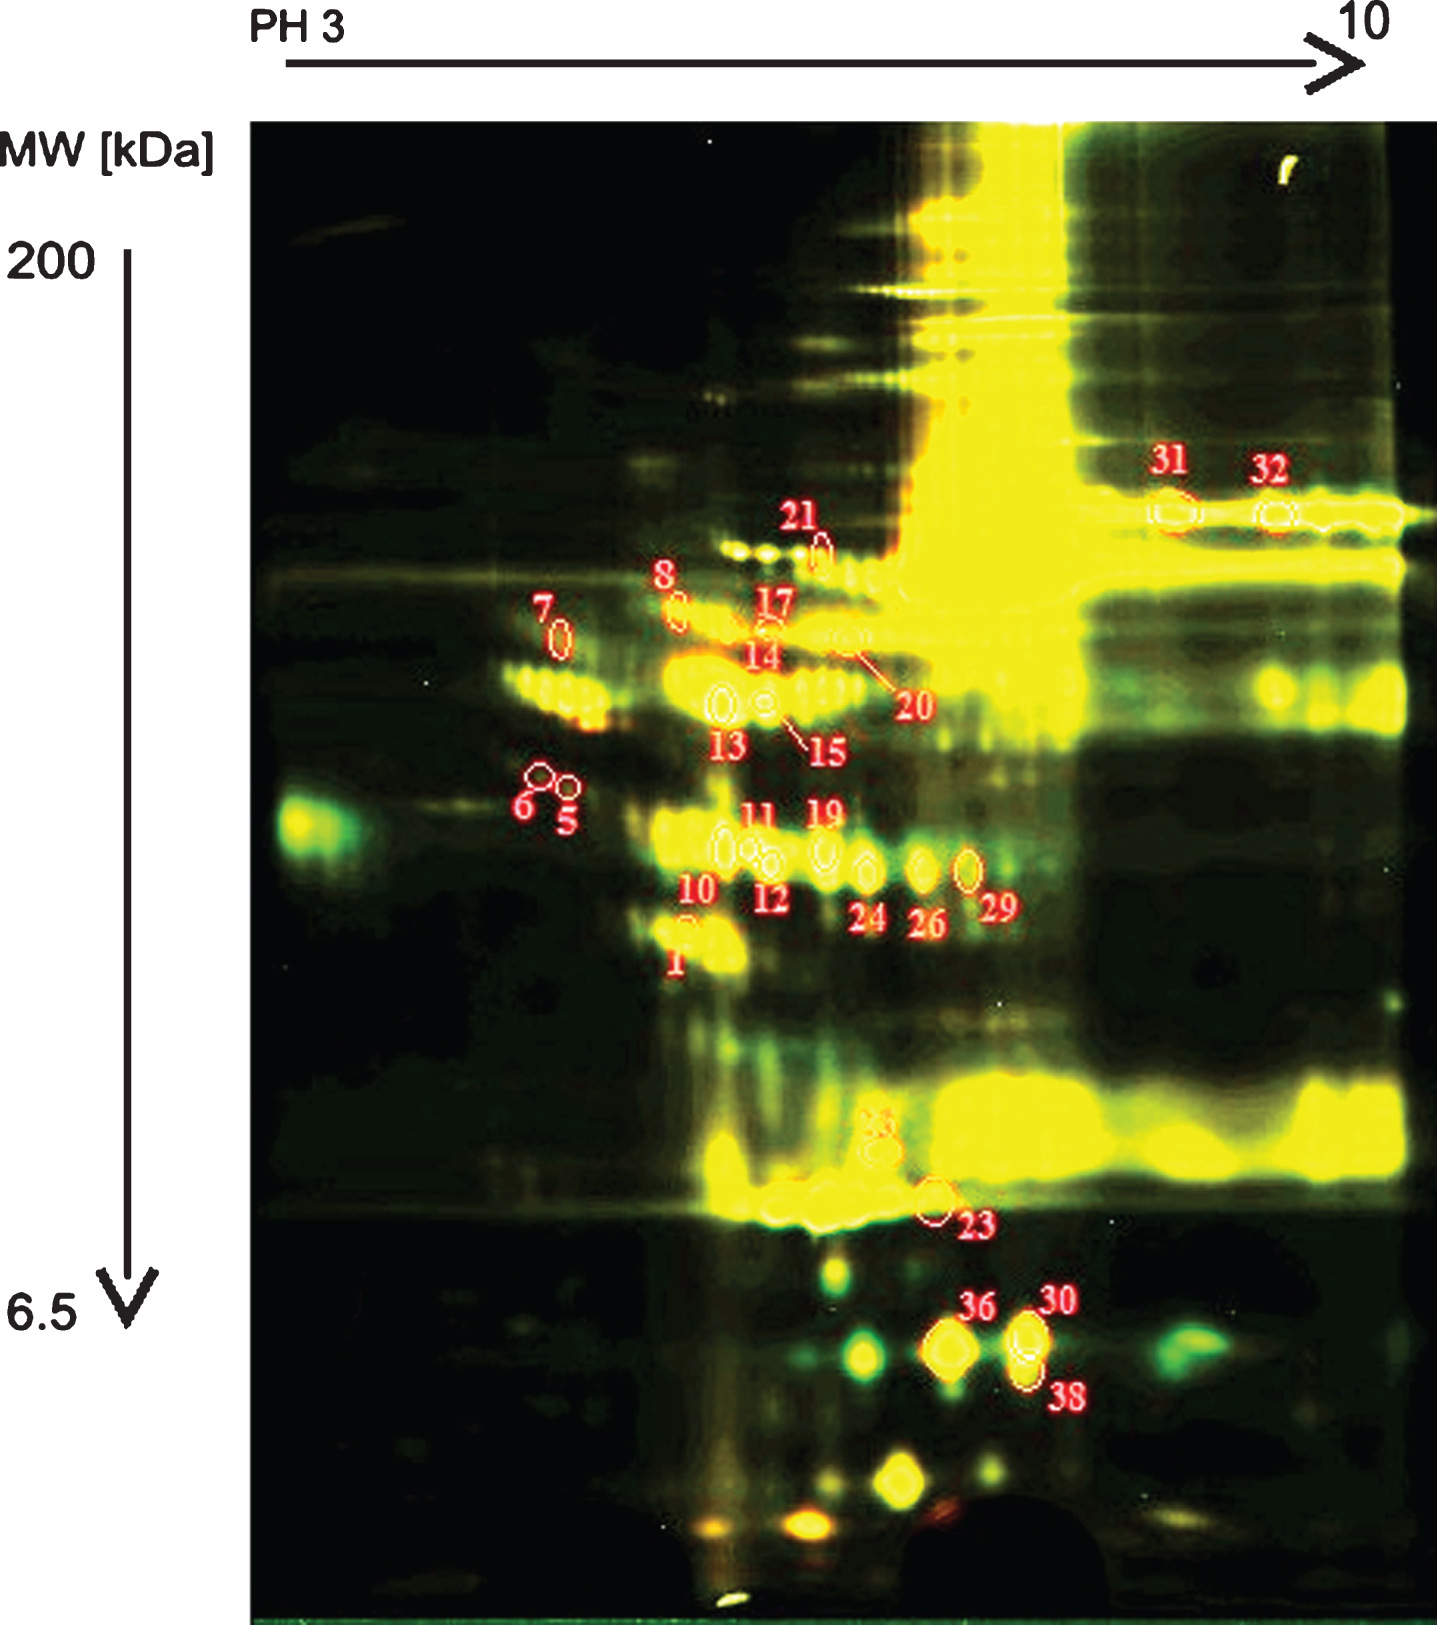
Fig.8
The scanned image of the gel, obtained by two-dimensional electrophoresis and differential fluorescent staining with Cy3 Protein Labeling Kit and Cy5 Protein Labeling Kit (Jena Bioscience). The results from the comparison of the groups I – III. [Group I: blood plasma of patients with D2TM with complications. Group III: blood plasma of clinically healthy individuals (healthy controls)].
![The scanned image of the gel, obtained by two-dimensional electrophoresis and differential fluorescent staining with Cy3 Protein Labeling Kit and Cy5 Protein Labeling Kit (Jena Bioscience). The results from the comparison of the groups I – III. [Group I: blood plasma of patients with D2TM with complications. Group III: blood plasma of clinically healthy individuals (healthy controls)].](https://ip.ios.semcs.net:443/media/jcb/2018/3-2/jcb-3-2-jcb179009/jcb-3-jcb179009-g004.jpg)
Comparison of major plasma protein for studied D2TM patients and healthy individuals, (by two-dimensional electrophoresis - with differential staining with fluorescent dyes), was done. The following groups were compared:
1 Group I: blood plasma of D2TM patients with complications.
2 Group II: blood plasma of D2TM patients without complications.
3 Group III: blood plasma of clinically healthy subjects (controls).
4 Groups were compared as follows: I - II and I - III.
The result of the comparison of the groups (I – II) are shown on Fig. 7 and presented in the Table 2.
Table 2
Quantitative ratio of proteins in the samples compared (Group I: blood plasma of D2TM patients with complications. Group II: blood plasma of diabetic patients without complications.)
| No spots | Protein | The relative abundance (diabetes with complications/diabetes without complications)* | Theoretical MW, kDa | Experimental MW, kDa |
| 1 | Clusterin OS (CLUS_HUMAN) | –2,7 | 52,5 | 40 |
| 5 | Hemoglobin subunit beta (HBB_HUMAN) | –1,64 | 16 | 48 |
| 6 | Leucine-rich alpha-2-glycoprotein (A2GL_HUMAN) | –1,59 | 38,2 | 49 |
| 7 | Alpha-1-antichymotrypsin (AACT_HUMAN) | –12,5 | 47,6 | 67 |
| 8 | Vitronectin (VTNC_HUMAN) | –1,69 | 54,3 | 70 |
| 10 | Haptoglobin (HPT_HUMAN) | –1,79 | 45,2 | 46 |
| 11 | Apolipoprotein A-IV (APOA4_HUMAN) | +1,56 | 45,4 | 46 |
| 12 | Apolipoprotein A-IV (APOA4_HUMAN) | –2,04 | 45,4 | 46 |
| 13 | Alpha-1-antitrypsin (A1AT_HUMAN) | +1,71 | 46,7 | 67 |
| 14 | Ig alpha-1 chain C region (IGHA1_HUMAN) | –2,86 | 37,6 | 68 |
| 15 | Alpha-1-antitrypsin (A1AT_HUMAN) | –1,64 | 46,7 | 67 |
| 17 | Ig alpha-1 chain C region (IGHA1_HUMAN) | +2,61 | 37,6 | 68 |
| 19 | Haptoglobin (HPT_HUMAN) | –1,89 | 45,2 | 46 |
| 20 | Ig alpha-1 chain C region (IGHA1_HUMAN) | +1,75 | 37,6 | 68 |
| 21 | Alpha-1B-glycoprotein (A1BG_HUMAN) | –1,64 | 54,2 | 69 |
| 23 | Apolipoprotein A-I (APOA1_HUMAN) | –1,56 | 30,8 | 30 |
| 24 | Haptoglobin (HPT_HUMAN) | –2,04 | 45,2 | 46 |
| 25 | Serum amyloid P-component (SAMP_HUMAN) | +1,77 | 25,4 | 31 |
| 26 | Haptoglobin (HPT_HUMAN) | –1,67 | 45,2 | 46 |
| 29 | Haptoglobin (HPT_HUMAN) | –2,08 | 45,2 | 46 |
| 30 | Haptoglobin (HPT_HUMAN) | –1,52 | 45,2 | 23 |
| 31 | Serotransferrin (TRFE_HUMAN) | +1,61 | 77 | 80 |
| 32 | Serotransferrin (TRFE_HUMAN) | +3,5 | 77 | 80 |
| 36 | Haptoglobin (HPT_HUMAN) | –1,45 | 45,2 | 23 |
| 38 | Haptoglobin (HPT_HUMAN) | only in diabetic patients with complications | 45,2 | 22 |
*The multiplicity of changes in the intensity of protein spots. The numbers with the sign “– ” indicate how many times the representation of the protein is lower in the blood plasma of patients of group II, in comparison to group I. The numbers signed with “+” indicate how many times the level of representation of proteins in the blood plasma of the patients of group II is increased, in comparison to group I.
A significant excess of the experimental values of the molecular weights of proteins identified from the theoretical values allows to the presence of voluminous post-translational modifications (more likely glycosylation) in these proteins [9]. The reverse situation is explained by the presence of the degradation products of identified proteins in the sample of blood serum.
The results of the comparison of the groups I - III are shown on Fig. 8 and in Table 3. There were 227 spots observed on average on the gel. Concentration of proteins, corresponding to 12 spots (red fluorescence) was increased and concentration of proteins, corresponding to 20 spots (green fluorescence) was decreased in blood of healthy subjects (controls) of group III - in comparison to D2TM patients with complications, of group I (Fig. 8).
Table 3
Quantitative ratio of proteins in the samples compared [Group I: blood plasma of patients with D2TM with complications. Group III: blood plasma of clinically healthy individuals (healthy controls)]
| No spots | Protein | The relative abundance (diabetes complications/healthy subjects)** | Theoretical MW, kDa | Experimental MW, kDa |
| 1 | Haptoglobin SV = 1 (HPT_HUMAN) | +1,63 | 45,2 | 49 |
| 2 | Haptoglobin (HPT_HUMAN) | +1,97 | 45,2 | 49 |
| 3 | Complement C3 (CO3_HUMAN) | –7,14 | 187 | 46 |
| 5 | Proteasome subunit alpha type-7 (PSA7_HUMAN) | +1,63 | 27,9 | 66 |
| 7 | Vitronectin (VTNC_HUMAN) | –2,38 | 54,3 | 70 |
| 10 | Haptoglobin (HPT_HUMAN) | –1,82 | 45,2 | 46 |
| 11 | Alpha-1-antitrypsin (A1AT_HUMAN) | +1,88 | 46,7 | 67 |
| 12 | Alpha-1-antitrypsin (A1AT_HUMAN) | +1,67 | 46,7 | 67 |
| 13 | Ig alpha-1 chain C region (IGHA1_HUMAN) | –2,7 | 37,6 | 68 |
| 14 | Ig alpha-2 chain C region (IGHA2_HUMAN) | +2,88 | 36,5 | 68 |
| 16 | Keratin, type II cytoskeletal 1 (K2C1_HUMAN) | –1,54 | 66 | 28 |
| 17 | Apolipoprotein A-IV (APOA4_HUMAN) | –1,52 | 45,4 | 46 |
| 18 | Haptoglobin (HPT_HUMAN) | –1,96 | 45,2 | 46 |
| 19 | Hemopexin (HEMO_HUMAN) | –2,56 | 51,6 | 68 |
| 20 | Alpha-1B-glycoprotein (A1BG_HUMAN) | –1,52 | 54,2 | 69 |
| 21 | Apolipoprotein A-I (APOA1_HUMAN) | –1,69 | 30,8 | 30 |
| 22 | Serum amyloid P-component (SAMP_HUMAN) | –1,75 | 25,4 | 31 |
| 23 | Haptoglobin (HPT_HUMAN) | –3,13 | 45,2 | 46 |
| 24 | Ig alpha-1 chain C region (IGHA1_HUMAN) | +1,95 | 37,6 | 68 |
| 25 | Hemopexin (HEMO_HUMAN) | –3,57 | 51,6 | 68 |
| 26 | Apolipoprotein A-I (APOA1_HUMAN) | –1,54 | 30,8 | 30 |
| 27 | Haptoglobin (HPT_HUMAN) | +4,01 | 45,2 | 15 |
| 28 | Serum amyloid P-component (SAMP_HUMAN) | –4 | 25,4 | 30 |
| 29 | Haptoglobin (HPT_HUMAN) | –3,13 | 45,2 | 46 |
| 35 | Serotransferrin (TRFE_HUMAN) | +2,13 | 77 | 80 |
| 36 | Serotransferrin (TRFE_HUMAN) | –3,57 | 77 | 31 |
| 39 | Serotransferrin (TRFE_HUMAN) | +2,76 | 77 | 80 |
| 40 | Serotransferrin (TRFE_HUMAN) | +1,59 | 77 | 80 |
| 42 | Ig kappa chain V-III region SIE (KV302_HUMAN) | +2,24 | 11,8 | 30 |
| 43 | Haptoglobin (HPT_HUMAN) | only in diabetes with complications | 45,2 | 23 |
| 44 | Haptoglobin (HPT_HUMAN) | only in diabetes with complications | 45,2 | 23 |
| 45 | Keratin, type II cytoskeletal 1 (K2C1_HUMAN) | only in diabetes with complications | 66 | 23 |
**The multiplicity of changes in the intensity of protein spots. The numbers with the sign “– ” indicates how many times the representation of the protein is lower in the blood plasma of healthy subjects (controls) of group III in comparison to D2TM patients with complications of group I. The numbers with the sign “+” indicates how many times the level of representation of proteins in the blood plasma of the D2TM patients with complications in group III is increased in comparison to D2TM patients with complications of group I.
The result of the comparison of the groups I – II, shown in Table 2 and on Fig. 7, revealed that there were 138 spots observed on average on the gel. The concentration of proteins, corresponding to 7 spots (red fluorescence) was increased and concentration of proteins, corresponding to 18 spots (green fluorescence) was decreased in blood of D2TM patients without complications (group II), in comparison to D2TM patients with complications(group I).
The gel contains 150μg of blood plasma proteins of the compared group I (sample labeled with Cy 3) and 150μg blood plasma proteins of group II (sample labeled with Cy 5). These numbers refer to the protein spots with the differences in the concentration of more than 1.5 times. The yellow fluorescence of the spots means that the corresponding proteins are present in both samples; the green fluorescence spots indicates that the concentration of the corresponding proteins are higher in group I, as compared to the group II; the red fluorescence corresponds to the higher protein concentration in group II, than in group I (Fig. 7).
The results from comparison of groups I – III are shown on Fig. 8. On the average 227 spots were observed on the gel. The concentration of protein spots with red fluorescence increased to 12 and to 20 with green fluorescence - decreased in Group III patients’ blood plasma in relation to the group I.
The gel contains 150μg of blood plasma proteins of group I (sample labeled with Cy 3) and 150 g blood plasma proteins of group III (sample labeled with Cy 5). These numbers refer to the protein spots with the differences in the concentration of more than 1.5 times. The yellow fluorescence of the spots means that the corresponding proteins are present in both samples; the green fluorescence spots indicates that the concentration of the corresponding proteins are higher in group I, compared to the group III; the red fluorescence corresponds to proteins with a higher concentration in group III, than it in group I (Fig. 8).
Potential protein markers in blood plasma in patients with type II diabetes - complicated by neuropathy and angiopathy, were determined. Post-translational modifications of different proteins (mainly glycosylation) were identified, that allows those parameters to be used to assess glucose metabolism disorders - in addition to the values of glycosylated hemoglobin.
Studies on the role of these proteins in the pathogenesis of type II diabetes mellitus and as targets for development of new therapeutic methods, have started.
The technique of two-dimensional electrophoresis was improved. A modification of the method allowed to identify a number of post-translational modifications of proteins in blood plasma of diabetic patients. A significant excess of the experimental values of the molecular weights of the identified proteins from the theoretical values was established, which could indicate the presence of bulk post translational modifications in these proteins. Identified differences in the protein spectrum provided the opportunity to reveal additional potential targets for predicting and successful treatment of complications in diabetes mellitus patients in the early stages of the disease.
Our experimental data as well as and other recent data in the scientific literature [15–20] could stimulate development of new high sensitive diagnostic/prognostic proteomic biomarkers – included in the test systems and algorithms for early prediction, prognosis and treatment of T2DM and its main complications as retinopathy, nephropathy, neuropathy, angiopathy, etc. Using proteomic biotechnology for assessment of levels high sensitive proteomic biomarkers in the blood plasma of diabetic patients [16] as well as experimental animal models of disease [17], the metabolic pathway, called proteomic, could be elucidated in T2DM [18]. Thus, specific proteomic biomarkers/indicators could support not only diagnosis of diabetes, but also differential diagnosis of T2DM complications [18–20]. In this sense, further utilizing of T2DM proteomic biomarkers in clinical practice could help for successful diagnosis, treatment and stratification of diabetic patients.
4Conclusion
The identified proteomic biomarkers in blood plasma are predictors of late complications of diabetes mellitus type 2 - important in the pathogenesis of the disease and as drug targets for carrying out prophilaxis of complications in the early stages of the disease. There were revealed 70 proteins in the blood plasma of patients with type II diabetes mellitus - in the presence of complications. Those proteins are proposed to be used in clinical laboratory diagnostics as markers for predicting the appearance of complications and for the development of drug prevention algorithms. The presence of additional glycosylated proteins is planned to be compared to the level of glycosylated hemoglobin. By this method the prognosis of the appearance of late clinical complications and dysmetabolic disturbances/as development of micro- and macroangiopathy/in diabetic patients could be easily performed.
Further proteomic studies of blood plasma will have also clinical diagnostic significance in patients with type 2 diabetes mellitus.
Acknowledgments
The study was sponsored by Project “Science and Business” BG 051P0001/3.3-05-0001 Bulgaria, the project “Basic science - Medicine” of 2013–2014. The paper was done also within the project ДФНП-17-125/31.07.2017 “Rheological and electrical properties in vascular diseases. Evaluation of skin perfusion in patients with diabetes mellitus type 2”.
The authors thank Prof. E. Zvetkova, MD, PhD from the Bulgarian Society of Biorheology - Bulgarian Academy of Sciences, Prof. I. Velcheva, MD, PhD from the Medical University in Sofia and Prof. M. Rampling, for the helpful discussions and paper reviewing.
References
[1] | Ахметов, А.С., (2003) . Сахарный диабет 2-го типа. Основы патогенеза и терапии. Москва. Ahmetov, A.S., Saharnyj diabet 2 tipa. Osnovy patogeneza i terapii. Moskva. (in Russian) |
[2] | Ахметов, А.С., Строков, И.А., (2001) . Диабетическая полинейропатия: настоящее и будущее. Рос. Мед. Вести. Ahmetov A.S., Strokov I.A., Diabeticheskaya polynejropatia: nastoyashchee I budushchee. Ros. Med. Vesti (2001) ; 1: 35-40. (in Russian) |
[3] | Кудинов, Ю.Г., Патологические последствия накопления конечных продуктов неферментативного гликозирования при старении. Проблемы старения и долголетия. Kudinov, Yu. G., Patologicheskie posledstvia nakoplenia konechnyh produktov nefermentativnogo glikolizirovania pri starenii. Probl. Starenia I dolgoletia (1994) ; 4: 434-451. (in Russian) |
[4] | Shevchenko A , Tomas H , Havlis J , Olsen JV , Mann M . In-gel digestion for mass spectrometric characterization of proteins and proteomes. Nat Protoc. (2006) ;1: :2856–60. |
[5] | Velcheva I , Damianov P , Antonova N , Stoyneva Z . Hemorheology and vascular reactivity in patients with diabetes mellitus type 2. Clin Hemorheology and Microcirc. (2011) ;49: :505–11. |
[6] | Velcheva I , Damianov P , Mantarova S , Antonova N . Hemorheology and heart rate variability in patients with diabetes mellitus type 2. Clin Hemorheology and Microcirc. (2011) ;49: :513–8. |
[7] | Le Dévéhat C , Khodabandehlou T , Zhao H , Vimeux M . Role and limits of glycemic regulation in the pathogenesis of diabetic microangiopathy. Clinical Hemorheology and Microcirculation. (1997) ;17: :363–70. |
[8] | Ionova VG , Lantsova VB , Maximova MYa , Tkatch EN , Ziganshin RH . Proteomic studies of blood plasma of patients with the ischemic stroke in its most acute period. Series on Biomechanics. (2012) ;27: (1-2):59–63. |
[9] | Zhang Q , Monroe ME , Schepmoes AA , Clauss TR , Gritsenko MA , Meng D , Petyuk VA , Smith RD , Metz TO . Comprehensive identification of glycated peptides and their glycation motifs in plasma and erythrocytes of control and diabetic subjects. J Proteome Res. (2011) ;10: :3076–88. |
[10] | Fasano A . Zonulin and its regulation of intestinal barrier function: The biological door to inflammation, autoimmunity, and cancer. Physiol Rev. (2011) ;91: (1):151–75. |
[11] | |
[12] | Facchini FS , Hua NW , Reaven GM , Stoohs RA . Hyperinsulinemia: The missing link among oxidative stress and age-related diseases? Free Radic Biol Med. (2000) ;29: (12):1302–6. |
[13] | O’Farrell PH . High resolution two-dimensional electrophoresis of proteins. J Biol Chem. (1975) ;250: (10):4007–21. |
[14] | Pixley RA , Espinola RG , Ghebrehiwet B , Joseph K , Kao A , Bdeir K , Cines DB , Colman RW . Interaction of high-molecular-weight kininogen with endothelial cell binding proteins suPAR, gC1qR and cytokeratin 1 determined by surface plasmon resonance (BiaCore). Thromb Haemost. (2011) ;105: (6):1053–9. |
[15] | Sundsten T , Zethelius B , Berne G , Bergsten P . Plasma proteome changes in subjects with type 2 diabetes mellitus a low or high early insulin response. Clin Sci (Lond). (2008) ;114: (7):499–509 250(10). |
[16] | Riaz S . Study of protein biomarkers of diabetes mellitus 2 and therapy with vitamin B1. J Diabetes Res. (2015) ;2015Article ID 150176, 10 pages. DOI:10.1155/2015/150176 |
[17] | Hidayati D , Abdulgani N , Setiyavan H , Trisnawati I , Maulidina Ashuri N , Sa’adah NN . Analysis of protein profiles in diabetic rat blood plasma that induced by alloxan. Proc of Int Biology Conf. (2016) :020016-1-020016-6, doi:10.1063/1.4985407 |
[18] | Yeh SH , Chang WCh , Chuang H , Huang HCh , Liu TsR , Yang KD . Differentiation of type 2 diabetes mellitus with different complications by proteomic analysis of plasma low abundance proteins, 2016 J Diabetes Metabolic Disorders. (2016) ;29: (7):928–36. |
[19] | Gopalakrishnan V , Purushothaman P , Bhaskar A . Proteomic analysis of plasma proteins in diabetic retinopathy patients by two dimensional electrophoresis and MALDI-Tof-MS. J Diabetic Complications. (2015) ;29: (7):928–36. |
[20] | Hung PH , Ch Lu Y , Chen YW , Chow HCh , Lyu PCh , Lee YR , Chan HL . Proteomic identification of plasma biomarkers in type 2 diabetic nephropathy. J Integrated OMICS. (2011) ;1: (1):151–6. |

