Structural reorganization of the cytoskeleton contributes to the induction of pro-fibrotic connective tissue growth factor in tubular epithelial cells
Abstract
BACKGROUND: Tissue injuries and pathological changes are often associated with changes in cell adhesion and reorganization of cytoskeletal structures. This is of particular relevance for renal epithelial cells, which form a highly regulated barrier along the nephron. Here, we investigated the effect of the calcium chelator EGTA on morphological alterations and changes in pro-fibrotic gene expression in proximal renal tubular epithelial cells.
METHODS: Epithelial cells were exposed to EGTA alone or in combination with TGFβ-1, followed by the analysis ofN-cadherin and paxillin localization and cytoskeletal rearrangement. The expression of connective tissue growth factor (CTGF), a pro-fibrotic protein regulated by alterations of cell morphology, was investigated.
RESULTS: Even low concentrations of EGTA, which did not lead to the loss of cell-cell interactions or cell detachment, were sufficient to reduce N-cadherin binding, to rearrange focal adhesion, to induce CTGF expression, and to strongly enhance TGFβ-1-mediated signaling. These data indicate a substantial crosstalk between the changes in cell cytoskeletal structures at the cell-cell adhesions and the signaling of soluble mediators.
CONCLUSIONS: By linking cell-cell and cell-matrix interactions with the regulation of pro-fibrotic signaling, our studies provide deeper insights into the physiological mechanisms underlying the natural regeneration and repair processes in the kidney.
1Introduction
Tissue architecture and function largely depends on the appropriate cell-cell and cell-matrix interactions. Cadherins are major cell-cell contact proteins that assemble epithelial cells together in a form of layer and maintain the intercellular permeation barrier. Integrins, on the other hand, attach the epithelial cells basally to the basement membrane, supporting tissue integrity [1, 2]. Both cell-cell and cell-matrix adhesion complexes are linked to the cytoskeleton and participate in the transfer of mechanical and biochemical signals between the cells and their environment. The majority of cell types are highly sensitive not only to biochemical, but also to mechanical stimuli, including tensile, shear and pressure forces [3]. Transduction of physical stimuli into biochemical signals has been extensively investigated e.g. in endothelial cells, but less is known about epithelial cell responses to altered tissue stiffness or to the changes in cytoskeleton-membrane interface at the cell adhesions.
Tubular epithelial cells, in particular proximal tubular epithelial cells, respond to injury by dedifferentiation and proliferation [4]. This implicates loosening of cell-cell contacts and reorganization of the actin cytoskeleton. These structural alterations are linked to changes in gene expression affecting multiple proteins involved in diverse cellular activities [2]. In general, renal epithelial cells adopt a more mesenchymal phenotype which allows them to participate not only in cellular response to injury, but also in regeneration of tubular structures.
Among the molecules involved in cell-cell interactions, cadherins are unique in as much as their binding depends on extracellular calcium [5]. In epithelial cells, E-cadherin is the major form of cadherin and its functional role has been investigated in normal and transformed epithelia [6]. The proximal tubule of the kidney is lined by epithelial cells which, instead of E-cadherin, expressN-cadherin as major cell-cell adhesion molecule [7, 8]. Reactivity of those cells to calcium chelation, and its effects on cell-cell contacts, has been poorly studied. To interfere with cadherin interactions in vitro, EGTA (ethylene glycol tetraacetic acid), a calcium chelating agent, is used. In vivo, other divalent chelators such as oxalate ions may be expected to weaken the interactions between thecells.
In the present study, we used the human proximal tubular cell line HKC-8 as a model system to study EGTA-mediated N-cadherin-dependent signaling pathways. Furthermore, we isolated primary tubular cells from healthy parts of human tumor nephrectomies and generated fractions enriched in proximal tubular cells. As a functionally relevant protein regulated by alterations of cell morphology [9–12], we investigated the expression of the pro-fibrotic connective tissue growth factor (CTGF, also named CCN2) [9, 13, 14]. We show that even low concentrations of EGTA, which did not lead to the loss of cell-cell interactions or cell detachment, were sufficient to reduce N-cadherin binding, to induce CTGF expression and to enhance TGFβ-1-mediated signaling. These data are in line with a crosstalk between changes in cell structure and the signaling of soluble mediators.
2Materials and methods
2.1Materials
DMEM/Ham’s F12 medium was purchased from Biochrom AG (Berlin, Germany), DMEM medium and Hank’s BSS from Sigma, insulin-transferrin-selenium supplement from Gibco, fetal calf serum (FCS) from PAN Biotech (Aidenbach, Germany), triiodothyronine and hydrocortisone from Sigma-Aldrich, epidermal growth factor from PeproTech, H1152 ((S)-(+)-2-methyl-1-[(4-methyl-5-isoquinolinyl) sulfonyl]-homopiperazine) from Enzo Life Sciences, and U0126 (1,4-diamino-2,3-dicyano-1,4-bis(o-aminophenylmercapto)butadiene monoethanolate) from Calbiochem; TGFβ-1 from tebu-bio (Offenbach, Germany),
2.2Cell culture
HKC-8 cells were kindly provided by L. Racusen (Baltimore, MD, USA) [15]. Cells were recloned by limited dilution and cultured as described previously [16, 17]. Human primary tubular epithelial cells were isolated from renal cortical tissues collected from healthy parts of tumor nephrectomies essentially as described previously [8]. Isolation of human cells from healthy parts of tumor nephrectomies was approved by the local ethics committee at the Medical Faculty of the University of Erlangen-Nuremberg (Review number 3755). Written informed consent was obtained from all participants involved in this study.
2.3Western blot analysis
Cells were lyzed in buffer containing 50 mM HEPES pH 7.4, 150 mM NaCl, 1% Triton X-100, 1 mM ethylenediaminetetraacetic acid (EDTA), 10% glycerol, 2 mM sodium vanadate and protease inhibitors Complete EDTA-free (Roche Diagnostics, Mannheim, Germany) or in phosphate-buffered saline containing 5% sodium dodecyl sulphate (SDS) plus inhibitors to detect phosphorylated proteins. Equal volumes of cell culture supernatants were precipitated with ethanol to detect secreted CTGF. Western blot analyses were performed essentially as described before [16] using the following antibodies: Goat anti-CTGF (SC-14939), mouse anti-vinculin (SC-5573), and HRP-conjugated donkey anti-goat IgG (SC-2020) from Santa Cruz; rabbit anti-phospho-ERK (#9106), mouse anti-ERK (#9107) and rabbit anti-phospho-MYPT (Thr853) (#4563) from Cell Signaling. HRP-conjugated secondary antibodies (sheep anti-mouse IgG (NA931V) and donkey anti-rabbit IgG (NA934V)) were from GE Healthcare Life Sciences. To ensure equal loading and blotting, blots were redetected with an antibody directed against the respective non phosphorylated protein or vinculin. The immunoreactive bands were quantified using the luminescent image analyzer (LAS-1000 Image Analyzer, Fujifilm, Berlin, Germany) and AIDA 4.15 image analyzer software (Raytest, Berlin, Germany). To summarize data obtained from different cell cultures, relative band intensities were normalized as indicated in the legends.
2.4Immunocytochemistry
Cells were fixed with paraformaldehyde (3.5% in PBS) for 10 min and permeabilized with 0.5% Triton X-100 in PBS for 10 min. After washing three times with PBS, cells were blocked in 1% BSA in PBS for 1 h at room temperature, followed by the incubation rabbit anti-N-cadherin (Santa Cruz) and mouse anti-paxillin (BD Transduction Laboratories). Secondary antibodies (1:500, PromoFluor Fluor® anti-mouse or anti-rabbit) were from Promokine (Heidelberg, Germany). After mounting, slides were viewed using a Nikon Eclipse 80i fluorescent microscope and digital images recorded by Visitron Systems 7.4 Slider camera (Diagnostic Instruments, Puchheim, Germany) using the Spot Advanced software (Diagnostic Instruments).
2.5siRNA transfection
siRNA transfections were performed essentially as described previously [18]. To downregulate N-cadherin, epithelial cells were transfected 3 h after seeding using HiPerFect (QIAGEN) according to the manufacturer’s instructions. Two different siRNAs were used at 20 or 50 nM concentrations. siRNA directed against GFP was used as control.
2.6Statistical analysis
To compare multiple conditions, statistical significance was calculated by one-way ANOVA with appropriate post hoc tests, or one-sample t-test using GraphPad software. A value of p < 0.05 was considered statistically significant.
3Results
3.1Proximal tubular cell morphology is linked to gene expression of CTGF
To obtain structurally distinct cell populations, HKC-8 cells were seeded as subconfluent (s.c.) cells (10.000/cm2) or dense cells (35.000/cm2) and allowed to adhere and proliferate. After 24 h subconfluent culture, cells formed confluent islands which, however, differed considerably in morphology from dense cells: Subconfluent cells covered a larger area and showed extensions indicative of a more motile phenotype (Fig. 1A). CTGF mRNA expression increased gradually over time in subconfluent cells, potentially reflecting alterations of cell structure in motile cells (Fig. 1B). Upon stimulation with TGFβ-1 (2 ng/ml) for 6 or 24 h, CTGF mRNA expression was further increased. Expression of CTGF mRNA in dense cells was more stable: It was increased during the first hours of stimulation with TGFβ-1, but was not further increased thereafter.
CTGF is released from epithelial cells and primarily detectable in the cell culture supernatants. To analyze the amount of secreted protein, CTGF was precipitated from aliquots of the cell culture supernatants and its levels were related to the number of seeded cells. Using this approach, it is not possible to determine exactly how much CTGF is secreted per cell and quantification must be treated cautiously. However, given the strong differences between subconfluent and dense cells in the n = 3 independent experiments quantified by this method, the data are considered to be reliable. The secretion of CTGF from dense cells was significantly reduced compared to subconfluent cells (Fig. 1C, dense vs. s.c). While TGFβ-1 strongly stimulated CTGF release from subconfluent cells, no significant stimulatory effect was observed in dense cells (Fig. 1C, T, TGF-β). However, when dense cells were treated with lysophosphatidic acid (L, LPA) as control stimulus [19], the secretion of CTGF was strongly induced. After treatment with LPA for 4 h (Fig. 1C, right panel), CTGF recovered from the cell culture supernatant was comparable in subconfluent and dense cells. These data indicated that signaling of the pro-fibrotic factor TGFβ-1 was modulated by the morphological state of the cells, whereas LPA signaling was not affected.
3.2EGTA profoundly alters cell structures without leading to cell separation
In vivo, the damaged tubuli often partially maintain their cell-cell interactions. Therefore, we analyzed the structure of confluent HKC-8 cells upon treatment with EGTA which reduces cadherin bonds between cells by complexing calcium ions. Treatment of confluent (dense) cells with EGTA (1 mM) for 1–2 h almost completely dislocated N-cadherin from the cell-cell boundaries (Fig. 2). This process was accompanied by a rearrangement of focal adhesions visualized by staining of paxillin. Paxillin was randomly distributed in control cells and became organized along the cell boundaries upon treatment with EGTA. Treatment with EGTA thus led to profound morphological alterations, but the cells did not lose cell-cell contacts, which were preserved by other, less calcium-sensitive, junctional proteins e.g. tight junction proteins.
3.3EGTA-induced CTGF expression is related to ERK activation and alterations of the cytoskeleton
Incubation of dense HKC-8 cells with EGTA led to a slow release of CTGF which became detectable in the cell culture supernatants after 4–6 h (Fig. 3A). Induction of CTGF by EGTA was dependent on signaling pathways which have earlier been described to regulate CTGF expression in epithelial cells, e.g. ERK and RhoA [19–22]. Inhibition of ERK1/2 by U0126 (0.5μM) abrogated CTGF induction. Incubation of the cells with EGTA led to a slow increase in ERK activity determined by an increase in phosphoERK 1/2 (Fig. 3B). This, however, was not a direct consequence of cadherin disruption, which took place within 1 h, but rather had to be attributed to more slowly occurring signaling processes. Interestingly, an increase in ERK 1/2 activity was also observed in subconfluent cells compared to dense cells (Fig. 3C), suggesting that ERK activity contributed to the differences in CTGF expression in dense and subconfluent cells. In line with this interpretation, we observed reduced CTGF secretion from cells treated with U0126 even in the absence of any stimulation (Fig. 3A). Data did not reach statistical significance most likely due to the low levels of secreted CTGF which were close to the detection limit.
CTGF expression is regulated via RhoA/Rho kinase signaling [19, 20, 23–25]. This pathway also played a role in the EGTA-mediated induction of CTGF which was sensitive to treatment with the inhibitor of Rho kinases, H1152 (Fig. 3A, 0.75μM). However, the morphological alterations observed upon treatment with EGTA (Fig. 2) were not accompanied by an activation of Rho kinase as determined by phosphorylation of MYPT, a downstream target of Rho kinase (Fig. 3D). In line with this observation, MYPT phosphorylation was comparable in dense and subconfluent cells (Fig. 3E). Thus, in EGTA-induced CTGF upregulation, Rho kinases are likely necessary to route signals, which are generated further upstream in the signaling cascade.
3.4Synergistic induction of CTGF by EGTA and TGFβ-1
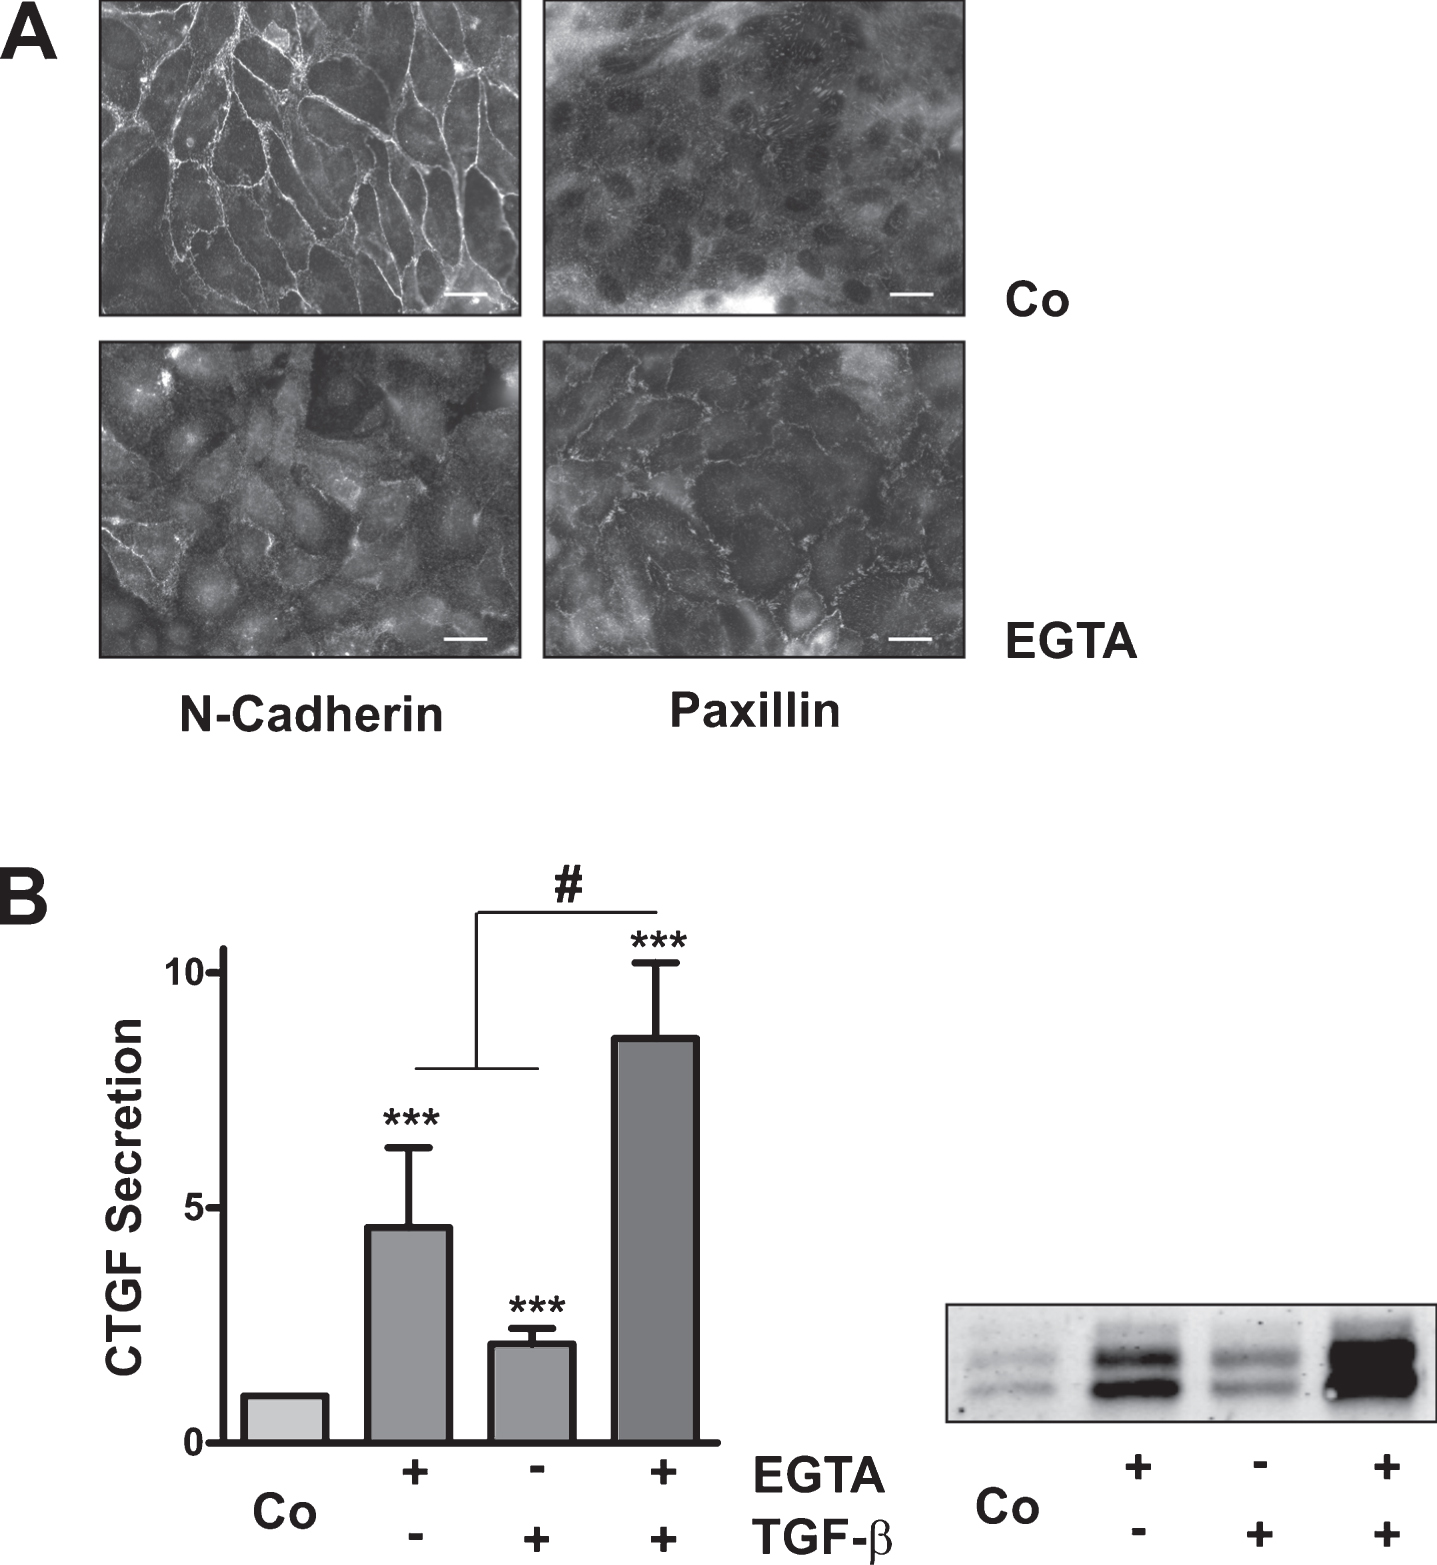
Given the higher reactivity of subconfluent cells upon TGFβ-1 stimulation, we analyzed whether EGTA might modulate TGFβ-1-mediated CTGF expression. HKC-8 cells were incubated for 30 min with EGTA to allow dislocation of N-cadherin, and were then stimulated with TGFβ-1 for 6 h. While both stimuli induced CTGF, the combination of EGTA und TGFβ-1 produced a more than additive effect; combined stimulation was significantly more pronounced than addition of individual stimulation rates (p < 0.05, n = 4 individual experiments).
As N-cadherin is the major calcium-dependent adhesion molecule in HKC-8 cells, we next investigated whether downregulation of N-cadherin might be sufficient to mimic the effects of EGTA. Using two different siRNAs, a reduction of N-cadherin protein expression of about 65% was achieved after 48 h (66±10%, mean±SD, n = 9), as determined by Western blotting. This was also obvious by immunocytochemistry when images were taken keeping the same conditions (Fig. 4B). As observed with EGTA, there was a rearrangement of focal adhesions, concentrating at cell-cell boundaries (Fig. 4B, examples being highlighted by arrows). Downregulation of N-cadherin increased CTGF secretion (Fig. 4C), most likely as a consequence of cellular restructuring. TGFβ-1 was active in siN-Cad-transfected cells, and there was a tendency to stronger CTGF release. However, given the higher baseline levels there was no synergistic effect between siN-Cad and TGFβ-1 in terms of CTGF expression, as observed in the case of incubation with EGTA.
3.5Synergistic induction of CTGF by EGTA and TGFβ-1 in primary tubular epithelial cells
The cell line HKC-8 is derived from human proximal tubular cells. To confirm the results obtained with immortalized cells, we analyzed whether the interaction between TGFβ-1 and EGTA also applied to primary human tubular cells. For this purpose, tubular cells derived from healthy parts of tumor nephrectomies were used to obtain tubular cell populations enriched in proximal tubular cells, identified by the presence of N-cadherin. Upon treatment with EGTA, the expression of N-cadherin was downregulated in primary proximal tubular cells (Fig. 5A), and was accompanied by the rearrangementof paxillin. Accordingly, in Western blots performed with preparations of tubular cells enriched in proximal cells, both TGFβ-1 and EGTA increased the secretion of CTGF. Moreover, preincubation for 30 min with EGTA synergistically enhanced the TGFβ-1-mediated CTGF induction (Fig. 5B). TGFβ-1-dependent stimulation of CTGF expression in EGTA-pretreated cells was not only stronger than in control cells, but was also significantly more pronounced than the addition of individual stimulation rates (paired t-test, p < 0.05, n = 5 individual experiments). Structural alterations of cells thus strongly amplify the TGFβ-1-mediated induction of the pro-fibrotic growth factor CTGF.
4Discussion
Predicting the cell response to biomechanical stimuli is one of the fundamental aspects of tissue (patho)physiology and bioengineering. It is evident that these cellular reactions to a large extent depend on the organ-specific microenvironment and the cell type. Our study shows that even minor changes in cell structure of proximal tubular cells are sufficient to increase the response to TGFβ-1, which is one of the major pro-fibrotic factors. Interestingly, the kidney TGFβ-1 expression itself was reported to be upregulated in obstructive uropathy and may be regulated by intra-tubular biomechanical forces [26].
The concentrations of EGTA used in this study were sufficient to almost completely dissociate N-cadherin homodimers. In some experiments, residual staining of N-cadherin was seen between cells, in line with the notion that not all N-cadherin interactions are calcium sensitive [5]. Most interestingly, however, loss of N-cadherin did not lead to separation of the cells. This may be due to other cell-cell interaction molecules such as connexins, forming gap junctions, or tight junction proteins[2, 27], but may in addition result from the rearrangement of focal adhesions to the periphery of the cells. Our results show that upon N-cadherin dislocation, focal adhesions become aligned along the cell boundaries to support the morphological integrity of the cell layer. These findings indicate that proximal tubular cells actively respond to cytoskeleton-affecting stimuli, which may play a role in the preservation of organ function upon challenge or injury.
We have previously reported that activation of ERK was essential for CTGF expression in polarized tubular epithelial cells when the cells were stimulated from the apical side [17]. Stimulation from the apical side is expected to involve secreted compounds and/or cellular activation mediated by urinary flow or changes in solute concentrations. Therefore, it was interesting to note that ERK was activated both in subconfluent cells and also in EGTA-treated cells. By contrast, we did not observe changes in Smad phosphorylation or localization in the presence of EGTA, or upon comparison of confluent and subconfluent cells (data not shown). Smad signaling thus seems to be specific for the endogenous factor TGFβ-1, which activates Smad2/3 phosphorylation when applied from the basolateral side in polarized cells [17].
In spite of the distinct signaling pathways activated by EGTA and TGFβ-1, we observed a strong crosstalk between both mediators in terms of CTGF induction in non-polarized cells grown on plastic: The increase of CTGF secretion upon co-stimulation with EGTA and TGFβ-1 was more than the sum of singular effects. This synergy was observed not only in the proximal tubular cell line HKC-8, but was also confirmed in preparations of primary cells isolated from healthy parts of tumor nephrectomies. TGFβ receptors are located primarily at the basolateral side in polarized cells and by inducing reorganization of the cells, EGTA may allow easier access of TGFβ-1 to its otherwise hidden receptors. Furthermore, EGTA-induced activation of signaling pathways not analyzed in this study may cooperate with TGFβ-1-mediated signaling. A combination of both, intracellular cross-talk and accessibility of receptors, may contribute to the observed synergism and warrants further investigations.
In terms of transferring our investigations to the in vivo-like situation, an engineered 3D model of kidney tubular epithelium would be necessary, where mechanical signals from the urinary site converge with receptor-mediated signaling from the interstitial basolateral side. Such a bio-inspired model would be expected to provide deeper understanding of renal cell biology and shed a new light on how the matrix biomechanical properties affect the cellular responses to fibrotic and inflammatory mediators. This knowledge would also contribute to the improved regeneration or replacement approaches for the diseased or damaged kidney, utilizing renal cells and decellularized kidney matrix or tissue-engineered scaffolds.
Declaration of interest
None.
Acknowledgments
This study was supported by the Medical Clinic 4, University Hospital Erlangen. Human kidney tissue was kindly provided by B. Wullich and his team, Department of Urology, University Hospital Erlangen. The authors thank Astrid Ebenau, Margot Rehm, and Rita Zitzmann for expert technical assistance.
References
[1] | Hagios C , Lochter A , Bissell MJ . Tissue architecture: The ultimate regulator of epithelial function? Philos T Roy Soc B (1998) ;353: (1370):857–70. |
[2] | Macara IG , Guyer R , Richardson G , Huo Y , Ahmed SM . Epithelial homeostasis. Curr Biol (2014) ;24: (17):R815–25. |
[3] | Janmey PA , Wells RG , Assoian RK , McCulloch CA . From tissue mechanics to transcription factors. Differentiation (2013) ;86: (3):112–20. |
[4] | Kramann R , Kusaba T , Humphreys BD . Who regenerates the kidney tubule? Nephrol Dial Transplant (2015) ;30: (6):903–10. |
[5] | Kim SA , Tai CY , Mok LP , Mosser EA , Schuman EM . Calcium-dependent dynamics of cadherin interactions at cell-cell junctions. Proc Natl Acad Sci U S A (2011) ;108: (24):9857–62. |
[6] | van Roy F , Berx G . The cell-cell adhesion molecule E-cadherin. Cell Mol Life Sci (2008) ;65: (23):3756–88. |
[7] | Nouwen EJ , Dauwe S , Van dBI , De Broe ME . Stage- and segment-specific expression of cell-adhesion molecules N-CAM, A-CAM, and L-CAM in the kidney. Kidney Int (1993) ;44: (1):147–58. |
[8] | Kroening S , Neubauer E , Wullich B , Aten J , Goppelt-Struebe M . Characterization of connective tissue growth factor expression in primary cultures of human tubular epithelial cells: Modulation by hypoxia. Am J Physiol Renal Physiol (2010) ;298: (3):F796–806. |
[9] | Chaqour B , Goppelt-Struebe M . Mechanical regulation of the Cyr61/CCN1 and CTGF/CCN2 proteins. FEBS J (2006) ;273: (16):3639–49. |
[10] | Samarakoon R , Goppelt-Struebe M , Higgins PJ . Linking cell structure to gene regulation: Signaling events and expression controls on the model genes PAI-1 and CTGF. Cell Signal (2010) ;22: (10):1413–9. |
[11] | Graness A , Goppelt-Struebe M . Role of the cytoskeleton in the inhibition of LPA-mediated induction of connective tissue growth factor (CTGF) by cucurbitacin I. N-S Arch Pharmacol (2006) ;372: :55. |
[12] | Muehlich S , Cicha I , Garlichs CD , Krueger B , Posern G , Goppelt-Struebe M . Actin-dependent regulation of connective tissue growth factor. Am J Physiol-Cell Ph (2007) ;292: (5):C1732–C8. |
[13] | Cicha I , Goppelt-Struebe M . Connective tissue growth factor: Context-dependent functions and mechanisms of regulation. Biofactors (2009) ;35: (2):200–8. |
[14] | Mason RM . Fell-Muir lecture: Connective tissue growth factor (CCN2) - a pernicious and pleiotropic player in the development of kidney fibrosis. Int J Exp Pathol (2013) ;94: (1):1–16. |
[15] | Racusen LC , Monteil C , Sgrignoli A , Lucskay M , Marouillat S , Rhim JG , et al. Cell lines with extended in vitro growth potential from human renal proximal tubule: Characterization, response to inducers, and comparison with established cell lines. J Lab Clin Med (1997) ;129: (3):318–29. |
[16] | Kroening S , Neubauer E , Wessel J , Wiesener M , Goppelt-Struebe M . Hypoxia interferes with connective tissue growth factor (CTGF) gene expression in human proximal tubular cell lines. Nephrol Dial Transplant (2009) ;24: (11):3319–25. |
[17] | Zuehlke J , Ebenau A , Krueger B , Goppelt-Struebe M . Vectorial secretion of CTGF as a cell-type specific response to LPA and TGF-beta in human tubular epithelial cells. Cell Commun Signal (2012) ;10: (1):25. |
[18] | Keller C , Kroening S , Zuehlke J , Kunath F , Krueger B , Goppelt-Struebe M . Distinct mesenchymal alterations in N-cadherin and e-cadherin positive primary renal epithelial cells. PLoS One (2012) ;7: (8):e43584. |
[19] | Giehl K , Keller C , Muehlich S , Goppelt-Struebe M . Actin-mediated gene expression depends on RhoA and Rac1 signaling in proximal tubular epithelial cells. PLoS One (2015) ;10: (3):e0121589. |
[20] | Ruperez M , Rodrigues-Diez R , Blanco-Colio LM , Sanchez-Lopez E , Rodriguez-Vita J , Esteban V , et al. HMG-CoA reductase inhibitors decrease angiotensin-II-induced vascular fibrosis - Role of RhoA/ROCK and MAPK pathways. Hypertension (2007) ;50: (2):377–83. |
[21] | Secker GA , Shortt AJ , Sampson E , Schwarz QP , Schultz GS , Daniels JT . TGF beta stimulated re-epithelialisation is regulated by CTGF and Ras/MEK/ERK signalling. Exp Cell Res (2008) ;314: (1):131–42. |
[22] | Leivonen SK , Hakkinen L , Liu D , Kahari VM . Smad3 and extracellular signal-regulated kinase 1/2 coordinately mediate transforming growth factor-beta-induced expression of connective tissue growth factor in human fibroblasts. J Invest Dermatol (2005) ;124: (6):1162–9. |
[23] | Chaqour B , Yang R , Sha Q . Mechanical stretch modulates the promoter activity of the profibrotic factor CCN2 through increased actin polymerization and NF-kappa B activation. J Biol Chem (2006) ;281: (29):20608–22. |
[24] | Xu Y , Wagner DR , Bekerman E , Chiou M , James AW , Carter D , et al. Connective Tissue Growth Factor in Regulation of RhoA Mediated Cytoskeletal Tension Associated Osteogenesis of Mouse Adipose-Derived Stromal Cells. PLoS One (2010) ;5: (6):e11279. |
[25] | Cicha I , Goppelt-Struebe M , Muehlich S , Yilmaz A , Raaz D , Daniel WG , et al. Pharmacological inhibition of RhoA signaling prevents connective tissue growth factor induction in endothelial cells exposed to non-uniform shear stress. Atherosclerosis (2008) ;196: (1):136–45. |
[26] | Rohatgi R , Flores D . Intratubular hydrodynamic forces influence tubulointerstitial fibrosis in the kidney. Curr Opin Nephrol Hypertens (2010) ;19: (1):65–71. Epub 2009/10/24. |
[27] | Hou J . The kidney tight junction. Int J Mol Med (2014) ;34: (6):1451–7. |
Figures and Tables
Fig.1
Differential regulation of CTGF expression in dense vs subconfluent HKC-8 cells. (A) HKC-8 cells were seeded as subconfluent (s.c.) cells (10.000/cm2) or dense cells (35.000/cm2). Phase contrast images were taken 24 and 48 h after seeding. (B) Cells were seeded as in 1A. At 24 h after seeding, cells were stimulated with TGFβ-1 (2 ng/ml) for 6 or 24 h. CTGF mRNA expression was determined by qPCR, and related to 18 S rRNA. Expression of CTGF in control cells at 6 h was set to 1 in each experiment. Data are means±SD of 3 experiments with duplicate biological samples. ###p < 0.01 vs control cells at 6 h; **p < 0.01, ***p < 0.001 vs cells without TGFβ-1, ANOVA with Tukey’s multiple comparison test. (C) Cells were seeded as in 1A, followed by stimulation with TGFβ-1 (T, 2 ng/ml) for 24 h, or stimulation with LPA (L, 10μM) for 4 h, C: Control cells. CTGF protein was detected in the cell culture supernatants. The intensities of the CTGF bands were determined by densitometry and corrected for the initial number of cells seeded. For each blot, the intensity of subconfluent control cells was set to 1. Data of 3 (dense, confluent cells) and 5 (s.c., subconfluent cells) experiments are summarized in the graph (means±SD); #p < 0.05, dense cells vs subconfluent cells, one-sample t-test. *p < 0.05, ***p < 0.001 vs non-stimulated cells, ANOVA with Tukey’s multiple comparison test.
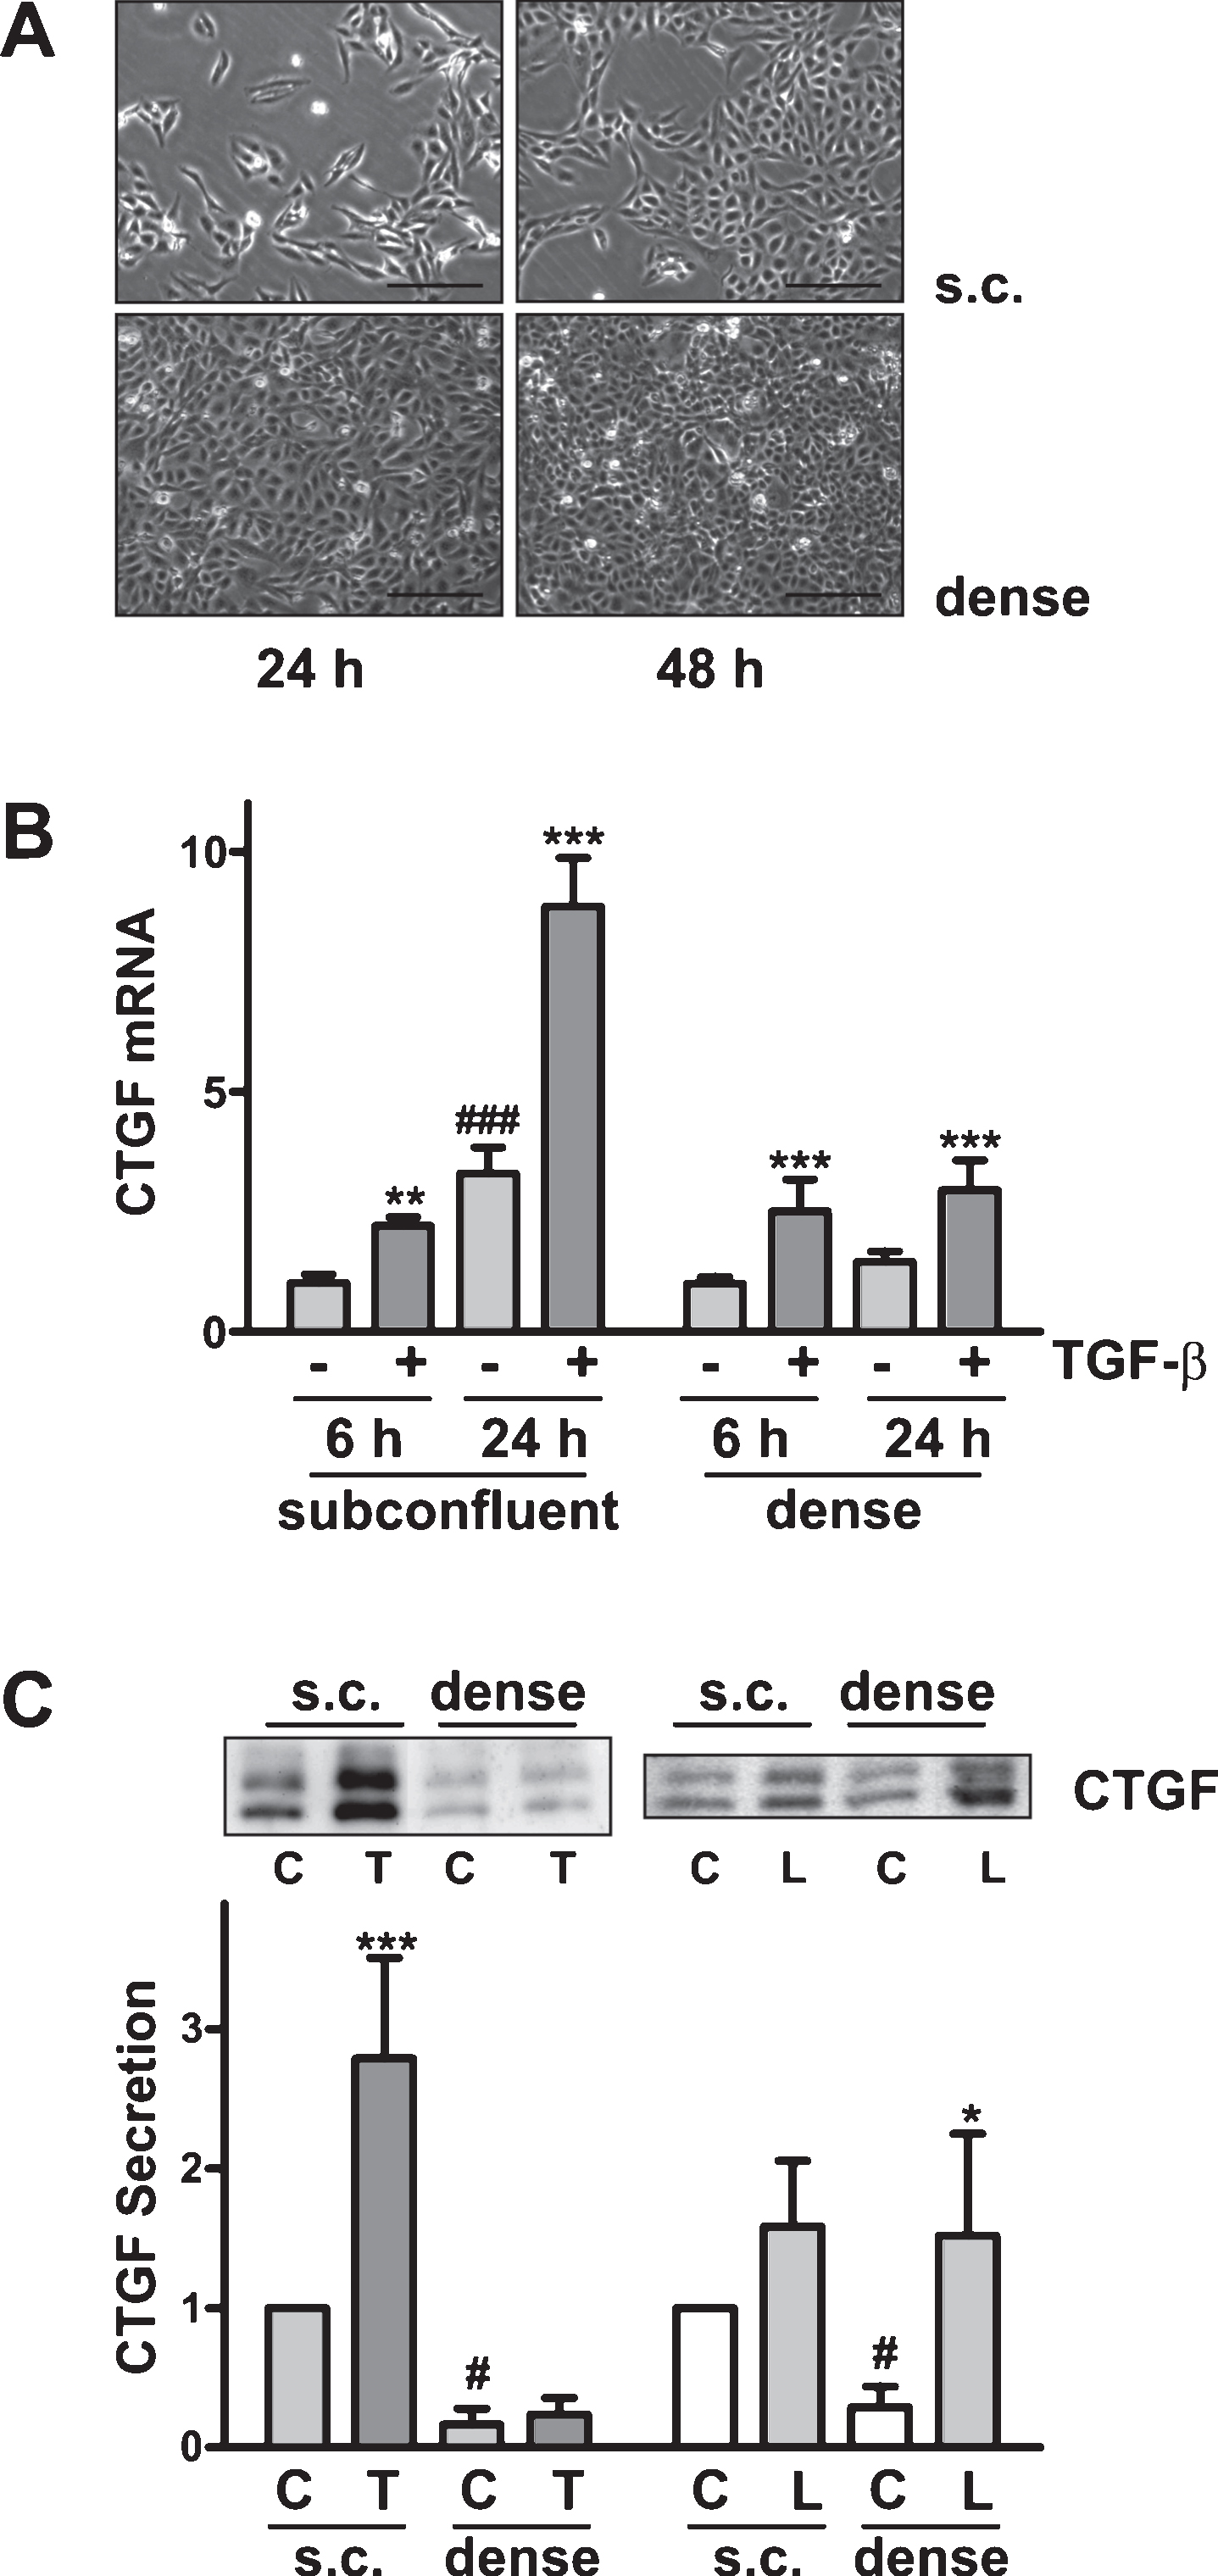
Fig.2
Reorganization of the cytoskeleton upon treatment with EGTA. HKC-8 cells were grown to confluency and then treated with EGTA (1 mM) for 2 h. N-cadherin and paxillin were detected by indirect immunofluorescence. Scale bars: 20μm.
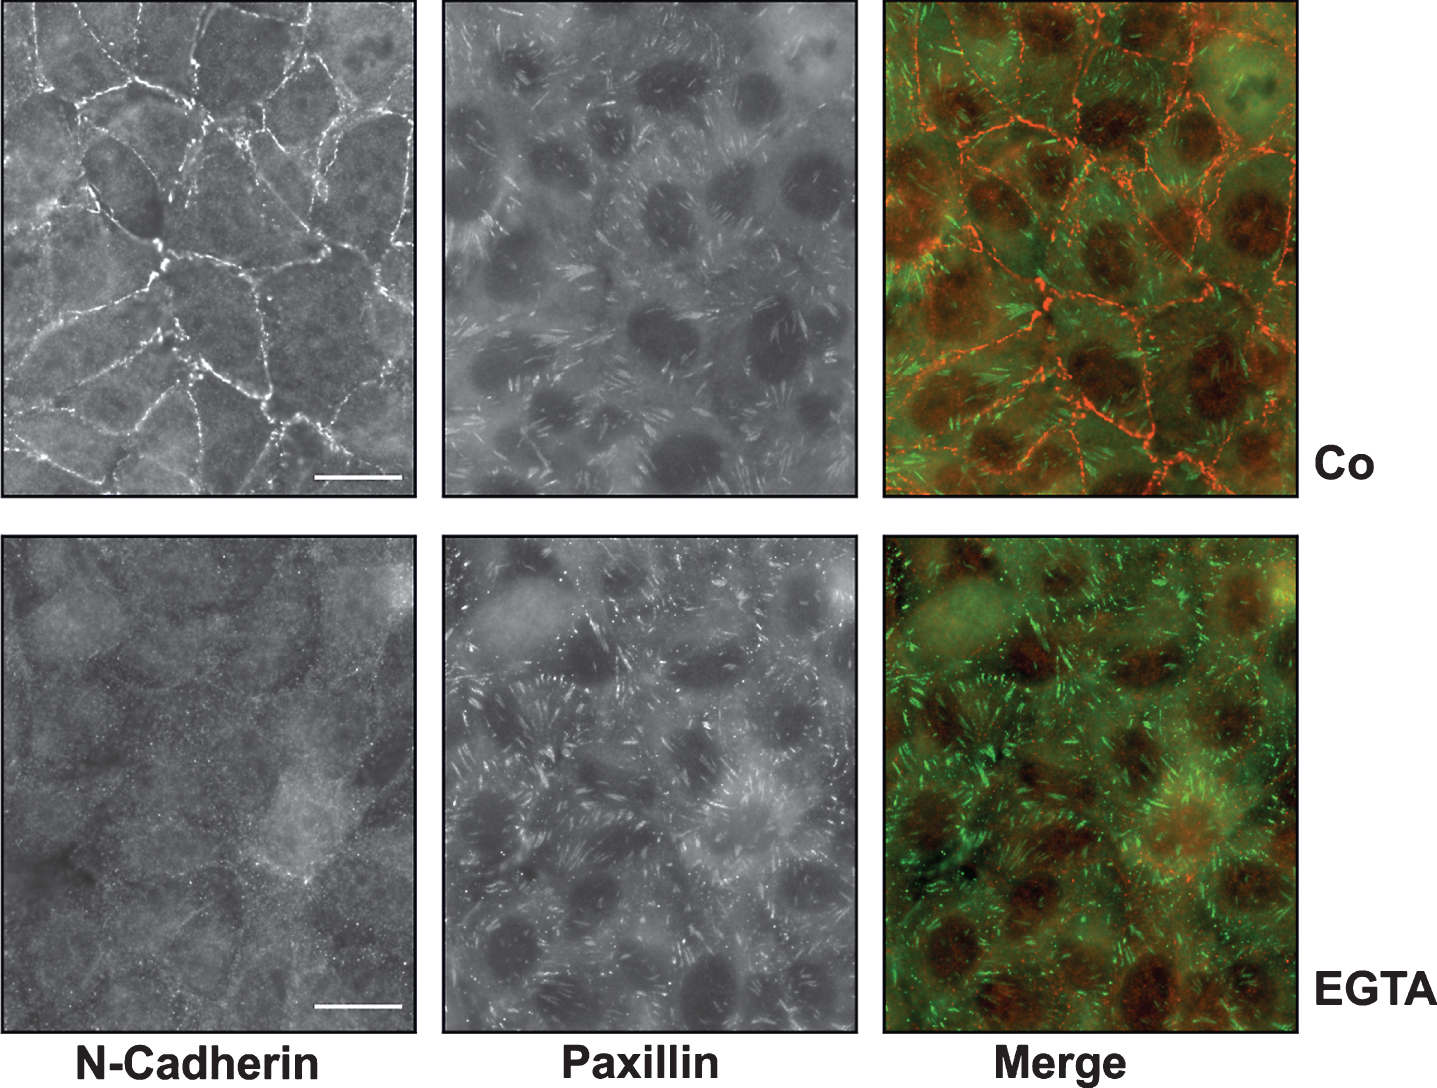
Fig.3
Upregulation of CTGF by EGTA. (A) Confluent HKC-8 cells were treated the ERK inhibitor UO126 (0.5μM) or the ROCK inhibitor H1152 (0.75μM) for 30 min, followed stimulation with EGTA (1 mM) for 6 h. CTGF was detected in cell culture supernatants by Western blotting. The graph summarizes the data of n = 5 (UO126) and n = 4 (H1152) independent experiments. For each blot, the CTGF intensity of the EGTA-stimulated cells was set to 1. # #p < 0.01, vs unstimulated control cells; **p < 0.01 vs EGTA-treated control cells, ANOVA with Tukey’s multiple comparison test. (B) Confluent HKC-8 cells were stimulated with EGTA (1 mM) for 1 or 6 h. pERK1/2 and ERK1/2 were determined by Western blotting. For each blot, ERK activity determined in control cells was set to 1. Data are means±SD of n = 3 (1 h) and n = 4 (6 h) independent experiments. *p < 0.05 vs control, ANOVA with Tukey’s multiple comparison test. (C) ERK activity was determined in dense (d.) and subconfluent (s.c.) cells 24 h after seeding. Data are means±SD of 3 independent experiments. **p < 0.01, one sample t-test. The blot shows data of 2 independent experiments (#1, #2). (D) MYPT phosphorylation was determined by Western blotting after 6 h of EGTA stimulation. Data are means±SD of n = 5 experiments. For each blot, pMYPT intensity determined in control cells was set to 1. (E) pMYPT was determined in dense and subconfluent (s.c.) cells 24 h after seeding. Data are means±SD of 4 independent experiments. Expression in dense cells was set to 1. The blot shows data of 2 independent experiments (#1, #2).
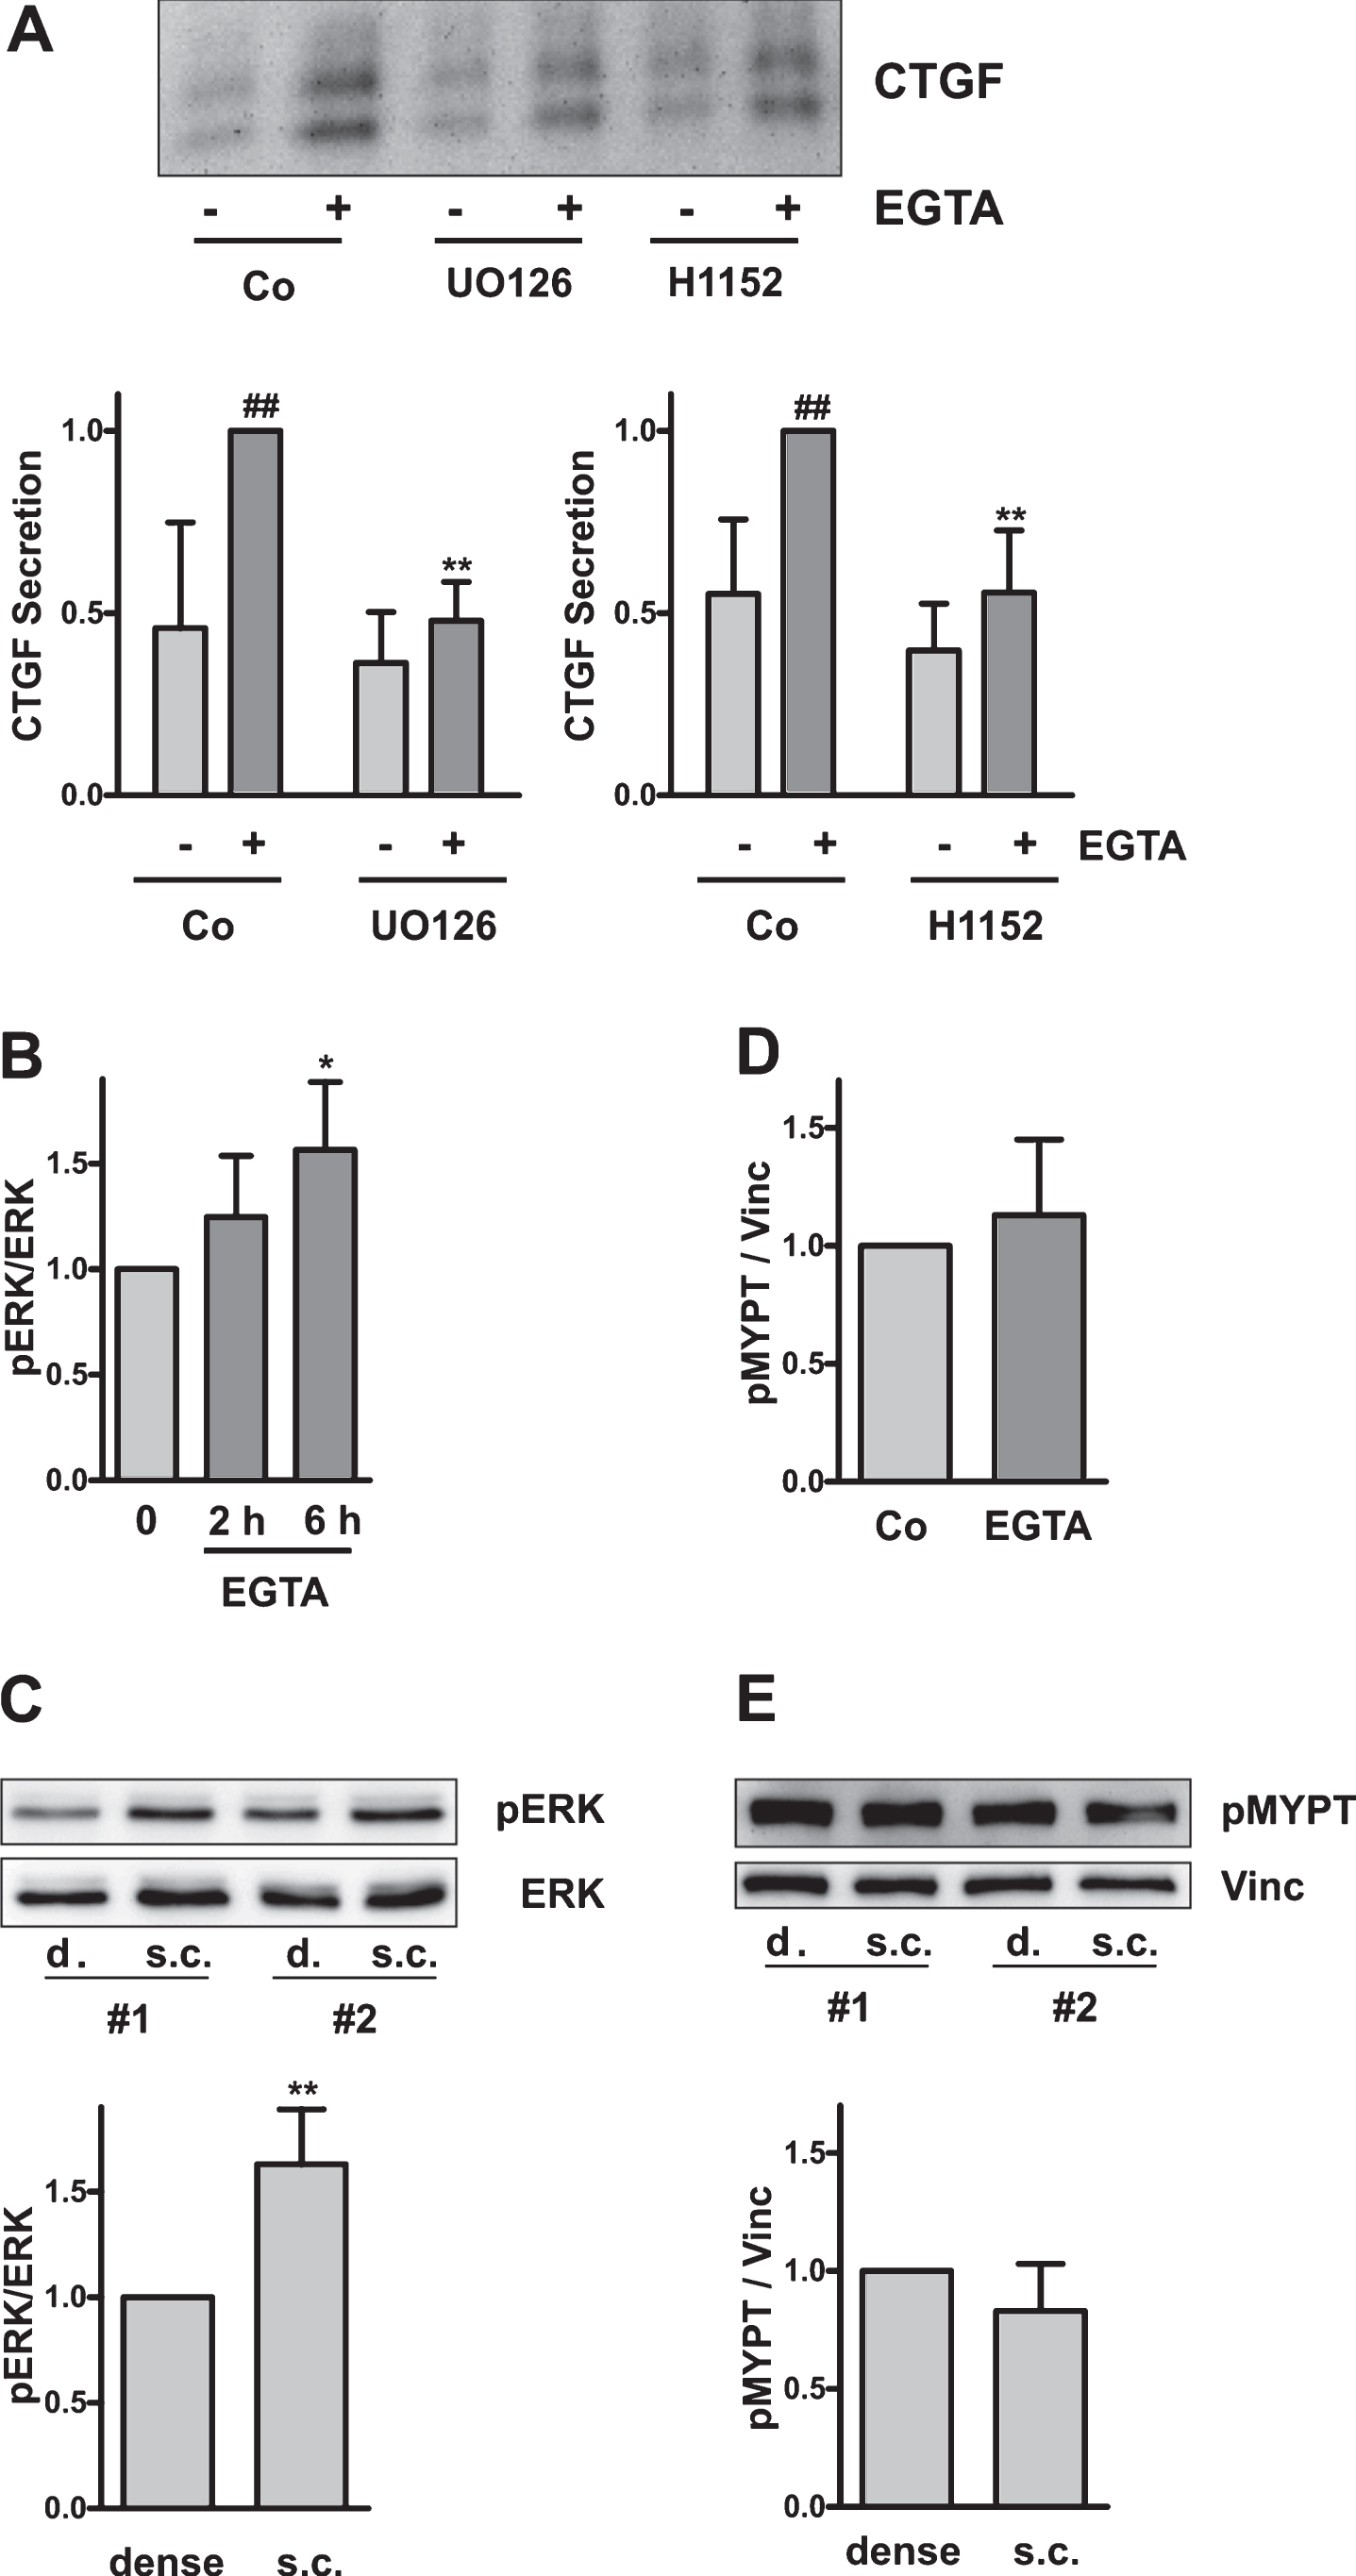
Fig.4
Synergistic induction of CTGF by EGTA and TGFβ-1. (A) HKC-8 cells were pre-treated with EGTA (1 mM) for 30 min followed by stimulation with TGFβ-1 for 6 h. CTGF was determined in cell culture supernatants. The sum of the intensities of the 4 bands was set to 1 on each blot. Data are means±SD of 4 independent experiments. *p < 0.05, ***p < 0.001 vs control cells; #p < 0.05, paired t-test, sum of EGTA plus TGF-β vs combined stimulation. (B) HKC-8 cells were treated with siGFP or with siN-Cad for 48 h. N-cadherin and paxillin were detected by indirect immunofluorescence. Scale bar: 20μm. (C) 24 h after transfection, medium was changed to 0% FCS. CTGF secretion was determined at 48 h. The graphs summarize data (means±SD) of 6 transfections with two different siRNAs. *p < 0.05, one sample t-test. (D) 48 h after transfection, medium was changed and the cells were stimulated with TGFβ-1 for 24 h. CTGF secretion was determined in the cell culture supernatants. Data are means±SD of 4 experiments. For each blot, CTGF intensity of the siN-Cad-treated cells was set to 1. *p < 0.05 vs control, ANOVA with Tukey’s multiple comparison test.
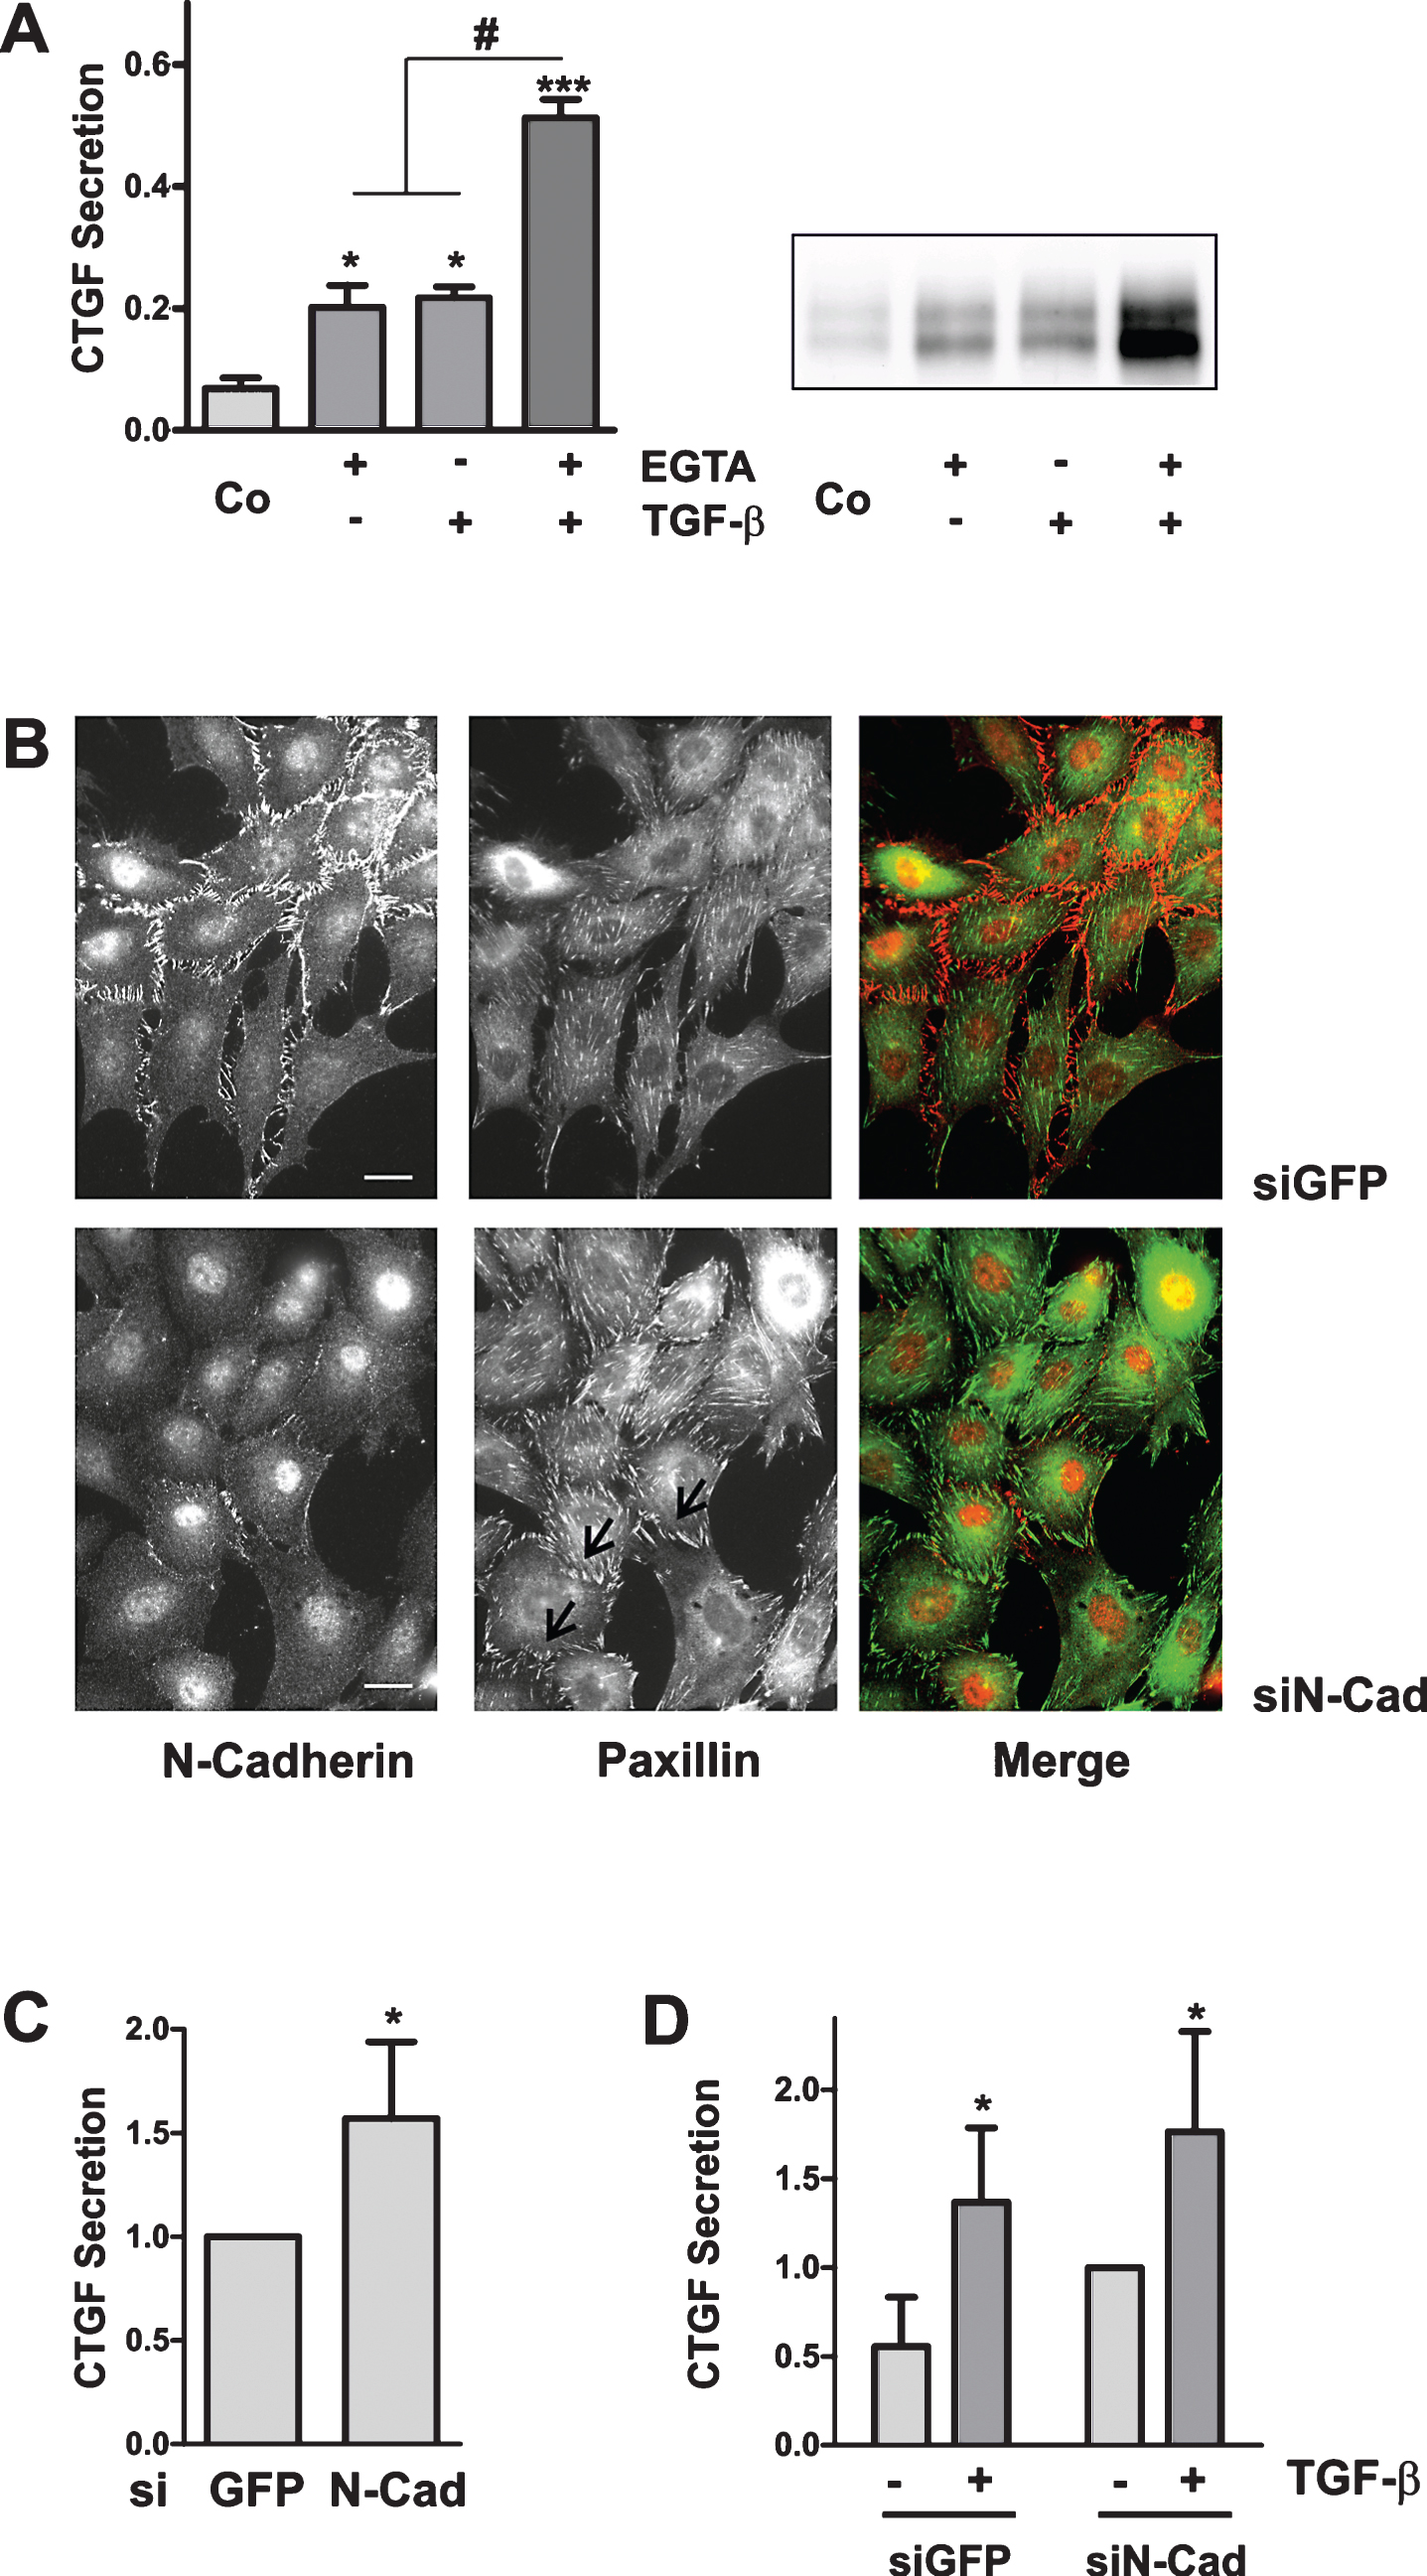
Fig.5
Synergistic induction of CTGF by EGTA and TGFβ-1 in primary human tubular cells. (A) Primary tubular cells were treated with EGTA (1 mM) for 2 h. N-cadherin and paxillin were detected by indirect immunofluorescence. Scale bars: 20μm. (B) Cultures of primary tubular cells obtained from 3 different donors were pre-treated with EGTA (1 mM) for 30 min and were then stimulated with TGF-β for 6 h. CTGF was detected in the cell culture supernatants by Western blotting. Intensity of CTGF secreted by control cells was set to 1 on each blot. Data are means±SD of 5 independent experiments. *p > 0.05, ***p < 0.001 vs control cells, ANOVA with Bonferroni post hoc-test; #p < 0.05, paired t-test, sum of EGTA plus TGFβ-1 vs combined stimulation.