
Physico-chemical characterization, metabolomic profile and in vitro antioxidant, antihypertensive, antiobesity and antidiabetic properties of Andean elderberry (Sambucus nigra subsp. peruviana)
Abstract
BACKGROUND:
The consumption of fruits, mainly berries, has been associated with beneficial health properties. These properties would be related to the quantity and quality of the metabolites present. Some native berries from the Andes, such as Andean elderberry, would be an important source of metabolites with bioactive properties.
OBJECTIVES:
To evaluate at the physico-chemical and metabolomic level the characteristics of the elderberry from four different high Andean regions, and to determine their bioactive potential through in vitro tests.
RESULTS:
Significant differences were found in the evaluated characteristics according to the Region of procedence of the fruit. Glucose was the main sugar for all berry samples, followed by fructose. Among the most important organic acids, citric and malic acid were found. Elderberry from Apurímac presented the highest content of total sugars and lower content of total acids in comparison to the samples from other procedences. UPLC-PDA results indicate that Junín elderberries presented the highest value of total phenolic compounds with high contents of flavonols, hydroxycinnamic acids and anthocyanins. Andean elderberry presented cyanidin 3-O-glucoside and cyanidin 3-O-sambubioside as main anthocyanins as well as their respective isomers. All samples showed inhibition activities against the different evaluated enzymes. Elderberries from Apurímac and Junín, displayed the lowest values of IC50 for the inhibition of α-amylase and α-glucosidase, while for the inhibition of lipase and angiotensin converting enzyme (ACE-I) elderberries from Junín displayed the lowest IC50 values.
CONCLUSIONS:
The results of this study suggest that Andean elderberry could be considered as an important source of bioactive compounds with properties that could be highlighted by the nutraceutical and functional food industries.
1Introduction
Epidemiological evidence suggests association between the consumption of rich diets in fruits and vegetables and the decrease in the risk of developing degenerative diseases related to lifestyle [1]. This association can be explained, at least partially, by the presence of bioactive compounds (e.g., phenolic compounds, ascorbic acid, tocopherols, among others) in fruits and vegetables. Polyphenols are bioactive compounds with outstanding antioxidant activity and contribute to maintaining good health [2]. Polyphenols have been linked to the prevention of degenerative diseases such as cardiovascular diseases, displaying antidiabetic and neuroprotective effects, contributing to the reduction of obesity, anti-inflammatory processes, among others [2–4].
Berry fruits such as blueberries, blackberries, cherries and elderberries, grown in the northern hemisphere, are known as traditional rich sources of bioactive compounds [5, 6]. Within their composition, berries, have antioxidant phenolic compounds with beneficial effects on health as demonstrated by in vitro and in vivo studies [7, 8]. Within this context, the native “Sauco” or Andean elderberry, grows in the southern hemisphere between 2 800 and 3 900 meters above sea level. This berry has caught our attention based on a preliminary study that reported high in vitro antioxidant power compared to other consumed Andean fruits and vegetables [9]. Up to date, there is scarce information about the metabolomic profile, bioactive properties and physico-chemical characteristics of this Andean berry.
Among the most common approaches to evaluate the quality characteristics of berries at harvest, the content of soluble solids, pH, color and acidity are assessed. Berry quality and taste are affected by a number of components. Sugars and organic acids (primary metabolites) are the main soluble constituents of berries and have a major effect on taste, fruit ripeness and are considered as an index of consumer acceptability [5]. In addition, the composition of the phenolic compounds profile (secondary metabolites) associated with the nature of the fruit are considered as a quality criterion.
Thus, the aim of this study was to investigate the physico-chemical characteristics, primary metabolites (sugars and organic acids) and secondary metabolites (phenolic compounds including anthocyanins), antioxidant activity and bioactivity related to potential health benefits (antihyperglycemic, antiobesity and antihypertensive properties) using in vitro assays of elderberry from four different regions of the Peruvian Andean Region, with the purpose of valorizing this native fruit and expanding its consumption possibilities as a potential source of bioactive compounds.
2Materials and methods
2.1Fruit material and chemicals
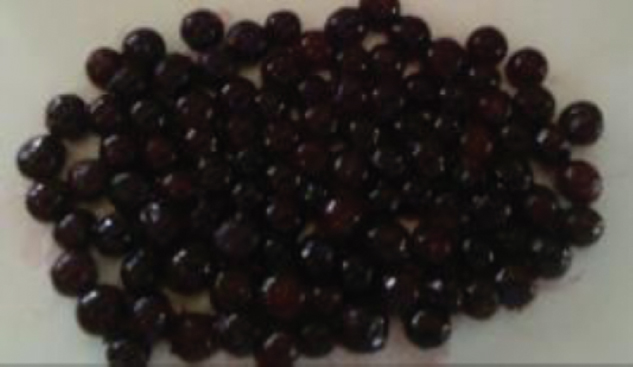
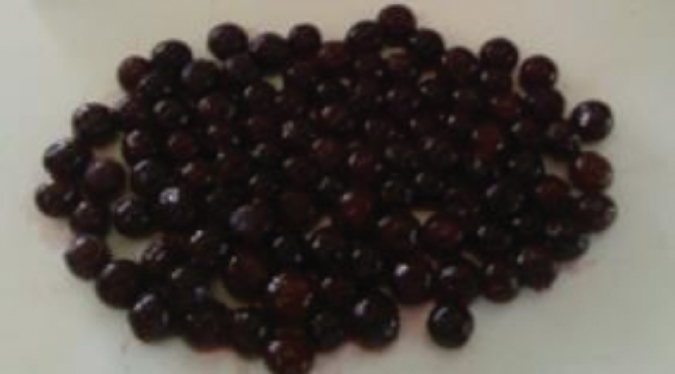
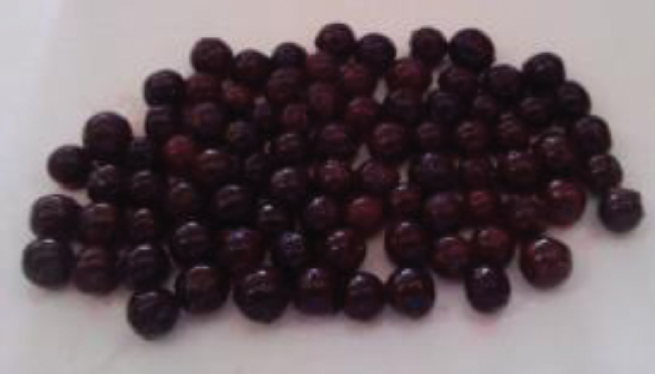
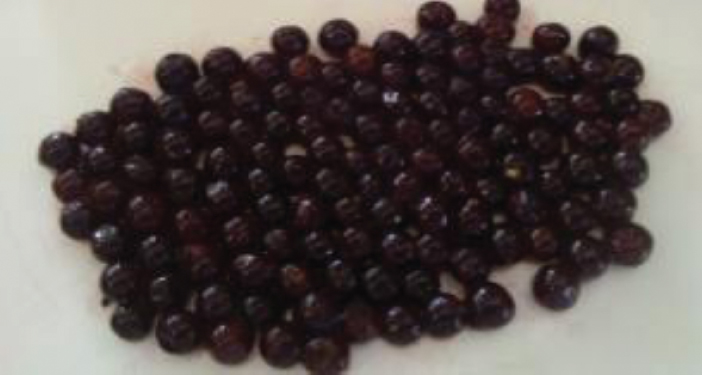
Mature elderberries from four production regions of the Peruvian Andean region (Table 1) were analyzed in this study. Fruits (5 kilograms collected from 10 shrubs) were harvested between March-April 2017 at full maturity stage (based on color, flavor and firmness to the touch), packed in black bags on a container with ice and inmediately sent to the laboratory. Then, berries were washed, selected, snapped frozen, lyophilized and stored in aluminum bags at –80°C until analysis.
Table 1
Geographical data of collection of Andean elderberry samples
| Region | ||||
| Apurímac | Ayacucho | Cajamarca | Junín | |
| Province | Andahuaylas | Cangallo | Cajabamba | Tarma |
| District | Talavera | Totos | Condebamba | Tarma |
| Latitude | 13°39′13″ S | 13°34′04″ S | 07°34′25″ S | 11°25′08″ S |
| Longitude | 73°25′40″ W | 74°31′22″ W | 78°04′12″ W | 75°41′23″ W |
| Altitude | 2830 m | 3287 m | 2807 m | 3048 m |
 |  |  |  | |
Trolox (6-hydroxy-2,5,7,8-tetramethylchroman-2-carboxylic acid), fluorescein sodium salt, 2,4,6-tripyridryl-s-triazine (TPTZ), 2,2’-azinobis-3-ethylbenzotiazilone-6-sulphonic acid (ABTS), 2N Folin-Ciocalteau and 2,2′-aziobis(2-amidinopropane) dihydrochloride (AAPH), hippuric acid (HA) and hippuryl-histidylleucine (HHL) were purchased from Sigma-Aldrich (St. Louis, MO, USA). Catechin, chlorogenic acid, rutin, p-coumaric, luteonin, quercetin and cyanidin 3-glucoside were obtained from Sigma-Aldrich (St. Louis, MO, USA) as standards. Sugar standards: fructose, glucose and sucrose were purchased from Sigma (Supelco, Carbohydrates Kit, CAR10, St. Louis, MO, USA), organic acid standards: L-ascorbic, citric, malic, quinic, succinic and tartaric, were purchased from Supelco (Kit 47264, Milwaukee, WI, USA). Lipase from porcine pancreas Type II, α-amylase from porcine pancreas Type VI-B, α-glucosidase from Saccharomyces cerevisiae Type I, angiotensin converting enzyme (ACE) from rabbit lung were obtained from Sigma-Aldrich (St. Louis, MO, USA). MS-grade methanol LiChrosolv® from Merck (Darmstadt, Germany). All other chemicals and solvents used in this study were purchased from Merck (Darmstadt, Germany).
2.2Physico-chemical analysis
Moisture, soluble solids, pH and titratable acidity were performed following the methods of the AOAC [10]. Reducing sugars were determined using the colorimetric method with the dinitrosalicylic acid [11] and were expressed as glucose. Color determination was carried out on the surface of intact fruit using a Konica Minolta Chromameter colorimeter (CR-400, Konica Minolta, Tokyo, Japan).
2.3HPLC analysis of sugars and organic acids
Sugars and organic acids were extracted according to Perez [12] with slight modifications. Lyophilized sample (0.1 g) and 5 mL of 95% cold ethanol were homogenized for 5 min and then centrifuged at 10 000 g for 10 min at 4°C. The supernatant was brought to 25 mL volume with 80% ethanol. Then, 10 mL were dried under vacuum conditions at 50 °C and the residue was dissolved in 2 mL of 0.2 N H2SO4 containing 0.05% EDTA. Samples were loaded onto an activated Sep-Pak C18 cartridge (Waters, Massachusetts, USA) and the eluates were collected and filtered through 0.2 μm membrane filters previous HPLC analysis.
The content of sugars was determined according to Campos [13]. An HPLC system composed by a 2695 Separation Module (Waters, Milford, MA, USA) equipped with an autoinjector, a 2414 refraction index detector (RI) and Empower software was used. A NH2P-40 3E (250×3.9 mm, 4 μm) column and a guard column NH2P-50G 3A (10 mm×3.0 mm, 5 μm) (Shodex, Japan) were used for sugar separation at 35°C. HPLC conditions were as follows: mobile phase composed of acetonitrile:water (72.5 : 27.5 v/v), injection volume of 5 μL and a flow rate of 0.35 mL/min. Organic acids were determined according to Aguilar-Galvez [14] using the same HPLC system mentioned above but coupled to a 2996 diode array detector (PDA). An Aminex® HPX-87 H column (5 μm, 300×7.8 mm) (Bio-Rad Laboratories Inc., CA, USA) was used for organic acid separation at 20°C. The mobile phase was 0.005 N sulfuric acid (pH ∼ 2.5). An injection volume of 10 μL and flow rate of 0.6 mL/min were used. The eluates were monitored at 210 nm. The identification and quantification of sugars and organic acids were carried out by comparing the retention times of pure standards previously injected. Results of sugars and organic acids were expressed as g per Kg of sample in fresh weight basis (FW). In addition, maturity index (total sugars/total acids) was determined as described by Mikulic-Petkovsek [5].
2.4Phenolic compounds and antioxidant activity assays
2.4.1Sample extraction
Elderberry extracts were obtained as follows: A 0.5 g of lyophilized sample was extracted with 14 mL of 80% methanol at 4°C for 20 h. The extracts were centrifuged at 5 000 g for 10 min and the supernatants were collected and evaporated in a rotary evaporator at 38°C until dryness. The solid residues were diluted in HPLC grade methanol and MS grade for the analysis of non-anthocyanin phenolic compounds by UPLC-PDA and the analysis of anthocyanins by mass spectrometry, respectively. The solid residues were also diluted in MilliQ water for spectrophotometric and fluorometric analysis, as well as for the inhibition assays of the different enzymes. For all cases, the extracts were kept at –20° C until analysis. Extractions were carried in triplicate.
2.4.2Determination of total phenolic compounds (TPC), total flavanoids (TFA), total flavonoids (TFO) and total anthocyanins (TA)
TPC in extracts were determined with the Folin-Ciocalteau reagent [15], using gallic acid as standard. Absorbance was measured at 755 nm and the results were expressed as mg gallic acid equivalents (GAE) per g sample FW. TFA were estimated using the chromogen DMACA reagent [16], using catechin as standard. Absorbance was measured at 640 nm and results were expressed as mg of catechin equivalents (CE) per g sample FW. TFO were determined using the aluminium ion colorimetric method [17] using quercetin as standard. Absorbance was measured at 510 nm and results were expressed as mg of quercetin equivalents (QE) per g sample FW. TA was measured using the pH differential method [18]. Absorbance was measured at 520 and 700 nm in pH 1.0 and 4.5 buffers. A molar extinction coefficient of 26 900 L cm–1 mol –1 and a molecular weight of 449.2 were used for anthocyanin calculation. Results were expressed as mg of cyanidin 3-glucoside equivalents (CGE) per g sample FW.
2.4.3Antioxidant activity assays
The hydrophilic antioxidant activity (AA) of the sample extracts were determined using the 2-2's-Azino-bis(3-ethylbenzthiazoline-6-sulfonic acid) (ABTS•+) [19], ferric reducing antioxidant power (FRAP) [20] and oxygen radical absorbance capacity (ORAC) assays [9]. The results for all three assays were expressed as μmol Trolox equivalents (TE) per g of sample FW.
2.5UPLC-PDA analysis of non-anthocyaninan phenolic compounds profile and LC-ESI/MS-MS and UPLC-qToF/MS-MS analysis of anthocyanins
Non-anthocyanin phenolic compounds were analyzed using an UPLC system composed of an Aquity HClass separation module (Waters, Milford, USA) equipped with an autoinjector, an Aquity photodiode array detector (PDA eλ detector) and the Empower software. The column used por UPLC separation was an Acquity BEH C18 (1.7 μm, 100×2.1 mm) (Waters, Milford, USA) with an Acquity VandGuard BEH C18 pre-column (1.7 μm, 5×2.1 mm), operated at 30 °C. The mobile phase consisted in 0.1% formic acid in water (solvent A) and 0.1% formic acid in acetonitrile (solvent B). The gradient program was as follows: 2% B for 2 min, 2 to 7% B in 2 min, 7 to 12% B in 11 min, 12 to 26% B in 5 min, 26 to 55% B in 5 min, 55 to 95% B in 1 min and 95% B for 3 min. The flow rate and sample injection used were 0.2 mL/min and 2.0 μL, respectively. Samples and mobile phases were filtered through a 0.22 μm Millipore filter, type GV (Millipore, Bedford, MA) prior to UPLC injection. Spectral data were recorded from 200 to 700 nm during the whole run. Each extract was analysed in triplicate. Phenolic compounds were identified and quantified by comparing their retention time and UV-visible spectral data to known previously injected standards (280, 320 and 360 nm). The results were expressed in mg/g of sample FW.
Anthocyanins were identified using an UPLC (ACQUITY UPLC I-Class, Waters Corp., Milford, MA, USA) equipped with an Acquity BEH column (1.7 μm, 100×2.1 mm Waters Corp) connected to a quadrupole time of flight mass spectrometer (Xevo G2-XS QTof, Waters Corp). The mobile phases were water with 5% formic acid (A) and acetonitrile with 0.1% formic acid (B). The injection volume was 1 μL and total running time was 15 min, with a solvent gradient as follows: 2% B for 0.5 min, then in 10 min to 15% B, then in 1 min to 98% B and kept for 1.5 min, then in 0.5 min to 98% and re-equilibrated for 1.5 min. The column was kept at 30°C and the flow rate was 0.3 mL min–1. Mass spectra were acquired continuously using electrospray ionization in positive mode (3 kV) in MS/MS mode with a scan time of 0.5 s. The desolvation temperature was 300°C, the cone gas flow was 20 L h–1, and desolvation gas flow was 1 000 L h–1. MS/MS fragmentation process was accomplished at normalized collision energy ramped from 6 to 20 eV. The accurate mass and elemental composition of the precursor and fragment ions were calculated and sequenced using the MassLynx software (Waters Corp., Milford, MA, USA). Monoisotopic mass of the molecular ion [M+] with a mass error <5 ppm and fragmentation patterns were used for identification by comparison with literature references and online databases (PubChem). A standard of cyanidin-3-glucoside was analysed under the same conditions.
The quantification of anthocyanins was performed on an UltiMate 3000 UHPLC (Thermo Scientific, Germering, Germany) equipped with the same column used for the identification by UPLC-qToF and connected to a triple quadrupole mass spectrometer (TSQ Quantum Access MAX, Thermo Scientific). The mobile phases were water with 5% formic acid (A) and acetonitrile with 0.1% formic acid (B). The injection volume was 1 μL and total running time was 17 min, with a solvent gradient as follows: 2% B for 0.5 min, then in 10 min to 15% B, then in 1 min to 98% B and kept for 1.5 min, then in 0.01 min to 98% and re-equilibrated for 4 min. The column was kept at 30°C and the flow rate was 0.4 mL min–1. Ions were generated using heated electrospray ionization (H-ESI) in positive mode (3.5 kV). The vaporization temperature was 242°C, sheat gas pressure was 30 (arbitrary units), auxiliar gas pressure was 5 (arbitrary units), capillary temperature was 288°C and collision gas pressure was 1.5 mTorr. Data was acquired using the SRM (Single Reaction Monitoring) mode. Collision energy was optimized with a standard solution of cyanidin 3-O-glucoside using the TSQTune software (Thermo Scientific). The parent m/z monitored were 581 (cyanidin sambubioside) and 449.1 (cyanidin 3-O-glucoside), and the product ion of 287.1 m/z was used for quantification in both cases. A calibration curve was constructed with the cyanidin-3-glucoside standard solution at the following concentrations: 0.1, 0.2, 0.5, 1 and 2 μg/mL. The compounds were quantitated as cyanidin-3-glucoside equivalents.
2.6α-amylase and α-glucosidase inhibition
The inhibition of α-glucosidase and α-amylase were determined according to the methods reported by Ranilla [21]. For α – amylase inhibition assay: 500 μL of the aqueous extract (pH 7±0.2) with 500 μL of 0.02 M sodium phosphate buffer (pH 6.9 with 0.006 M NaCl) containing α-amylase solution (0.5 mg/mL) were incubated at 25°C for 10 min. After preincubation, 500 μL of 1% starch solution was added to the buffer and left to react for 10 min at 25°C. The reaction was stopped with 1 mL of dinitrosalicylic acid color reagent. The samples were then incubated in a boiling water bath for 5 min, cooled to room temperature and then diluted with 15 mL of MilliQ water. The absorbance was measured at 540 nm in a Genesys 20 spectrophotometer (Thermo Spectronic, Rochester, NY). The absorbance of a control (buffer in place of sample extract) was also measured. The α-amylase inhibitory activity was calculated according to the equation below:
For α -glucosidase inhibition: 100 μL of the aqueous extract (pH 7±0.2) and 100 μL of 0.1 M potassium phosphate buffer (pH 6.9) containing α-glucosidase solution (1.0 U mL–1) were incubated in 96-well plates at 25°C for 10 min. Then, 50 μL of 5 mM p-nitro-phenyl-α-D-glucopyranoside was added to each well. The reaction mixtures were incubated at 25°C for 5 min. Before and after incubation, absorbance readings (A405 extract) were recorded at 405 nm by a microplate reader microplate reader (BioTek Instruments Eon, Winooski, VT, USA). Absorbance of a control (buffer in place of sample extract) were also measured in the assay.
The α-glucosidase inhibitory activity was expressed as percentage of inhibition and was calculated as follows:
2.7Pancreatic lipase inhibition
The method reported by Nakai [22] was used with slight modifications. Briefly, 25 μL of phenolic aqueous extracts (pH∼8.0) were mixed with a 0.1 mM solution of 4-methylumbelliferyl oleate (in buffer Tris, pH 8.0). Then the pancreatic lipase (1 mg/mL, in buffer Tris, pH 8.0) was added to the mixture and incubated at 25°C for 15 min. Fluorescence was measured at an excitation and emission wavelengths of 355 and 460 nm, respectively in a 96-well microplate fluorometer (BioTek Instruments Sinergy 2, Winooski, VT, USA). Fluorescence of a control (buffer in place of sample extract) was also measured. The pancreatic lipase inhibitory activity was expressed as percentage of inhibition and was calculated as follows:
2.8Angiotensin converting enzyme inhibition
The angiotensin converting enzyme (ACE-I) inhibition assay was performed using the method proposed by Chirinos [23]. Briefly, the reaction was carried out mixing, 50 μL of 2.17 mM HHL solution, 10 μL of sample and 10 μL of 2 mU of ACE (both prepared in 100 mM buffer borate, containing 300 mM NaCl, pH 8.3) at 37°C for 30 min. The reaction was stopped by addition of 80 μL of 1N HCl. Samples were compared to a control and blank (10 μL of sample was replaced by 10 μL of buffer and 10 μL of inactivated ACE solution, respectively) submitted to same reaction conditions. Samples (2 μL) were analyzed on a Kinetex C18 RP (1.7 μm, 50×2.1 mm) column and a guard column. HA and HHL were detected at 228 nm. The column was eluted with a two solvent system: (A) 0.05% TFA in water and (B) 0.05% TFA in acetonitrile. The solvent gradient was as follows: 5% B from 0 to 1.5 min, from 5 to 60% B in 2.5 min, from 60 to 90% B in 0.5 min, 90% B for 1.5 min, from 90 to 5% B in 0.5 min and finally maintained at 5% B for 1.5 min. The total run was carried out in 8 min, at 30°C and a flow rate of 0.5 mL/min. ACE-I inhibition was calculated as follow:
Where: Ac = concentration of HA in the control, As: concentration of HA in sample and Ab: concentration of HA in blank.
The percentage of inhibition, for each evaluated enzyme inhibition assay, was plotted vs. Log10 inhibitor concentrations (concentrations ranged from 0.1 to 1.0 mg sample) obtaining a sigmoid curve. The IC50 corresponded to the concentration (mg sample) needed to observe a 50% inhibition of the corresponding enzyme activity.
2.9Statistical analysis
Values were expressed as means±standard deviations. An analysis of variance (ANOVA) followed by a Tukey test (p < 0.05) was used for all the analysis using Statgraphics Centurion XVI software (StatPoint Inc., Rockville, MD, USA). Pearson correlations (r) among the different parameters were also performed. Principal components analysis (PCA) was performed on mean-centred and standardized data. Unscrambler® X was used for multivariate statistical analysis (CAMO software, Oslo Science Park, Norway).
3Results and discussion
3.1Physico-chemical analysis
The evaluated physico-chemical characteristics are presented in Table 2. Elderberries showed a high moisture content that ranged from 89.4 to 91.2%. The values of soluble solids, pH and titratable acidity were within the ranges of 5.7 and 8.9; 3.9 and 4.1 and 0.77 and 1.17%, for the four different procedences, respectively. Significant differences in all evaluated characteristics (p < 0.05) were found according to procedence. Elderberries from Apurímac presented the highest soluble solids and the lowest acidity contents; while samples from Junín presented the highest acidity and lowest values of soluble solids. Previously, ten cultivars of American and European elderberry, presented values of soluble solids, pH and titratable acidity between 11.2 and 14.8; 3.8 and 4.5 and, 0.48 and 1.43%, respectively [24], being these values of soluble solids, higher than those found in the present study.
Table 2
Physico-chemical characteristics of Andean eldeberries collected from four diferent high-land regions of Peru
| Region | ||||
| Characteristic | Apurímac | Ayacucho | Cajamarca | Junín |
| Moisture (%) | 89.4±0.2c | 89.8±0.3cb | 91.2±0.5a | 90.3±0.5b |
| pH | 4.1±0.0a | 4.0±0.0b | 3.9±0.0c | 3.9±0.0c |
| Soluble solids (°Brix) | 8.9±0.0a | 7.5±0.0b | 5.7±0.1c | 6.9±0.1d |
| Titrable acidity (% citric acid, FW) | 0.77±0.02c | 1.09±0.03ba | 1.06±0.02b | 1.17±0.11a |
| Reducing sugars (g glucose/100 g, FW) | 4.0±0.0a | 2.0±0.0c | 1.9±0.0d | 2.3±0.1b |
| Colour (surface) | ||||
| L | 21.5±4.6b | 21.4±1.0b | 24.0±1.8a | 22.5±1.2ab |
| a* | 10.8±3.6b | 14.8±1.1a | 15.1±1.3a | 15.4±1.0a |
| b* | –1.2±1.2a | –2.7±0.8b | –2.3±0.8b | –2.1±0.9ab |
| C* | 10.9±3.6b | 15.1±1.0a | 15.2±1.3a | 15.5±0.9a |
| h* | 352.5±3.4a | 349.5±3.3a | 351.3±3.1a | 352.2±3.4a |
Data are expressed as means±SD of three determinations. *Data are expressed as means±SD of ten determinations. Mean values in the same row with different letters are significantly different (p < 0.05) assessed by ANOVA followed by a Tukey test (p < 0.05).
Color is considered among the parameters that determine maturity. Elderberries present color variations between green and dark red as it matures due to the increased anthocyanin content [25]. Results of color were expressed through color space L *, a * and b * (CIELab System), chroma (C *) and hue (h) (Table 2). Significant differences (p < 0.05) were found in elderberries according to procedence. In general, L * (luminosity), a * and b * values indicate that fruit tended towards dark tones and presented tones between redish and blueish (with positive and negative values, respectively). Regarding the C * parameter, elderberry from Apurímac showed a significantly lower color intensity compared to the fruit from other procedures and h * values corresponded to tones between purple and purple red, with no significant differences between the fruit from different procedences. The obtained color parameters confirm the visual perception of color for the samples from the different procedences (Table 1; pictures displayed). Pearson correlations between physico-chemical characteristics and color C* parameters resulted in high positive correlation with titratable acidity (r = 0.92), and high negative correlation with reducing sugars (r = –0.93) and soluble solids (r = –0.83). Thus, darker fruit colors are indicative of ripeness or maturity stage, presenting high content of sugars and low acidity.
3.2Sugars and organic acids determined by HPLC
The results of the profile and content of sugars and organic acids most representative of elderberry from different high-Andean regions of Peru are presented in Table 3. The main sugars present in descending order of concentration were: glucose (16.9–22.4 mg/Kg FW), fructose (11.1–18.2 mg/Kg FW) and sucrose (0.05–0.31 mg/Kg FW). Glucose and fructose represented more than 99% of total sugars. The amounts found for these sugars were lower than those reported in European elderberry (33.3–42.6, 33.9–45.3 and 0.47–1.68 g/Kg FW) [6]. In terms of individual and total sugar contents significant differences (p < 0.05) were found depending on the procedence of the Andean elderberry; where elderberry from Apurímac stood out with the highest content of sugars. In terms of organic acids, the main ones found in descending order of concentration corresponded to: citric >malic >quinic >shikimic acids (2.85–5.52; 2.51–3.67; 0.72–1.42 and 0.08–0.10 mg/Kg FW, respectively). Also significant differents were found in the contents of organic acids present in the different procedence samples. In general, most samples presented only traces of quinic acid, with citric, malic or tartaric acid predominating. Citric and malic acids have been cited as the most prominent organic acids in berries and shikimic acid has been reported to be present in small quantities [6, 26]. To our knowledge, this is the first study reporting quinic acid in elderberry. Quinic acid is related to phenolic compounds such as chlorogenic acid and is generally a minor acid in fruits such as cherry, plum, citrus, strawberry and apple [27]. Elderberry from Apurímac, presented the lowest amount of total acids (6.88 mg/Kg), while, the content in the samples from other procedures, showed higher values in average ∼9.32 mg/Kg (but non-significant); the latter being superior to those reported by Veberic et al. [26] (4.48–6.38 mg/Kg). Thus, there are significant differences in the content of primary metabolites of elderberry in samples from different procedence. Andean elderberry at harvest tends to be less sweet and more acid compared to varieties from the northern hemisphere. When determining the maturity index (soluble solids/titrable acidity), elderberry samples from Apurímac presented the highest value (5.96) compared to the other regions (2.94–3.81), as a result of its higher soluble solids and lower acidity. These results could have been influenced by the climatic conditions the fruits were subjected to during pre-harvest. The acids, along with the sugars are determinants of the final taste of the fruits, and the sugar/acid ratio is widely used as an index of maturity [28]. In general, moderate, high and positive correlations were observed between the maturity index and soluble solids and reducing sugars (r = 0.70 and 0.94, respectively) and a high and inverse correlation with titratable acidity (r = –0.84).
Table 3
Main primary and secondary metabolites for Andean elderberries collected from four diferent high-land regions of Peru
| Region | ||||
| Compounds | Apurímac | Ayacucho | Cajamarca | Junín |
| Primary metabolites | ||||
| Sugars (g/Kg FW) | ||||
| Fructose | 18.2±0.2a | 11.1±0.4d | 14.7±0.4b | 12.5±0.1c |
| Glucose | 22.4±0.7a | 16.9±0.2c | 17.9±0.2b | 21.6±0.2a |
| Sucrose | 0.31±0.02a | 0.08±0.02c | 0.05±0.01c | 0.26±0.03b |
| Total | 40.9±0.6a | 28.2±0.2d | 32.6±0.6c | 34.4±0.2b |
| Organic acids (g/Kg FW) | ||||
| Citric acid | 2.85±0.12c | 4.68±0.10b | 5.52±0.55a | 5.27±0.28ab |
| Malic acid | 2.51±0.16c | 3.67±0.10a | 3.00±0.21b | 2.97±0.18b |
| Quinic acid | 1.42±0.08a | 1.16±0.11b | 0.72±0.03c | 0.74±0.10c |
| Shikimic acid | 0.10±0.0a | 0.10±0.0a | 0.08±0.0b | 0.08±0.0b |
| Total | 6.88±0.36b | 9.60±0.27a | 9.33±0.76a | 9.05±0.49a |
| Ratio total sugars/total acids | 5.96±0.39a | 2.94±0.11c | 3.51±0.21b | 3.81±0.22b |
| Secondary metabolites | ||||
| Total phenolic (mg GAE/g FW) | 3.2±0.2a | 2.8±0.1b | 2.5±0.1c | 3.3±0.2a |
| Total flavanoids (mg CE/g FW) | 0.25±0.01a | 0.15±0.01d | 0.18±0.01c | 0.21±0.01a |
| Total flavonoids (mg QE/g FW) | 0.43±0.03b | 0.34±0.02c | 0.37±0.02c | 0.76±0.02a |
| Total anthocyanins (mg CGE/g FW) | 0.99±0.04a | 0.59±0.04c | 0.45±0.04d | 0.74±0.04b |
Data are expressed as means±SD of three determinations. Mean values in the same row with different letters are significantly different (p < 0.05) assessed by ANOVA followed by a Tukey test (p < 0.05).
3.3Total phenolic compounds, flavanoids, flavonoids and anthocyanin contents
The TPC, TFA, TFO and TA contents of the samples from the different procedences are presented in Table 3, with values between 2.5–3.3 mg AGE/g; 0.15–0.25 mg CE/g; 0.34–0.76 mg QE/g and 0.45–0.99 mg C3GE/g, all in FW, respectively. Significant differences (p < 0.05) were found in all the evaluated characteristics, according to the procedure of Andean elderberry samples. TPC and TFO contents between 3.6 and 5.8 mg GAE/g FW and, 0.57 and 1.02 mg QE/g FW have been reported for American and European elderberries [24]. TPC, TFA and TFO expressed on a dry basis (27.7–33.6 mg AGE/g, 1.50–2.38 mg CE/g and 3.34–7.82 mg QE/g, Table 2) are close to those previously reported [9]. The highest amounts of TPC and TFA corresponded to elderberry from Apurímac and Junín with non-significant differences between them (p > 0.05), while TFO content was significantly higher (p < 0.05) for elderberry samples from Junín and TA for elderberry from Apurímac. In terms of percentage of participation of the TFA, TFO and TA with respect to the TPC, it was comprised between 5.3 and 7.8, 12.1 and 23.0 and, 18.0 and 30.7%, respectively. The largest share of TFO was from elderberry samples from Junín, while the TFA and TA contents for samples from Apurímac. The remaining phenolic compounds, calculated as follows: TPC- (TFO + TFA + TA), represented between 46.8 and 60.7% of the TPC, that belonged to other families of phenolic compounds not quantified spectrophotometrically. Thus, chromatographic identification and quantification is further reported in this study. TPC of the fruits evaluated had a high and positive correlation with the TA (r = 0.80), minor correlations were found with the TFA and TFO (r = 0.64 and 0.68, respectively). Sidor and Gramza-Michalowska [29], indicate that elderberry, has medicinal properties associated with the presence of polyphenols, wich are compounds with potential antioxidant properties. Finally, differences in primary and secondary metabolites found in different types of high Andean regions, could be related to the different biotic or abiotic stresses to which the fruits were exposed during their growth and development.
3.4UPLC-PDA analysis of non anthocyanins phenolic compounds and UPLC-qTof/MS-MS and LC-ESI/MS-MS analysis of anthocyanins
Elderberry has components with high biological activity, primarily polyphenols, such as flavonols, phenolic acids, proanthocyanidins and anthocyanins, which give the fruit its characteristic black-purple colour [30]. The cromatographic and spectral characteristics of phenolic compounds, including anthocyanins, for Andean elderberry from diferent regions of Peru are presented in Table 4. A total of 13 representative peaks of non-anthocyanin phenolics were detected in all elderberry samples evaluated. Depending on their absorption spectra, the compounds belonged to the families of hydroxycinnamic acids, flavanols, flavonols and flavones. Peaks 1, 5, 6 and 11 corresponded to the flavanols (flavan -3ols) and were quantified as catechin derivatives, the total was between 0.66 and 0.97 mg/g FW, highlighting elderberry samples from Apurímac and Junín. Flavonols were represented in peaks 4, 7, 8 and 10. Peak 8 was identified as rutin and the other peaks quantified as rutin derivatives; with contents that varied between 0.62 and 1.21 mg/g FW. Peaks 2 and 13 (chlorogenic acid derivatives) and 4 (p-coumaric acid derivative) (hydrocycinnamic acids), together summed amounts between 1.30 and 1.92 mg/g FW. The highest values of flavanols and hydroxycinnamic acids were for elderberry samples from Junín. Finally, the family of flavones (luteolin derivatives) was present in peaks 9 and 12 with amounts between 0.02 and 0.05 mg/g FW. The total sum of the non-anthocyanin phenolic compounds corresponded to 2.77 (Ayacucho berry samples) and 4.03 mg/g FW (Junín samples). Elderberry has been previously reported as a good source of flavonols and phenolic acids. Flavonols derived from elderberry occur as glycosides of rutin and glucose; moreover, acylated quercetins have also been reported [31]. In elderberry quantities of 0.28 and 0.38 mg/g FW of flavonols have been previously reported [30, 32]. With respect to phenolic acids, apart from flavonols, large amounts of phenolic acids have been reported. Fruits contained chlorogenic, crypto-chlorogenic and neochlorogenic acids (hydroxycinnamic acids) [24]. Total phenolic acids of 0.20 mg/100 g FW have been reported [33]. The total content of flavonols and hydroxycinnamic acids found in this study were superior to those reported in the literature. Flavan 3-ols, as catechin and epicatechin, have not been previously reported in elderberry. However, flavan-3-ols can also be found as oligomers and polymers of catechin and epicathechin and are known as condensed tannins (proanthocyanidins). Proanthocyanidins in elderberry has been reported in total quantities of 0.23 mg/g FW [34].
Table 4
Chromatographic and spectral characteristics of phenolics detected by UPLC-PDA of Andean elderberries collected from four diferent high-Andean regions of Peru
| Peak number | Retention time (min) | λmax (nm) | Compound assignment | Region | |||
| Amount (mg/g FW) | |||||||
| Apurímac | Ayacucho | Cajamarca | Junín | ||||
| 1 | 10.9 | 278.1 | Flavanol derivative | 0.36±0.01 | 0.31±0.06 | 0.23±0.04 | 0.21±0.01 |
| 2 | 15.4 | 324.7 | Hydroxycinnamic acid derivative | 1.12±0.03 | 1.25±0.05 | 1.51±0.21 | 1.80±0.05 |
| 3 | 18.6 | 341 | Flavonol derivative | 0.03±0.00 | 0.02±0.00 | 0.02±0.00 | 0.02±0.00 |
| 4 | 18.9 | 317.5 | Hydroxycinnamic acid derivative | 0.03±0.00 | 0.04±0.01 | 0.05±0.01 | 0.05±0.00 |
| 5 | 19.1 | 278.1 | Flavanol derivative | 0.23±0.03 | 0.15±0.01 | 0.15±0.02 | 0.17±0.00 |
| 6 | 20.0 | 279.3 | Flavanol derivative | 0.28±0.18 | 0.04±0.02 | 0.04±0.00 | 0.05±0.00 |
| 7 | 20.3 | 255.6, 352.8 | Flavonol derivative | 0.54±0.02 | 0.59±0.08 | 0.57±0.08 | 0.99±0.08 |
| 8 | 20.9 | 255.6, 354.0 | Rutin | 0.02±0.00 | 0.03±0.00 | 0.02±0.00 | 0.03±0.00 |
| 9 | 21.1 | 265.1, 346.9 | Flavone derivative | 0.02±0.00 | 0.06±0.07 | 0.01±0.00 | 0.02±0.00 |
| 10 | 21.6 | 254.4, 352.8 | Flavonol derivative | 0.05±0.00 | 0.05±0.00 | 0.05±0.01 | 0.11±0.01 |
| 11 | 21.8 | 254.4, 354.0 | Flavanol derivative | 0.18±0.00 | 0.20±0.02 | 0.19±0.02 | 0.42±0.03 |
| 12 | 22.6 | 263.9, 348.1 | Flavone derivative | 0.03±0.00 | 0.00±0.00 | 0.00±0.00 | 0.01±0.00 |
| 13 | 22.7 | 325.9 | Hydroxycinnamic acid derivative | 0.03±0.02 | 0.06±0.00 | 0.03±0.00 | 0.05±0.00 |
| Total | 2.92±0.14 | 2.81±0.06 | 2.85±0.40 | 4.05±0.03 | |||
Data are expressed as means±SD of three determinations. Flavanol derivatives were quantified as cathequin equivalents at 280 nm, hydroxycinnamic acid derivatives (peaks 2,13) were quantified as chlorogenic equivalents at 320 nm, flavone derivatives were quantified as luteonine equivalents at 360 nm, hydroxycinnamic acid derivatives (peak 4) were quantified as p-coumaric acid equivalents at 320 nm, flavonol derivatives were quantified as rutine equivalents at 360 nm.
Additionally, elderberry extracts were analyzed by UPLC-PDA at the wavelength of 520 nm, where a total of two peaks, corresponding to anthocyanins, were separated for all samples (results not shown). When the elderberry extracts were analyzed by UPLC-qTof/MS-MS, to identify the anthocyanins, in total four anthocyanins were separated (Fig. 1). Their spectral characteristics are presented in Table 5. The fragments obtained from the molecular mass of the four anthocyanins, indicated the presence of a single type of aglycone “cyanidine” (m/z = 287.0564, 287.0573). Peaks 1 and 3 (Fig. 1a), presented a M + (m/z) of 581.1517, with a M + = [C26H29O15]+, while peaks 2 and 4, presented a M + (m/z) of 449.1099, with one M+ = [C21H21O11]+. According to the spectral characteristics obtained and the comparison of the spectra with online libraries (PubChem online databases), peaks 1 and 3 corresponded to cyanidin 3-O-sambubioside, which presumably would be two isomers. Peak 4 shared the same characteristics and retention time of the cyanidin 3-O-glucoside standard, so it was identified as such; whereas peak 2 would be an isomer of the same molecule. The obtained results coincide with the literature, being glycosylated cyanidins (mono or di-glycosides) the most representative anthocyanins in elderberries. The most important anthocyanins corresponded to cyanidin 3-O-glucoside and cyanidin 3-O-sambubioside and in lower or traces concentrations: cyanidin 3-sambubioside 5-glucoside, cyanidin 3,5-diglucoside, pelargonidin 3-glucoside, cyanidin 3-rutinoside, pelargonidin 3-sambubioside and delphinidin-3-rutinoside have also been reported [29]. In elderberry alcoholic extracts, only cyanidin 3-O-glucoside and cyanidin 3-O-sambubioside have been reported [32]. When quantified by LC-ESI / MS-MS, total anthocynins were found in the range of 0.97 and 1.63 mg/g FW, highlighting the elderberry samples from Junín. Different works have reported values of total cyanidins in elderberry within the range of 3.3 and 12.63 mg/g FW [26, 29].
Fig.1
Representative full mass spectrum of anthocyanins: a) peaks 1 and 3 (6.17 and 6.81 min, respectively): cyanidin derivatives type cyanidin 3-O-sambubioside and b) peak 4 (6.84 min): cyanidin 3-O-glucoside and peak 3 (6.26 min): cyanidin derivative type cyanidin 3-O-glucoside.
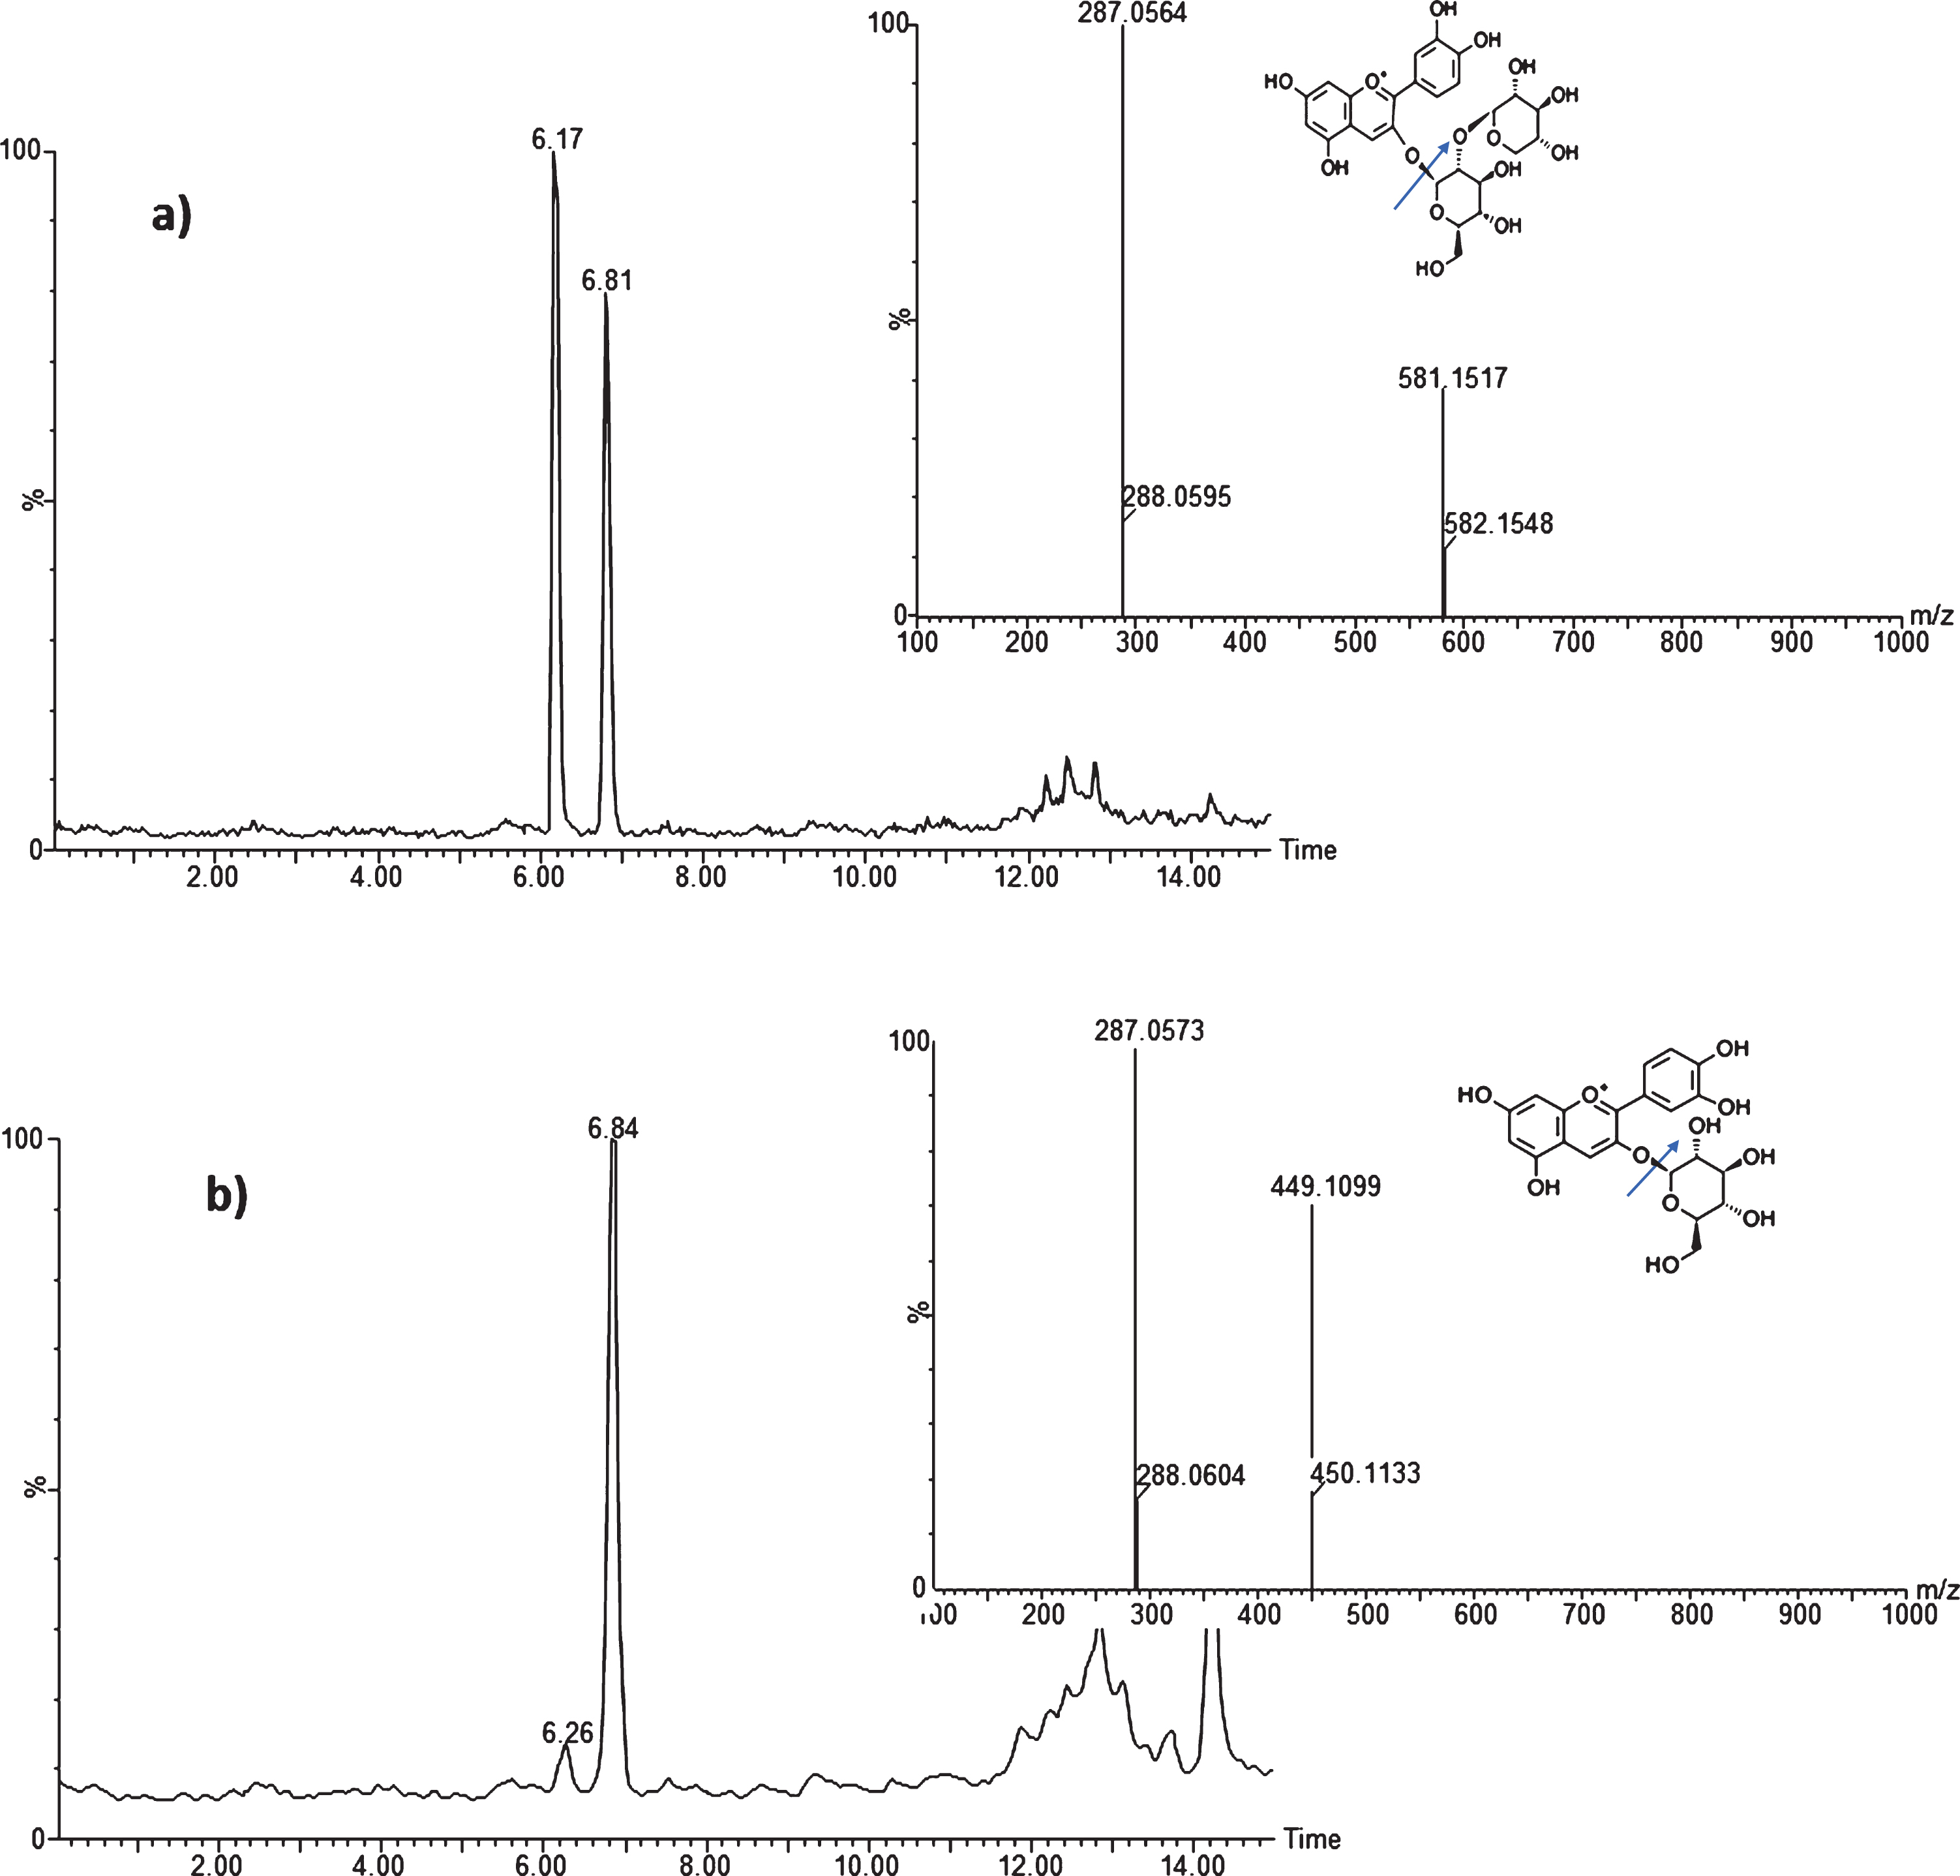
Table 5
Characteristics of anthocyanins detected by UPLC-qToF/MS-MS of Andean elderberries collected from four diferent high Andean regions of Peru
| Peak | Retention time (min) | M+(m/z) | Fragments ions (m/z) | Anthocyanin assignment/molecular formula (*) | Region | |||
| Amount (mg/g FW) | ||||||||
| Apurímac | Ayacucho | Cajamarca | Junín | |||||
| 1 | 6.17 s | 581.1517 | 287.0564 | Cyanidin derivative/[C26H29O15] | 0.36±0.15 | 0.37±0.02 | 0.25±0.05 | 0.41±0.23 |
| 2 | 6.26 | 449.1099 | 287.0573 | Cyanidin derivative/[C21H21O11] | 0.08±0.01 | 0.08±0.00 | 0.06±0.00 | 0.09±0.01 |
| 3 | 6.81 s | 581.1517 | 287.0564 | Cyanidin derivative/[C26H29O15] | 0.31±0.14 | 0.30±0.02 | 0.20±0.05 | 0.35±0.22 |
| 4 | 6.84 | 449.1099 | 287.0573 | Cyanidin 3-O-glucoside/[C21H21O11] | 0.64±014 | 0.66±0.08 | 0.46±0.10 | 0.77±0.32 |
| Total | 1.39±0.43 | 1.41±0.12 | 0.97±0.20 | 1.63±0.78 | ||||
(*) Quantified as cyanidin 3-O-glucoside by LC-ESI/MS-MS. Data are expressed as means±SD of three determinations.
3.5Antioxidant activity and in vitro enzymes inhibition
The antioxidant activity of fruits and vegetables have been evaluated in vitro with methods based on different reaction mechanisms. In this research, three in vitro methods were used to determine the antioxidant activity of elderberry from different Andean Regions of Peru. The antioxidant activity determined by ABTS, FRAP and ORAC asays were within the range of 26.4 to 37.3; 27.3 to 34.1 and 75.9 to 113.1 μmol TE/g FW respectively (Table 6). Significant differences (p < 0.05) were found according to the procedence of the samples. Elderberry from Junín presented the highest ORAC value; while from Apurímac presented the highest values of ABTS and FRAP. ABTS and ORAC values expressed in DW (272.2–335.4 and 744.3–1167.4 μmol TE/g, respectively) were consistent to previously ABTS reported value (303.1 μmol TE/g DW) [9], but ORAC values were lower (361.3 μmol TE/g DW). High correlations were found between FRAP vs TP and TA (r = 0.91 and 0.87 respectively), as well as between ORAC vs TFO (r = 0.90). Others correlations between different antioxidant activity values and TP, TFA, TFO and TA were moderate or lower. These results suggest that antioxidant activity in elderberries are attributed to particular structures and functional groups of their components and how they react to the different reaction mechanisms of the assays used, where additive, synergistic or antagonistic effects could be presented. High correlations were found between FRAP vs TP and TA (r = 0.91 and 0.87 respectively), as well as between ORAC vs TFO (r = 0.90). Other correlations between different antioxidant activity values and TP, TFA, TFO and TA were moderate or lower. These results suggest that antioxidant activity in elderberries could be attributed mainly to particular structures and functional groups of their components. In addition, antioxidants might react differently in the different reaction mechanisms assayed, with possible additive, synergistic or antagonistic effects.
Table 6
Antioxidant activity and IC50 values for in vitro α-amylase, α-glucosidase, lipase and ACE inhibitory activities for Andean elderberries collected from four diferent high Andean regions of Peru
| Region | ||||
| Apurímac | Ayacucho | Cajamarca | Junín | |
| Antioxidant capacity (μmol TE/g FW) | ||||
| ABTS | 37.3±1.7a | 35.3±1.3a | 29.7±1.8b | 26.4±0.7c |
| FRAP | 34.1±0.7a | 30.1±0.5b | 27.3±2.3c | 33.9±1.0a |
| ORAC | 96.9±6.4b | 75.9±2.4c | 83.1±4.9c | 113.1±5.7a |
| IC50 values | ||||
| α-amylase (mg) | 0.68±0.03b | 1.05±0.08a | 1.11±0.11a | 0.77±0.03b |
| α-glucosidase (mg) | 0.17±0.01bc | 0.19±0.01ab | 0.20±0.01a | 0.16±0.01c |
| Lipase (μg) | 29.3±2.3b | 33.6±4.7b | 58.9±3.2a | 11.9±2.3c |
| ACE-I (μg) | 105.8±0.4a | 93.9±1.3b | 94.0±5.5b | 59.4±1.0c |
Data are expressed as means±SD of three determinations. Mean values in the same row with different letters are significantly different (p < 0.05) assessed by ANOVA followed by a Tukey test (p < 0.05).
The α-amylase and α-glucosidase, lipase and ACE-I inhibitory assays were used to evaluate the antihyperglycemic, antiobesity and antidiabetic potential of the different berry samples. IC50 values are shown in Table 6. All the samples showed the inhibition of all the enzymes studied, with significant differences (p < 0.05). A low IC50 value indicates that a low amount of sample is required to inhibit the enzymes under study. The α-amylase and α-glucosidase and inhibitory activities were in the range of 0.68 to 1.11 and, of 0.16 to 0.17 mg, respectively where the samples from Junín (0.68 and 0.16 mg) and Apurímac (0.77 and 0.17 mg) stood out. Two biotypes (Rosalia and Leiva) of Andean lucuma fruit at edible ripeness, reached 86.7 and 64.5% inhibition of the enzyme α-amylase and a 59.3 and 48.1% inhibition of the enzyme α-glucosidase with 2 mg and 10 μg of sample, respectively [35]. Andean elderberry samples showed better results of inhibition of α-amylase enzyme, but not for α-glucosidase, in comparison to lucuma fruit. A good and negative correlation was found between the IC50 of α-amylase with TP, TFA and TA (r = –0.79, –0.80, –0.88, respectively), and only a negative and good correlation was found between IC50 of α -glucosidase and TP (r = –0.80). It has been reported that cyanidin 3-O-glucoside has a better inhibitory effect against amylase than other cyanidins such as cyanidin 3 galactoside and cyanidin 3,5-diglucoside [36]. According to the results obtained, the presence of anthocyanins, within the total phenolic compounds of Andean elderberry, as well as the TFA (related to proanthocyanidins / condensed tannins) may have influenced the obtained results.
The IC50 for the lipase inhibitory activity for the different elderberry samples were in the range of 11.9 to 59.8 μg, these values being much lower than the IC50 values for α-amylase and α-glucosidase. Elderberry samples from Junín reported the lowest value. When correlations were established, it was found that IC50 for lipase presented a high and negative correlation with TP and TFO (r = –0.85 and 0.77, respectively) and moderate correlation with TA (r = –0.63). Phenolic compounds isolated from different vegetable sources such as flavonoids, hydroxycinnamic and hydroxybenzoic acids have been reported as phytochemicals that inhibit pancreatic lipase enzyme [37, 38]. Regarding the IC50 values for the inhibition of the ACE-I enzyme, values from 59.4 and 105.8 μg were found. Again, elderberry samples from Junín presented the lowest value. Only a high correlation was found between IC50 values and TFO (r = 0.86). In this regard, many studies suggest the beneficial effect of elderberry components on cardiovascular diseases with the reduction of blood pressure [29].
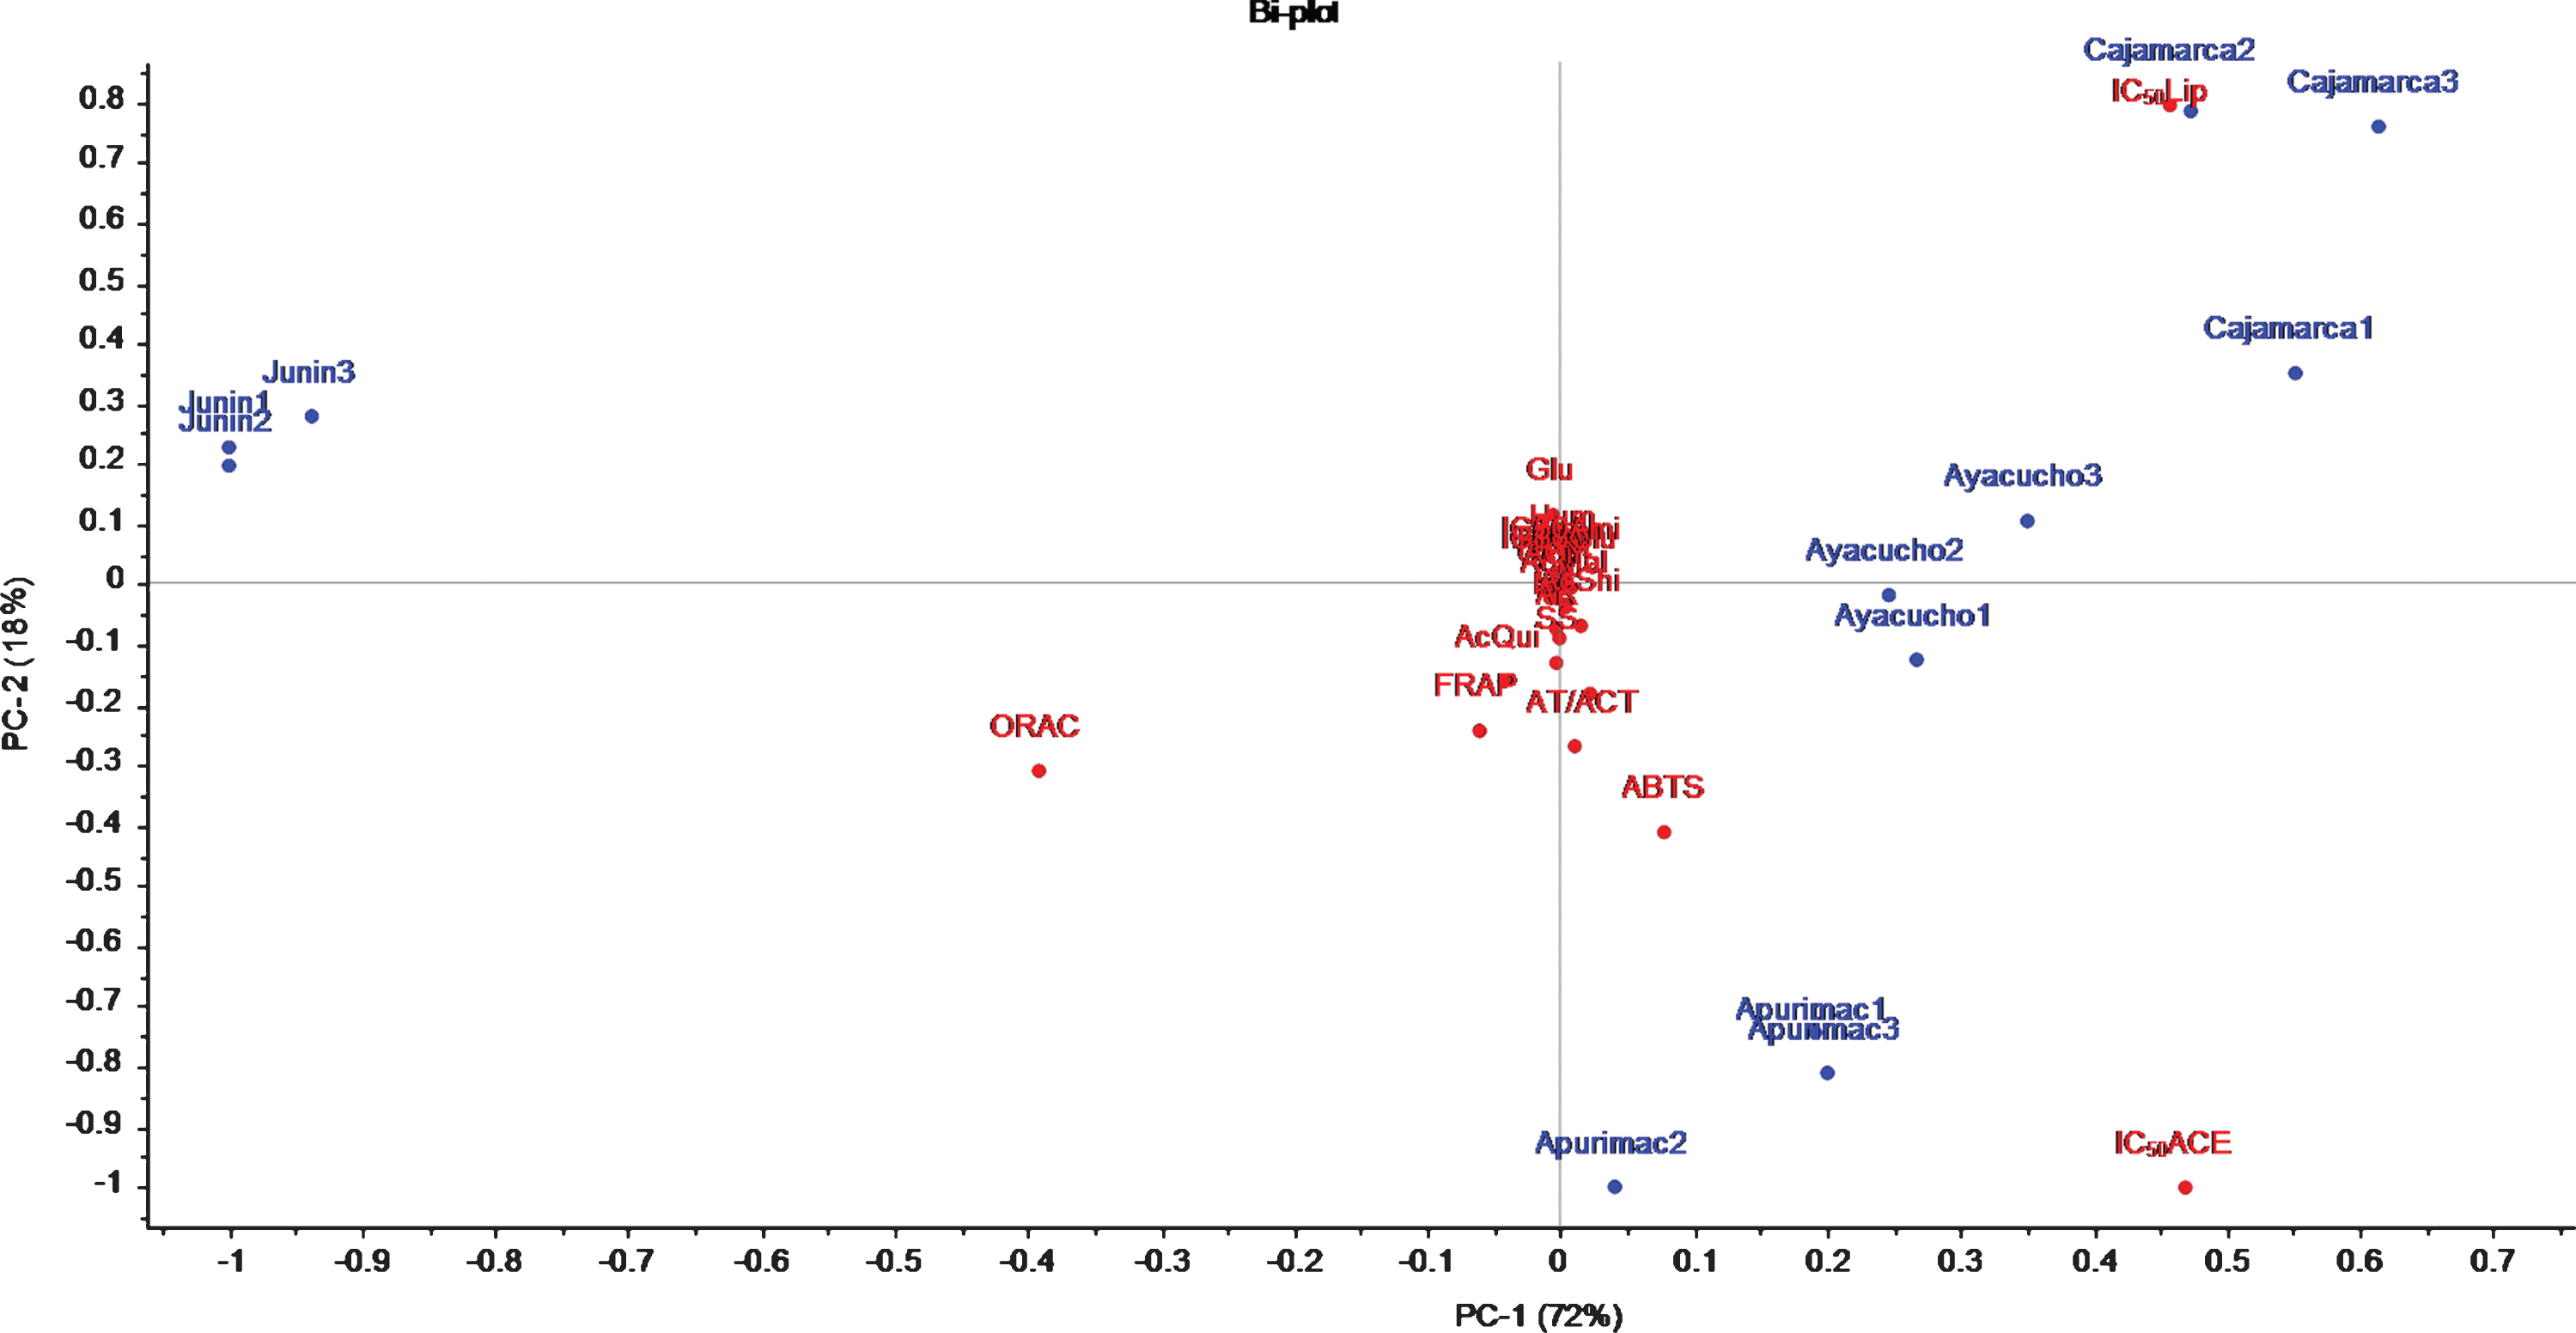
Finally, an evaluation of all variables was carried out with principal component analysis (PCA). PCA is a good visualization tool when small samples (eldeberry from different regions) and many variables (physical-chemical characteristics, primary and secondary metabolites, antioxidant activities and IC50 values) are simultaneously analyzed. A biplot is pre-sented in Fig. 2. Sample scores and correlation loadings were overlaid. With two main components, 90% of the total variation could be explained with this model, which is quite substantial. From the biplot, two important features can be clearly observed: (1) In the first component (x axis), it is possible to discriminate the samples from Junín with respect to the rest of the samples. Samples from Junín stood out due to its highest values of ORAC and significantly lower values of IC50 lipase and IC50 ACE-I, (2) the second component (Y axis) discriminated samples from Apurímac and Cajamarca, where the first correlates with low values of IC50 ACE-I and the second with low values of IC50 lipase and (3) all the other evaluated variables did not show much variability among the samples, thus did not contribute to discrimation of the samples.
Fig.2
Explorative data analysis: principal component analysis (PCA) for the first two factors. Where: SS = soluble solids, pH = pH, TA = titrable acidity, RS = reducing sugars, Glu = glucose, Fruc = fructose, Suc = Sucrose, AcQui = quinic acid, AcShi = shikimic acid, AcCit = citric acid, AcMal = malic acid, AT/ACT = ratio total sugar/total acid, TPC = total phenolic compounds, TFA = total flavanoids, TFO = total flavonols, TA = total anthocyanins, ABTS = ABTS antioxidant activity, ORAC = ORAC antioxidant activity, FRAP = FRAP antioxidant activity, IC50Lip = IC50 lipase, IC50 ACE = IC50 enzyme converting angiotesine, IC50Glu = IC50 α-glucosidase and IC50Amil = IC50 α-amylase. Junín, Cajamarca, Ayacucho and Apurímac = Andean Regions of Peru.
4Conclusions
The present investigation has generated important information related to the quality related parameters, composition of main primary (sugars and organic acids) and secondary (phenolic compounds) metabolites, as well as in vitro bioactive properties (antioxidant, antidiabetic, antihypertensive and antiobesity) of elderberry samples from different production areas of the Andean Region of Peru. All the Andean elderberry samples displayed important quantities of the analysed metabolites and evaluated in vitro bioactivities, however, significant differences were found according to the Region of procedence. Thus, eldeberry samples from Apurímac presented a higher content of sugars and lower content of organic acids in comparison to the other procedences. Liquid chromatography analysis indicated that elderberry samples from Junín presented the highest content of phenolic compounds being the main representative families flavonols, hydroxycinnamic acids and anthocyanins. The most important anthocyanins of Andean elderberry were of the cyanidin type, cyanidin 3-O-glucoside and cyanidin 3-O-sambubioside were identified; as well as their respective isomers.
Regarding the evaluated in vitro bioactive properties, elderberry samples from Apurímac and Junín presented the lowest values of IC50 for the inhibition of α-amylase and α-glucosidase, while, for the inhibition of lipase and ACE-I, elderberry samples from Junín. Andean elderberries could be an important natural source of phenolics with potential to control obesity, hypertension and hyperglycemia. Thus, it is necessary to deepen studies related to these health-related properties. Based on the results of this research, Andean elderberry has the potential to be considered as a fruit with health-promoting properties related to hyperglycemia and obesity.
Conflict of interest
The authors declare no conflict of interest.
Funding
The authors report no funding.
Acknowledgments
This work was supported by the Consejo Nacional de Ciencia y Tecnología- Cienciactiva (CONCYTEC-Cienciactiva, Peru), SUBVENCIÓN No 177-2015-FONDECYT and Programa Nacional de Innovación para la Competitividad y Productividad (Innóvate Perú), Contrato 314-PRODUCE-PNICP-EC-2014.
References
[1] | Atala E , Vásquez L , Speisky H , Lissi E , López-Alarcón C . Ascorbic acid contribution to ORAC values in berry extracts: An evaluation by the ORAC-pyrogallol red methodology. Food Chem. (2009) ;113: :331–335. |
[2] | Netzel M , Netzel G , Tian Q , Schwartz S , Konczak I . Native Australian fruits – a novel source of antioxidants for food. Innov. Food Sci. Energ. Technol. (2007) ;8: :339–346. |
[3] | Kancheva VD , Kasaikina OT . Bio-antioxidants - A chemical base of their antioxidant activity and beneficial effect on human health. Curr. Med. Chem. (2013) ;20: :4784–4805. |
[4] | Hügel HM , Jackson N , May B , Zhang AL , Xue CC . Polyphenol protection and treatment of hypertension, Phytomedicine. (2016) ;23: :220–231. |
[5] | Mikulic-Petkovsek M , Schmitzer V , Slatnar A , Stampar F , Veberic R . Composition of sugars, organic acids, and total phenolics in 25 Wild or cultivated berry species. J. Food Sci. (2012) ;77: :1064–1070. |
[6] | Mikulic-Petkovsek , Ivancic A , Schmitzer V , Veberic R , Stampar F . Comparison of major taste compounds and antioxidative properties of fruits and flowers of different Sambucus species and interspecific hybrids. Food Chem. (2016) ;200: :134–140. |
[7] | Del Rio D , Rodriguez-Mateos A , Spencer JPE , Tognolini M , Borges G , Crozier A . Dietary (Poly)phenolics in human health: Structures, bioavailability, and evidence of protective effects against chronic diseases. 2013 Antioxid. Redox Signal. . (2013) ;18: :1818–1892. |
[8] | Bhaswant M , Shafie SR , Mathai ML , Mouatt P , Brown L . Anthocyanins in chokeberry and purple maize attenuate diet-induced metabolic syndrome in rats. Nutrition . (2017) ;41: :24–31. |
[9] | Chirinos R , Pedreschi R , Rogez H , Larondelle Y , Campos D . Phenolic compound contents and antioxidant activity in plants with nutritional and/or medicinal properties from the Peruvian Andean región. Ind. Crop Prod. (2013) ;47: :145–152. |
[10] | AOAC (Association of Official Analytical Chemists, US). Official methods of analysis of AOAC International. Ed. HorwitzW.. 18 ed. Washington, US. (2007) . |
[11] | Miller G . Use of Dinitrosalicylic Acid Reagent for Determination of Reducing Sugar. Anal. Chem. (1959) ;31: :426–428. |
[12] | Pérez A , Olías R , Espada J , Olías J , Sanz C . Rapid determination of sugars, nonvolatile acids and ascorbic acid in strawberry and other fruits. J. Agric. Food Chem. (1997) ;45: :3545–3549. |
[13] | Campos D , Aguilar-Galvez A , Pedreschi R . Stability of fructooligosaccharides, sugars and colour of yacón (Smallantus sonchifolius) roots during blanching and drying. Int. J. Food Sci. Technol. (2016) ;51: :1177–1185. |
[14] | Aguilar-Galvez A , Guillermo A , Dubois-Dauphin R , Campos D , Thonart P . The influence of growth conditions on enterocin-like production by Enterococcus faecium CWBI-B1430 and Enterococcus mundii CWBI-B1431 isolates from artisanal Peruvian cheeses. Ann. Microbiol. (2011) ;61: :955–964. |
[15] | Singleton V , Rossi J . Colorimetry of total phenolics with phosphomolybdic-phosphotungstic acid reagents. Am. J. Enol. Vitic. (1965) ;16: :144–158. |
[16] | Delcour JA , Janssens de varebeke D . A new colourimetric assay for flavonoids in pilsner beers. J. Inst. Brewing. (1985) ;9: :37–40. |
[17] | Chang CC , Yang MH , Wen HM , Chern JC . Estimation of total flavonoid content in propolis by two complementary colorimetric methods. J. Food Drug Anal. (2002) ;10: :178–182. |
[18] | Giusti MM , Wrolstad RE . Anthocyanins Characterization and measurement with UV-Visible Spectroscopy. In: Wrolstad,R.E.(Ed.), Current Protocols in Food Analytical Chemistry. John Wiley & Sons, New York. (2001) . |
[19] | Arnao M , Cano A , Acosta M . The hydrophilic and lipophilic contribution to total antioxidant activity. Food Chem. (2003) ;73: :239–244. |
[20] | Benzie IF , Strain JJ . The ferric reducing ability of plasma (FRAP) as a measure of “antioxidant power”: the FRAP assay. Anal. Biochem. (1996) ;239: :70–76. |
[21] | Ranilla LG , Kwon YI , Apostolidis E , Shetty K . Phenolic compounds, antioxidant activity and in vitro inhibitory potential against key enzymes relevant for hyperglycemia and hypertension of commonly used medicinal plants, herbs and spices in Latin America. Bioresour Technol . (2010) ;101: :4676–4689. |
[22] | Nakai M , Fukui Y , Asami S , Toyoda-Ono Y , Iwashita T , Shibata H , Mitsunaga T , Hashimoto F , Kiso Y . Inhibitory effects of oolong tea polyphenols on pancreatic lipase in vitro. J. Agric. Food Chem. (2005) ;53: :4593–4598. |
[23] | Chirinos R , Ochoa K , Aguilar-Galvez A , Carpentier S , Pedreschi R , Campos D . 2018. Obtaining of peptides with in vitro antioxidant and angiotensin I converting enzyme inhibitory activities from cañihua protein (Chenopodium pallidicaule Aellen). J. Cereal SCi. (2018) ;83: :139–146. |
[24] | Lee J , Finn CE . Anthocyanins and other polyphenolics in American elderberry (Sambucus canadensis) and European elderberry (S.nigra) cultivars. J. Sci. Food Agric. (2007) ;87: :2665–2675. |
[25] | Atkinson MD , Atkinson E . Sambucus nigra L. J. Ecol. (2002) ;90: :895–923. |
[26] | Veberic R , Jakopic J , Stampar F . Flavonols and anthocyanins of elderberry fruits (Sambucus nigra L). Acta Horticulturae. (2009) ;841: :611–614. |
[27] | Heleno S , Martins A , Queiroz M , Ferreira I . Bioactivity of phenolic acids: Metabolites versus parent compounds: A review. Food Chem. (2015) ;173: :501–513. |
[28] | Eskin NAM , Hoehn E . Fruits and vegetables. In EskinNAM, ShahidiF. (Eds). Biochemistry of foods. Third ed. Elsevier. Amsterdam, Netherland. (2013) , pp. 49–126. |
[29] | Sidor A , Gramza-Michalowska A . Advanced research on the antioxidant and health benefit of elderberry (Sambucus nigra) in food - a review. J. Funct. Foods. (2015) ;18: :941–958. |
[30] | Anton AM , Pintea AM , Rugina DO , Scont ZM , Hanganu D , Vlase L , Benedec D . Preliminary studies on the chemical characterization and antioxidant capacity of polyphenols from Sambucus sp. Dig. J. Nanomater. Biostruct. (2013) ;8: :973–980. |
[31] | Christensen LP , Kaack K , Fretté XC . Selection of elderberry (Sambucus nigra L.) genotypes best suited for the preparation of elderflower extracts rich in flavonoids and phenolic acids. Eur. Food Res. Technol. (2008) ;227: :293–305. |
[32] | Dawidowicz AL , Wianowska D , Baraniak B . The antioxidant properties of alcoholic extracts from Sambucus nigra L. (Antioxidant properties of extracts). LWT. (2006) ;39: :308–315. |
[33] | Ochmian I , Oszmiański J , Skupień K . Chemical composition, phenolics, and firmness of small black fruits. J. Appl. Bot. Food Qual. (2009) ;83: :64–69. |
[34] | Wu X , Gu L , Prior RL , McKay S . Characterization of anthocyanins and proanthocyanidins in some cultivars of Ribes, Aronia, and Sambucus and their antioxidant capacity. J. Agric. Food Chem. (2004) ;52: :7846–7856. |
[35] | Fuentealba C , Gálvez L , Cobos A , Olaeta J , Defilippi B , Chirinos R , Campos D , Pedreschi R . , Characterization of main primary and secondary metabolites and in vitro antioxidant and antihyperglycemic properties in the mesocarp of three biotypes of Pouteria lucuma . Food Chem. (2016) ;190: :403–411. |
[36] | Akkarachiyasit S , Charoenlertkul P , Yibchok-anun S , Adisakwattana S . Inhibitory activities of cyanidin and its glycosides and synergistic effect with acarbose against intestinal α-glucosidase and pancreatic α-amylase. Int. J. Mol. Sci. (2010) ;11: :3387–3396. |
[37] | Yun JW . Possible anti-obesity therapeutics from nature - A review. Phytochemistry. (2010) ;71: :1625–1641. |
[38] | Buchholz T , Melzig MF . Polyphenolic Compounds as Pancreatic Lipase Inhibitors. Planta Med. (2015) ;81: :771–783. |

