
Bioavailability of wild blueberry (poly)phenols at different levels of intake
Abstract
BACKGROUND: Data from human intervention studies have highlighted potential cardiovascular benefits of blueberry (poly)phenols. However, such biological effects are dependent on their bioavailability and, as such, information on the absorption, metabolism and excretion of such compounds is necessary.
OBJECTIVE: To investigate whether the bioavailability of blueberry (poly)phenols is intake-dependent, a group of nine healthy volunteers consumed three wild blueberry drinks containing 766 mg (lower), 1278 mg (medium) and 1791 mg (higher) total (poly)phenols, corresponding to 34, 56 and 80 g, respectively, freeze-dried blueberry powder.
METHODS: Plasma levels of (poly)phenol metabolites were assessed at baseline and at 1, 2, 4 and 6 hours post-consumption, using UPLC-Q-TOF mass spectrometry.
RESULTS: Twenty-three phenolic acid metabolites were quantified in plasma after blueberry consumption. Increases in plasma (poly)phenol metabolites were observed in all the interventions tested. The area under the curve of the concentration over time (AUC) significantly increased when comparing the lower and higher (poly)phenol interventions. Linear dose-response regressions were obtained for 11 metabolites, while the plasma concentration of the remaining 12 metabolites was not affected by increasing amounts of (poly)phenols in the blueberry interventions.
CONCLUSION: Absorption and metabolism of blueberry (poly)phenols are not exclusively intake-dependent at the amounts tested, evidencing a complex metabolic fate of these compounds.
1Introduction
Blueberries are a well-known source of flavonoids and (poly)phenols. The major group of (poly)phenols present in blueberries are anthocyanins, followed by proanthocyanidins, flavonols and chlorogenic acids [1–7]. In recent years, blueberries have received much attention due to their positive role in human health and disease prevention [8]. For example, blueberry consumption has been shown to improve endothelial function in young healthy men and in people with metabolic syndrome [9, 10], and decrease blood pressure and arterial stiffness in pre- and hypertensive postmenopausal women and people with the metabolic syndrome [11, 12]. Increasing evidence also suggests that the high polyphenol content of berries may be responsible for their beneficial effects [8, 9, 13–18].
Recent work suggests that the bioavailability of berry (poly)phenols is higher and more complex than previously thought [9, 19–21]. Highly unstable anthocyanins are degraded into smaller compounds as early as 1 hour post-consumption, before or after being absorbed in the small intestine, leading to a vast array of phenolic metabolites that can be glucuronidated, sulfated and/or methylated and circulate in much higher concentrations than the structurally related anthocyanin metabolites [19, 22, 23]. Many of the (poly)phenols present in berries are not absorbed in the small intestine and they reach the colon intact, where they are degraded by the gut microbiota into smaller phenolic metabolites that are absorbed, metabolized and appear in circulation at later timepoints[9, 19, 23].
Although there is scientific evidence showing that different (poly)phenol levels can affect the magnitude of health outcomes [12, 24–29], most of these studies included only two levels of (poly)phenol amounts, limiting the evaluation of dose-response relationships. Furthermore, most studies highlight the health benefits without investigating (poly)phenol bioavailability in a dose-response manner, so it is crucial to understand how (poly)phenol dosage can affect the metabolism and disposition of these compounds in humans. Limited work exists on the impact of different levels of intake on the kinetics of (poly)phenol metabolites. Some work has been conducted with tea flavanols, showing that there seems not to be a linear response between catechin metabolites and the ingested amount of tea [30, 31]. A dose-response was found for the area under the curve (AUC) of catechin metabolites after green tea intake but only when comparing the low with medium intake levels, suggesting that saturation might occur between medium and high levels of intake [31]. Other works have reported even a decrease of (poly)phenol metabolites, such as pelargonidin-O-glucuronide, after ingestion of 40 g of a freeze-dried strawberry powder when compared to 10 and 20 g of intake [32]. Phenolic compounds such as alkylresorcinols have shown to display a dose-response in plasma and urine after consumption of whole-grain [33], however the range tested in this study was between 33 and 131 mg, so it is unknown whether higher amounts of wholegrain consumption may lead to a saturation in alkylresorcinol absorption, metabolism and excretion. Rubio et al. showed that the concentrations of hydroxytyrosol metabolites after three levels of olive oil supplementation were significantly increased when compared to baseline, but no differences between the medium and highest levels of intake were found [34].
We have recently reported on the effects of ingesting different amounts of wild blueberry (poly)phenols on vascular function in healthy volunteers [9]. In this work, we provide additional information on the absorption and metabolism of wild blueberry (poly)phenols in plasma after intake of different amounts of wild blueberry.
2Methods
2.1Study design
A detailed description of the study design and the characteristics of the study population have been published elsewhere [9]. Briefly, a randomized, double-blind, crossover, controlled intervention trial was performed in 9 healthy young men between 18 to 40 years old. Volunteers were asked to consume a blueberry drink consisting of a freeze-dried wild blueberry powder dissolved in water on three different days separated by one week (washout period). Before the intervention day, volunteers were asked to follow a 24 h low polyphenol diet. On arrival at the Nutrition Unit, subjects rested for 30 minutes in a quiet, temperature controlled room before they were cannulated and blood samples were collected in the fasted state and at 1, 2, 4, and 6 h after consumption of each intervention. Blood samples were drawn into EDTA-containing vials, and immediately centrifuged at 1700 g for 10 minutes at 4°C. Plasma was collected, supplemented with 2% formic acid and immediately stored at –80°C analysis. All studies were conducted according to the guidelines laid down in the Declaration of Helsinki and all procedures involving human subjects were approved by the University of Reading Research Ethics Committee (ref: 06/37). The trial was register in trialgovs.com (NCT01292954).
2.2Blueberry-containing test materials
Freeze-dried wild blueberry powder was kindly supplied by the Wild Blueberry Association of North America (WBANA, Maine, US). Freeze-dried wild blueberry powder was stored at –20°C until consumption. Volunteers consumed either a blueberry drink containing 34, 56 or 80 g freeze-dried blueberry powder dissolved in 500 ml water, equivalent to 240, 400 or 560 g of fresh blueberry, and containing 766 mg (low), 1278 mg (medium) and 1791 (high) mg of total (poly)phenols. Drinks contained 310, 517 and 724 mg of total anthocyanins; 137, 228 and 320 mg of total procyanidins, and 273, 455 and 637 mg of chlorogenic acid, respectively. Small amounts of quercetin, caffeic, p-coumaric and ferulic acid were also present in the drinks [9].
2.3Materials
All individual flavonoid and phenolic acid standards were obtained from Sigma-Aldrich Co. Ltd (Poole, UK) or Extrasynthese (Genay, France). The chemical structures of these compounds have been previously presented [23]. Water, methanol, acetic acid and acetonitrile (HPLC grade) were purchased from Fisher Scientific (Loughborough, UK). HPLC columns were from Hichrom (Reading, UK). β-glucuronidase and sulfatase (Helix pomatia, Type H1) was purchased from Sigma-Aldrich Co Ltd (Poole, UK). Oasis HLB solid phase extraction cartridges were purchased from Waters (Elstree, UK). Unless otherwise stated, all chemicals and reagents were obtained from Sigma-Aldrich Co Ltd (Poole, United Kingdom) or Fisher Scientific (Loughborough, United Kingdom).
2.4Plasma analysis of (poly)phenol metabolites
Plasma flavonoid and phenolic acid analysis was performed using enzymatic treatment with β-glucuronidase and sulfatase, followed by solid phase extraction and LC-Q-TOF-MS analysis as previously described [9].
2.5Statistical analysis
The maximum concentration in plasma (Cmax) and the time needed to reach Cmax (Tmax), as well as the area under the plasma curve over time (AUC) were calculated using Microsoft Excel. The statistical significance of these parameters was determined for each metabolite using paired t-tests between each (poly)phenol amounts, except for benzoic and isoferulic acids in which the Wilcoxon test was used, due to unequal variances and/or non-normal distribution. The total AUC was calculated by adding the plasma concentrations of 23 quantified compounds for each volunteer and statistical significances were evaluated using paired t-tests. Significance was defined as p < 0.05, with p-values represented in the table 1 as follows: *p = 0.01–0.05, **p = 0.001–0.01, ***p < 0.001.
Two-way ANOVA was used to compare the concentration of each metabolite in plasma for each timepoint in plasma to the baseline within each treatment and post-hoc analysis was carried out using the Bonferroni test. Significant values were marked as *, # and § for the low, medium and high (poly)phenol intake, respectively.
Linear regression analysis was performed between (poly)phenol amounts supplied in each intervention and respective average AUC, yielding regression equations and corresponding R2 values. All statistical analysis was performed using GraphPad Prism version 5.00 for Windows (GraphPad Software, San Diego, CA, www.graphpad.com).
3Results
3.1Plasma kinetics of blueberry (poly)phenols
A total of 32 compounds were detected in the plasma of volunteers who consumed different amounts of blueberry (poly)phenols, as previously reported [9]. However, 9 of them were below the LOQ so their kinetics will not be presented here. The maximum concentration detected in plasma (Cmax) ranged between 11 and 4874 nM, 19 and 5169 nM and 24 and 5456 nM for the lower, medium and higher intakes, respectively (Table 1). The highest Cmax was achieved for hippuric acid in all the interventions and the lowest Cmax was detected for m-coumaric acid in the higher level of intake and kaempferol for the lower and medium (poly)phenol amounts. Cmax of dihydroferulic and ferulic acids at the lowest level of intake were significantly lower than Cmax at the medium and highest levels of intake (Table 1). On the other hand, benzoic acid had a higher Cmax for the lower intake level which is likely due to the high amount of these compounds detected in two volunteers. No significant differences in terms of Cmax were detected when comparing the medium and higher levels of (poly)phenols.
The time that each plasma metabolite reached their Cmax (Tmax) varied between 1.5 h for the lower intake and 2 h for the medium and higher intake regimens and 6 h for all the interventions (Table 1), but they were not statistically significant.
The area under the curve of plasma concentration over time (AUC) was calculated for each metabolite between 0 and 6 h and ranged between 50 and 13250 nM*h, 74 and 14581 nM*h and 103 and 15533 nM*h for the lower, medium and higher intake of blueberry (poly)phenols (Table 1). Dihydroferulic, ferulic and isoferulic acids displayed a significant increase in AUC when comparing lower and higher intake of wild blueberry (poly)phenols. The sum of plasma AUC of the 23 metabolites was calculated for each volunteer and statistical significance was achieved when comparing the lower (32.6 ± 5.3 μM*h) and higher blueberry intakes (39.8 ± 5.7 μM*h) (Fig. 1).
The plasma curves of ten selected compounds are represented in Fig. 2. 2,5-Dihydroxybenzoic acid, vanillic acid, homovanillic acid, 3–(3-hydroxyphenyl)-propionic acid, 3–(4-hydroxy-3-methoxyphenyl)propionic acid (dihydroferulic acid), ferulic acid, isoferulic acid, caffeic acid, hippuric acid and α-hydroxyhippuric acid had plasma concentrations significantly higher after wild blueberry intake for at least one of the interventions when compared to baseline values (p < 0.05). Despite the fact that most compounds increased their plasma concentration after blueberry intake (Fig. 2), when comparing the concentration post-consumption with the baseline not all compounds were significantly increased due to the large inter-individual variability. When compared to baseline, caffeic acid concentration was significantly higher at 4 h for both the medium and higher groups and at 6 h but only for the higher (poly)phenol dose (Fig. 2A). 2,5-dihydroxybenzoic acid reached significantly higher plasma concentrations at 2, 4 and 6 h for the medium dose but only at 6 h for the higher intake group (Fig. 2B). Homovanillic acid was significantly elevated after 6 h but only in the medium and higher intervention groups (Fig. 2C). Vanillic acid reached significance after 1, 2, 4 and 6 h for all the treatments tested (Fig. 2D). Ferulic acid plasma concentration was higher at 1 and 2 h for all the dosages but at 4 h only for the medium and higher levels of intake (Fig. 2E). The significance for isoferulic acid was reached at 1 and 2 h for the medium and higher groups and at 4 h for the higher group (Fig. 2F). Dihydroferulic acid had significantly higher plasma concentration at 4 and 6 hours for the higher group but only significant at 4 h for the medium dose (Fig. 2G). 3–(3-hydroxyphenyl)-propionic acid plasma concentration was higher at 6 h for the higher group only (Fig. 2H). While hippuric acid reached significance at 6 h for all the doses (Fig. 2I), α-hydroxyhippuric acid reached significance at the same timepoint but only for the medium level of intake (Fig. 2J).
3.2Regression analysis
Regression curves were plotted between the (poly)phenol amount for each blueberry intervention and average AUC: 11 compounds presented a strong dose-dependent correlation after linear regression analysis with R2 > 0.85 (2,4-dihydroxybenzoic acid, 3,4-dihydroxybenzoic acid, syringic acid, vanillic acid, 3-hydroxyphenylacetic acid, 3–(4-hydroxy-3-methoxyphenyl)propionic acid, ferulic acid, isoferulic acid, hippuric acid, α-hydroxyhippuric acid and kaempferol) (Fig. 3) and 5 compounds presented a discrete dose-response with 0.65 > R2 > 0.85 (2-hydroxybenzoic acid, 2,3-dihydroxybenzoic acid, homovanillic acid, 3–(3-hydroxyphenyl)-propionic acid, m-coumaric acid) (data not shown). The AUC of acids such as 4-hydroxybenzoic, 2,5-dihydroxybenzoic,4-hydroxyphenylacetic and caffeic were not correlated with the increase of blueberry (poly)phenol intake and benzoic, phenylacetic and sinapic acids displayed an inverse correlation (data not shown).
3.3Inter-individual variability
The inter-individual variability of (poly)phenol metabolites detected in plasma was expressed as coefficient of variation (CV%). The CV for Cmax, Tmax and AUC were calculated for all the compounds and the sum of total (poly)phenols (Table 2). CV for Cmax varied between 8% for benzoic acid for the higher intake level and 253 % for syringic acid for the medium (poly)phenol intake. Tmax had CV as low as 0% for dihydroferulic, hippuric and α-hydroxyhippuric acids for the higher, medium and lower levels, respectively, and as high as 148% for 2,4-dihydroxybenzoic acid for the lower dose. The CV of AUC varied between 22% for vanillic acid and 250% for syringic acid at the medium dose. The CV of the sum of AUC of all the 23 metabolites was 49, 56 and 41% (Table 2).
4Discussion
In this work, hippuric and α-hydroxyhippuric acids were the most abundant metabolites in plasma after wild blueberry consumption, independently of the amounts consumed. Benzoic and syringic acids, together with3- and 4- hydroxyphenyl acetic acids were also present in much lower but significant amounts, followed by 3-(hydroxyphenyl)-propionic acid and hydroxycinnamic acids as ferulic, dihydroferulic and isoferulic acid, with Cmax ranging from 200 to 400 nM.
When comparing the three different amounts of wild blueberry consumed and the sum of AUC of all metabolites detected in plasma, only the lower and the higher (poly)phenol intake were significantly different, suggesting a non-linear dose response relationship between polyphenol intake and plasma levels of total (poly)phenol metabolites. It is important to point out though that in this study the amount of (poly)phenols given to volunteers was not linearly allocated, which may affect the results. The maximum dose chosen was 1791 mg of total (poly)phenols which corresponded to 560 g of fresh blueberries. A linear increase from the lowest dosage would result in a high level of intake of 3064 mg of (poly)phenols which corresponds to almost 1 Kg of blueberries which is not feasible or dietary relevant to feed in a human intervention trial.
When looking at dose-responses of individual compounds, which can be more informative than the overall pattern of (poly)phenol metabolites in plasma [31], we found that nearly half (n = 11) of the compounds quantified in this study showed a strong correlation between the (poly)phenol amount ingested and their bioavailability expressed as average AUC. Metabolites such as 3-hydroxyphenylacetic acid, hippuric acid and kaempferol displayed a R2 > 0.99 showing a very strong dose-response. The linear regression analysis also showed that an increase in (poly)phenol intake would result in discrete linear increases in 2,4-dihydroxybenzoic acid, protocatechuic acid, vanillic acid and kaempferol and higher linear increases in plasma concentrations of syringic, 3-hydroxyphenylacetic, dihydroferulic, ferulic and isoferulic acids. These compounds exhibited a less strong linear dose-response relationship with 0.85 < R2 < 0.99. The remaining metabolites, except benzoic, 4-hydroxybenzoic, phenylacetic and sinapic acids, increased their plasma concentration after interventions but the dose-response relationship seemed to plateau at the medium intake group, with no significant increases for the higher intake level. This observation might justify why the increases in flow mediated dilation (FMD) previously reported by us after consumption of the same blueberry drinks by the same volunteers were not significantly different between them, suggesting that the effects reached a plateau even at the lower dose [9]. However, when lower amounts of blueberry than the ones reported here were given to the same volunteers, we observed a linear dose-dependence relationship in the FMD response, suggesting that the plateau on the effects was reached already at the lower level of intake (766 mg) [9].
When looking at statistically significant differences between doses, ferulic, isoferulic and dihydroferulic acids were the only compounds that showed a significant increase in AUC when comparing medium and higher (poly)phenol intake with the low (poly)phenol group intake, but no differences were found between medium and higher dosage interventions. Although increases in Cmax of homovanillic, phenylacetic and 4-hydroxyphenylacetic acids were observed when comparing the medium and the low intake interventions, these increases were not statistically significant and the plasma levels plateaued, remaining constant for the higher (poly)phenol intake. This plateau effect was also observed after the consumption of strawberry beverages for pelargonidin-based anthocyanins for even lower (poly)phenol amounts (97, 194 and 388 mg) than reported here [32], which is likely due to decreased absorption and/or increase in the elimination efficiency.
The remaining compounds showed either non-significant increases with dosage or maintained their Cmax and AUC constant across the different interventions. These results suggest that the metabolic pathways that lead to the formation of (poly)phenol metabolites, other than ferulic, isoferulic and dihydroferulic acids, might already been saturated for the lower dosage and therefore a true dose-response effect could not observed. Since the inter-individual variability was high, the linear regression analysis was conducted in this study including the average AUC for each blueberry intervention and not the AUC for each volunteer individually, revealing metabolites with a high R2 which could not reach statistical significance when the t-tests were performed.
No statistical differences between Tmax for the different (poly)phenol dosages were found, showing that independently of the amount consumed, all the metabolites displayed a similar time appearance in the plasma. These results are consistent with previous finding after consumption of different green tea amounts [31]. Metabolites which showed up early in plasma after blueberry consumption (Tmax <2h) such as 2-hydroxybenzoic acid, protocatechuic acid, syringic acid, vanillic acid, phenylacetic acid, 4-hydroxyphenylacetic acid, ferulic acid, isoferulic acid, caffeic acid and sinapic acid likely undergo early absorption at the small intestine level. However, metabolites as 3–(3-hydroxyphenyl)-propionic acid, homovanillic acid, dihydroferulic acid, hippuric and α-hydroxyhippuric acid reached their Tmax closer to 6 h, as previously reported [9], showing that they might undergo entero-hepatic circulation and/or colonic metabolism. Hippuric acid Tmax has been reported to be as high as 24 h after ingestion of anthocyanins [19]. Since in the present study the latest timepoint was 6 h we can extrapolate that the concentration of hippuric acid would continue to increase if the study design had included later timepoints.
It is well known that the inter-individual variation in the absorption and metabolism of (poly)phenols is considerably high and it depends not only on age [35], gender [36], gut microbiota [37], but also on genetic polymorphisms of each individual [38], among other factors. However, the determination of this inter-individual variability is often underreported and most works present the data as average or mean and use the standard error of the mean as a dispersion parameter. Data concerning inter-individual variability after (poly)phenol intake has somewhat been buried in the published scientific literature in the form of plasma concentration ranges [31, 33] or box-and-plot whisker graphs [39, 40], which give a more accurate picture of the actual variation in a dataset but very few papers have described the CV for each kinetic parameter after (poly)phenol intake. We recently reported that the CV of the AUC of the sum of epicatechin metabolites was 38%, which was comparable to the CV of acetaminophen, consumed by the same individuals [35]. In the present work, we obtained for the sum of the AUC of total (poly)phenol metabolites a CV of 49, 56 and 41% for the low, medium and high intake levels, respectively, which is slightly higher but of similar magnitude to our previous work with cocoa [35]. It is important to highlight that the variability of each individual metabolite was much higher, with CV as low as 21–40% and as high as 183–270% depending on each compound and timepoint after blueberry consumption. This is due to the fact that in certain volunteers some metabolites were not detected while in others, high concentrations were found in the plasma. For instance, phenylacetic acid was only detected in three volunteers in all the treatments. Syringic acid also displayed a high CV because while two volunteers had undetectable concentrations, two different individuals had Cmax in the micromolar range.
Although the present data reports important and novel information regarding the plasma kinetics of blueberry (poly)phenols at different intake amounts, future studies are needed in order to investigate dose-response relationships with lower concentration of blueberry (poly)phenols at equidistant amounts. A limitation of this work is that enzymatic treatment was used for the analysis of plasma metabolites, so information on glucuronidation and sulfation of polyphenols is lacking and might confound data interpretation.
In conclusion, our data suggests that some blueberry (poly)phenols quantified in this work are absorbed in an intake-dependent manner at the amounts tested while others did not display such a linear dose-response behavior, tending to plateau at the lower or medium dosages, illustrating a complex kinetics mechanism that depends on each metabolic pathway.
Conflict of Interest
We declare that we received by way of a gift the experimental diets from Wild Blueberry Association of North America. There are no other conflicts of interest the authors wish to declare.
Acknowledgments
This work was supported by a grant from the Alpro Foundation. We also acknowledge financial support from the Medical Research Committee of the University of Duesseldorf (grant number 9772574). We thank the Wild Blueberry Association of North America for their donation of the human intervention test materials. The authors are participants of the EU funded COST Action FA1403 POSITIVE (Interindividual variation in response to consumption of plant food bioactives and determinants involved).
References
[1] | Hakkinen SH , Torronen AR . Content of flavonols and selected phenolic acids in strawberries and Vaccinium species: Influence of cultivar, cultivation site and technique. Food Res Int. (2000) ;33: :517–524. |
[2] | Taruscio TG , Barney DL , Exon J . Content and profile of flavanoid and phenolic acid compounds in conjunction with the antioxidant capacity for a variety of Northwest Vaccinium Berries. J Agric Food Chem. (2004) ;52: :3169–3176. |
[3] | Rodriguez-Mateos A , Cifuentes-Gomez T , Tabatabaee S , Lecras C , Spencer JP . Procyanidin, anthocyanin, and chlorogenic acid contents of highbush and lowbush blueberries. J Agric Food Chem. (2012) ;60: :5772–5778. |
[4] | Gu L , Kelm M , Hammerstone JF , Beecher G , Cunningham D , Vannozzi S , Prior RL . Fractionation of polymeric procyanidins from lowbush blueberry and quantification of procyanidins in selected foods with an optimized normal-phase HPLC-MS fluorescent detection method. J Agric Food Chem. (2002) ;50: :4852–4860. |
[5] | Brown E , Gill C , Stewart D , McDougall G . Lingonberries (Vaccinium vitis-idaea L.) and blueberries (Vaccinium corymbosum) contain discrete epicatechin anthocyanin derivatives linked by ethyl bridges. J Berry Res. (2015) ;1–10. DOI: 10.3233/JBR-150108 |
[6] | Scalzo J , Stevenson D , Hedderley D . Polyphenol compounds and other quality traits in blueberry cultivars. J Berry Res. (2015) ;5: :117–130. |
[7] | Dibazar R , Bonat Celli G , Brooks MSL , Ghanem A . Optimization of ultrasound-assisted extraction of anthocyanins from lowbush blueberries (Vaccinium Angustifolium Aiton). J Berry Res. (2015) ;5: :173–181. |
[8] | Rodriguez-Mateos A , Heiss C , Borges G , Crozier A . Berry (poly)phenols and cardiovascular health. J Agric Food Chem. (2014) ;62: :3842–3851. |
[9] | Rodriguez-Mateos A , Rendeiro C , Bergillos-Meca T , Tabatabaee S , George TW , Heiss C , Spencer JP . Intake and time dependence of blueberry flavonoid-induced improvements in vascular function: A randomized, controlled, double-blind, crossover intervention study with mechanistic insights into biological activity. Am J Clin Nutr. (2013) ;98: :1179–1191. |
[10] | Stull AJ , Cash KC , Champagne CM , Gupta AK , Boston R , Beyl RA , Johnson WD , Cefalu WT . Blueberries improve endothelial function, but not blood pressure, in adults with metabolic syndrome: A randomized, double-blind, placebo-controlled clinical trial. Nutrients. (2015) ;7: :4107–4123. |
[11] | Johnson SA , Figueroa A , Navaei N , Wong A , Kalfon R , Ormsbee LT , Feresin RG , Elam ML , Hooshmand S , Payton ME , Arjmandi BH . Daily blueberry consumption improves blood pressure and arterial stiffness in postmenopausal women with pre- and stage 1-hypertension: A randomized, double-blind, placebo-controlled clinical trial. J Acad Nutr Diet. (2015) ;115: :369–377. |
[12] | Basu A , Du M , Leyva MJ , Sanchez K , Betts NM , Wu M , Aston CE , Lyons TJ . Blueberries decrease cardiovascular risk factors in obese men and women with metabolic syndrome. J Nutr. (2010) ;140: :1582–1587. |
[13] | Rodriguez-Mateos A , Pino-Garcia RD , George TW , Vidal-Diez A , Heiss C , Spencer JP . Impact of processing on the bioavailability and vascular effects of blueberry (poly)phenols. Mol Nutr Food Res. (2014) ;58: :1952–1961. |
[14] | Rodriguez-Mateos A , Ishisaka A , Mawatari K , Vidal-Diez A , Spencer JP , Terao J . Blueberry intervention improves vascular reactivity and lowers blood pressure in high-fat-, high-cholesterol-fed rats. Br J Nutr. (2013) ;109: :1746–1754. |
[15] | Del Rio D , Rodriguez-Mateos A , Spencer JP , Tognolini M , Borges G , Crozier A . Dietary (poly)phenolics in human health: Structures, bioavailability, and evidence of protective effects against chronic diseases. Antiox Redox Signal. (2013) ;18: :1818–1892. |
[16] | Zhu Y , Xia M , Yang Y , Liu F , Li Z , Hao Y , Mi M , Jin T , Ling W . Purified anthocyanin supplementation improves endothelial function via NO-cGMP activation in hypercholesterolemic individuals. Clin Chem. (2011) ;57: :1524–1533. |
[17] | Feliciano RP , Pritzel S , Heiss C , Rodriguez-Mateos A . Flavonoid intake and cardiovascular disease risk. Curr Opin Food Sci. (2015) ;2: :92–99. |
[18] | Forbes-Hernandez TY , Gasparrini M , Afrin S , Bompadre S , Mezzetti B , Quiles JL , Giampieri F , Battino M . The healthy effects of strawberry polyphenols: Which strategy behind antioxidant capacity? Crit Rev Food Sci Nutr. (2015) . DOI: 10.1080/10408398.2015.1051919 |
[19] | Czank C , Cassidy A , Zhang Q , Morrison DJ , Preston T , Kroon PA , Botting NP , Kay CD . Human metabolism and elimination of the anthocyanin, cyanidin-3-glucoside: A (13)C-tracer study. Am J Clin Nutr. (2013) ;97: :995–1003. |
[20] | Ludwig IA , Mena P , Calani L , Borges G , Pereira-Caro G , Bresciani L , Del Rio D , Lean ME , Crozier A . New insights into the bioavailability of red raspberry anthocyanins and ellagitannins. Free Radic Biol Med. (2015) ;89: :758–769. |
[21] | de Ferrars RM , Cassidy A , Curtis P , Kay CD . Phenolic metabolites of anthocyanins following a dietary intervention study inpost-menopausal women. Mol Nutr Food Res. (2014) ;58: :490–502. |
[22] | Vitaglione P , Donnarumma G , Napolitano A , Galvano F , Gallo A , Scalfi L , Fogliano V . Protocatechuic acid is the major human metabolite of cyanidin-glucosides. J Nutr. (2007) ;137: :2043–2048. |
[23] | Feliciano R , Boers A , Massacessi L , Istas G , Ventura MR , Santos CN , Heiss C , Rodriguez-Mateos A . Identification and quantification of novel cranberry-derived plasma and urinary (poly)phenols. Arch Biochem Biophys. (2016) ; http://dx.doi.org/10.1016/j.abb.2016.01.014 |
[24] | Rangel-Huerta OD , Aguilera CM , Martin MV , Soto MJ , Rico MC , Vallejo F , Tomas-Barberan F , Perez-de-la-Cruz AJ , Gil A , Mesa MD . Normal or high polyphenol concentration in orange juice affects antioxidant activity, blood pressure, and body weight in obese or overweight adults. J Nutr. (2015) ;145: :1808–1816. |
[25] | Terauchi M , Horiguchi N , Kajiyama A , Akiyoshi M , Owa Y , Kato K , Kubota T . Effects of grape seed proanthocyanidin extract on menopausal symptoms, body composition, and cardiovascular parameters in middle-aged women: A randomized, double-blind, placebo-controlled pilot study. Menopause. (2014) ;21: :990–996. |
[26] | Howell AB , Botto H , Combescure C , Blanc-Potard AB , Gausa L , Matsumoto T , Tenke P , Sotto A , Lavigne JP . Dosage effect on uropathogenic Escherichia coli anti-adhesion activity in urine following consumption of cranberry powder standardized for proanthocyanidin content: A multicentric randomized double blind study. BMC Infect Dis. (2010) ;10: :1–11. |
[27] | Grassi D , Mulder TP , Draijer R , Desideri G , Molhuizen HO , Ferri C . Black tea consumption dose-dependently improves flow-mediated dilation in healthy males. J Hypertens. (2009) ;27: :774–781. |
[28] | Blumberg JB , Vita JA , Chen CY . Concord grape juice polyphenols and cardiovascular risk factors: Dose-response relationships. Nutrients. (2015) ;7: :10032–10052. |
[29] | Silva S , Bronze MR , Figueira ME , Siwy J , Mischak H , Combet E , Mullen W . Impact of a 6-wk olive oil supplementation in healthy adults on urinary proteomic biomarkers of coronary artery disease, chronic kidney disease, and diabetes (types 1 and 2): A randomized, parallel, controlled, double-blind study. Am J Clin Nutr. (2015) ;101: :44–54. |
[30] | Yang CS , Chen L , Lee MJ , Balentine D , Kuo MC , Schantz SP . Blood and urine levels of tea catechins after ingestion of different amounts of green tea by human volunteers. Cancer Epidemiol Biomarkers Prev. (1998) ;7: :351–354. |
[31] | Renouf M , Marmet C , Guy PA , Beaumont M , Lepage M , Williamson G , Dionisi F . Dose-response plasma appearance of green tea catechins in adults. Mol Nutr Food Res. (2013) ;57: :833–839. |
[32] | Banaszewski K , Park E , Edirisinghe I , Cappozzo JC , Burton-Freeman BM . A pilot study to investigate bioavailability of strawberry anthocyanins and characterize postprandial plasma polyphenols absorption patterns by Q-TOF LC/MS in humans. J Berry Res. (2013) ;3: :113–126. |
[33] | Landberg R , Aman P , Friberg LE , Vessby B , Adlercreutz H , Kamal-Eldin A . Dose response of whole-grain biomarkers: Alkylresorcinols in human plasma and their metabolites in urine in relation to intake. Am J Clin Nutr. (2009) ;89: :290–296. |
[34] | Rubio L , Valls RM , Macia A , Pedret A , Giralt M , Romero MP , de la Torre R , Covas MI , Solà R , Motilva MJ . Impact of olive oil phenolic concentration on human plasmatic phenolic metabolites. Food Chem. (2012) ;135: :2922–2929. |
[35] | Rodriguez-Mateos A , Cifuentes-Gomez T , Gonzalez-Salvador I , Ottaviani JI , Schroeter H , Kelm M , Heiss C , Spencer JP . Influence of age on the absorption, metabolism, and excretion of cocoa flavanols in healthy subjects. Mol Nutr Food Res. (2015) ;59: :1504–1512. |
[36] | de Bock M , Thorstensen EB , Derraik JG , Henderson HV , Hofman PL , Cutfield WS . Human absorption and metabolism of oleuropein and hydroxytyrosol ingested as olive (Olea europaea L.) leaf extract. Mol Nutr Food Res. (2013) ;57: :2079–2085. |
[37] | González-Sarrías A , García-Villalba R , Núñez-Sánchez MÁ , Tomé-Carneiro J , Zafrilla P , Mulero J , Tomás-Barberán F , Espín JC . Identifying the limits for ellagic acid bioavailability: A crossover pharmacokinetic study in healthy volunteers after consumption of pomegranate extracts. J Funct Foods. (2015) ;19: :225–235. |
[38] | Lampe JW . Interindividual differences in response to plant-based diets: Implications for cancer risk. Am J Clin Nutr. (2009) ;89: :1553S–1557S. |
[39] | Pimpao RC , Ventura MR , Ferreira RB , Williamson G , Santos CN . Phenolic sulfates as new and highly abundant metabolites in human plasma after ingestion of a mixed berry fruit puree. Br J Nutr. (2015) ;113: :454–463. |
[40] | Pimpao RC , Dew T , Figueira ME , McDougall GJ , Stewart D , Ferreira RB , Santos CN , Williamson G . Urinary metabolite profiling identifies novel colonic metabolites and conjugates of phenolics in healthy volunteers. Mol Nutr Food Res. (2014) ;58: :1414–1425. |
Figures and Tables
Fig.1
Bioavailability of (poly)phenols expressed as the sum of areas under the curve (AUC) (μM*h) of 23 metabolites detected in plasma by LC-Q-TOF MS after ingestion of different intake levels of blueberry beverages. The results are presented as average ± standard error of the mean (n = 9).
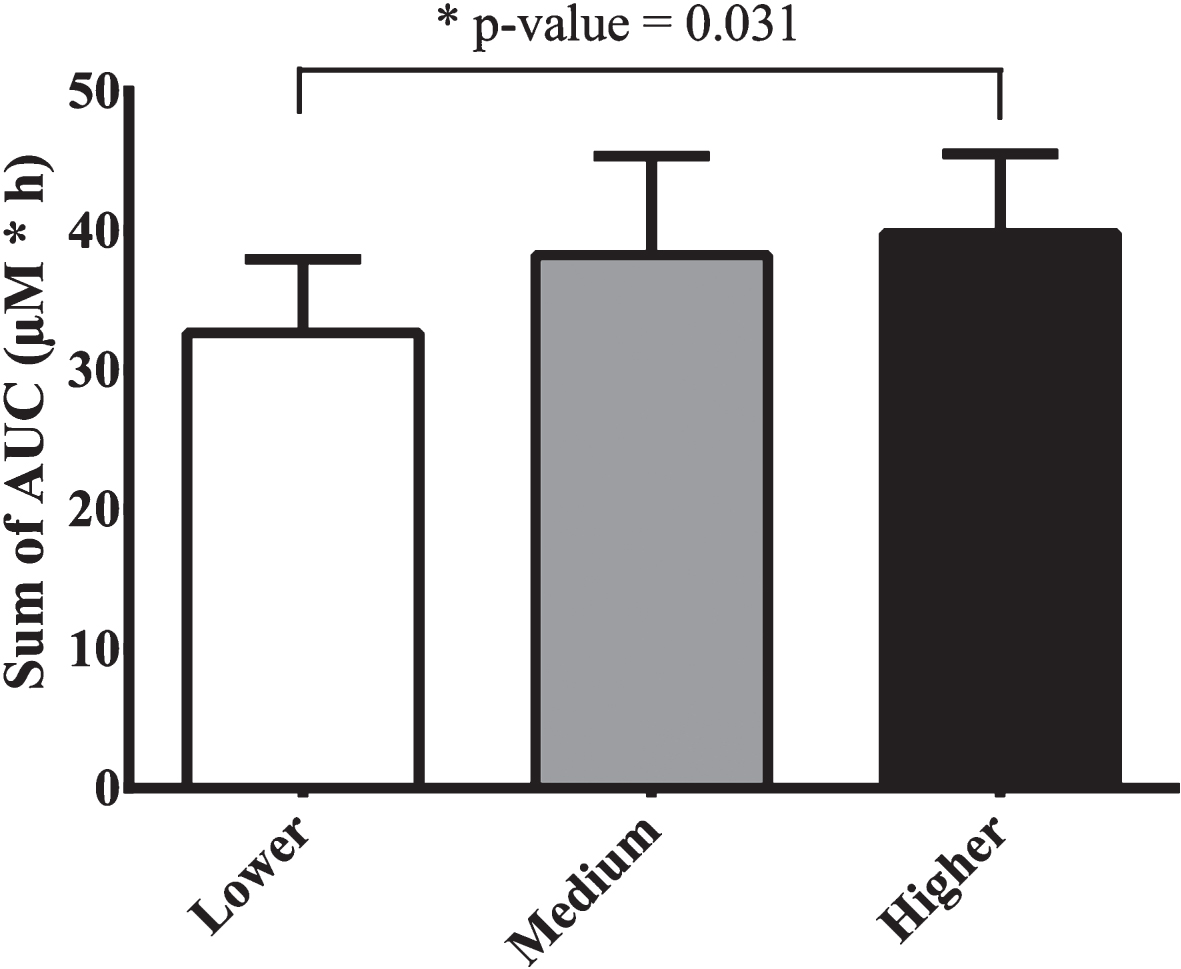
Fig.2
Plasma curve profiles of selected compounds which reached significantly higher concentrations after blueberry consumption when compared to baseline within each treatment. Statistical significance is denoted as *, # and § for the lower, medium and higher (poly)phenol intake, respectively.
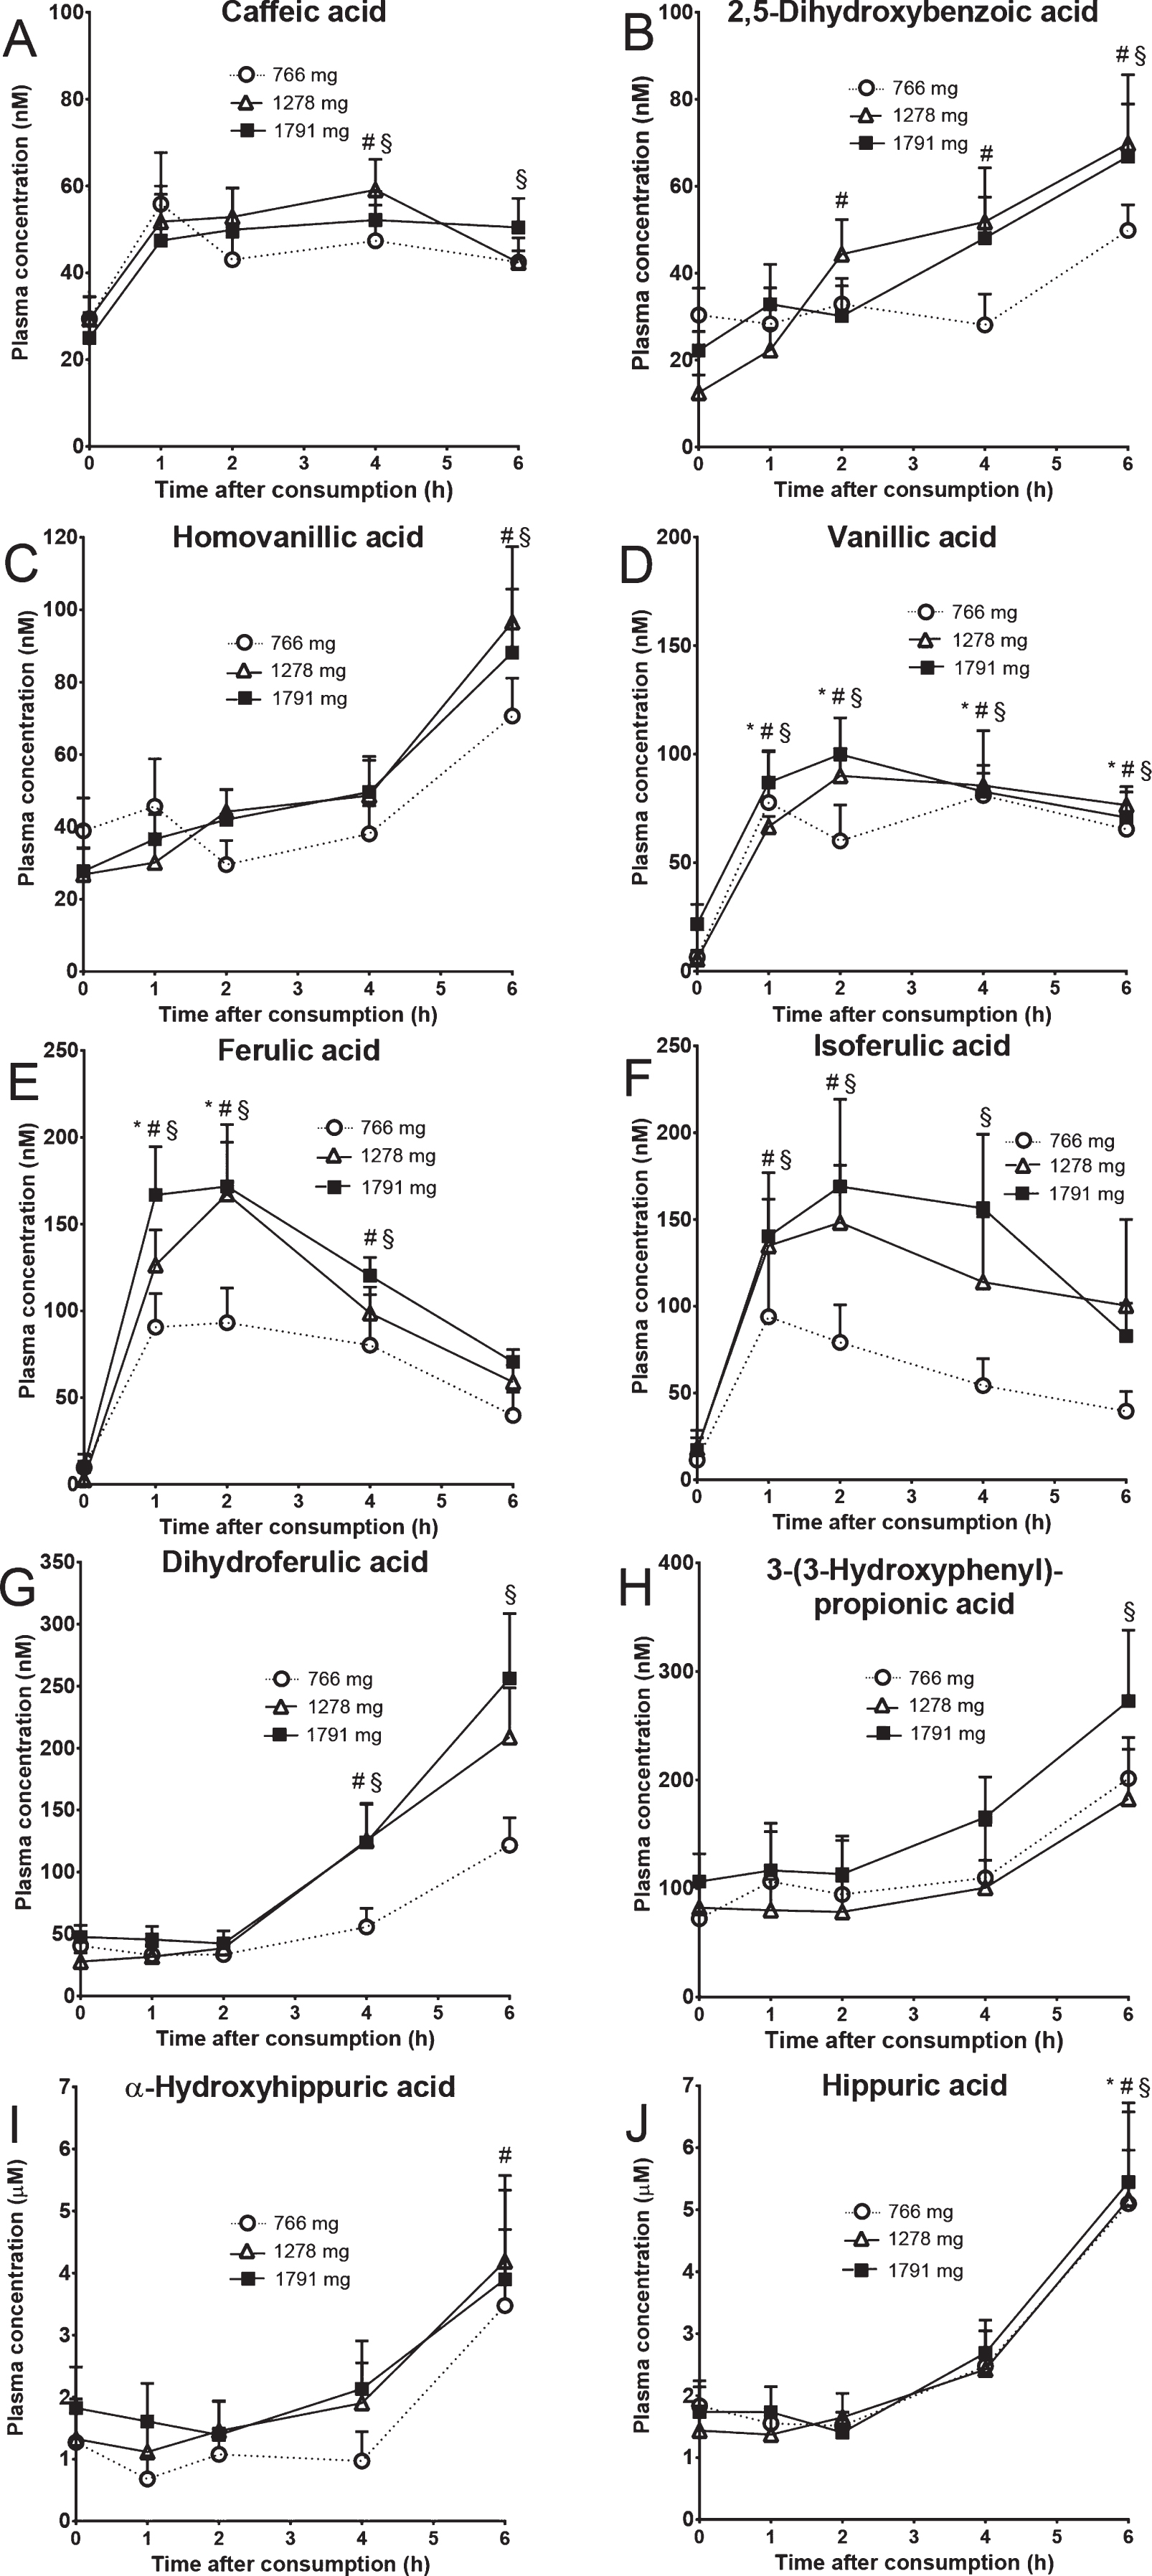
Fig.3
Linear regression analysis of selected compounds between the (poly)phenol amount (mg) contained in the blueberry interventions and the average area under the curve (AUC) (nM*h). The values presented in each graph correspond to average ± standard error of the mean.
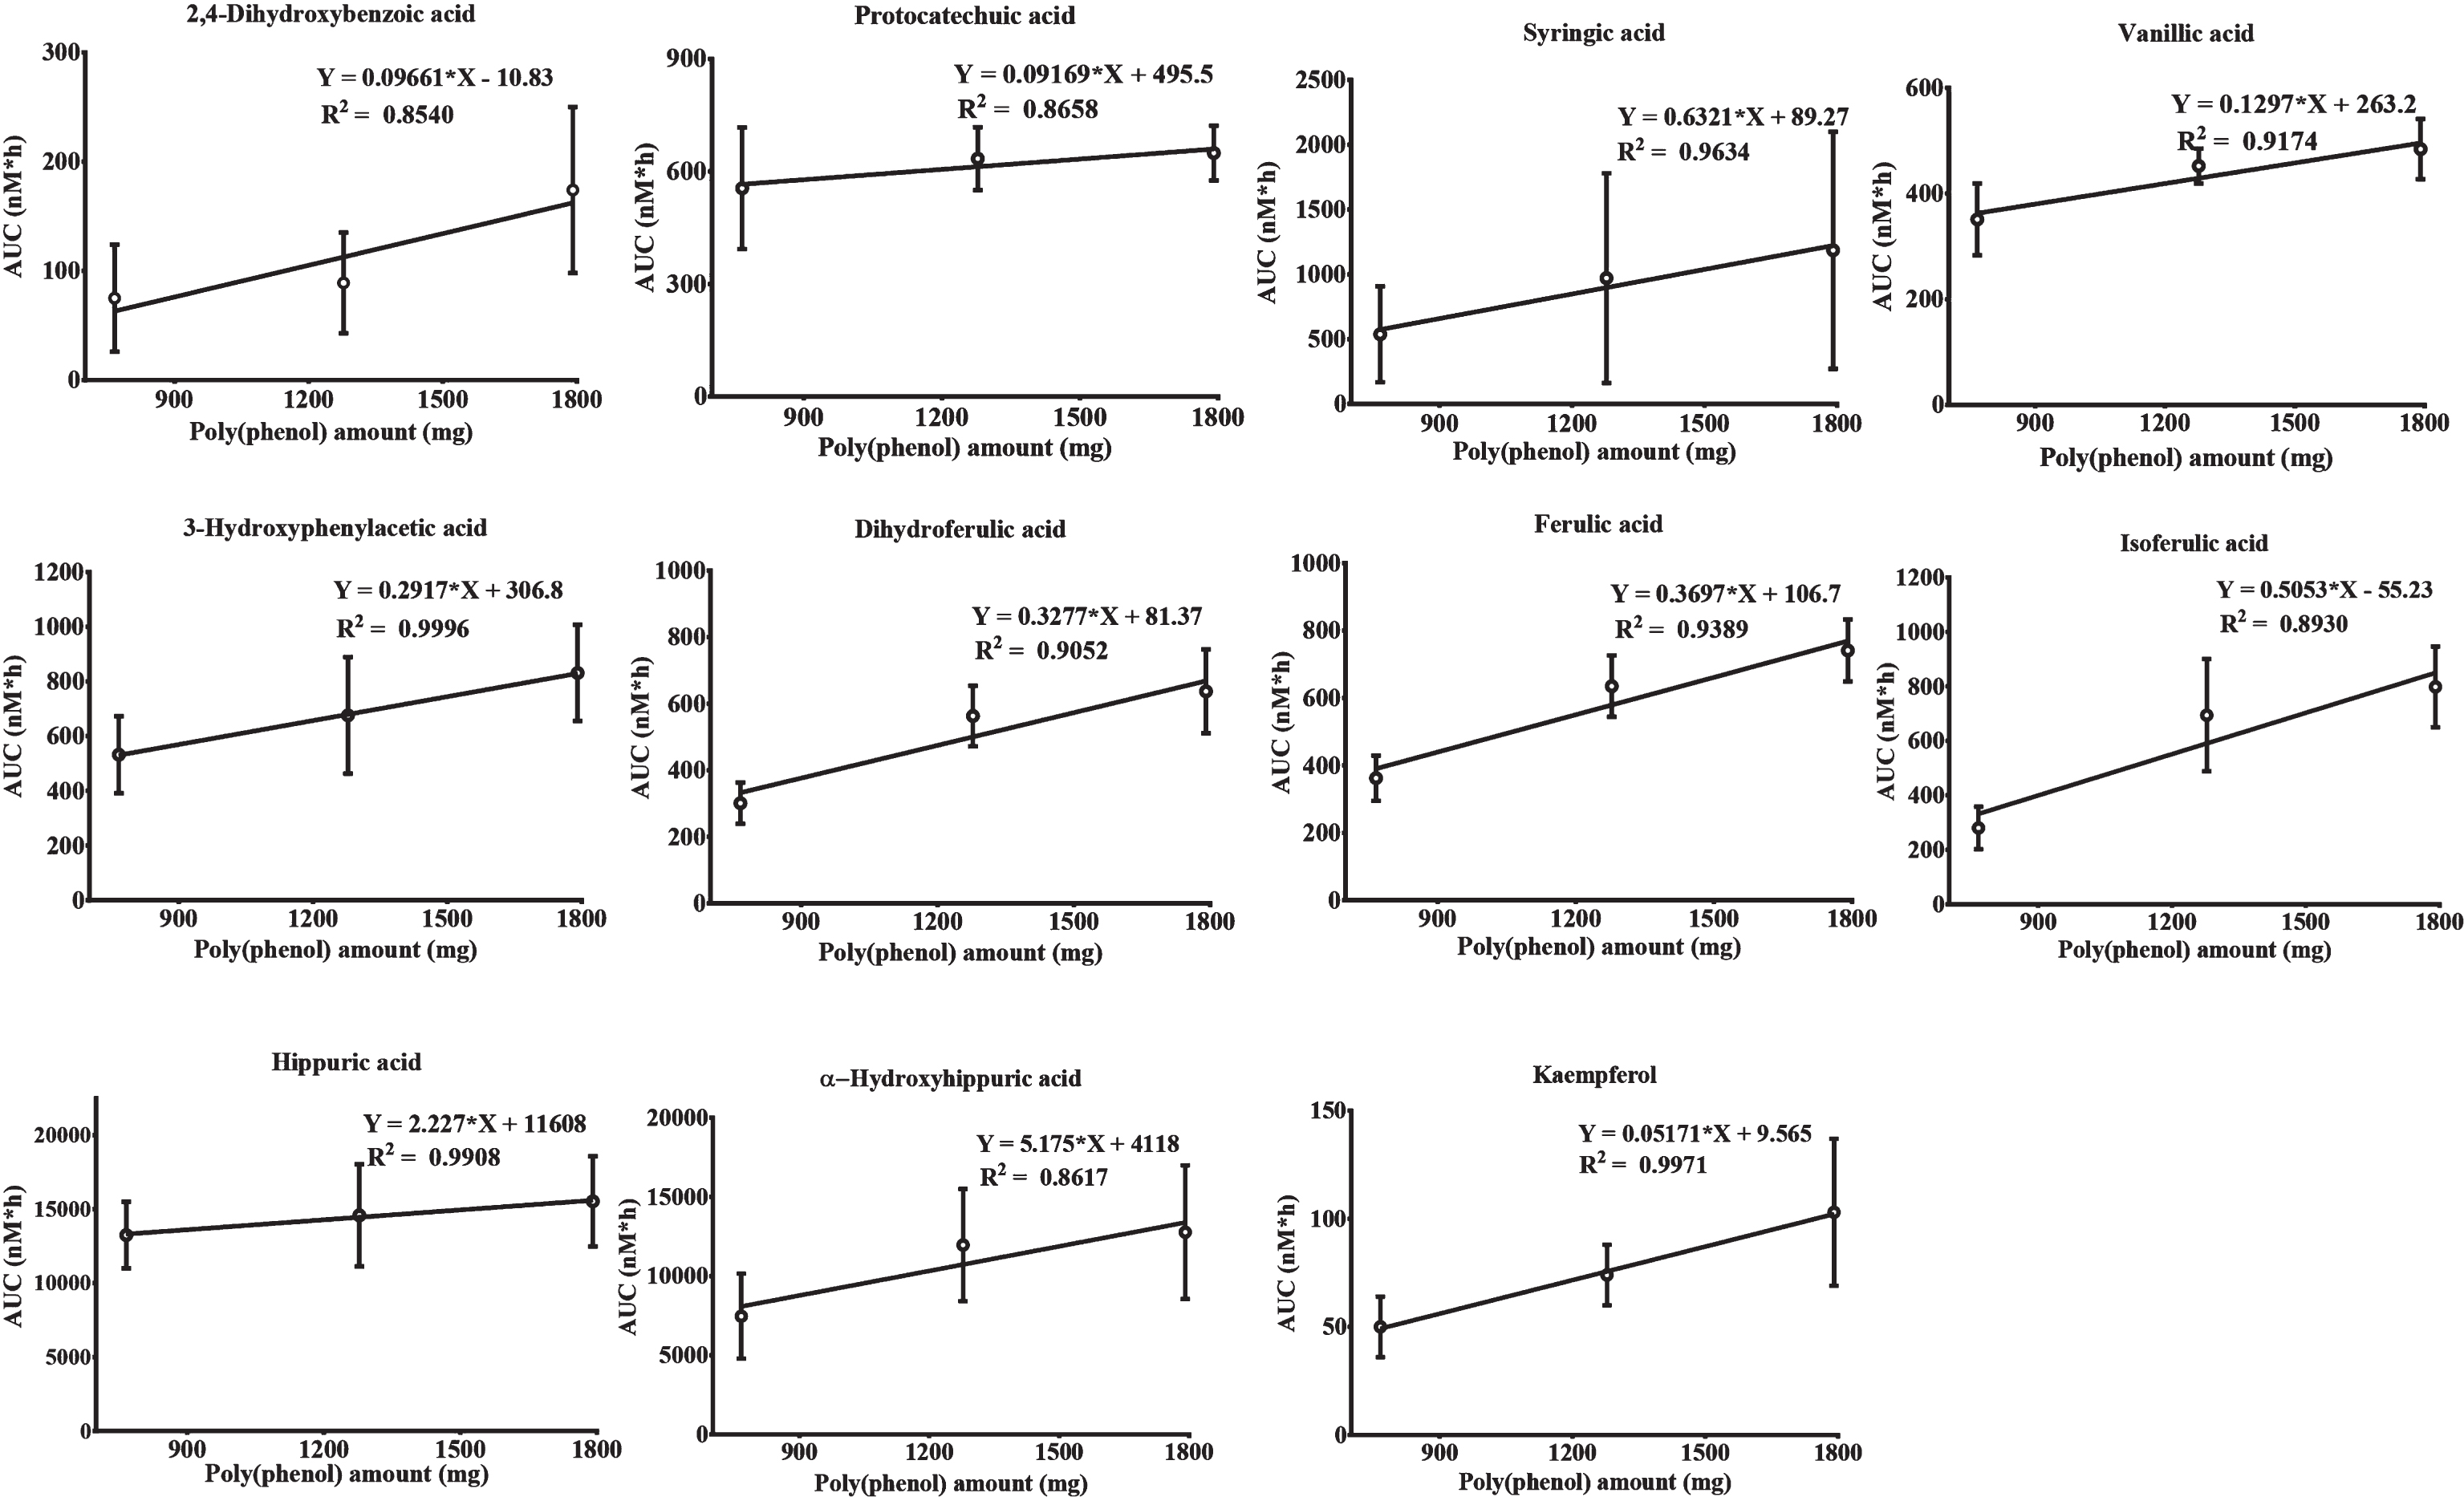
Table 1
Kinetic parameters for lower (766 mg), medium (1278 mg) and higher (1791 mg) poly(phenol) interventions after ingestion of blueberry beverages
| Parameters | Cmax (nM) | Tmax (h) | AUC (0–6h) (nM*h) | ||||||
| Poly(phenols) intake | Lower | Medium | Higher | Lower | Medium | Higher | Lower | Medium | Higher |
| Benzoic acid | 1251 ± 322 | 417 ± 59* | 385 ± 16* | 3.5 ± 1.0 | 5.2 ± 0.8 | 4.3 ± 1.2 | 3472 ± 619 | 1943 ± 335 | 1544 ± 168 |
| 2-Hydroxybenzoic acid | 167 ± 56 | 127 ± 40 | 190 ± 39 | 2.1 ± 0.5 | 3.4 ± 0.7 | 3.3 ± 0.7 | 624 ± 272 | 606 ± 208 | 794 ± 182 |
| 4-Hydroxybenzoic | 37 ± 13 | 54 ± 20 | 48 ± 13 | 3.6 ± 0.7 | 4.9 ± 0.4 | 4.5 ± 0.6 | 131 ± 51 | 191 ± 80 | 135 ± 49 |
| 2,4-Dihydroxybenzoic acid | 22 ± 12 | 22 ± 11 | 44 ± 18 | 4.3 ± 1.7 | 4.3 ± 1.2 | 5.0 ± 0.6 | 75 ± 49 | 89 ± 46 | 174 ± 76 |
| Protocatechuic acid | 164 ± 40 | 143 ± 22 | 161 ± 25 | 2.3 ± 0.8 | 2.8 ± 0.6 | 3.0 ± 0.7 | 555 ± 162 | 634 ± 84 | 649 ± 73 |
| 2,3-Dihydroxybenzoic acid | 27 ± 12 | 39 ± 16 | 42 ± 21 | 3.3 ± 0.9 | 4.7 ± 0.8 | 4.1 ± 0.8 | 72 ± 37 | 142 ± 62 | 143 ± 71 |
| 2,5-Dihydroxybenzoic acid | 57 ± 5 | 80 ± 13 | 76 ± 9 | 3.5 ± 1.1 | 4.9 ± 0.6 | 4.9 ± 0.7 | 201 ± 24 | 268 ± 46 | 252 ± 31 |
| Syringic acid | 301 ± 208 | 297 ± 250 | 241 ± 204 | 1.9 ± 0.4 | 2.0 ± 0.4 | 3.4 ± 1.1 | 537 ± 370 | 970 ± 809 | 1185 ± 914 |
| Vanillic acid | 116 ± 28 | 108 ± 9 | 116 ± 14 | 1.9 ± 0.4 | 3.3 ± 0.6 | 2.5 ± 0.6 | 351 ± 68 | 452 ± 33 | 484 ± 57 |
| Homovanillic acid | 77 ± 10 | 102 ± 23 | 91 ± 16 | 5.0 ± 0.7 | 5.4 ± 0.6 | 5.2 ± 0.6 | 232 ± 40 | 304 ± 49 | 301 ± 42 |
| Phenylacetic acid | 44 ± 35 | 175 ± 116 | 120 ± 65 | 1.5 ± 0.5 | 3.3 ± 1.3 | 3.3 ± 1.3 | 499 ± 311 | 546 ± 417 | 333 ± 203 |
| 3-Hydroxyphenylacetic acid | 268 ± 108 | 188 ± 61 | 241 ± 50 | 2.2 ± 0.6 | 3.5 ± 1.0 | 3.7 ± 0.9 | 532 ± 141 | 676 ± 213 | 831 ± 176 |
| 4-Hydroxyphenylacetic acid | 281 ± 38 | 351 ± 59 | 327 ± 22 | 2.8 ± 0.5 | 2.5 ± 0.5 | 3.1 ± 0.7 | 1200 ± 126 | 1759 ± 260 | 1633 ± 144 |
| 3-(3-Hydroxyphenyl)-propionic acid | 206 ± 49 | 199 ± 48 | 306 ± 67 | 4.9 ± 0.6 | 5.8 ± 0.3 | 5.5 ± 0.5 | 635 ± 237 | 623 ± 157 | 944 ± 181 |
| Dihydroferulic acid | 112 ± 22 | 217 ± 37* | 256 ± 52* | 5.6 ± 0.4 | 5.8 ± 0.2 | 6.0 ± 0.0 | 301 ± 62 | 563 ± 91* | 637 ± 126* |
| Ferulic acid | 116 ± 21 | 169 ± 29** | 194 ± 2§*** | 2.0 ± 0.3 | 2.0 ± 0.3 | 2.6 ± 0.5 | 362 ± 67 | 635 ± 91** | 741 ± 92*** |
| Isoferulic acid | 109 ± 28 | 170 ± 44 | 217 ± 44 | 2.9 ± 0.7 | 3.0 ± 0.5 | 2.0 ± 0.4 | 280 ± 78 | 694 ± 206** | 798 ± 148** |
| Caffeic acid | 67 ± 13 | 64 ± 7 | 60 ± 8 | 2.1 ± 0.5 | 2.9 ± 0.6 | 3.1 ± 0.7 | 247 ± 26 | 306 ± 33 | 290 ± 45 |
| Sinapic acid | 36 ± 12 | 97 ± 53 | 103 ± 48 | 1.6 ± 0.4 | 2.9 ± 0.7 | 2.0 ± 0.6 | 353 ± 156 | 349 ± 186 | 289 ± 90 |
| m -Coumaric acid | 25 ± 2 | 28 ± 7 | 24 ± 3 | 3.8 ± 0.7 | 3.4 ± 0.7 | 2.5 ± 0.8 | 108 ± 12 | 108 ± 19 | 119 ± 11 |
| Hippuric acid | 4874 ± 980 | 5169 ± 1410 | 5456 ± 1274 | 5.7 ± 0.3 | 6.0 ± 0.0 | 5.6 ± 0.4 | 13250 ± 2250 | 14581 ± 3458 | 15533 ± 3048 |
| α-Hydroxyhippuric acid | 3041 ± 1147 | 4190 ± 1381 | 4322 ± 1607 | 6.0 ± 0.0 | 6.0 ± 0.0 | 5.6 ± 0.4 | 7468 ± 2684 | 11959 ± 3536 | 12774 ± 4223 |
| Kaempferol | 11 ± 3 | 19 ± 4 | 25 ± 8 | 3.1 ± 0.4 | 2.8 ± 0.6 | 4.2 ± 0.5 | 50 ± 14 | 74 ± 14 | 103 ± 34 |
Cmax corresponds to the maximum concentration obtained in plasma (nM), Tmax is the time when Cmax was reached (h) and AUC is the area under the curve over time (nM*h). The results are expressed as mean ± standard error of the mean (n = 9). The statistical significant differences are annotated with *, ** or *** according to the p-value and correspond to comparisons between medium or higher intake with the low level intervention. No significant differences were found between medium and higher intake levels.
Table 2
Coefficients of variation (CV) expressed in percentage for Cmax, Tmax and AUC for 23 metabolites according to lower (766 mg), medium (1278 mg) and higher (1791 mg) poly(phenol) intake after blueberry consumption by nine volunteers. The CV of the sum of the AUC for the 23 metabolites is also presented and designated as “Sum of (poly)phenols”
| CV (%) | Cmax | Tmax | AUC (0 –6h) | ||||||
| Poly(phenols) intake | Lower | Medium | Higher | Lower | Medium | Higher | Lower | Medium | Higher |
| Benzoic acid | 51 | 35 | 8 | 55 | 40 | 56 | 50 | 52 | 33 |
| 2-Hydroxybenzoic acid | 89 | 94 | 62 | 63 | 57 | 67 | 123 | 103 | 69 |
| 4-Hydroxybenzoic | 103 | 109 | 83 | 46 | 22 | 39 | 111 | 125 | 108 |
| 2,4-Dihydroxybenzoic acid | 151 | 67 | 123 | 148 | 56 | 23 | 185 | 156 | 130 |
| Protocatechuic acid | 60 | 44 | 47 | 80 | 64 | 69 | 82 | 40 | 34 |
| 2,3-Dihydroxybenzoic acid | 119 | 123 | 139 | 78 | 44 | 49 | 145 | 130 | 148 |
| 2,5-Dihydroxybenzoic acid | 22 | 50 | 36 | 78 | 36 | 45 | 32 | 51 | 37 |
| Syringic acid | 196 | 253 | 239 | 58 | 50 | 71 | 195 | 250 | 231 |
| Vanillic acid | 69 | 26 | 35 | 53 | 52 | 68 | 55 | 22 | 35 |
| Homovanillic acid | 33 | 63 | 53 | 38 | 33 | 33 | 48 | 49 | 42 |
| Phenylacetic acid | 225 | 198 | 162 | 47 | 69 | 69 | 176 | 229 | 183 |
| 3-Hydroxyphenylacetic acid | 99 | 92 | 54 | 68 | 78 | 64 | 75 | 94 | 64 |
| 4-Hydroxyphenylacetic acid | 33 | 47 | 19 | 47 | 52 | 63 | 30 | 44 | 26 |
| 3-(3-Hydroxyphenyl)-propionic acid | 67 | 68 | 62 | 37 | 12 | 26 | 106 | 76 | 58 |
| Dihydroferulic acid | 55 | 51 | 61 | 19 | 12 | 0 | 58 | 49 | 59 |
| Ferulic acid | 51 | 51 | 43 | 46 | 43 | 59 | 53 | 43 | 37 |
| Isoferulic acid | 69 | 78 | 60 | 65 | 53 | 61 | 79 | 89 | 55 |
| Caffeic acid | 50 | 32 | 42 | 63 | 59 | 63 | 30 | 32 | 46 |
| Sinapic acid | 82 | 165 | 131 | 56 | 68 | 85 | 125 | 160 | 93 |
| m -Coumaric acid | 26 | 72 | 27 | 52 | 56 | 82 | 30 | 53 | 28 |
| Hippuric acid | 53 | 82 | 70 | 13 | 0 | 24 | 48 | 71 | 59 |
| α-Hydroxyhippuric acid | 107 | 99 | 105 | 0 | 0 | 16 | 102 | 89 | 99 |
| Kaempferol | 67 | 68 | 102 | 40 | 64 | 39 | 81 | 58 | 92 |
| Sum of (poly)phenols | 49 | 56 | 41 | ||||||


