
Evaluation of fruit quality and antioxidant activity of kiwifruit during ripening and after storage
Abstract
BACKGROUND:
In the Northern hemisphere kiwifruit harvest time is conditioned by low temperatures occurring during the harvesting season while in Southern Italy minimum temperatures in autumn are high enough to support fruit growth and ripening.
OBJECTIVE:
To evaluate the influence of delayed harvest time on kiwifruit quality attributes.
METHODS:
The experiment was carried out in a commercial kiwifruit, ‘Hayward’, orchard located in Southern Italy. In this area, the conventional harvest time occurs 160 days after full bloom (DAFB), during the first decade of November. Fruits were collected from 130 DAFB to 192 DAFB. Fresh fruit and dry weight, flesh color, firmness, total soluble solids content (TSS), titratable acidity (TA), ascorbic acid (AA), total polyphenols content (TPH) and antioxidant capacity (TAC) were determined.
RESULTS:
After 120 days of storage, fruit harvested 178 DAFB, had higher fresh and dry weight, flesh firmness, TSS, TA and lower water loss than fruit harvested at 160 DAFB, with no significant differences in AA, TPH and TAC. TAC was correlated more to TPH than to AA. Early (130–158 DAFB) harvests, resulted in poor fruit quality and scarce post harvest maintenance.
CONCLUSIONS:
Delaying fruit harvest time, in mild winter areas such as Southern Italy, resulted in an improved fruit quality and increased the commercial value of the fruit.
1Introduction
Kiwifruit is a climacteric fruit that can be stored 3–6 months at 0°C and under 90 to 95% RH. Its commercial and eating quality is highly correlated with total soluble solids content (TSS), dry matter content and titratable acidity (TA), both at fruit harvest time and after storage [1–6]. Indeed, kiwifruit harvested at <6.2–6.5 °Brix show rapid flesh softening, poor quality and reduced shelf life [1, 7], while a dry matter content ≥15.1% has been proposed as a reliable kiwifruit quality index [6]. Kiwifruit quality is defined also by its low Kcal content [8] and the high amount of antioxidant and phytochemical compounds [9], such as ascorbic acid [10] and polyphenols [11]. Harvest time has a significant influence on ascorbic acid concentration [11]. In ‘Hayward’ kiwifruit, the concentration of ascorbic acid varies from 37 to 200 mg 100 g–1 fw [12, 13], being higher than in lemon [14], apple and peach fruit [1]; however it also depends on storage conditions [15]. Polyphenols content and total antioxidant capacity are influenced by green pruning, fruit ripening stage at harvest time and storage conditions [8, 16].
Pre-harvest factors include harvest maturity, climate, soil, nutrient levels, water status [17]. Generally, after harvest, fruit quality cannot be improved, but only maintained. Therefore, it is very important the role of pre-harvest factors on postharvest quality [18].
In the Northern hemisphere, low temperatures occurring during the harvesting season result in anticipated leaf drop, reduce the conversion of starch into soluble sugars in the flesh and increase fruit softening rate pattern [17, 18]. However, in Southern Italy, minimum temperatures in November and December are high enough to allow fruit ripening to occur [19] and this may have a beneficial effect on fruit quality as desired by consumers. The aim of this work was to evaluate the influence that delayed harvest time might have on several kiwifruit quality attributes, such as biometric parameters (fresh weight, flesh firmness), organoleptic parameters (total soluble solids content and titratable acidity) and nutraceutical parameters (total antioxidant capacity, total polyphenol content, ascorbic acid content).
2Materials and methods
2.1Orchard
The experiment was carried out during 2012 and 2013 in a commercial orchard (Actinidia deliciosa, cv ‘’Hayward”) located at Rosarno (latitude 38° 29’ N; longitude 15° 58’ E; Calabria, Italy). Vines were planted during 2008 in a sandy soil with sub-acid, 6.8 pH, 2.1% organic matter and 1.8 g kg–1 N content. Vines were spaced 4.0 m×4.0 m apart (625 vines ha–1) and trained to a pergola system, under a photo-selective grey hail net with a 26% of shading. The orchard was drip irrigated and managed using the standard integrated pest management system. Yearly dormant pruning (December) was combined with summer pruning (July). Full bloom occurred during the last week of May in 2012 (25 May) and one week later in 2013 (2 June). Fruit were thinned at the end of June, removing all the secondary fruitlets in the inflorescences. In this area, the conventional harvest time occurs 160 DAFB.
2.2Sampling
Fruit were collected and analyzed every second week from 130 DAFB (4 October 2012 and 10 October 2013) to 158 DAFB, and, then, every week from 158 DAFB to 192 DAFB (5 December 2012 and 12 December 2013) during the two seasons [2012/2013]. Measurements were carried out weekly on 48 fruit, randomly collected from the canopy of six vines (8 fruits on each vine and every week). Vines were similar in terms of fruit load (430±32 fruit vine–1 and 45±4.2 kg vine–1) and canopy growth. After each harvest time, fruit were stored at 0°C and 95% RH for 120 days. After storage and before measurements, fruit were exposed to ambient temperature (20°C) [20] for one week [8]. Average daily temperatures (°C) during fruit ripening and harvest time, recorded at the orchard site, are reported in Table 1.
2.3Fruit weight
Fresh weight (FW) was determined, using an electronic balance (Mettler-Toledo MgbH, Grelfensee, Switzerland), immediately after harvest at each sampling date and after storage at 0°C. At the end of the storage period, fruit weight loss (FWL) was calculated as the difference between fresh weight measured after and before storage and expressed as percentage on fresh weight basis.
2.4Flesh firmness
Flesh firmness (FF) was measured with a digital penetrometer with an 8 mm probe (PCE 100, Padova, Italy). The skin was removed before measurement and measurements were taken in two opposite sides of the equatorial zone of the fruit; the two measures were averaged.
2.5Soluble solids content
Total soluble solids content, expressed as °Brix, was measured with a digital refractometer (PAL-1, Atago, Tokio, Japan) on juice drops obtained by squeezing the apex and the base of each single fruit.
2.6Titratable acidity
Titratable acidity was determined by titrating 10 ml of the juice diluted with distilled water (1:1) and titrated to pH 8.2 with 0.1 N NaOH (mEq. NaOH/100 g fresh fruit). Titration results were expressed as citric acid equivalents per 100 ml of sample juice using a citric acid standard curve.
2.7Dry matter
Dry matter concentration was determined using a standardized sampling method: an horizontal slice of fruit tissue of the equatorial zone was extracted from each fruit. The thickness of the slice was about 1 cm and the fresh weight was recorded. The slice was placed in a dehydrator at 70°C until the constant dry weight was reached. The dry matter content (DMC) was expressed as a percentage on fresh weight and was determined at each harvest time.
2.8Total polyphenol content (TPH) and antioxidant capacity (TAC)
At each harvest date and after storage, five fruits per plant were taken for the analysis of mesocarp TPH and TAC. Fruit samples were homogenized using an Ultraturrax blender (20.000 rpm; T 25 Basic, IKA Werke, Germany). TPH and TAC were analyzed separately using a Kontron Uvikon 941 Plus spectrophotometer. Before measuring TPH and TAC, standard curves were prepared for each test. TPH (mg gallic acid equivalents/g fresh weight (Fw) was determined using the Folin-Ciocalteau method [21]. TAC was determined using the modified TEAC assay, and expressed as mmoles Trolox equivalents/100 g Fw [22, 23]. TEAC assay included both the hydrophilic and the lipophilic contributions [24] of the kiwifruit samples.
2.9Flesh color
Flesh color was evaluated with a Minolta spectrophotometer CM-700d (Minolta, Inc., Tokyo, Japan), which provided measurements of Hunters L*, a* and b* in three points of each fruit. L* measures the lightness and it varies from 100 for the perfect white to zero for black. a* measures the redness when its value is positive, grey when is zero, greenness when negative. b* measures yellowness when positive, grey when is zero, blueness when is negative. The colorimeter was calibrated with standard black and white calibration tiles.
2.10Ascorbic acid
Ascorbic acid content was determined using the procedure based on the reduction of the dye 2,6-dichlorophenol-indophenol (DIP) by ascorbic acid [25]. Kiwifruit fresh tissue (3 g) was mixed with 20 ml (3%) metaphosphoric acid and homogenized. Ascorbic acid was determined by titration of 15 ml filtrated juices by DIP containing bicarbonate sodium. The measures were effected from 158 (conventional harvest) to 192 DAFB and after the 120 d storage period. Ascorbic acid content was expressed as mg ascorbic acid/100 g Fw.
2.11Leaf drop
Leaves were counted on 20 marked shoots of each vine, from 130 DAFB to 192 DAFB. Leaf drop begun, in both years, not earlier than 175 DAFB, in November.
2.12Statistical analysis
All the data were analyzed using ANOVA to determine the significance of differences between sampling (harvest) dates. Differences were calculated according to the least significant difference (LSD) test, at P ≤ 0.05. The correlation analysis of the TPH vs. TAC was performed using the statistical software (Statsoft Inc., Tulsa, OK, USA).
3Results and discussion
Fruit fresh and dry weight increased according to a similar rate pattern (Figs. 1, 2). Percentage of fruit dry matter (DM) content increased exponentially from 130 to 144 DAFB; thereafter, DM increased steadily to peak at the end of November (Fig. 1). It is noteworthy that DM content (16%) was always higher than the minimum value reported for kiwifruit [26, 27]. If we consider that commercial harvest time in the area usually occurs during the first and second week of November (about 160–170 DAFB), harvesting kiwifruit during late November would result in a marginal increase of 3%–5% fresh weight. From 185 to 192 DAFB fruit fresh and dry weight did not show any further increase (Fig. 2).
In both years, at 192 DAFB (first ten days of December) leaf drop was lower than 18%; vines reached 50% of leaf drop (indicating the onset of endodormancy) by the end of December, much later than in Northern environments (Fig. 3). Flesh firmness slowly decreased from 130 DAFB (beginning of October) to 150 DAFB, to remain stable until 178 DAFB (end of November); it significantly decreased only during the first ten days of December (Fig. 4). On the other hand, TSS content reached the minimum value suitable for commercial harvest maturity (6.5°Brix) during the first week of November (164 DAFB), when flesh firmness was still around 7.5 kg cm–2. It rapidly increased during the next 30 days, because of a rapid starch conversion into soluble sugars [28, 29]. At 178 DAFB, TSS content reached 8.6° Brix; at this stage, flesh firmness was still stable around 8.2 kg cm–2 (Fig. 4). Titratable acidity of fruit flesh did not change significantly during the whole harvesting period, but after storage it was significantly lower in fruit harvested from 130 to 164 DAFB than later in the season (Fig. 5).
Flesh brightness (L*) was highest until 144 DAFB, with no significant changes afterwards [30, 31]; green color (a*) and the yellow color (b*) declined significantly at the last two harvest dates (Table 2). Fruit flesh color changed during kiwifruit storage [32]. The decrease in L* value that occurred for early harvested (130–144 DAFB) fruit indicated the onset of a dark color in the pulp due to oxidative browning reactions. The green color decreased during storage (the a* value was less negative) and so did the yellow one (b*).
Fruit weight loss (after storage and 7 days of shelf-life) decreased significantly with harvest date, while flesh firmness and TSS content increased, particularly at the latest harvest times (Table 3). Indeed, kiwifruit harvested at the end of November, maintained a good flesh firmness after storage, with higher values contrary to those reported by other authors [8] with fruit stored for a shorter period (8 weeks). Fruit with 12 °Brix are generally considered acceptable by consumers [33, 34], and fruit harvested from commercial harvest time (160 DAFB) onwards had, at the end of storage, higher than those reported in literature [8, 35] (Table 3). TSS content at fruit harvest time and after storage was highly correlated (Fig. 6) according to data reported on apple [36].
Ascorbic acid content declined during fruit ripening [30, 37] with the highest values occurring from 130 to 144 DAFB and the lowest ones from 185 to 192 DAFB (Table 4). No difference occurred from 158 to 178 DAFB, when TSS content was 7-8 °Brix (Fig. 4). Indeed, when fruit becomes overripe, vitamin C content declines, along with the degradation of fruit tissues [38]. There are contrasting results about the influence of vitamin C on the antioxidant capacity of fruit or vegetables [39], but a strong correlation was reported between TAC and AA [8]. The total polyphenol content (TPH) and the antioxidant capacity (TAC) were highest during the first week of October, and decreased significantly two weeks afterwards, when daily temperatures also decreased [40]. No differences occurred from 158 to 192 DAFB (Table 4). Indeed, the correlation between TAC and ascorbic acid did not change with fruit ripening, while the correlation between TAC and TPH is changed (Table 5). TAC is also influenced by the chemical structures of the polyphenols, and in particular, by the number of hydroxyl groups [41]. Likely, the decline of temperature during fruit ripening influenced the composition of total polyphenols. Eventually, the contribution of TPH vs TAC increased in time (Table 5). Several authors [42, 43] reported an increase of ascorbic acid in kiwifruit during storage [44]. Our data show a clear decrease in ascorbic acid content that was inversely related to the pre-storage values. Fruit harvested from 130 to 158 DAFB retained <61% of pre-storage ascorbic acid content, while those harvested from 164 to 178 DAFB retained 74% –81% and the latest retained 83% –87% of the pre-storage values. Considering that water loss can speed up ascorbic acid degradation [8], this behavior could also be related to the different pattern of water loss during storage that occurred between early and late harvested fruit. Phenol content may either increase or decrease in fruit and vegetables depending on the storage conditions [38]. Generally, antioxidant activity and phenolic concentration increase during storage [45]. A significant increase in phenol content was observed after exposition to cold storage for a week in many fruit species: pear [46], grape [47], some apple cultivars [48, 49], blueberry [50], lychee and red raspberry [51, 52]. In our experiment, polyphenol content increased after storage (Table 4) as reported by other authors [8, 16, 50]. However, TAC changes during storage were not consistent with fruit ripening stage at harvest (Table 4) and, may have been determined by a combination of a lower acid ascorbic content and a higher TPH, including, most likely, substantial changes in polyphenolscomponents [53].
4Conclusion
Kiwifruit is usually harvested when unripe, and its postharvest maintenance and ultimate quality is strongly related to the choice of an appropriate harvest time. A threshold of total soluble solid content, associated to flesh firmness is currently used in many countries, in order to ensure the fruit has reached the stage of development that its quality will be at least the minimum acceptable to the consumer. However, in terms of marketing, fruit percent dry matter (dry matter ≥15.1%) is considered a more accurate and reliable quality index than soluble solids concentration to meet consumer requirements [6]. Furthermore, high level (≥16.1%) of percent dry matter, that is associated to high TSS content and sweetness perception [54], may balance the sourness perception that may occur when ripe titratable acidity is greater than or equal to 1.2% [6]. To maximize consumer satisfaction, high TSS content and dry matter level are, then, required. Flesh firmness of kiwifruit harvested 178 DAFB was 8.0 kg cm–2 and TSS content was 8.6 °Brix; at this stage, fruit percent dry matter reached its highest value (20.5%) and TA was 1.50%. These values resulted in a higher ascorbic acid content, a much lower water loss and a TSS content and flesh firmness that, after storage, was 15% –25% higher than for fruit harvested at commercial harvest time. This suggests a large timespan for commercial harvest maturity in areas where temperatures in fall are high enough to support fruit ripening. The total antioxidant capacity did not significantly change during this timespan, but fruit harvested at 178 DAFB retained, after post harvest storage, a higher ascorbic acid content than those harvested 158 DAFB. Eventually, the seasonal (2012 vs 2013) variability of TSS content, TA, fruit firmness, percent dry matter, TPH, AA and TAC, at harvest time and after storage, were highest for fruit of the earliest (130–144 DAFB) and the latest (185–192 DAFB) harvest dates, with not significant changes in those harvested during the 158–178 DAFB timespan (data not shown), indicating a quite large ‘window’ for fruit harvest time in that particular period, that could help in maximizing consumers acceptance of very high quality fruit.
References
[1] | Beever DJ , Hopkirk G . Fruit development and fruit physiology in kiwifruit science and management. Warrington IJ, Weston GC, eds., Ray Richards, Auckland. (1990) , pp. 97–126. |
[2] | Jordan RB , Walton EF , Klages KU , Seelye RJ . Postharvest fruit density as an indicator of dry matter and ripened soluble solids of kiwifruit. Postharvest Biol Technol. (2000) ;20: :163–173. |
[3] | Crisosto CH , Hasey J , Cantin C , Garibay S , Crisosto GM . New kiwifruit dry weight protocol. Central Valley Postharvest Newsletter. Cooperative Extension. University of California. (2008) ;17: :11–15. |
[4] | Harker FR , Carr BT , Lenjo M , MacRae EA , Wismer WV , Marsh KB , Williams M , White A , Lund CM , Walker SB , Gunson FA , Pereira RB . Consumer liking for kiwifruit flavor: A meta-analysis of five studies on fruit quality. Food Qual Preference. (2009) ;20: :30–41. |
[5] | Jordan RB , Seelye RJ . Relationship between taste perception, density and soluble solids concentration in kiwifruit (Actinida deliciosa). New Zeal J Crop Hort. (2009) ;37: :303–317. |
[6] | Crisosto CH , Hasey JK , Zegbe JA . New quality index based on dry matter and acidity proposed for Hayward kiwifruit. California Agriculture. (2012) ;66: (2):70–75. |
[7] | Pekmezci M , Erkan M , Gubbuk M , Karasahin I , Uzun I . Modified atmosphere and ethylene absorbent enables prolonged storage of Hayward kiwifruit. In: Albrigo LG , Galan Sauco V (Editors), XXVI International Horticultural Congress: Citrus and Other Subtropical and Tropical Fruit Crops, Canada. Acta Hort. (2004) ;632: :337–341. |
[8] | Tavarini S , Degl’Innocenti E , Remorini D , Massai R , Guidi L . Antioxidant capacity, ascorbic acid, total phenols and carotenoids changes during harvest and after storage of Hayward kiwifruit. Food Chem. (2008) ;107: :282–288. |
[9] | Tomas-Barberan FA , Robins RJ (eds.) . Phytochemistry of fruit and vegetables. Oxford Science Publications. Oxf., UK., (1997) , pp. 375. |
[10] | Nishiyama I , Yamashita Y , Yamanaka M , Shimohashi A , Fukuda T , Oota T . Varietal difference in vitamin C content in the fruit of kiwifruit and other Actinidia species. J Agr Food Chem. (2004) ;52: :5472–5475. |
[11] | Park YS , Jung ST , Kang SG , Heo BG , Lee SH , Toledo F , Arancibia-Avila P , Drzewiecki J , Gorinstein S . Radical scavenging capacity of ethylene treated kiwifruit. J of Food Biochem. (2009) ;33: :674–692. |
[12] | Lintas C , Adorisio S , Cappelloni M , Monastra E . Composition and nutritional evaluation of kiwifruit grown in Italy. New Zeal J Crop Hort. (1991) ;19: :341–344. |
[13] | Selman JD . The vitamin C content of some kiwifruit (Actinidia chinensis Planch., variety Hayward). J SCI FOOD AGR. (1983) ;47: :401–16. |
[14] | Cioroi M . Study on L-Ascorbic acid contents from exotic fruit. Cercetari Agronomice in Moldva, Anul XXXX. (2007) ;1: :23–27. |
[15] | Esti M , Cinquanta L , Sinesio F , Moneta E , Di Matteo M . Physicochemical and sensory fruit characteristics of two sweet cherry cultivars after cool storage. Food Chem. (2002) ;76: :399–405. |
[16] | Gullo G , Branca V , Dattola Ag , Zappia R , Inglese P . Effect of summer pruning on some fruit quality traits in Hayward kiwifruit. Fruits. (2013) ;68: (4):315–322. |
[17] | Thompson AK . Harvesting, handling and storageIn: Fruit and Vegetables, 2nd ed. Oxford: Blackwell Publishing; (2003) , pp. 1–96. |
[18] | Bramlage WJ . Interactions of orchard factors and mineral nutrition on quality of pome fruit. Acta Hort. (1993) ;326: :15–25. |
[19] | Di Lorenzo R , Di Marco L , Raimondo A , Inglese P . Survey of kiwifruit (Actinidia deliciosa) flowering and fruiting behaviour in some areas of southern Italy. Acta Hort. (1990) ;282: :119–126. |
[20] | Marsh K , Attanayake S , Walker S , Gunson A , Boldingh H , MacRae E . Acidity and taste in kiwifruit. Postharvest Biol Tec. (2004) ;32: :159–168. |
[21] | Slinkard K , Singleton VL . Total phenol analysis: Automation and comparison with manual methods. Am J Enol Viticult. (1997) ;28: :49–55. |
[22] | Pellegrini N , Re R , Yang M , Rice-Evans C . Screening of dietary carotenoids and carotenoid-rich fruit extracts for anti-oxidant activities applying 2,2′-azino-bis-(3-ethylenebenzothiazoline-6-sulphonic acid) radical cation decolourisation assay. Method Enzymol. (1999) ;299: :379–389. |
[23] | Re R , Pellegrini N , Proteggente A , Pannala A , Yang M , RiceEvans C . Antioxidant activity applying an improved ABTS radical cation decolorization assay. Free Radic Bio Med. (1999) ;26: :1231–1237. |
[24] | Scalzo J , Politi A , Pellegrini N , Mezzetti B , Battino M . Plant genotype affects total antioxidant capacity and phenolic contents in fruit. Nutr. (2005) ;21: (2):207–213. |
[25] | Kim KH , Yook HS . Effect of gamma irradiation on quality of kiwifruit (Actinidia deliciosa var. deliciosa cv. Hayward). Radiation Physics and Chemistry. (2009) ;78: :414–421. |
[26] | Richardson AC , McAneney KJ , Dawson TE . Carbohydrate dynamics in kiwifruit. J Hortic Sci. (1997) ;72: :907–917. |
[27] | McGlone VA , Kawano S . Firmness, dry-matter and soluble solids assessment of post-harvest kiwifruit by NIR spectroscopy. Postharvest Biol Tec. (1998) ;13: :131–141. |
[28] | MacRae EA , Redgwell R . Softening in kiwifruit. Postharvest News Information. (1992) ;3: :49N–52N. |
[29] | Atkinson RG , MacRae EA . Kiwifruit. In: Pua EC , Davey MR (ed) Transgenic Crops V. Springer Berlin Heiderberg (2007) ;60: :329–346. |
[30] | Ghasemnezhad M , Ghorbanalipour R , Ali Shiri M . Changes in physiological characteristics of kiwifruit harvested at different maturity stages after cold storage. Agriculturae Conspectus Scientificus. (2013) ;78: (1):41–47. |
[31] | Cangi R , Altuntas E , Kaya C , Saracoglu O . Some chemical and physiological properties at physiological maturity and ripening period of kiwifruit (Hayward). Afr J Biotechnol. (2011) ;10: (27):5304–5310. |
[32] | Krugera E , Dietrich H , Schopplein E , Rasima S , Kurbelb P . Cultivar, storage conditions and ripening effects on physical and chemical qualities of red raspberry fruit. Postharvest Biol Tec. (2010) ;60: :31–37. |
[33] | Stec MGH , Hodgson JA , MacRae EA , Triggs CM . Role of fruit firmness in the sensory evaluation of kiwifruit (Actinidia deliciosa cv. ‘Hayward’). J Sci Food Agr. (1989) ;47: :417–433. |
[34] | Crisosto CH , Crisosto GM . Understanding consumer acceptance of early harvested ‘Hayward’ kiwifruit. Postharvest Biol Tec. (2001) ;22: :205–213. |
[35] | Fattahi J , Fifaii R , Babri M . Postharvest quality of Kiwifruit (Actinidia deliciosa cv. Hayward) affected by pre-storage application of salicylic acid. South-west J Hortic Biol Environ. (2010) ;1: :175–186. |
[36] | Kvikliene N , Kviklys D , Viškelis P . Changes in fruit quality during ripening and storage in the apple cultivar ‘auksis’. J Fruit Ornam Plant Res. (2006) ;14: (2)195–202. |
[37] | Okuse I , Ryugo K . Compositional changes in the developing ‘Hayward’ kiwi fruit in California. J Am Soc Hortic Sci. (1981) ;106: :73–76. |
[38] | Kalt W . Effects of production and processing factors on major fruit and vegetable antioxidants. J Food Sci. (2005) ;70: :11–9. |
[39] | Guo A , Yang J , Wei J , Li Y , Xu J , Jaing Y . Antioxidant activities of peel, pulp and seed fractions of common fruit as determined by FRAP assay. Nutr Res. (2003) ;23: :1719–1726. |
[40] | Mikulic-Petkovsek M , Schmitzer V , Slatnar A , Stampar F , Veberic R . Composition of sugars, organic acids, and total phenolics in 25 wild or cultivated berry species. J Food Sci. (2012) ;77: :1064–1070. |
[41] | Leontowicz H , Gorinstein S , Lojek A , Leontowicz M , Ciz M , Soliva-Fortuny R . Comparative content of some bioactive compounds in apples, peaches and pears and their influence on lipids and antioxidant capacity in rats. J Nutr. (2002) ;13: :603–610. |
[42] | Fattahi MJ , Ebadi H . The effect of hot water treatments on gray mold and physicochemical quality of kiwifruit during storage. Journal of Ornamental and Horticultural Plants. (2012) ;2: (2):73–82. |
[43] | Park YS . Storability of new kiwifruit cultivar bred in Korea. Korean J Hortic Sci and Technol. (2009) ;27: :123–127. |
[44] | Lee SK , Kader AA . Pre-harvest and post-harvest factors influencing vitamin C content of horticultural crops. Postharvest Biol Tec. (2000) ;20: :207–220. |
[45] | Kevers C , Falkowski M , Tabart J , Defraigne JO , Dommes J , Pincemail J . Evolution of antioxidant capacity during storage of selected fruit and vegetables. J Agr Food Chem. (2007) ;55: :8596–8603. |
[46] | Blankenship SM , Richardson DG . Changes in phenolic acids and internal ethylene during long-term cold storage of pear. J Am Soc Hort Sci. (1985) ;110: (3):33. |
[47] | Cantos E , Garcia-Viguera C , de Pascual-Teresa S , Tomas-Barberan FA . Effect of postharvest ultraviolet irradiation on resveratrol and other phenolics of cv. Napoleon table grapes. J Agr Food Chem. (2000) ;48: :4606–4612. |
[48] | Burda S , Oleszek W , Lee CY . Phenolic compounds and their changes in apples during maturation and cold storage. J Agr Food Chem. (1990) ;38: :945–948. |
[49] | Reay PF . The role of low temperatures in the development of the red blush on apple fruit (Granny Smith). Sci Hortic. (1999) ;79: :113–119. |
[50] | Connor AM , Luby JJ , Hancock JF , Berkheimer S , Hanson EJ . Changes in fruit antioxidant activity among blueberry cultivars during cold-temperature storage. J Agr Food Chem. (2002) ;50: :893–898. |
[51] | Lee HS , Wicker L . Quantitative changes in anthocyanin pigments of lychee fruit during refrigerated storage. Food Chem. (1991) ;40: :263–271. |
[52] | Robbins JA , Sjulin TM , Patterson M . Postharvest storage characteristics and respiration rates in five cultivars of red raspberry. Hort Sci. (1989) ;24: :980–983. |
[53] | Napolitano A , Cascone A , Graziani G , Ferracane R , Scalfi L , Di Vaio C , Ritieni A , Fogliano V . Influence of variety and storage on the polyphenol composition of apple flesh. J Agr Food Chem. (2004) ;52: :6526–6531. |
[54] | Rossiter KL , Young H , Walker Shane B , Miller M , Dawson DM . Evaluation of postharvest treatments on shelf-life of kiwifruit (Actinidia deliciosa cv Hayward) cv Hayward. Final Report. J Sens Stud. (2000) ;15: :241–250. |
Figures and Tables
Fig.1
Evolution of dry weight (%) of ‘Hayward’ kiwifruit harvested from 130 days after full bloom (DAFB) to 192 DAFB (average 2012-2013 = 31 May). Data are means±SE (N = 45×2).
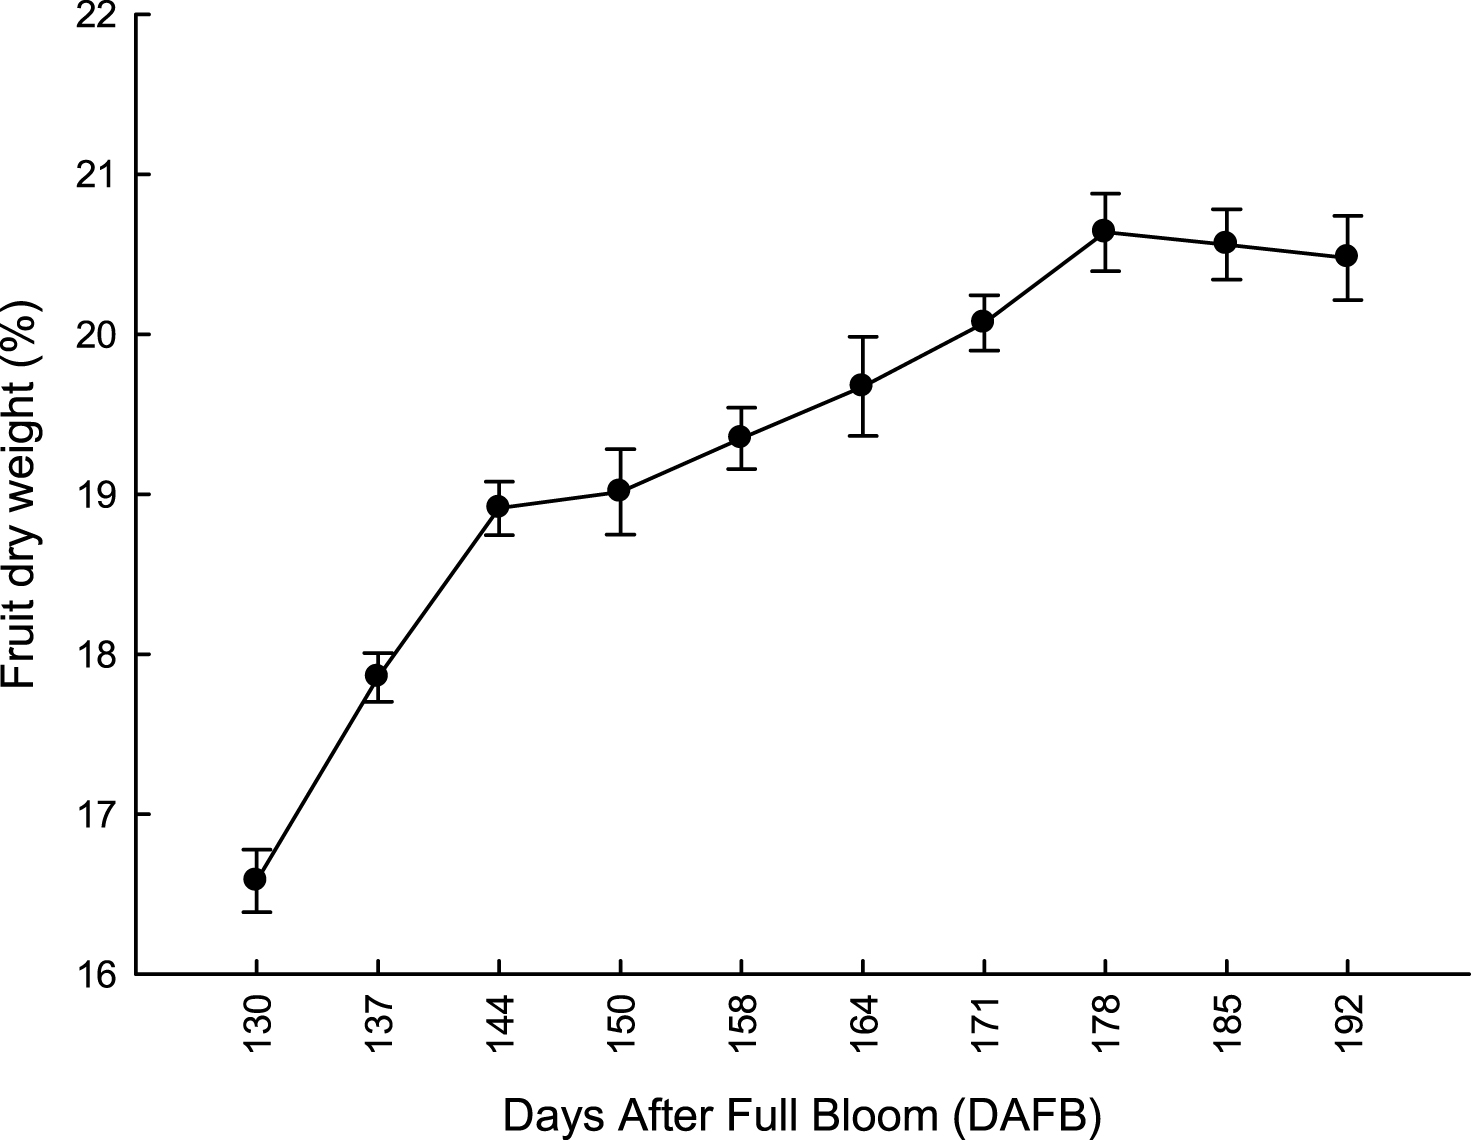
Fig.2
Evolution of fruit fresh weight at harvest of ‘Hayward’ kiwifruit from 130 to 192 DAFB (average 2012-2013 = 31 May). Data are means±SE (N = 45×2).
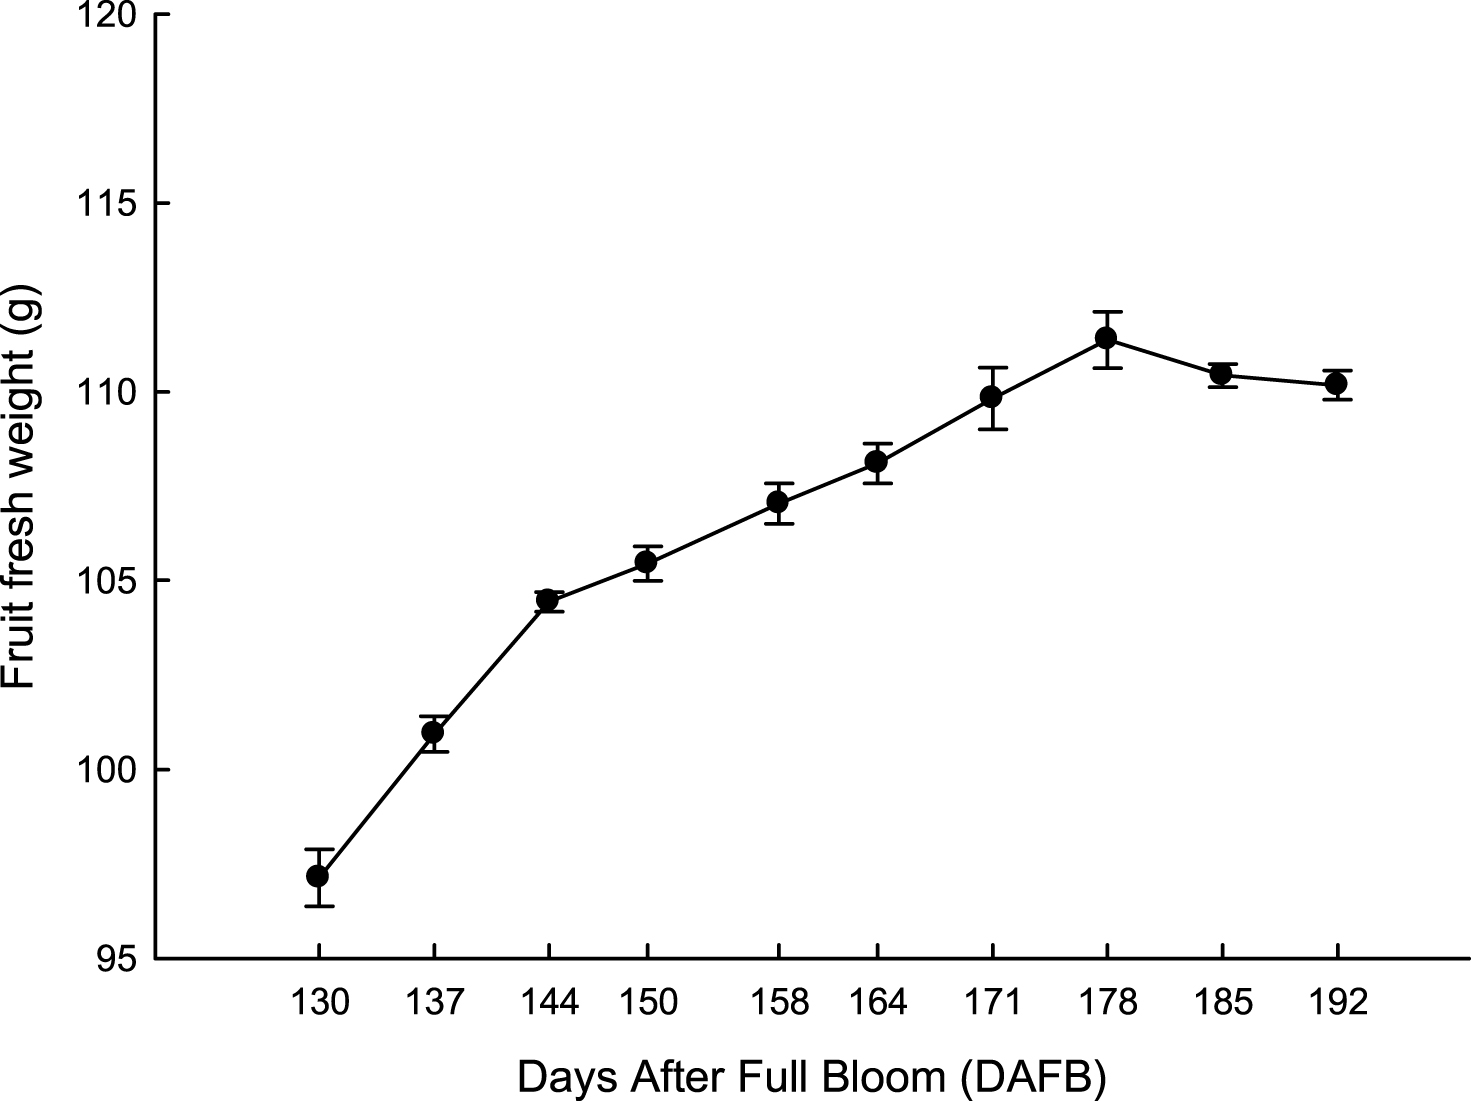
Fig.3
Leaf drop in ‘Hayward’ kiwifruit vines from 185 to 226 DAFB (average 2012-2013). Data are means±SE (N = 45×2).
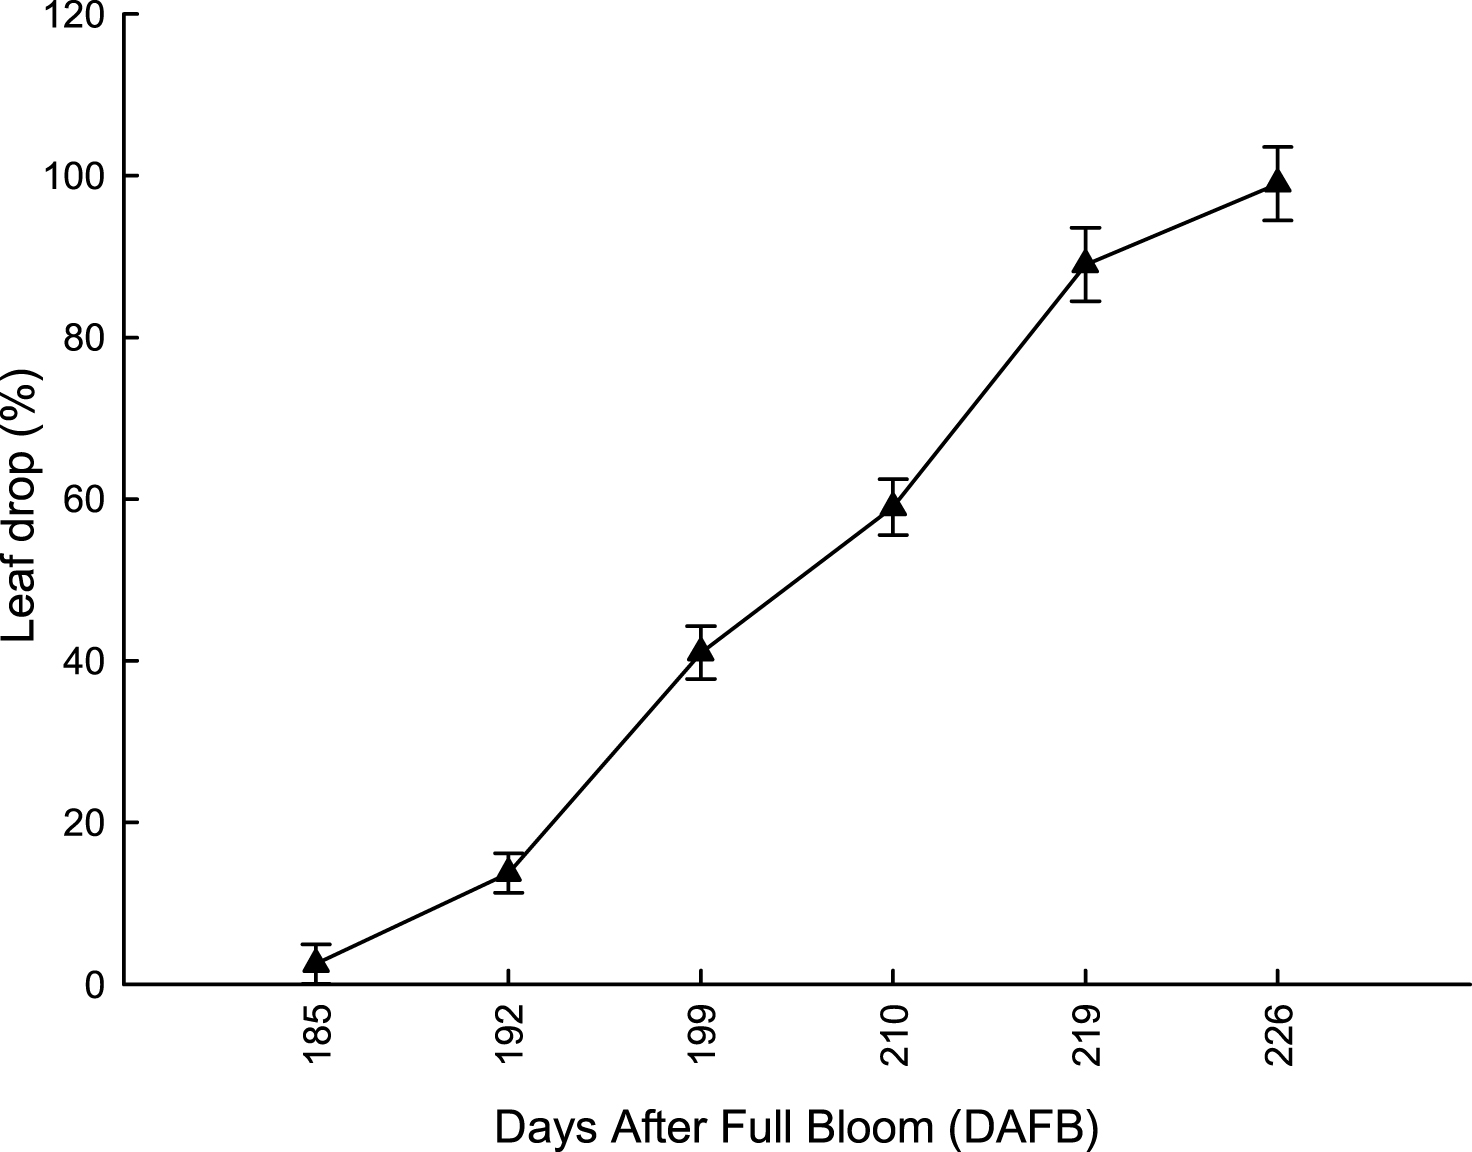
Fig.4
Evolution of flesh firmness and total solid soluble content (TSS) of ‘Hayward’ kiwifruit from 130 to 192 DAFB (average 2012-2013). Data are means±SE (N = 45×2).
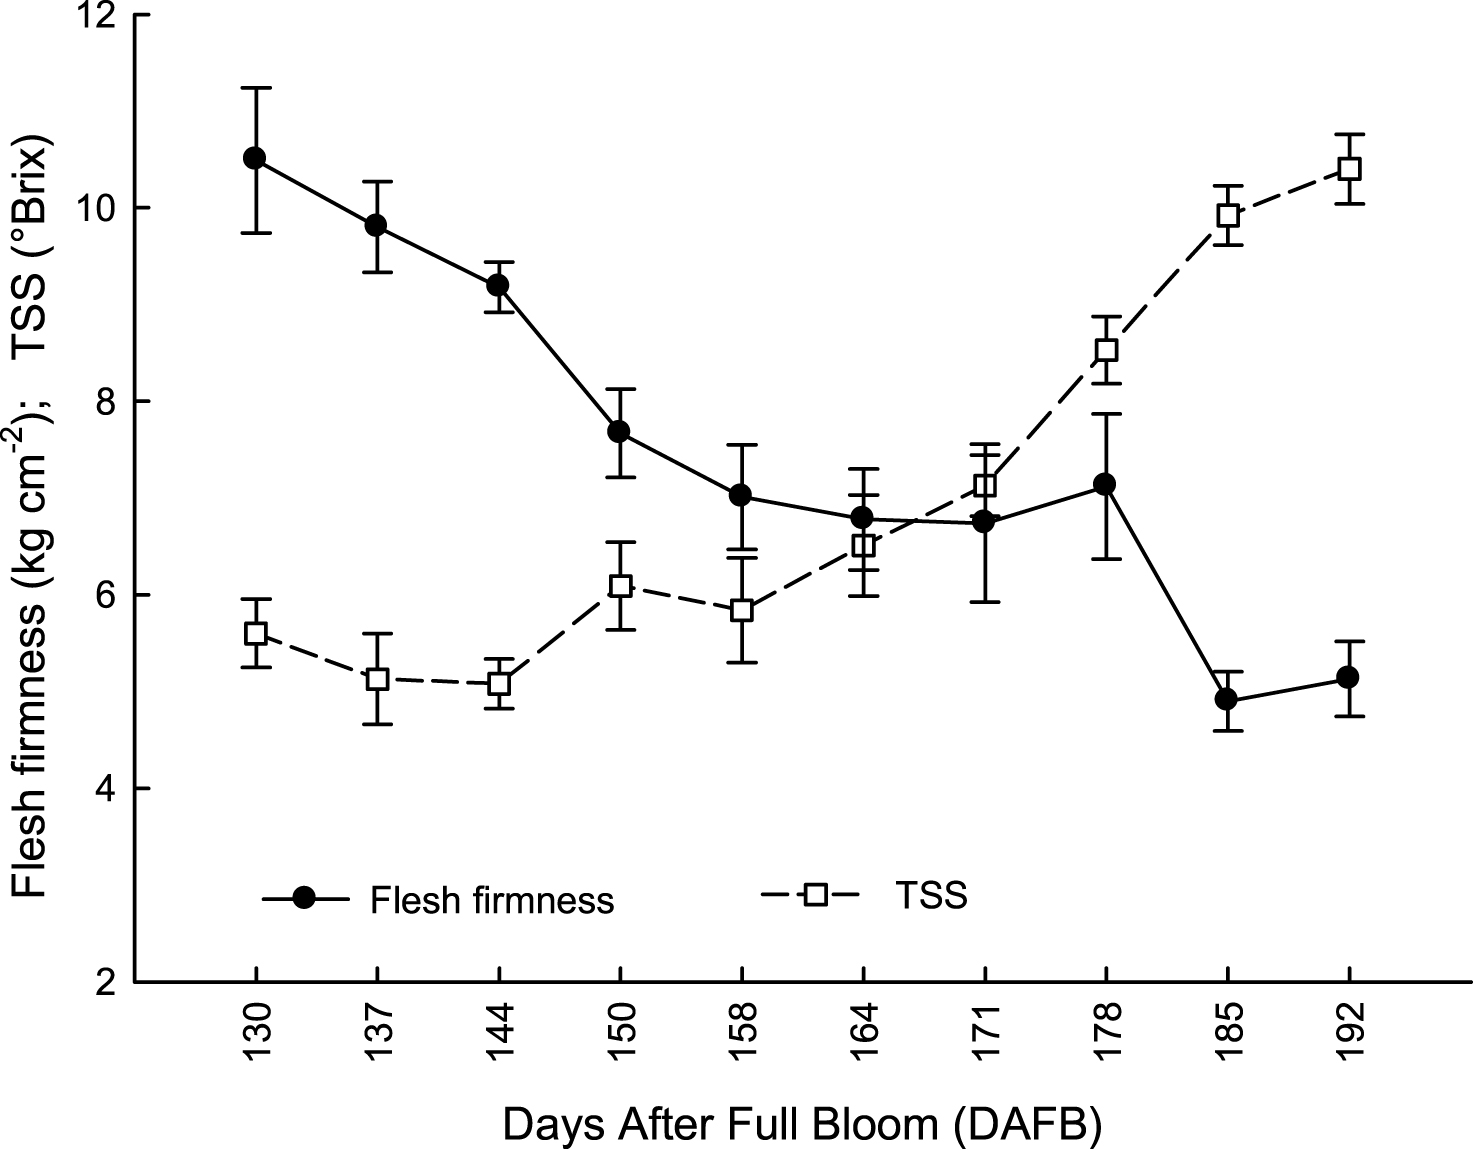
Fig.5
Evolution of Titratable acidity (TA) in kiwifruit from at harvest (from 130 to 192 DAFB) and after storage at 0°C and 95% RH for 120 days (data are means of 2012-2013; N = 45×2).
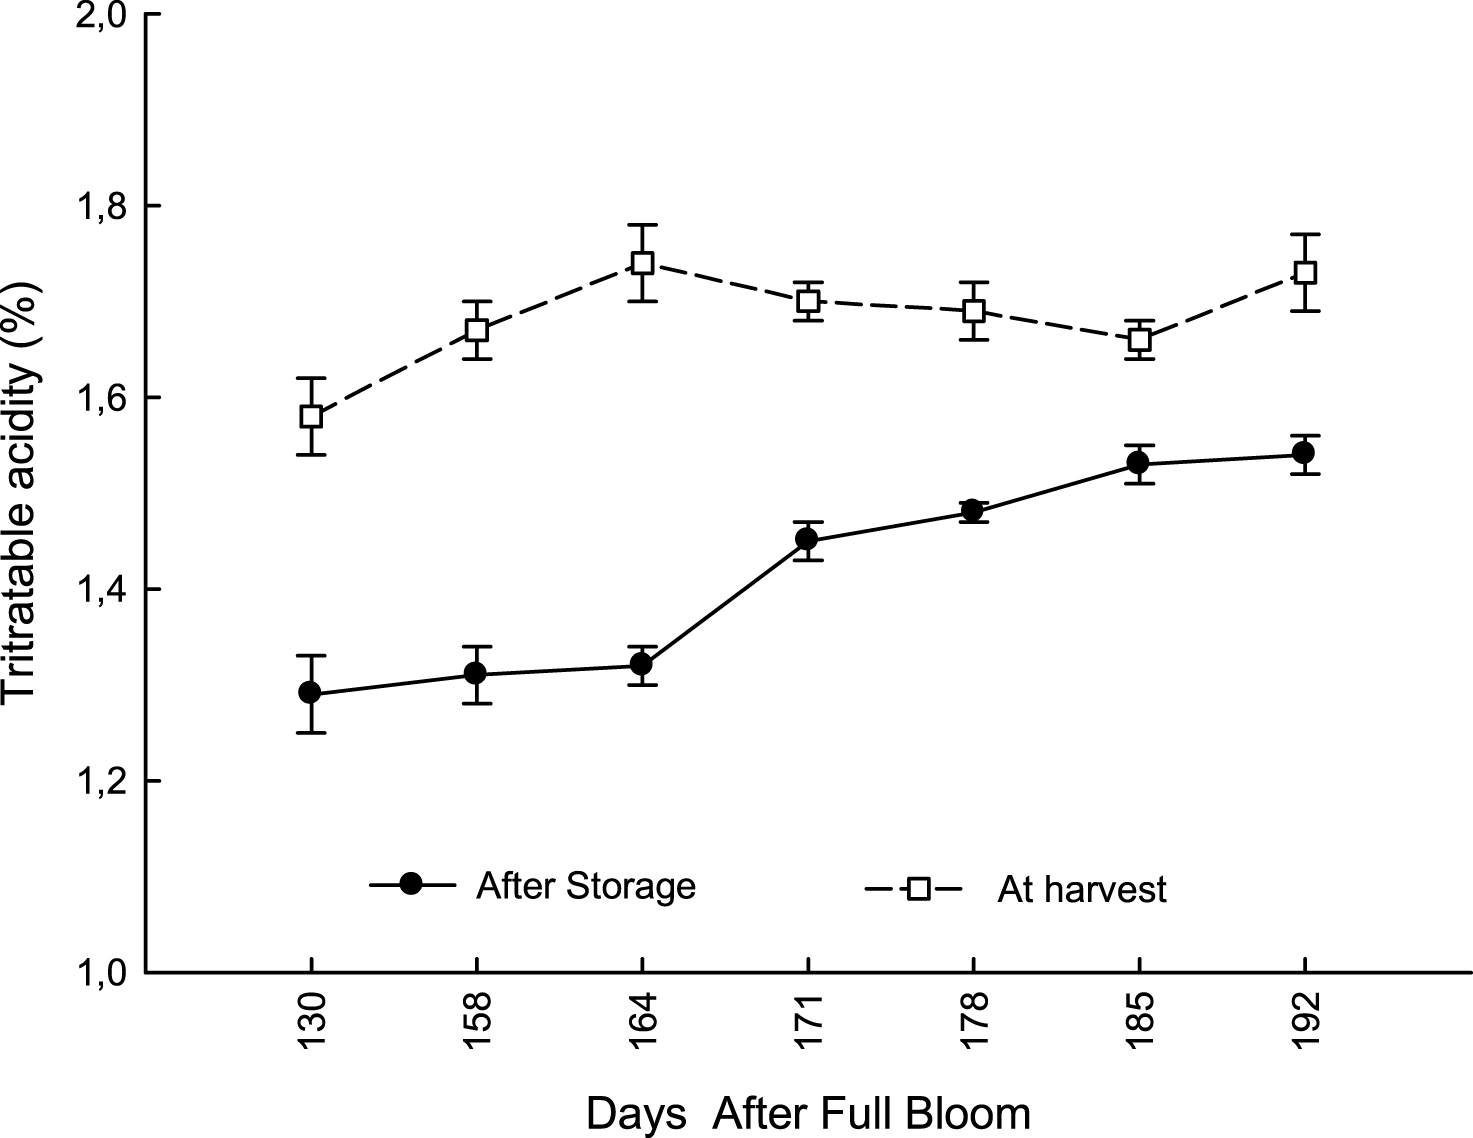
Fig.6
Relationship between total solid soluble content (TSS) in ‘Hayward’ kiwifruit, at fruit harvest time and after storage at 0°C and 95% RH for 120 days. Data are means of 2012-2013; N = 45×2.
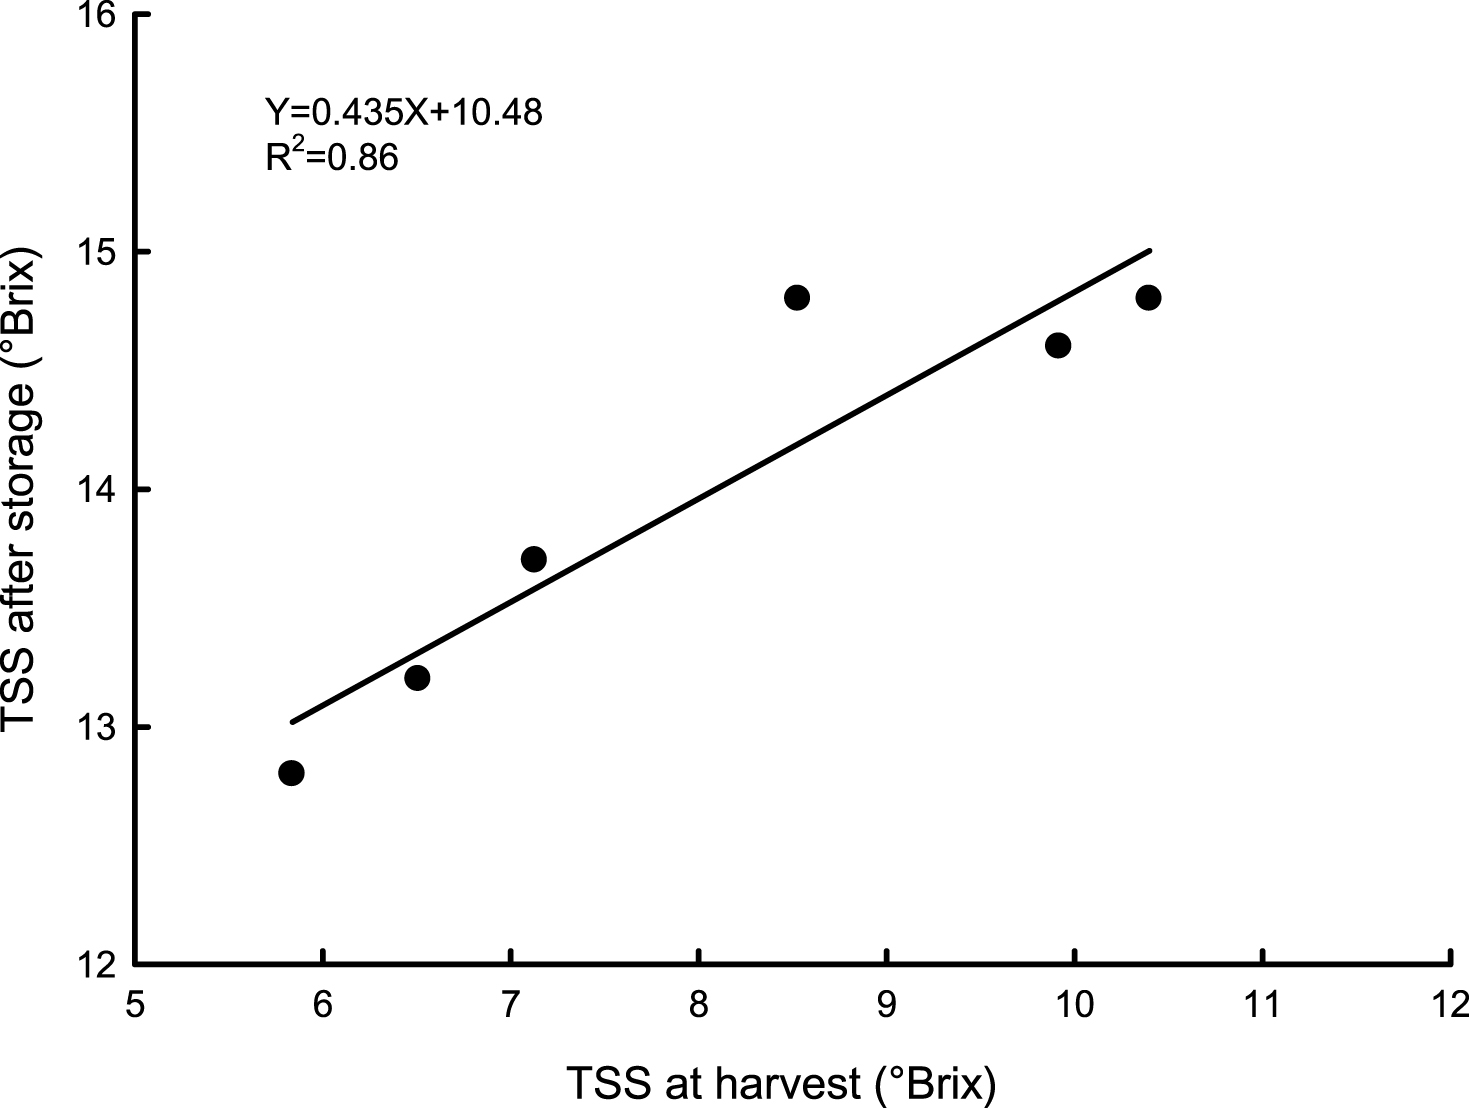
Table 1
Average daily temperature during fruit growth and ripening ofHayward kiwifruit (A. deliciosa) grown in Southern Italy(2012 and 2013)
| Average daily Temperature°C | Days after full bloom* | |
| 2012 | 2013 | |
| 17.5 | 17.7 | 130 |
| 17.0 | 17.3 | 137 |
| 17.2 | 17.5 | 144 |
| 16.9 | 17.0 | 150 |
| 16.5 | 16.6 | 158 |
| 16.0 | 16.2 | 164 |
| 15.5 | 15.4 | 171 |
| 15.1 | 15.0 | 178 |
| 14.5 | 14.3 | 185 |
| 13.8 | 13.6 | 192 |
*Full bloom occurred during the last week of May in 2012 (25 May) and one week later in 2013 (2 June).
Table 2
Flesh color index (L*, a*, b*) in fruit ofActinidia deliciosa, cv Hayward, at harvest time (from 130 to 192 DAFB) and after 120 days of storage at 0°C + 7 days of shelf-life at 20°C (average of two years = 2012-2013;N = 45×2)
| DAFB | At harvest | After storage | ||||
| L* | a* | b* | L* | a* | b* | |
| 130 | 63.2a | –18.1a | 37.1a | 48.3c | –7.1c | 15.6b |
| 144 | 60.8a | –16.2a | 36.0a | 48.9b | –7.1c | 15.8b |
| 158 | 56.1b | –15.1b | 35.1a | 51.1b | –8.8b | 16.5ab |
| 171 | 56.4b | –14.7b | 35.1a | 51.1b | –8.8b | 16.5ab |
| 178 | 58.2b | –14.1b | 34.2ab | 56.1a | –9.5a | 18.1a |
| 185 | 57.1b | –11.1c | 31.1b | 56.0a | –9.0a | 19.1a |
| 192 | 57.2b | –12.1c | 31.1b | 57.1a | –9.8a | 19.5a |
In the same column, different letters indicate significant differences at P≤0.05.
Table 3
Weight loss, flesh firmness, and total soluble solids content (TSS) in fruit of Actinidia deliciosa, cv Hayward, harvested from 130 to 192 DAFB after 120 days of storage at 0°C + 7 d of shelf-life at 20°C (Average of two years = 2012-2013; N = 45×2)
| DAFB | Weight loss (%) | Flesh firmness (Kg cm–2) | TSS (°Brix) |
| 130 | 4.92±0.08d | 2.0±0.1b | 12.2±0.3c |
| 144 | 4.89±0.13d | 2.0±0.1b | 12.5±0.3c |
| 158 | 4.74±0.12d | 1.9±0.3b | 12.8±0.4c |
| 164 | 3.89±0.10c | 2.3±0.2ab | 13.2±0.4bc |
| 171 | 3.36±0.09c | 2.3±0.3ab | 13.7±0.4b |
| 178 | 2.73±0.14b | 2.6±0.2a | 14.6±0.4a |
| 185 | 2.74±0.15b | 2.8±0.3a | 14.8±0.3a |
| 192 | 2.22±0.11a | 2.5±0.3a | 14.8±0.4a |
In the same column, different letters indicate significant differences per P≤0.05.
Table 4
Total polyphenols content (TPH), total antioxidant capacity (TAC) and ascorbic acid (AA) in fruit of Actinidia deliciosa, cv Hayward, at harvest (from 130 to 192 DAFB) and after 120 days of storage at 0°C + 7 d of shelf-life at 20°C (Average of two years = 2012-2013 N = 45×2)
| DAFB | TPH | TAC | AA | |||
| (mg gallic acid | (μmoles Trolox | (mg/100 gFw) | ||||
| equivalents/100 g Fw) | (equivalents/g Fw) | |||||
| At harvest | After storage | At harvest | After storage | At harvest | After storage | |
| 130 | 72.0±1.8a | 64.8±2.1n.s. | 4.8±0.1a | 4.2±0.02ab | 74.8±2.0a | 40.4±2.5b |
| 144 | 60.5±1.1a | 65.3±1.7 | 4.5±0.2a | 4.1±0.03ab | 70.1±1.1a | 40.2±2.5b |
| 158 | 52.0±0.8b | 64.6±2.2 | 3.6±0.1b | 4.2±0.01ab | 65.7±2.1ab | 40.4±2.1b |
| 164 | 53.1±0.6b | 65.0±3.2 | 3.7±0.2b | 4.4±0.02a | 61.0±2.0b | 44.2±3.1a |
| 171 | 54.2±0.2b | 64.5±2.2 | 3.6±0.2b | 4.5±0.04a | 59.0±1.2b | 47.1±2.2a |
| 178 | 57.2±0.8b | 66.4±3.1 | 3.9±0.1b | 4.8±0.02a | 57.0±2.1b | 46.3±2.4a |
| 185 | 57.3±0.8b | 65.8±1.7 | 3.9±0.1b | 3.9±0.03b | 42.3±0.3c | 35.2±0.4c |
| 192 | 58.1±0.9b | 65.9±1.3 | 3.8±0.4b | 3.8±0.01b | 42.0±0.3c | 36.4±0.4c |
In the same column, different letters indicate significant differences per P≤0.05. n.s. = not significant.
Table 5
Pearson’s Coefficient between Ascorbic Acid (AA) and Total Antioxidant Capacity (TAC) and between Total Polyphenos Content (TPH) and Total Antioxidant Capacity (TAC) in kiwifruit at the harvest (158 and 178 DAFB; N = 45) and after storage (N = 45)
| Harvest at | Harvest at | After storage and | After storage and | |
| 158 DAFB | 178 DAFB | harvest at 158 DAFB | harvest at 178 DAFB | |
| TAC | TAC | TAC | TAC | |
| AA | 0.64±0.02n.s. | 0.58±0.06 | 0.59±0.03 | 0.56±0.02 |
| TPH | 0.61±0.01c | 0.75±0.05b | 0.82±0.02a | 0.92±0.01a |
In the same row, different letters indicate significant differences per P≤0.05. n.s. = not significant.


