
The association between paraspinal muscle degeneration and osteoporotic vertebral compression fracture severity in postmenopausal women
Abstract
BACKGROUND:
According to reports in the literature, osteoporotic vertebral compression fracture (OVCF) is associated with paraspinal muscle degeneration; however, the association between the severity of OVCF and paraspinal muscle degeneration is not clear.
OBJECTIVE:
The purpose of this study was to investigate the association between paraspinal muscle degeneration and OVCF severity in postmenopausal women.
METHODS:
Three hundred and seventy-six MRI images from 47 patients were collected and analyzed. Sagittal and axial coronal T2-weighted images were used to measure the fractured vertebra sagittal cross-sectional area (FSCSA), the adjacent normal vertebral body sagittal cross-sectional area (NSCSA), paraspinal muscle cross-sectional area (CSA), and the fat cross-sectional area (FCSA). The ratio of fractured vertebra compressed sagittal cross-sectional area (RCSA) and fatty infiltration ratio (FIR) was subsequently calculated. The formulas for RCSA and FIR calculations are as follows: RCSA
RESULTS:
The correlation between paraspinal muscle degeneration and OVCF severity was analyzed using the Pearson correlation, and multiple regression analysis was performed to explore related risk factors. OVCF severity was closely associated with paraspinal muscle degeneration (L3/4 FIR
CONCLUSION:
OVCF severity was associated with the FIR of paraspinal muscles, and L3/4 FIR was a predictive factor for OVCF severity in postmenopausal women.
1.Introduction
Osteoporotic vertebral compression fractures (OVCF) manifest as vertebral body collapse, which leads to a decrease in vertebral height. The incidence of OVCF is increasing with the aging of the general population. A global study conducted in 2000, reported the incidence of osteoporotic fractures was 9 million per year, of which 1.4 million were cases OVCF [1, 2]. About 40% of women and 13% of men will suffer at least one osteoporotic fracture in their lifetime [3]. OVCF is typically accompanied by pain and has a significant negative impact on patients’ independence in performing the activities of daily living and on quality of life [4]. Such effects have led to an increase in the both the burden and costs of medical care [5, 6]; therefore, the active prevention and treatment of OVCF are important interventions.
Conservative treatment and vertebral augmentation surgery are the most widely used approaches for treating OVCF; however, severe OVCF can lead to spinal cord compression, vertebral collapse, and severe spinal deformity, in which open spinal surgeries, including surgical stabilization and decompression, are indicated. The morbidity of severe OVCF can be reduced by the identification of associated risk factors. OVCF is a disease that occurs particularly in the elderly population and postmenopausal women, in whom surgical procedures are associated with exceedingly high operative risks; therefore, identifying the risk factors for severe OVCF is of considerable clinical importance.
Fat infiltration is a key manifestation of paraspinal muscle degeneration and may lead to a loss of muscle strength and endurance [7]. The paraspinal muscles are primarily composed of multifidus, erector spinae, and psoas muscle, which play an important role in maintaining spinal alignment and sagittal balance [8, 9, 10]. The association between paraspinal muscle degeneration and spinal deformities, along with low back pain, has attracted considerable attention [11, 12, 13, 14, 15]. Recent studies show that postmenopausal OVCF is associated with paraspinal muscle degeneration, from a both quantitative and qualitative perspective [16, 17]. The relationship between paraspinal muscle degeneration and OVCF severity, however, is currently unclear, and no data has been reported in the literature to date on the association between paraspinal muscle degeneration and OVCF severity in postmenopausal women. Due to the lack of information in this area, further study of the relationship between paraspinal muscle degeneration and OVCF severity is warranted. With this goal in mind, we conducted a cross-sectional study to explore this relationship, in which we hypothesized that paraspinal muscle degeneration was closely related to OVCF severity, such that increases in severe paraspinal muscle degeneration, resulted in increasingly severe vertebral compression.
2.Materials and methods
The present study is a retrospective cross-sectional study that was conducted in accordance with the principles of the Declaration of Helsinki and approved by the medical ethics committee of Jingmen No. 2 People’s Hospital (No. 2021052). All patients signed written informed consent prior to study initiation.
2.1General information
We retrospectively reviewed female patients with OVCF who were hospitalized from March 2019 to December 2021. Inclusion criteria for the study were: (1) Complete medical information; (2) Women aged 50 years or older and postmenopausal; (3) Dual-energy X-ray (DXA) examination of bone mineral density, and (BMD) results indicating low bone mass or osteoporosis; (4) Reported single-level thoracic or lumbar OVCF; (5) A fracture site with a high signal change on a T2-weighted fat suppression image on MRI. Exclusion criteria were as follows: (1) History of a high-energy injury (e.g., from a motor vehicle accident or a high fall, etc.); (2) History of surgery on the hips, spine, or pelvis; (3) Other spinal diseases, such as spinal deformities, spinal tumors, spinal tuberculosis, or Kümmell disease; (4) Multiple vertebral fractures; (5) Concomitant chronic obstructive pulmonary disease (COPD), neuromuscular dystrophy, ankylosing spondylitis, or Parkinson’s disease; (6) Prior anti-osteoporosis therapy.
2.2Evaluation metrics
2.2.1Lumbar bone mineral density
BMD of the lumbar spine (L1-L4) was measured by DXA (DMS-STRATOS, France) conducted by a professional radiologist. Mean BMD and BMD of L1 to L4 were obtained. Osteoporosis was diagnosed according to World Health Organization criteria: T-score
2.2.2Imaging-related parameters
Images were obtained with a 1.5T magnetic resonance scanner (General Electric, USA), using a standard spine array coil. Imaging protocols included acquisition of axial and sagittal T2-weighted images. The parameters for T2-weighted images were as follows: slice thickness 4 mm, and slice interval 1 mm. The axial position was located in the middle of the sagittal plane, where the sagittal T2-weighted image of the fracture site was obtained; axial T2-weighted images of the lumbar spine were obtained at the intervertebral disc level of L3/4, L4/5 and L5/S1. Image J (Image J Version 1.5E, National Institutes of Health, Bethesda, Maryland, USA) software was used for processing MRI images, and the regions to be measured were designated as regions of interest (ROI). Using the image-selection tool from the software, the fractured vertebral body and its inferior normal vertebral body boundary were manually delineated on the T2-weighted image of the sagittal plane of the fracture site. The ROI was subsequently measured (Fig. 1). Assessed parameters included fractured vertebral body sagittal cross-sectional area (FSCSA) and normal vertebral body sagittal cross-sectional area (NSCSA). The ratio of the fractured vertebra compressed sagittal cross-sectional area (RCSA) was calculated with the following formula: RCSA
Figure 1.
Segmentations of Vertebral body boundary. The median sagittal T2-weighted MRI was selected, and the vertebral body boundary was selected by Image J software, then the fractured vertebra sagittal cross-sectional area (FSCSA) and the adjacent normal vertebral body sagittal cross-sectional area (NSCSA) were measured.
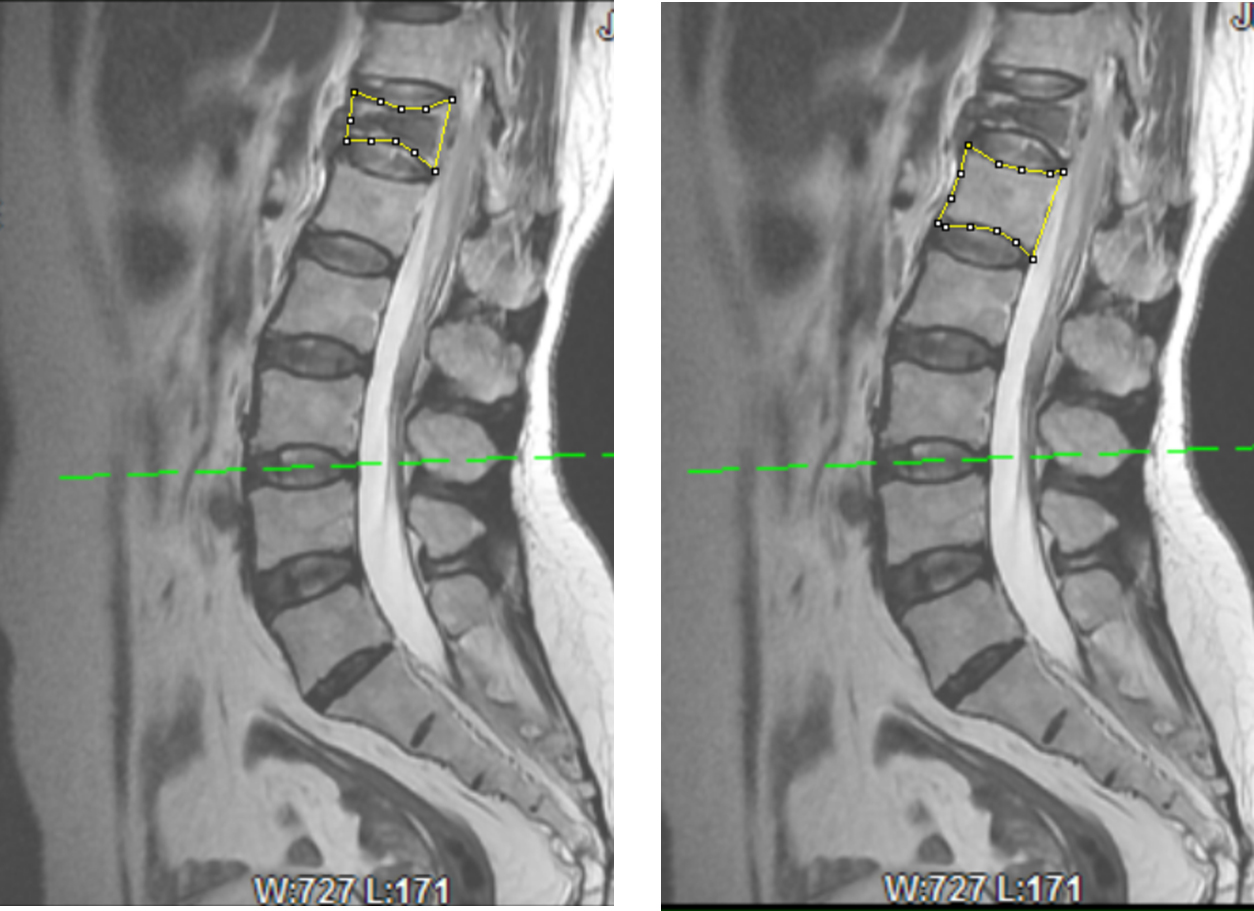
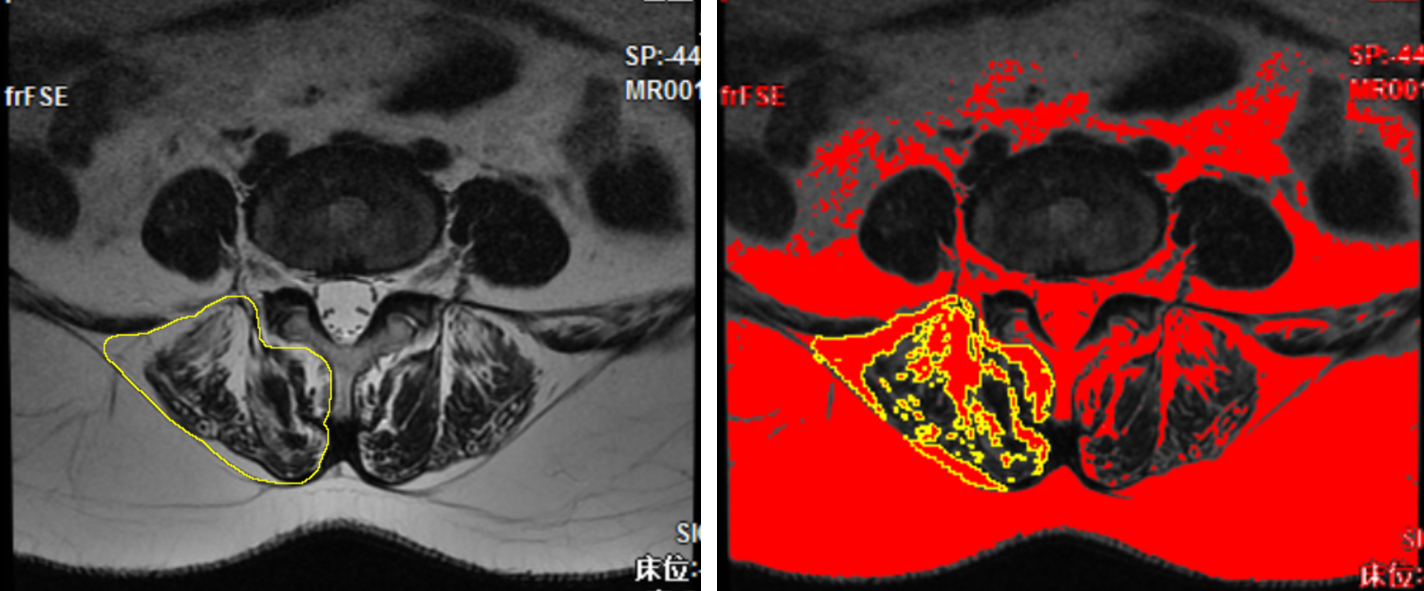
Figure 2.
Measurement of paraspinal muscle and fat cross-sectional area. Intervertebral disc level on axial T2-weighted MRI were selected, and the boundary of paraspinal muscles (including erector spinae and multifidus) was depicted by Image J software and paraspinal muscles cross-sectional area (CSA) was measured. Threshold method was used to select intra-spinal adipose tissue and fat cross-sectional area (FCSA) was measured.
Parameter assessments were performed by two spinal surgeons with more than 5 years’ working experience and who had received training on Image J software. MRI images of 10 patients were randomly selected to measure NSCSA and L3/4FCSA for the assessment of intra-rater repeatability and inter-rater reproducibility. In addition, the raters were blinded to the clinical and MRI data. Each rater measured the parameters twice, with each replicate performed 10 days apart.
2.3Statistical analyses
Statistical analyses of the data were conducted using SPSS22.0 (IBM Corp., Armonk, NY, USA). Intra-rater reliability and inter-rater reliability for NSCSA and L3/4FCSA were evaluated using the intraclass correlation coefficient (ICC). The data are expressed as the mean and standard deviation. Correlations were analyzed using Pearson correlation analysis. Multiple linear regression analysis was performed to identify the risk factors for RCSA, with
3.Results
A total of 108 patients met the inclusion criteria, among whom 50 met at least one exclusion criteria, and 11 were unwilling to participate in the study. Ultimately, 47 patients were enrolled in the study. Three hundred and seventy-six images of 47 patients were collected and analyzed. Patients had a mean age of 64.6 years (range: 50 to 85 years), mean body mass index (BMI) was 23.17 kg/m
Table 1
Demographic data
| Mean |
| ||
|---|---|---|---|
| BMD (T) | 47 | ||
| BMI (kg/m | 23.17 | 47 | |
| AGE (years) | 64.66 | 47 | |
| FSCSA (mm | 1217.78 | 47 | |
| NSCSA (mm | 1657.08 | 47 | |
| RCSA (%) | 26.71 | 47 | |
| L3/4FIR (%) | 27.68 | 47 | |
| L4/5FIR (%) | 33.09 | 47 | |
| L5/S1FIR (%) | 37.50 | 47 | |
Data are expressed as means
Intra-rater ICC was excellent for NSCSA and L3/4FCSA [ICC
Correlation analysis among all parameters showed that RCSA had a statistically significant correlation with L3/4FIR, L4/5FIR, and L5/S1FIR (L3/4 FIR,
Table 2
Pearson correlation analysis of all parameters (
| BMD (T) | BMI (kg/m | AGE (years) | FSCSA (mm | NSCSA (mm | RCSA | L3/4FIR | L4/5FIR | L5/S1FIR | |
|---|---|---|---|---|---|---|---|---|---|
| BMD (T) | 0.02 | 0.27 | 0.04 | 0.61 | 0.28 | 0.30 | 0.25 | ||
| BMI (kg/m | 0.13 | 1.00 | 0.43 | 0.33 | 0.90 | 0.98 | 0.29 | ||
| AGE (years) | 0.02 | 0.13 | 0.25 | 0.03 | 0.44 | 0.05 | 0.02 | 0.17 | |
| FSCSA (mm | 0.27 | 1.00 | 0.25 | 0.05 | 0.04 | ||||
| NSCSA (mm | 0.04 | 0.43 | 0.03 | 0.56 | 0.85 | 0.54 | 0.64 | ||
| RCSA | 0.61 | 0.33 | 0.44 | 0.56 | |||||
| L3/4FIR | 0.28 | 0.90 | 0.05 | 0.85 | |||||
| L4/5FIR | 0.30 | 0.98 | 0.02 | 0.05 | 0.54 | ||||
| L5/S1FIR | 0.25 | 0.29 | 0.17 | 0.04 | 0.64 |
BMD, bone mineral density; BMI, body mass index; FSCSA, fractured vertebral body sagittal cross-sectional area; NSCSA, normal vertebral body sagittal cross-sectional area; RCSA, ratio of fractured vertebra compressed sagittal cross-sectional area; FIR, fatty infiltration ratio.
Table 3
Logistic regression model with RCSA as dependent variable
| B | SE B |
|
| ||
|---|---|---|---|---|---|
| BMD | 0.197 | 0.289 | 0.019 | 0.68 | 0.501 |
| BMI (kg/m | 0.106 | 0.532 | |||
| AGE (years) | 0.009 | 0.041 | 0.006 | 0.224 | 0.824 |
| L3/4FIR | 0.513 | 0.23 | 0.421 | 2.232 | 0.033 |
| L4/5FIR | 0.253 | 0.552 | |||
| L5/S1FIR | 0.186 | 0.118 | 0.174 | 1.57 | 0.126 |
B, unstandardized regression coefficients; SE, standard error;
4.Discussion
Severe OVCF is debilitating; therefore, it is important to actively prevent the occurrence of this degenerative disorder [21, 22]. Analysis of the risk factors for severe OVCF should provide an important basis for appropriate prevention and treatment [23].
Previous studies have demonstrated a correlation between paraspinal muscle degeneration and the incidence of OVCF [16, 17]; however, the correlation between the severity of OVCF and paraspinal muscle degeneration remains unclear. A study by Ikchan confirmed that paraspinal steatosis, and the degree of initial compression of OVCF, were predictors of the progression of vertebral collapse [24]. Although this study found that the degree of initial vertebral compression was related to the progression of vertebral collapse, the specific risk factors have not been further investigated. We found that the degree of initial compression of OVCF varies widely, and many patients have obvious kyphosis at the time of initial OVCF, a finding that attracted the attention of our team. We designed this study to determine whether the initial severity of OVCF was related to paraspinal muscle degeneration. Researchers have reported a number of risk factors for OVCF, such as age, history of fragility fractures, smoking habits, alcohol intake, steroid use, low BMD, lower body mass index, presence of kyphosis, and early onset of menopause [25, 26]. However, few studies have explored the risk factors related to the severity of OVCF, and we identified no studies on the correlation between paraspinal muscle degeneration and the severity of OVCF.
Paraspinal muscle degeneration is primarily manifested as paraspinal muscle fat infiltration, where muscle fibers are replaced by adipose tissue, thereby decreasing the muscle’s physical function [27, 28]. In the present study, the proportion of muscle fat infiltration was used to represent the degree of paraspinal muscle degeneration, which is consistent with previous studies [16, 17, 24]. Assessment of CSA in the paraspinal muscles also showed that no single level was representative of the entire lumbar spine, as CSA measurements varied significantly between levels [29]. This observation is consistent with our study, in which the degeneration of paraspinal muscle at a single level does not represent the degeneration of the entire paraspinal muscle, although paraspinal muscle degeneration at different levels was correlated.
Lumbar lordosis physiological vertices, which are the hub of lumbar spine physiological activity, were conducted in the third lumbar vertebra and determined to be the center of lumbar spine mechanics. Therefore, the degeneration of L3/4 paraspinal muscle may be more susceptible in spinal degenerative diseases, and the L3/4 FIR found in this study was a predictor of the severity of OVCF, which could be supported from the perspective of anatomy and biomechanics; however, further experimental studies are needed to confirm this hypothesis.
Related research has confirmed that paraspinal muscle degeneration is closely related to chronic lower back pain, lumbar disc herniation, lumbar spinal stenosis, lumbar spondylolisthesis, scoliosis, and other related diseases [30, 31, 32, 33] associated with concurrent changes in spinal and pelvic parameters [34, 35]. These studies illustrate the role of paraspinal muscles as a stable structure in spinal dynamics that have an important function in spinal-related disease development, such that paraspinal muscle degeneration may alter mechanical structure and affect the original state of balance in the spine. From the perspective of a musculoskeletal pathophysiological correlation, studies have confirmed the existence of molecular signal pathways related to musculoskeletal association and interaction between muscle and bone [36, 37, 38]. Sarcopenia is an age-related condition defined by a progressive and generalized loss of muscle mass and function [39], osteoporosis and sarcopenia often co-exist [40]. Postmenopausal women suffer from the loss of bone mass due to decreased estrogen levels, a condition that may result in osteoporosis. In addition, patients with osteoporosis often suffer from pathological conditions that co-exist with decreased BMD and paraspinal muscle degeneration [41, 42]. In the past, the role of BMD in OVCF was the primary focus, but based on current musculoskeletal correlation studies, attention should also be focused on paraspinal muscle degeneration. Although the correlation of the severity of OVCF and BMD was not statistically significant in the present study, this finding may be associated with the limitations of BMD detection methods. Since BMD measurements were obtained by two-dimensional analysis of DXA, the prediction of bone mass can be complicated by vascular calcifications, vertebral fractures, and osteophytes, that result in an exaggeration of BMD severity [43, 44]. This potential complication is also a limitation of this study. The patients in this group were older and many of them had obvious spinal hyperosteogeny. QCT examination may result in more accurate results.
Findings from the present study will provide additional guidance for the prevention and rehabilitation of severe OVCF. Paraspinal muscle degeneration is an important risk factor for severe OVCF; thus, early guidance for the prevention of paraspinal muscle degeneration in patients with osteoporosis may reduce the incidence of severe OVCF. Rehabilitation training and nutritional supplements are important measures in the prevention of muscle degeneration [45]. In addition, the prevention and rehabilitation of severe OVCF risk factors through multidisciplinary cooperation will play an important role in preventing severe vertebral fractures [46]. Such findings may need to be gradually emphasized in the prevention and treatment of OVCF.
Limitations of this study are the small number of cases included and a certain degree of bias; thus, the sample size should be expanded in future studies. In addition, although we found that L3/4 paraspinal muscle degeneration is related to the severity of OVCF, other factors related to muscle degeneration, such as patients’ physical activity levels, nutritional status, age at menopause and gender differences, have not been included in the study. Therefore, these factors may have affected the accuracy of the study findings and conclusions.
5.Conclusion
OVCF severity is associated with FIR of paraspinal muscles, such that a higher degree of paraspinal muscle fat infiltration leads to increased severity in OVCF vertebral compression. L3/4 FIR was a predictive factor for OVCF severity in postmenopausal women. Quantitative regression degree measurements of paraspinal muscles on MRI may predict the risk of severe OVCF and provide evidence for early preventive interventions.
Acknowledgments
This work was supported by Jingmen No. 2 People’s Hospital and PLA Middle Military Command General Hospital.
Conflict of interest
The authors declare no competing interests.
Funding
This work was funded by the Hubei Traditional Chinese Medicine Scientific Research Project (No. ZY2021Q009).
References
[1] | Zhang H, Xu C, Zhang T, Gao Z, Zhang T. Does percutaneous vertebroplasty or Balloon kyphoplasty for Osteoporotic Vertebral Compression Fractures Increase the Incidence of New Vertebral Fractures? A meta-analysis. Pain Physician. (2017) ; 20: (1): E13-E28. |
[2] | Johnell O, Kanis JA. An estimate of the worldwide prevalence and disability associated with osteoporotic fractures. Osteoporos Int. (2006) ; 17: (12): 1726-1733. |
[3] | Chen C, Zhang X, Guo J, et al. Quantitative imaging of peripheral trabecular bone microarchitecture using MDCT. Med Phys. (2018) ; 45: (1): 236-249. |
[4] | Hou Y, Yao Q, Zhang G, Ding L, Huang H. Polymethylmethacrylate distribution is associated with recompression after vertebroplasty or kyphoplasty for osteoporotic vertebral compression fractures: A retrospective study. PLoS One. (2018) ; 13: (6): e0198407. |
[5] | Jung HJ, Park YS, Seo HY, et al. Quality of life in patients with osteoporotic vertebral compression Fractures. J Bone Metab. (2017) ; 24: (3): 187-196. |
[6] | Makridis KG, Karachalios T, Kontogeorgakos VA, Badras LS, Malizos KN. The effect of osteoporotic treatment on the functional outcome, re-fracture rate, quality of life and mortality in patients with hip fractures: A prospective functional and clinical outcome study on 520 patients. Injury. (2015) ; 46: (2): 378-383. |
[7] | Han G, Jiang Y, Zhang B, Gong C, Li W. Imaging evaluation of fat infiltration in paraspinal muscles on MRI: A systematic review with a focus on methodology. Orthop Surg. (2021) ; 13: (4): 1141-1148. |
[8] | Jeon I, Kim SW, Yu D. Paraspinal muscle fatty degeneration as a predictor of progressive vertebral collapse in osteoporotic vertebral compression fractures [published online ahead of print, 2021 Jul 31]. Spine J. (2021) ; S1529-9430 (21) 00844-5. |
[9] | Takahashi S, Hoshino M, Ohyama S, et al. Relationship of back muscle and knee extensors with the compensatory mechanism of sagittal alignment in a community-dwelling elderly population. Sci Rep. (2021) ; 11: (1): 2179. |
[10] | Banno T, Arima H, Hasegawa T, et al. The effect of paravertebral muscle on the maintenance of upright posture in patients with adult spinal deformity. Spine Deform. (2019) ; 7: (1): 125-131. |
[11] | Eguchi Y, Suzuki M, Yamanaka H, et al. Associations between sarcopenia and degenerative lumbar scoliosis in older women. Scoliosis Spinal Disord. (2017) ; 12: : 9. |
[12] | Kalichman L, Carmeli E, Been E. The association between imaging parameters of the paraspinal muscles, spinal degeneration, and low back pain. Biomed Res Int. (2017) ; 2017: : 2562957. |
[13] | Yuan L, Zeng Y, Chen Z, Li W, Zhang X, Mai S. Degenerative lumbar scoliosis patients with proximal junctional kyphosis have lower muscularity, fatty degeneration at the lumbar area. Eur Spine J. (2021) ; 30: (5): 1133-1143. |
[14] | Kang S, Chang MC, Kim H, et al. The effects of paraspinal muscle volume on physiological load on the lumbar vertebral column: A finite-element study. Spine (Phila Pa 1976). (2021) ; 46: (19): E1015-E1021. |
[15] | Shahidi B, Yoo A, Farnsworth C, Newton PO, Ward SR. Paraspinal muscle morphology and composition in adolescent idiopathic scoliosis: A histological analysis. JOR Spine. (2021) ; 4: (3): e1169. |
[16] | Kim JY, Chae SU, Kim GD, Cha MS. Changes of paraspinal muscles in postmenopausal osteoporotic spinal compression fractures: Magnetic resonance imaging study. J Bone Metab. (2013) ; 20: (2): 75-81. |
[17] | Huang CWC, Tseng IJ, Yang SW, Lin YK, Chan WP. Lumbar muscle volume in postmenopausal women with osteoporotic compression fractures: Quantitative measurement using MRI. Eur Radiol. (2019) ; 29: (9): 4999-5006. |
[18] | Shaikh N, Zhang H, Brown SHM, et al. The effect of posture on lumbar muscle morphometry from upright MRI. Eur Spine J. (2020) ; 29: (9): 2306-2318. |
[19] | Fortin M, Battié MC. Quantitative paraspinal muscle measurements: Inter-software reliability and agreement using Osiri X and Image J. Phys Ther. (2012) ; 92: (6): 853-864. |
[20] | Shafaq N, Suzuki A, Matsumura A, et al. Asymmetric degeneration of paravertebral muscles in patients with degenerative lumbar scoliosis. Spine (Phila Pa 1976). 2012: ; 37: (16): 1398-1406. |
[21] | Jin J. Screening for osteoporosis to prevent fractures. JAMA. (2018) ; 319: (24): 2566. |
[22] | Mitchell P, Akesson K, Chandran M, Cooper C, Ganda K, Schneider M. Implementation of Models of Care for secondary osteoporotic fracture prevention and orthogeriatric Models of Care for osteoporotic hip fracture. Best Pract Res Clin Rheumatol. (2016) ; 30: (3): 536-558. |
[23] | Si L, Winzenberg TM, Palmer AJ. A systematic review of models used in cost-effectiveness analyses of preventing osteoporotic fractures. Osteoporos Int. (2014) ; 25: (1): 51-60. |
[24] | Jeon I, Kim SW, Yu D. Paraspinal muscle fatty degeneration as a predictor of progressive vertebral collapse in osteoporotic vertebral compression fractures. Spine J. (2021) ; S1529-9430 (21) 00844-5. |
[25] | Saito M, Marumo K. The effects of homocysteine on the skeleton. Curr Osteoporos Rep. (2018) ; 16: (5): 554-560. |
[26] | Zvekic-Svorcan J, Aleksic J, Jankovic T, et al. Capture the vertebral fracture: Risk factors as a prediction. J Back Musculoskelet Rehabil. (2019) ; 32: (2): 269-276. |
[27] | Barbat-Artigas S, Pion CH, Leduc-Gaudet JP, et al. Exploring the role of muscle mass, obesity, and age in the relationship between muscle quality and physical function. J Am Med Dir Assoc. (2014) ; 15: (4): 303.e13-303.e3.03E20. |
[28] | Kalinkovich A, Livshits G. Sarcopenic obesity or obese sarcopenia: A cross talk between age-associated adipose tissue and skeletal muscle inflammation as a main mechanism of the pathogenesis. Ageing Res Rev. (2017) ; 35: : 200-221. |
[29] | Urrutia J, Besa P, Lobos D, Andia M, Arrieta C, Uribe S. Is a single-level measurement of paraspinal muscle fat infiltration and cross-sectional area representative of the entire lumbar spine? Skeletal Radiol. (2018) ; 47: (7): 939-945. |
[30] | Abbas J, Slon V, May H, Peled N, Hershkovitz I, Hamoud K. Paraspinal muscles density: A marker for degenerative lumbar spinal stenosis? BMC Musculoskelet Disord. (2016) ; 17: (1): 422. |
[31] | Liu Y, Liu Y, Hai Y, Li G, Liu T, Wang Y. Lumbar lordosis reduction and disc bulge may correlate with multifidus muscle fatty infiltration in patients with single-segment degenerative lumbar spinal stenosis. Clin Neurol Neurosurg. (2020) ; 189: : 105629. |
[32] | Shahidi B, Parra CL, Berry DB, et al. Contribution of lumbar spine pathology and age to paraspinal muscle size and fatty infiltration. Spine (Phila Pa 1976). 2017: ; 42: (8): 616-623. |
[33] | Hiyama A, Katoh H, Sakai D, Tanaka M, Sato M, Watanabe M. The correlation analysis between sagittal alignment and cross-sectional area of paraspinal muscle in patients with lumbar spinal stenosis and degenerative spondylolisthesis. BMC Musculoskelet Disord. (2019) ; 20: (1): 352. |
[34] | Ohyama S, Hoshino M, Terai H, et al. Sarcopenia is related to spinal sagittal imbalance in patients with spinopelvic mismatch. Eur Spine J. (2019) ; 28: (9): 1929-1936. |
[35] | Hiyama A, Katoh H, Sakai D, et al. Correlation analysis of sagittal alignment and skeletal muscle mass in patients with spinal degenerative disease. Sci Rep. (2018) ; 8: (1): 15492. |
[36] | Kaji H. Effects of myokines on bone. Bonekey Rep. (2016) ; 5: : 826. |
[37] | Bakker AD, Jaspers RT. IL-6 and IGF-1 Signaling Within and Between Muscle and Bone: How Important is the mTOR Pathway for Bone Metabolism? Curr Osteoporos Rep. (2015) ; 13: (3): 131-139. |
[38] | Cariati I, Bonanni R, Onorato F, et al. Role of physical activity in bone-muscle cross talk: Biological aspects and clinical implications. J Funct Morphol Kinesiol. (2021) ; 6: (2): 55. |
[39] | Rosenberg IH. Sarcopenia: Origins and clinical relevance. Clin Geriatr Med. (2011) ; 27: (3): 337-339. |
[40] | Hirschfeld HP, Kinsella R, Duque G. Osteosarcopenia: Where bone, muscle, and fat collide. Osteoporos Int. (2017) ; 28: (10): 2781-2790. |
[41] | Pourhassan M, Buehring B, Stervbo U, et al. Osteosarcopenia, an Asymmetrical Overlap of Two Connected Syndromes: Data from the OsteoSys Study. Nutrients. (2021) ; 13: (11): 3786. |
[42] | Laskou F, Fuggle NR, Patel HP, Jameson K, Cooper C, Dennison E. Associations of osteoporosis and sarcopenia with frailty and multimorbidity among participants of the Hertfordshire Cohort Study. J Cachexia Sarcopenia Muscle. (2021) . doi: 10.1002/jcsm.12870. |
[43] | Li N, Li XM, Xu L, Sun WJ, Cheng XG, Tian W. Comparison of QCT and DXA: Osteoporosis detection rates in postmenopausal women. Int JEndocrinol. (2013) ; 2013: : 895474. |
[44] | Mi J, Li K, Zhao X, Zhao CQ, Li H, Zhao J. Vertebral Body Compressive Strength Evaluated by Dual-Energy X-Ray Absorptiometry and Hounsfield Units In Vitro. J Clin Densitom. (2018) ; 21: (1): 148-153. |
[45] | de Sire A, Invernizzi M, Lippi L, et al. Nutritional supplementation in hip fracture sarcopenic patients: A narrative review. Clin Cases Miner Bone Metab. (2019) ; 16: (1): 27-30. |
[46] | de Sire A, Invernizzi M, Baricich A, et al. Optimization of transdisciplinary management of elderly with femur proximal extremity fracture: A patient-tailored plan from orthopaedics to rehabilitation. World J Orthop. (2021) ; 12: (7): 456-466. |


