
Core muscle strength can be reliably measured using a novel isokinetic device: An intra-observer study
Abstract
BACKGROUND:
Core strength is an important aspect of physical fitness. A dynamometer was developed to measure isokinetic core muscle strength in multiple planes of motion. Establishing the reliability is needed before it can be used in practice.
OBJECTIVE:
Examine the intra-observer reliability of a trunk isokinetic dynamometer.
METHODS:
31 participants were recruited. Tests were performed twice with an interval of 5–9 days by the same observer. Testing included rotation, flexion/extension and lateral flexion at speeds of 90
RESULTS:
Peak torque reliability was good to excellent (ICC
CONCLUSIONS:
The intra-observer reliability of the isokinetic measurement of core strength peak torque was good. The secondary outcomes peak torque angle and time to peak torque were less reliable and the compensatory torques showed moderate to good reliability. This isokinetic dynamometer could have useful applications in the field of sports medicine and rehabilitation.
Table 1
Inclusion and exclusion criteria
Inclusion criteria
|
1.Introduction
Core strength is important for athletes in many different sports [1, 2, 3, 4]. The core consists of the back muscles, abdominal muscles and muscles around the pelvis [2]. The aim of the core is to stabilize the pelvis and spine during rest and movement [3, 5]. Research has shown that improving core strength can lead to better performance and less injuries [3, 4]. Weak core strength, on the other hand, might be associated with a number of different injuries, such as problems with the groin or back [5, 6, 7, 8]. It is important to have a reliable measurement method available. One of the most commonly used methods for quantifying strength is using a dynamometer [9, 10]. There are a number of different dynamometers on the market that measure core strength. Most dynamometers and research focus on measuring trunk flexion and trunk extension [11, 12, 13, 14].
A new dynamometer was designed that measures isometric, isokinetic and isotonic muscle contractions [15]. These measurements are done in three anatomical planes of motion: the frontal plane, sagittal plane and transverse (horizontal) plane. This makes it possible to measure core strength in three different movement directions: rotation, flexion/extension and lateral flexion [15]. This device is unique in including the option for assessing trunk rotation and lateral flexion, which could give extra essential information about core strength.
A prior study used this dynamometer to evaluate the reliability of measuring isometric muscle contractions, which proved to be reliable [16]. No research has been done about the reliability of the isokinetic capacities of this device. To date, no studies about the reliability of isokinetic devices that measure in multiple planes have been performed. The results could be useful in monitoring recovery during rehabilitation or even to prevent injuries.
The aim of this study was to determine the intra-observer reliability of assessing core muscle strength using an isokinetic dynamometer in healthy participants. The secondary aim was to calculate the standard error of the measurement (SE) and coefficient of variation (CoV) of the main outcome.
2.Materials and methods
2.1Study design
This is a single observer test-retest reliability study.
2.2Recruitment
All participants were recruited from the personnel in the hospital where the tests were carried out (AZ Sint-Jan hospital, Bruges). All participants were included in agreement with earlier established inclusion and exclusion criteria, see Table 1. In accordance with previous test-retest reliability studies about other muscle strength tests the aim was to include at least 30 participants [17, 18].
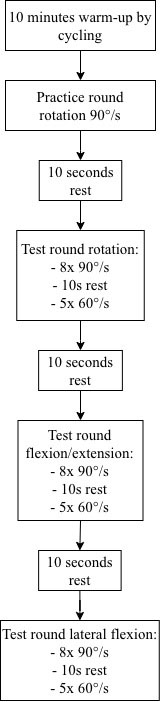
Figure 1.
Flowchart of the used test protocol.
The study was approved by the ethical committee of the AZ Sint-Jan Hospital in Bruges on September 9
The isokinetic dynamometer used for this study was the BioniX Sim3 Pro. All tests were administered by the same individual. The observer received a short introduction about the device before testing the participants in the study. Five people were tested by the observer before including participants in the study. A spokesperson of the company that made the device was present during the first test day to provide help if needed.
2.3Test procedure
The participants were asked to come for testing twice. Before the testing the participants also completed a questionnaire. This consisted of questions regarding demographic information and sports history.
Test days were 1 week (5–9 days) apart. For every participant the test moments were planned to be at the same time of the day. The results of the two test moments of a participant were compared to determine the intra-observer reliability.
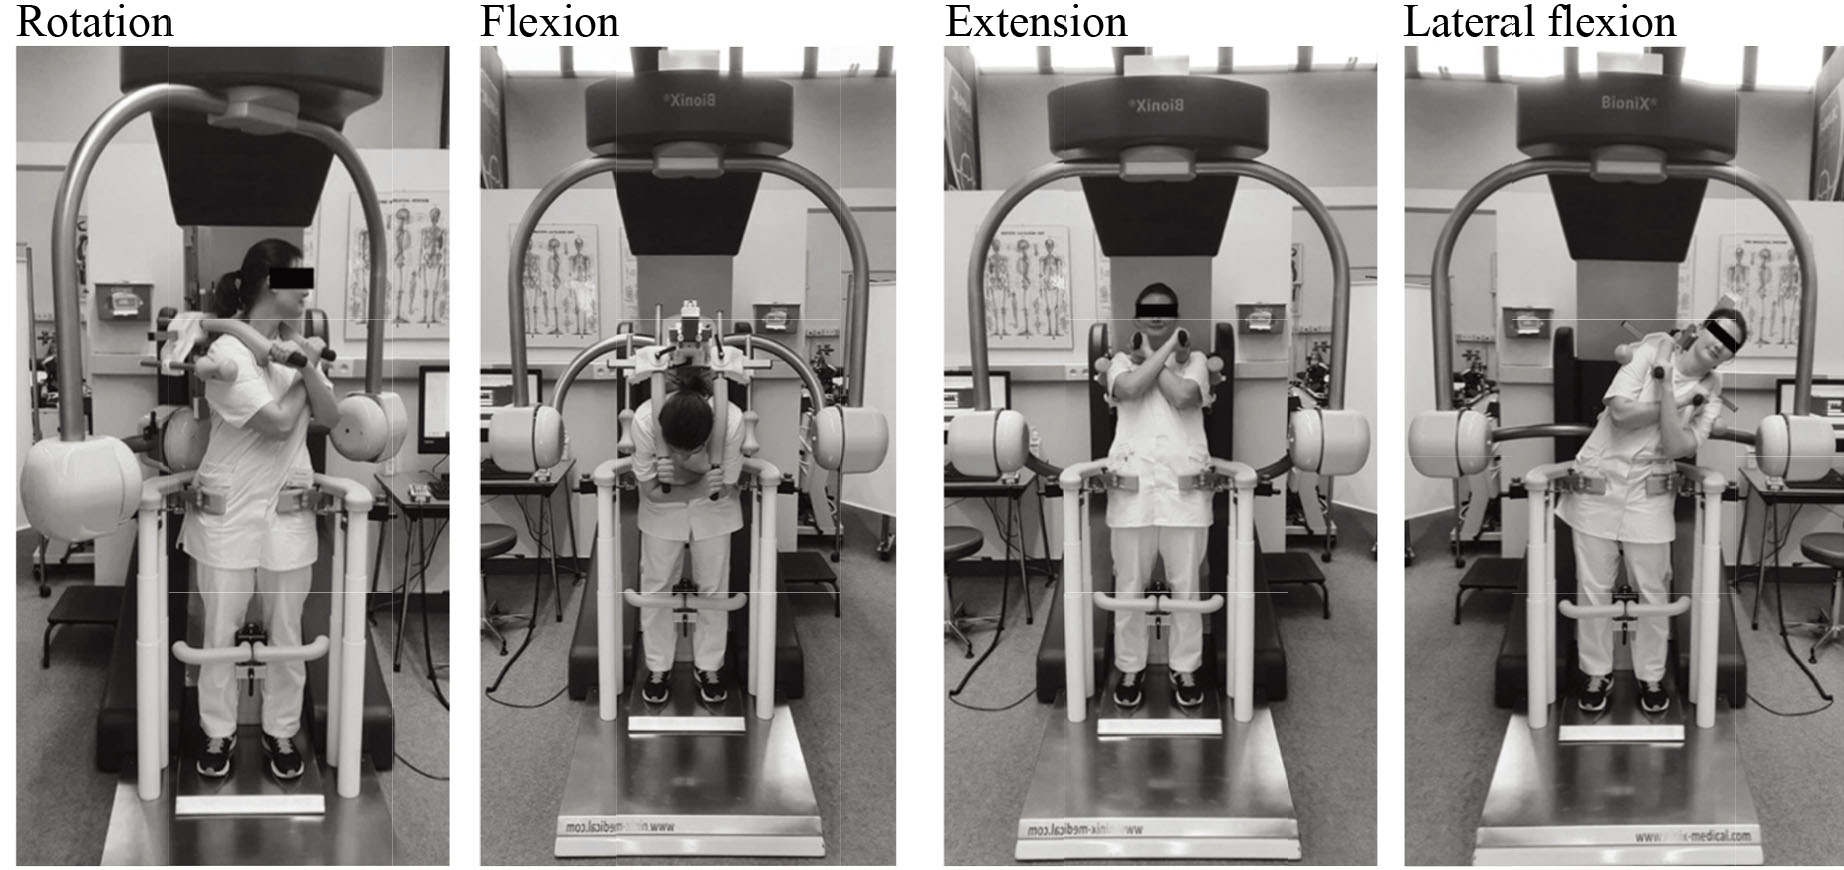
A protocol for testing was made a priori to ensure all procedures were the same for the participants (see Fig. 1). The participants performed a 10-min warmup by stationary bike before testing. No specific stretches were performed beforehand. Next, participants were aligned properly in the device according to the guideline of the manufacturer [19]. The anterior superior iliac spine was used as the anatomical reference point to align the axis. The range of motion for every participant was established before testing to ensure a safe movement pattern. After unlocking one movement plane/axis of the device at a time, the participant was asked to carry out the desired movement. The maximum achieved range of motion for this participant was saved and used for both test occasions. The maximum achievable range of motion of the machine according to the manufacturer’s guidelines was 75 degrees rotation on each side, 70 degrees flexion, 30 degrees extension and 45 degrees lateral flexion on each side. See Fig. 2 for visualisation of the test procedure. All tests were done with the participant standing.
Figure 2.
Test procedure.
The isokinetic testing of flexion/extension, rotation and lateral flexion were performed at two different speeds: first 8 repetitions at 90
The machine software deletes values that differ too much from the other values to make sure the results reflect actual muscle strength and are not influenced by outliers. The highest remaining value was used to compare the results of the different test days.
2.4Outcome measures
The main outcome measure was the reliability of peak torque. The reliability of the time to peak torque, angle of peak torque and compensatory torques were secondary outcomes. The standard error of the measurement (SE) and coefficient of variation (CoV) were calculated for the main outcome of peak torque.
Peak torque was described as the highest achieved torque throughout all repetitions. Time to peak torque was the time from the starting point to the peak torque. Angle of peak torque was the angle of the primary axis at the moment the peak torque was achieved. Compensatory torques are the torques measured on the secondary axes during movement in the primary axis.
For better clinical relevance the peak torque was converted to the peak torque/bodyweight ratio. Further analyses were done with this ratio. The standard error and coefficient of variant were calculated using the collected data to assess the absolute reliability of the device. The SE was calculated as the SD of difference between sessions/
Table 2
Characteristics of the study population
| Mean | |
| Age, years | 30.4 |
| Height, m | 1.75 |
| Weight, kg | 71.5 |
| BMI | 23.4 |
| Hours of sports/week | 4.0 |
| Sports | Percentage |
| Running | 27% |
| Swimming | 13% |
| Fitness | 13% |
| Soccer | 13% |
| Cycling | 10% |
| Badminton | 7% |
| Dancing | 7% |
| CrossFit | 7% |
| Other | 3% |
† SD
2.5Statistical analyses
IBM SPSS Statistics version 26 was used to analyse the data. Statistical significance was set at
The 95% confidence interval of the ICC estimate was used to evaluate the level of reliability. Cut-off values were set as follows: less than 0.50 was considered as poor reliability, between 0.50–0.75 was considered as moderate reliability, between 0.75 and 0.90 indicated good reliability and greater than 0.90 indicated excellent reliability [20].
Table 3
Intraclass correlation coefficient peak torque, peak torque angle, and time to peak torque
| PT | PTA | TTPT | |||
|---|---|---|---|---|---|
| 90 | Rotation | Left | 0.85 (0.71–0.93) | 0.55 (0.24–0.76) | 0.61 (0.32–0.79) |
| Right | 0.80 (0.62–0.90) | 0.32 (–0.05–0.60) | 0.29 (–0.08–0.6) | ||
| Flexion/extension | Flexion | 0.91 (0.81–0.96) | 0.31 (–0.06–0.60) | 0.38 (0.02–0.65) | |
| Extension | 0.91 (0.81–0.96) | 0.47 (0.014–0.70) | 0.55 (0.24–0.76) | ||
| Lateral flexion | Left | 0.87 (0.75–0.94) | 0.62 (0.35–0.80) | 0.71 (0.47–0.85) | |
| Right | 0.86 (0.73–0.93) | 0.37 (0.01–0.64) | 0.43 (0.01–0.69) | ||
| 60 | Rotation | Left | 0.87 (0.74–0.93) | –0.03 (–0.40–0.36) | 0.08 (–0.29–0.42) |
| Right | 0.90 (0.80–0.95) | 0.45 (0.12–0.70) | 0.23 (–0.14–0.54) | ||
| Flexion/extension | Flexion | 0.89 (0.79–0.95) | 0.31 (–0.06–0.60) | –0.01 (–0.33–0.33) | |
| Extension | 0.94 (0.89–0.97) | 0.42 (0.09–0.67) | 0.48 (0.16–0.71) | ||
| Lateral flexion | Left | 0.90 (0.90–0.95) | 0.54 (0.24–0.75) | 0.59 (0.30–0.78) | |
| Right | 0.92 (0.83–0.96) | 0.54 (0.24–0.75) | 0.59 (0.28–0.77) |
¶
3.Results
3.1Participants’ characteristics
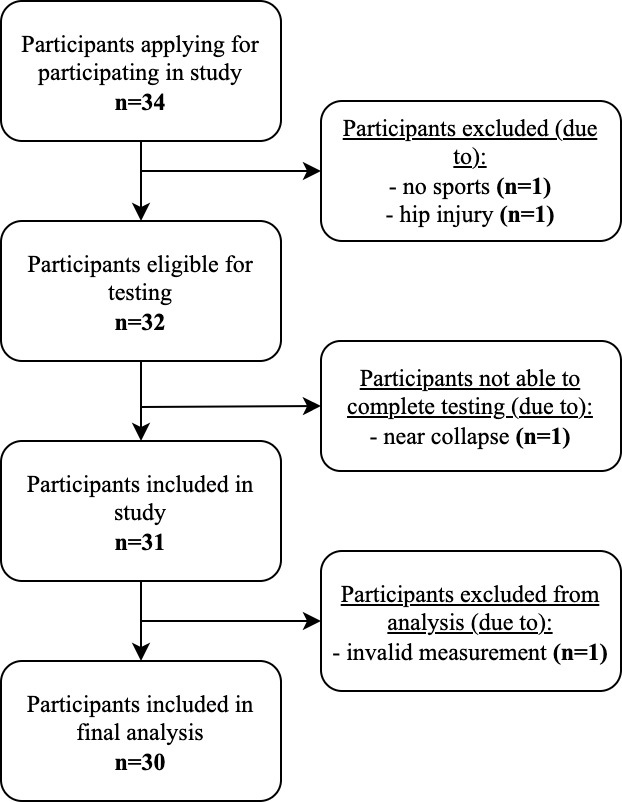
A total of 34 possible participants were recruited for this study. One possible participant was excluded from the study as they did not do any sports. Another person was excluded due to a current hip injury at the time of testing. During the tests one person started to feel lightheaded so the test was paused. Within a couple minutes the person felt fine again. They did not want to continue testing, so the outcomes were excluded from the results.
Two participants experienced dizziness but were able to complete all testing and were not excluded from the study population. After these exclusions, the study population comprised 31 participants (16 women and 15 men). See Table 2 for the characteristics of the study population and Fig. 3 for the flowchart of selecting the study population. While analysing the data, one participant had a difference of 65–217% in the outcomes between session one and two. It was clearly seen during testing that the person put more effort in testing on the second day. The results were therefore seen as an outlier and excluded from further analyses. The final population consisted of 30 participants.
Figure 3.
Flowchart of the study population.
3.2Intra-observer reliability
The intra-observer reliability of all the measured peak torques (PT) was above 0.75, which indicates good reliability. The peak torque angle (PTA) and time to peak torque (TTPT) had poor-moderate reliability. See Table 3 for details of the ICC’s with a 95% confidence interval. Table 4 shows the intra- observer reliability of the compensatory torques. Almost all measures were considered moderate-good, except for the rotation compensation when in flexion.
Table 4
Intraclass correlation coefficient compensatory torques
| Main movement | Compensation | ICC2.1 (CI†) | |
|---|---|---|---|
| 90 | Rotation left | Flexion, extension | 0.73 (0.48–0.87) |
| Lateral flexion | 0.53 (0.21–0.75) | ||
| Rotation right | Flexion, extension | 0.77 (0.36–0.90) | |
| Lateral flexion | 0.75 (0.53–0.87) | ||
| Flexion | Rotation | 0.51 (0.18–0.73) | |
| Lateral flexion | 0.84 (0.69–0.92) | ||
| Extension | Rotation | 0.68 (0.43–0.84) | |
| Lateral flexion | 0.88 (0.76–0.94) | ||
| Lateral flexion left | Flexion, extension | 0.72 (0.44–0.86) | |
| Rotation | 0.68 (0.42–0.83) | ||
| Lateral flexion right | Flexion, extension | 0.65 (0.38–0.81) | |
| Rotation | 0.63 (0.35–0.80) | ||
| 60 | Rotation left | Flexion, extension | 0.70 (0.45–0.85) |
| Lateral flexion | 0.69 (0.44–0.84) | ||
| Rotation right | Flexion, extension | 0.76 (0.27–0.91) | |
| Lateral flexion | 0.96 (0.91–0.98) | ||
| Flexion | Rotation | 0.17 (–0.21–0.50) | |
| Lateral flexion | 0.72 (0.49–0.86) | ||
| Extension | Rotation | 0.73 (0.51–0.86) | |
| Lateral flexion | 0.66 (0.40–0.82) | ||
| Lateral flexion left | Flexion, extension | 0.78 (0.55–0.89) | |
| Rotation | 0.71 (0.78–0.85) | ||
| Lateral flexion right | Flexion, extension | 0.72 (0.49–0.85) | |
| Rotation | 0.64 (0.37–0.81) |
†CI
Table 5
Standard error and coefficient of variation for peak torque
| Mean test† | Mean retest† | Mean diff§ | SD mean diff§§ | SE†† | CoV¶¶ | ||
|---|---|---|---|---|---|---|---|
| Rotation 90 | Left | 0.73 | 0.73 | 0.00 | 0.17 | 0.12 | 16 |
| Right | 0.73 | 0.77 | 0.04 | 0.18 | 0.13 | 17 | |
| Rotation 60 | Left | 0.80 | 0.82 | 0.02 | 0.15 | 0.10 | 13 |
| Right | 0.83 | 0.87 | 0.04 | 0.13 | 0.09 | 11 | |
| Flexion/extension 90 | Flexion | 1.09 | 1.18 | 0.09 | 0.25 | 0.17 | 15 |
| Extension | 1.08 | 1.22 | 0.14 | 0.31 | 0.22 | 19 | |
| Flexion/extension 60 | Flexion | 1.48 | 1.47 | 0.01 | 0.24 | 0.17 | 12 |
| Extension | 1.65 | 1.67 | 0.02 | 0.27 | 0.19 | 11 | |
| Lateral flexion 90 | Left | 0.58 | 0.62 | 0.04 | 0.19 | 0.14 | 23 |
| Right | 0.61 | 0.64 | 0.03 | 0.21 | 0.15 | 24 | |
| Lateral flexion 60 | Left | 0.87 | 0.88 | 0.01 | 0.17 | 0.12 | 14 |
| Right | 0.90 | 0.94 | 0.04 | 0.15 | 0.10 | 11 |
†Mean of PT/body weight ratio in Newton meter per kilogram; §Mean difference between test and retest; §§standard deviation of the difference between test and retest; ††SE
3.3Descriptive statistics
After establishing good reliability of the peak torque when looking at ICC’s, the standard error (SE) and coefficient of variation (CoV) were also calculated for this outcome (see Table 5).
As males and females differ in strength levels on average, gender-specific means and SD ranges of the peak torque/bodyweight ratio were calculated additionally (see Tables 6 and 7).
Table 6
Mean, standard deviation ranges and coefficient of variation peak torque/bodyweight ratio of males
| -2SD† | -1SD† | Mean¶¶ | +1SD† | +2SD† | ||
|---|---|---|---|---|---|---|
| Rotation 90 | Left | 0.32 | 0.57 | 0.83 | 1.08 | 1.33 |
| Right | 0.37 | 0.61 | 0.85 | 1.09 | 1.33 | |
| Rotation 60 | Left | 0.43 | 0.66 | 0.89 | 1.12 | 1.34 |
| Right | 0.43 | 0.69 | 0.94 | 1.19 | 1.45 | |
| Flexion/extension 90 | Flexion | 0.37 | 0.89 | 1.42 | 1.95 | 2.47 |
| Extension | 0.00 | 0.72 | 1.51 | 2.30 | 3.09 | |
| Flexion/extension 60 | Flexion | 0.99 | 1.36 | 1.72 | 2.09 | 2.45 |
| Extension | 0.63 | 1.34 | 2.04 | 2.74 | 3.45 | |
| Lateral flexion 90 | Left | 0.00 | 0.35 | 0.75 | 1.16 | 1.56 |
| Right | 0.00 | 0.35 | 0.78 | 1.21 | 1.64 | |
| Lateral flexion 60 | Left | 0.35 | 0.71 | 1.06 | 1.42 | 1.77 |
| Right | 0.44 | 0.77 | 1.10 | 1.44 | 1.77 |
†SD
Table 7
Mean, standard deviation ranges and coefficient of variation peak torque/bodyweight ratio of females
| -2SD† | -1SD† | Mean¶¶ | +1SD† | +2SD† | ||
|---|---|---|---|---|---|---|
| Rotation 90 | Left | 0.11 | 0.38 | 0.64 | 0.91 | 1.17 |
| Right | 0.19 | 0.43 | 0.66 | 0.89 | 1.12 | |
| Rotation 60 | Left | 0.29 | 0.52 | 0.75 | 0.98 | 1.20 |
| Right | 0.35 | 0.56 | 0.77 | 0.97 | 1.18 | |
| Flexion/extension 90 | Flexion | 0.24 | 0.57 | 0.89 | 1.22 | 1.54 |
| Extension | 0.00 | 0.38 | 0.83 | 1.29 | 1.75 | |
| Flexion/extension 60 | Flexion | 0.64 | 0.95 | 1.26 | 1.57 | 1.87 |
| Extension | 0.45 | 0.89 | 1.33 | 1.78 | 2.22 | |
| Lateral flexion 90 | Left | 0.00 | 0.23 | 0.46 | 0.70 | 0.93 |
| Right | 0.04 | 0.26 | 0.49 | 0.71 | 0.94 | |
| Lateral flexion 60 | Left | 0.35 | 0.53 | 0.71 | 0.90 | 1.08 |
| Right | 0.46 | 0.61 | 0.76 | 0.90 | 1.05 |
†SD
4.Discussion
In the current study, we investigated the intra-observer reliability of a novel dynamometer to measure core muscle strength. Our main finding was a good intra-observer reliability for measuring the isokinetic peak torque of core strength in different directions. In addition, we found a poor-moderate reliability of the peak torque angle and time to peak torque, as well as good-excellent reliability of the compensatory torques.
When considering the SE and CoV, the absolute reliability appears to be less good than the relative reliability that we established with the ICC’s. This gives information about the magnitude of change needed to be measurable with the dynamometer over time. Given that the CoV varies between 11–24% it will be difficult to track small changes in core strength.
In the current study both 90 degrees/second and 60 degrees/second showed good reliability, but the lower speed did seem to have slightly better ICC’s. This is in agreement with earlier research by Delitto et al. [21] (
The secondary outcomes showed substantial variability in the ICC’s and hereby substantial variability in reliability. Almost all outcomes of the peak torque angle and time to peak torque had poor reliability. A couple of outcomes were considered moderate, such as the PTA and TTPT of lateral flexion to the left at 90 degrees/second and the lateral flexion at 60 degrees/second. A study by Madsen et al. [22] (
The compensatory torques in our study appeared to be more reliable than the other secondary outcomes, with ICC’s ranging from good to excellent reliability. No other study has investigated the reliability of compensatory torques, which makes comparison impossible.
Aside from the reliability we also examined the standard error and the coefficient of variation for peak torques. The coefficient of variation shows the amount of change between the two tests. This was in general higher for the faster speeds. The magnitude of changes needed to detect a real change over time is important to consider when planning repeated tests with individuals. As the difference needed to detect this real change is larger than 10% in all cases, the machine cannot detect small changes. This could be attributed to multiple factors. The high variability could be dictated to the relatively small study population of 16 women and 15 men. It is to be expected that a certain degree of variability would appear with such a small population. An earlier paper by Grabiner et al. [24] also found higher variability with higher test speeds. The CoV’s in this study are higher at the movements at 90
A potential problem of the isokinetic testing with this dynamometer is the near-collapse risk. Three study participants experienced some kind of dizziness. Of those, two participants needed to pause the tests and one was not able to complete them. Although the dynamometer is designed to get people out of the device before collapse occurs, it is still a risk. This dizziness might be caused by the short burst of maximal effort followed by standing completely still, which may lead to exercise related syncope [25]. Good instructions before and during testing are essential to ensure safe testing.
Some limitations of this study should be addressed. The study population was quite small, which is reflected in the wide confidence intervals of the ICC’s. A larger population would have resulted in a more precise estimate of the exact reliability.
In addition, we were not able to test the inter-observer reliability. This information would be useful in daily practice. Our hypothesis is that a difference in observer will not make a big difference since the device is easy to use. However, the inter-observer reliability might be affected if observers differ substantially in their motivational behaviour towards the subjects.
Another limitation was the short rest period between the different testing aspects. This could have led to more fatigue with the volunteers, which could have influenced the outcomes. It could also have been an important factor in the collapse and dizziness experienced by some of the volunteers.
Important strengths of this dynamometer are the ease of use and the short training period for the observer. Without any previous experience, the observer of this study was able to work completely independent after only two training days. For clinical purposes this is important.
Our study showed that this dynamometer can measure isokinetic core strength with good reliability. This opens up multiple options for further projects. Future research should aim to establish normal values for core muscle strength in larger populations. In addition, future research should explore reduced core strength as a risk factor for injuries. Exploring whether core strength is associated with sports performance would be interesting as well. The potential of this dynamometer can be explored now the reliability is established. It could be used as a screening tool in sports teams to identify core muscle weaknesses. In addition to this, using the dynamometer for guiding rehabilitation after sports injuries would be possible. However, this should not be repeated at short intervals due to the variance of the measures.
5.Conclsuion
The novel dynamometer can reliably measure the isokinetic peak torque of core muscle strength when looking at the relative reliability.
Author contributions
Conception: Marit L. Mulder, Elke Van den Steen, Jan De Neve, Adam Weir. Performance of work: Marit L. Mulder, Adam Weir. Interpretation or analysis of data: Marit L. Mulder, Adam Weir. Preparation of the manuscript: Marit L. Mulder, Adam Weir. Revision for important intellectual content: Marit L. Mulder, Elke Van den Steen, Jan De Neve, Adam Weir. Supervision: Adam Weir.
Funding
The authors report no funding.
Acknowledgments
The authors have no acknowledgments.
Conflict of interest
The authors have no conflicts of interest to report.
References
[1] | Barbado D, Lopez-Valenciano A, Juan-Recio C, Montero-Carretero C, van Dieën JH, Vera-Garcia FJ. Trunk Stability, Trunk Strength and Sport Performance Level in Judo. PLOS ONE. (2016) ; 11: (5): e0156267. doi: 10.1371/journal.pone.0156267. |
[2] | Clayton MA, Trudo CE, Laubach LL, Linderman JK, De Marco GM, Barr S. Relationships between isokinetic core strength and field based athletic performance tests in male collegiate baseball players. J Exerc Physiol Online. (2011) ; 14: (5): 20-30. |
[3] | Sharma A, Geovinson SG, Singh Sandhu J. Effects of a nine-week core strengthening exercise program on vertical jump performances and static balance in volleyball players with trunk instability. J Sports Med Phys Fitness. (2012) ; 52: (6): 606-15. |
[4] | Evans K, Refshauge KM, Adams R, Aliprandi L. Predictors of low back pain in young elite golfers: A preliminary study. Phys Ther Sport (2005) ; 6: (3): 122-30. |
[5] | Willson JD, Dougherty CP, Ireland MLL, Davis IM. Core Stability and Its Relationship to Lower Extremity Function and Injury. J Am Acad Orthop Surg. (2005) ; 13: : 316-25. doi: 10.5435/00124635-200509000-00005. |
[6] | Lee JH, Hoshino Y, Nakamura K, Kariya Y, Saita K, Ito K. Trunk muscle weakness as a risk factor for low back pain: A 5-year prospective study. Spine. (1999) ; 24: (1): 54-7. doi: 10.1097/00007632-199901010-00013. |
[7] | De Blaiser C, Roosen P, Willems T, Danneels L, Bossche LV, De Ridder R. Is core stability a risk factor for lower extremity injuries in an athletic population? A systematic review. Phys Ther Sport (2018) ; 30: : 48-56. doi: 10.1016/j.ptsp.2017.08.076. |
[8] | De Blaiser C, De Ridder R, Willems T, Vanden Bossche L, Danneels L, Roosen P. Impaired Core Stability as a Risk Factor for the Development of Lower Extremity Overuse Injuries: A Prospective Cohort Study. Am J Sports Med. (2019) ; 47: (7): 1713-21. doi: 10.1177/0363546519837724. |
[9] | Iwai K, Okada T, Nakazato K, Fujimoto H, Yamamoto Y, Nakajima H. Sport-specific characteristics of trunk muscles in collegiate wrestlers and judokas. J Strength Cond Res. (2008) ; 22: (2): 350-8. doi: 10.1519/JSC.0b013e3181635d25. |
[10] | Moussa A, Zouita S, Ben Salah F, Behm D, Chaouachi A. Isokinetic trunk strength, validity, reliability, normative data and relation to physical performance and low back pain: a review of the literature. Int J Sports Phys. (2020) ; 15: (1): 160-74. |
[11] | Guilhem G, Giroux C, Couturier A, Maffiuletti NA. Validity of trunk extensor and flexor torque measurements using isokinetic dynamometry. J Electromyogr Kinesiol. (2014) ; 24: (6): 986-93. doi: 10.1016/j.jelekin.2014.07.006. |
[12] | Garcia-Vaquero MPB, Barbado D, Juan-Recio C, López-Valenciano A, Vera-Garcia FJ. Isokinetic trunk flexion-extension protocol to assess trunk muscle strength and endurance: Reliability, learning effect, and sex differences. J Sport Health Sci. (2017) . doi: 10.1016/j.jshs.2016.08.011. |
[13] | Mueller SS, J. Validity of isokinetic trunk measurements with respect to healthy adults, athletes and low back pain patients. Isokinet Exerc Sci. (2012) : 255-66. |
[14] | Estrázulas JA, de Jesus K, da Silva RA, Libardoni dos Santos JO. Evaluation isometric and isokinetic of trunk flexor and extensor muscles with isokinetic dynamometer: A systematic review. Phys Ther Sport (2020) ; 45: : 93-102. doi: 10.1016/j.ptsp.2020.06.008. |
[15] | NiniX. BioniX |
[16] | De Blaiser C, De Ridder R, Willems T, Danneels L, Roosen P. Reliability and validity of trunk flexor and trunk extensor strength measurements using handheld dynamometry in a healthy athletic population. Phys Ther Sport. (2018) ; 34: : 180-6. doi: 10.1016/j.ptsp.2018.10.005. |
[17] | De Blaiser C, De Ridder R, Willems T, Danneels L, Vanden Bossche L, Palmans T, et al. Evaluating abdominal core muscle fatigue: Assessment of the validity and reliability of the prone bridging test. Scand J Med Sci Sports. (2018) ; 28: (2): 391-9. doi: 10.1111/sms.12919. |
[18] | Fulcher ML, Hanna CM, Raina Elley C. Reliability of handheld dynamometry in assessment of hip strength in adult male football players. J Sci Med Sport. (2010) ; 13: (1): 80-4. doi: 10.1016/j.jsams.2008.11.007. |
[19] | BioniX Sim3 Pro Gebruikershandboek2018. 79 p. |
[20] | Koo TK, Li MY. A Guideline of Selecting and Reporting Intraclass Correlation Coefficients for Reliability Research. J Chiropr Med. (2016) ; 15: (2): 155-63. doi: 10.1016/j.jcm.2016.02.012. |
[21] | Delitto A, Rose SJ, Crandell CE, Strube MJ. Reliability of Isokinetic Measurements of Trunk Muscle Performance. Spine. (1991) ; 16: (7). doi: 10.1097/00007632-199107000-00019. |
[22] | Madsen OR. Trunk Extensor and Flexor Strength Measured by the Cybex 6000 Dynamometer. Spine. (1996) ; 21: (23): 2770-6. doi: 10.1097/00007632-199612010-00012. |
[23] | Maffiuletti NA, Bizzini M, Desbrosses K, Babault N, Munzinger U. Reliability of knee extension and flexion measurements using the Con-Trex isokinetic dynamometer. Clin Physiol Funct Imaging. (2007) ; 27: (6): 346-53. doi: 10.1111/j.1475-097X.2007.00758.x. |
[24] | Grabiner MD, Jeziorowski JJ, Divekar AD. lsokinetic Measurements of Trunk Extension and Flexion Performance Collected with the Biodex Clinical Data Station. J Orthop Sports Phys Ther. (1990) ; 11: (12): 590-8. doi: 10.2519/jospt.1990.11.12.590. |
[25] | Krediet CT, Wilde AA, Wieling W, Halliwill JR. Exercise related syncope, when it’s not the heart. Clin Auton Res. (2004) ; 14: (Suppl 1): 25-36. doi: 10.1007/s10286-004-1005-1. |


