
The association between whole body vibration exposure and spine degeneration on imaging: A systematic review
Abstract
BACKGROUND:
Low frequency vibrations from motorized vehicles and heavy equipment have been associated with musculoskeletal disorders. Spine degeneration on diagnostic imaging provides direct and objective measures of the possible effects of such exposures on the spine.
OBJECTIVE:
The objective of this systematic review was to evaluate the association of exposure to whole-body vibration (WBV) with spine degeneration on imaging.
METHODS:
We conducted electronic searches in MEDLINE, CINAHL, EMBASE, and Web of Science to July 2021. Two reviewers independently screened search results, assessed quality, and extracted data. Studies evaluating the exposure to WBV and lumbar spine degeneration on imaging were included.
RESULTS:
Fifteen studies (16 manuscripts) were included. Seven studies including a meta-demonstrated moderate quality evidence of no association between WBV and disc degeneration. There was also moderate quality evidence of no association between WBV and disc height narrowing and osteophytes. Overall, there was low level evidence of no association between WBV and other degenerations findings.
CONCLUSIONS:
There was moderate to low quality evidence suggesting no association between WBV exposures with spine degeneration on imaging. The results of this study currently do not support assertion that motorized vehicle and WBV exposure accelerates degeneration and causes structural damage to the spine.
1.Introduction
It has been suggested that the transfer of low frequency vibrations to the body from motorized vehicles and heavy equipment is associated with musculoskeletal disorders, primarily painful spinal conditions [1, 2, 3]. There has been a resurgence of interest in the identification of these relationships, given the relevance to worker’s compensation and retirement agencies of those undergoing prolonged exposure to whole body vibration (WBV) [4, 5]. Studies evaluating the association of WBV and low back pain, however, have conflicting evidence [6]. Spine degeneration found on diagnostic imaging, such as disc signal intensity, disc narrowing, disc bulge/herniation, Modic changes, among others, can provide objective measures of the effect of loading and WBV on the spine [7, 8, 9].
A systematic review published in 2012 evaluated the association between WBV and objective spine measures on imaging [2]. The review included seven studies and evaluated the results qualitatively, concluding that there was insufficient evidence to dismiss any association between WBV and spine findings on imaging. Since the publication of this review in 2012 there have been multiple studies conducted on the association of WBV and spine degeneration. Therefore, the aim of this systematic review was to update the results of the previously published systematic review on the association of exposure to motorized vehicles and WBV with spine degeneration observed on imaging. The objective was also to expand on the previous review though the conduct of a meta-analysis when possible.
2.Materials and methods
This review was conducted using the Cochrane guidelines for systematic reviews [10] and reported using the Preferred Reporting Items for Systematic Reviews and Meta-Analyses (PRISMA) guidelines [11]. We used the modified version Grading of Recommendations, Assessment, Development and Evaluation (GRADE) for longitudinal studies to summarize the strength of the evidence [12]. The protocol for the review was not prospectively registered but a protocol was developed a priori and followed throughout.
2.1Eligibility criteria
Cross-sectional, case-control and cohort studies evaluating exposure to WBV through motorized vehicles and heavy equipment were eligible for inclusion. In addition, studies had to evaluate the relationship of WBV with lumbar spine structural findings evaluated on diagnostic imaging. Studies of back pain as an outcome measure were not included. Studies that included patients with pre-existing conditions (e.g., disc herniation) were excluded from this review, as they are more likely to have positive findings on imaging and may provide biased estimates for the relationship under investigation.
2.2Information sources and search strategy
To identify relevant articles, we performed computerised electronic search of the following databases: MEDLINE (1946 to June 2021), CINAHL (1982 to June 2021), and EMBASE (1988 to June 2021). We also performed citation tracking of the included studies using ISI Web of Science search (July 2021). Authors were contacted if more information about the trial was needed to allow inclusion of the study. Keywords included in our search were related to three domains: imaging (i.e., x-ray, radiograph), imaging findings (i.e., disc degeneration, disc height), and whole body vibration from motorized vehicles. Subject subheadings and word truncations specific for each database were used. A sample search strategy is provided in Appendix 1.
2.3Study selection
Eligible studies were uploaded onto the online screening tool Covidence, and any duplicates were removed. Each of the screening process (title and abstract, full text screening) for eligible studies was completed by two independent reviewers (LM and research assistants). A third-party reviewer resolved any discrepancies for the inclusion of trials. The reviewers followed a research protocol developed prior to the beginning of the review, which included a checklist of inclusion criteria.
2.4Data extraction and quality assessment
Two independent reviewers (LM and research assistants) extracted data from the included studies using a standardized data extraction form. Important characteristics of each study were extracted, such as type of loading (e.g., WBV exposure), study design, type of imaging, inclusion criteria, the affiliation of the authors, funding source, and study conclusions. We also extracted the type of outcomes, and mean, standard deviations, and sample size for continuous outcomes, and for dichotomous outcomes, sample size and number of events per group.
Figure 1.
Flowchart of whole-body vibration systematic review inclusion.
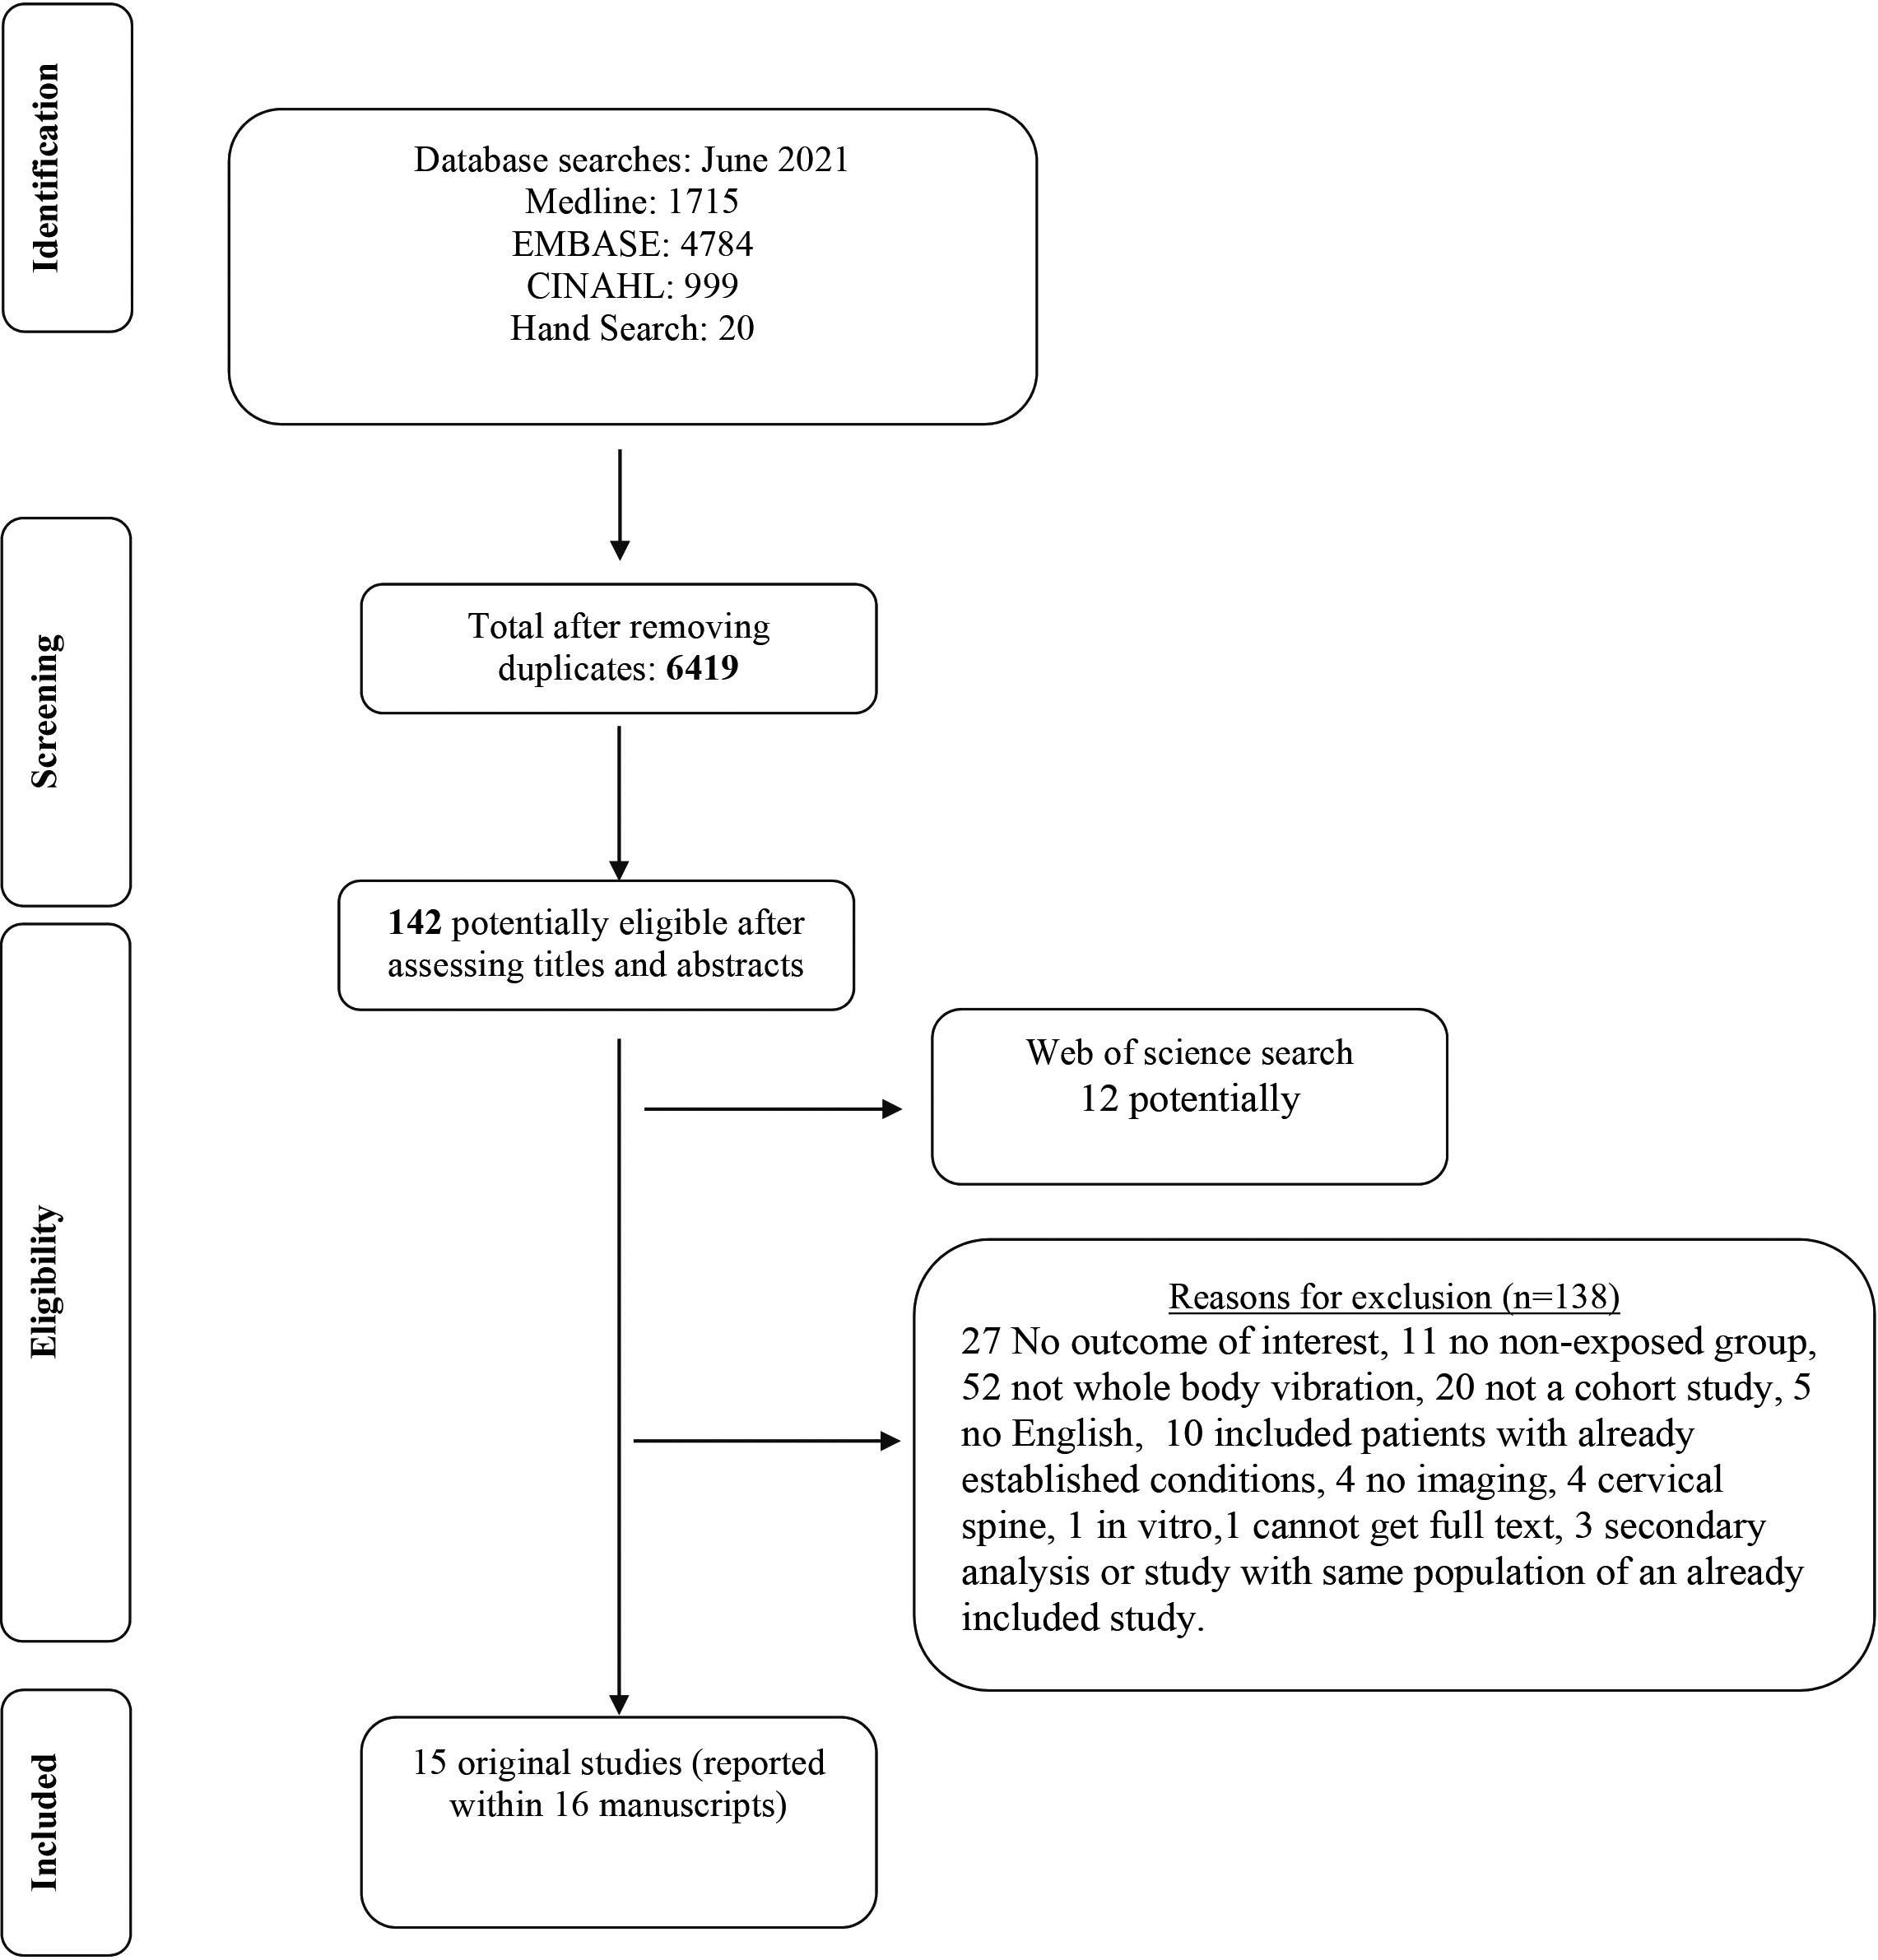
Table 1
Study characteristics
| Study | Methodological quality | Imaging | Study design | Participant information |
|---|---|---|---|---|
| Aydog et al. 2004 | 7 | X-ray | Case control (retrospective) | 732 male flight personnel and 202 male controls who received periodic medical examinations at the Turkish aerospace medical examination center in 1994. Controls were office workers or air traffic controls not involved in mechanical work. |
| Battie et al. 2002 | 7 | MRI | Cross sectional | Monozygotic twin pairs from the Finnish Twin Cohort selected based on driving discordances. ( |
| Brinckmann et al. 1998 | 5 | X-ray | Retrospective cohort study | 355 subjects with long term exposure to heavy physical load (from different professions) and 737 healthy controls compiled from healthy unexposed subjects. |
| Byeon et al. 2013 | 7 | X-ray | Cross sectional | 186 military helicopter pilots exposed to whole body vibration: 94 military clerical workers at a military hospital doing 8 hours/day of computer work (same working environment but no whole body vibration). |
| Frymoyer et al. 1984 | 3 | X-ray | Cross sectional (retrospective) | 321 random patients from a sample of 1221 from a previous study. Only 285 were included in the occupation vs imaging study due to reasons such as imaging quality. |
| Hangai et al. 2008 | 4 | MRI | Cross sectional | Recruited over 50yo to participate in a health promotion program though newspapers in Japan. Those with imaging were recruitment. |
| Hendriksen et al. 1999 | 6 | X-ray | Longitudinal cohort study | Candidate student pilots and pilots. Pilots were to fly at least 150 hours between the two x-rays. All others composed the control group. |
| Ishimoto et al. 2019 Ishimoto et al. 2019 | 7 | X-ray MRI | Cross-sectional | 722 adults from a longitudinal population based cohort study (Research on Osteoarthritis/Osteoporosis Against Disability) that completed an MRI, x-ray and a questionnaire on exposures. |
| Kuisma et al. 2008 | 6 | MRI | Cross sectional | 228 Caucasian males (159 Train engineers and 69 paper mill and chemical factory workers). |
| Kumar et al. 1999 | 6 | MRI | Cross sectional | Selected from a rural area and information were gathered from a house to house survey from two villages. Drivers had to drive for 5 years or more. |
| Luoma et al. 1998 | 7 | MRI | Cross sectional | Patients were extracted from a cohort participating in a study evaluating occupational effects of LBP. ( |
| Savage et al. 1997 | 4 | MRI | Cross sectional (only 60% participated in the longitudinal cohort) | Volunteers from different occupations. |
| Sovelius et al. 2008 | 6 | MRI | Longitudinal cohort study | |
| Videman et al. 2000 | 6 | MRI | Cross sectional | |
| Wu et al. 2019 | 7 | MRI | Cross sectional | 644 participants were included of which 488 (75.8%) had used motorized vehicles routinely. Other occupational factors were not accounted for in this study. |
Two independent raters (LM and research assistants) used the Newcastle Ottawa Quality Assessment scale [13] to assess the methodological quality of case-control and cohort studies and a modified version of the scale for cross-sectional studies [14]. The maximum value of the scale is 9 (high quality) and the minimum value is 0 (lowest quality). Disagreements were resolved by a third rater when consensus between rater could not be reached. Methodological quality was not an inclusion criterion but was taken in consideration when making conclusions. For the purpose of this study a score from 0–4 was deemed low quality, 5–7 moderate quality and 8–9 high quality.
2.5Data synthesis and analysis
We pooled the results when trials were considered sufficiently homogenous with respect to participants’ characteristics, exposure, and outcomes. We assessed statistical heterogeneity by calculating the I
3.Results
3.1Study selection
Our searches yielded 6419 articles after removing duplicates. Of these, 142 articles were selected as potentially eligible based on their titles and abstracts. After full text screening, a total of 14 studies were included in the review. See Appendix 2 for the full list of excluded studies with reasons. An additional ISI Web of Science search uncovered 12 more potentially eligible studies, from which one additional study and one additional secondary analysis manuscripts were included in this review. Therefore, the final number of included studies was 15 reported within 16 manuscripts [17, 18, 19, 20, 21, 22, 23, 24, 25, 26, 27, 28, 29, 30, 31, 32]. The PRISMA flow diagram is presented in Fig. 1.
3.2Methodological quality
The included studies had a median methodological quality score of 6 and interquartile range of 2 with a minimum of 3 and maximum of 7, using the Newcastle Ottawa Assessment scale. The items of the scale that were not present in most studies were 1) control of potentially confounding factors, and 2) reporting of the response rate of each group. A description of each study with quality rating is presented in Table 1.
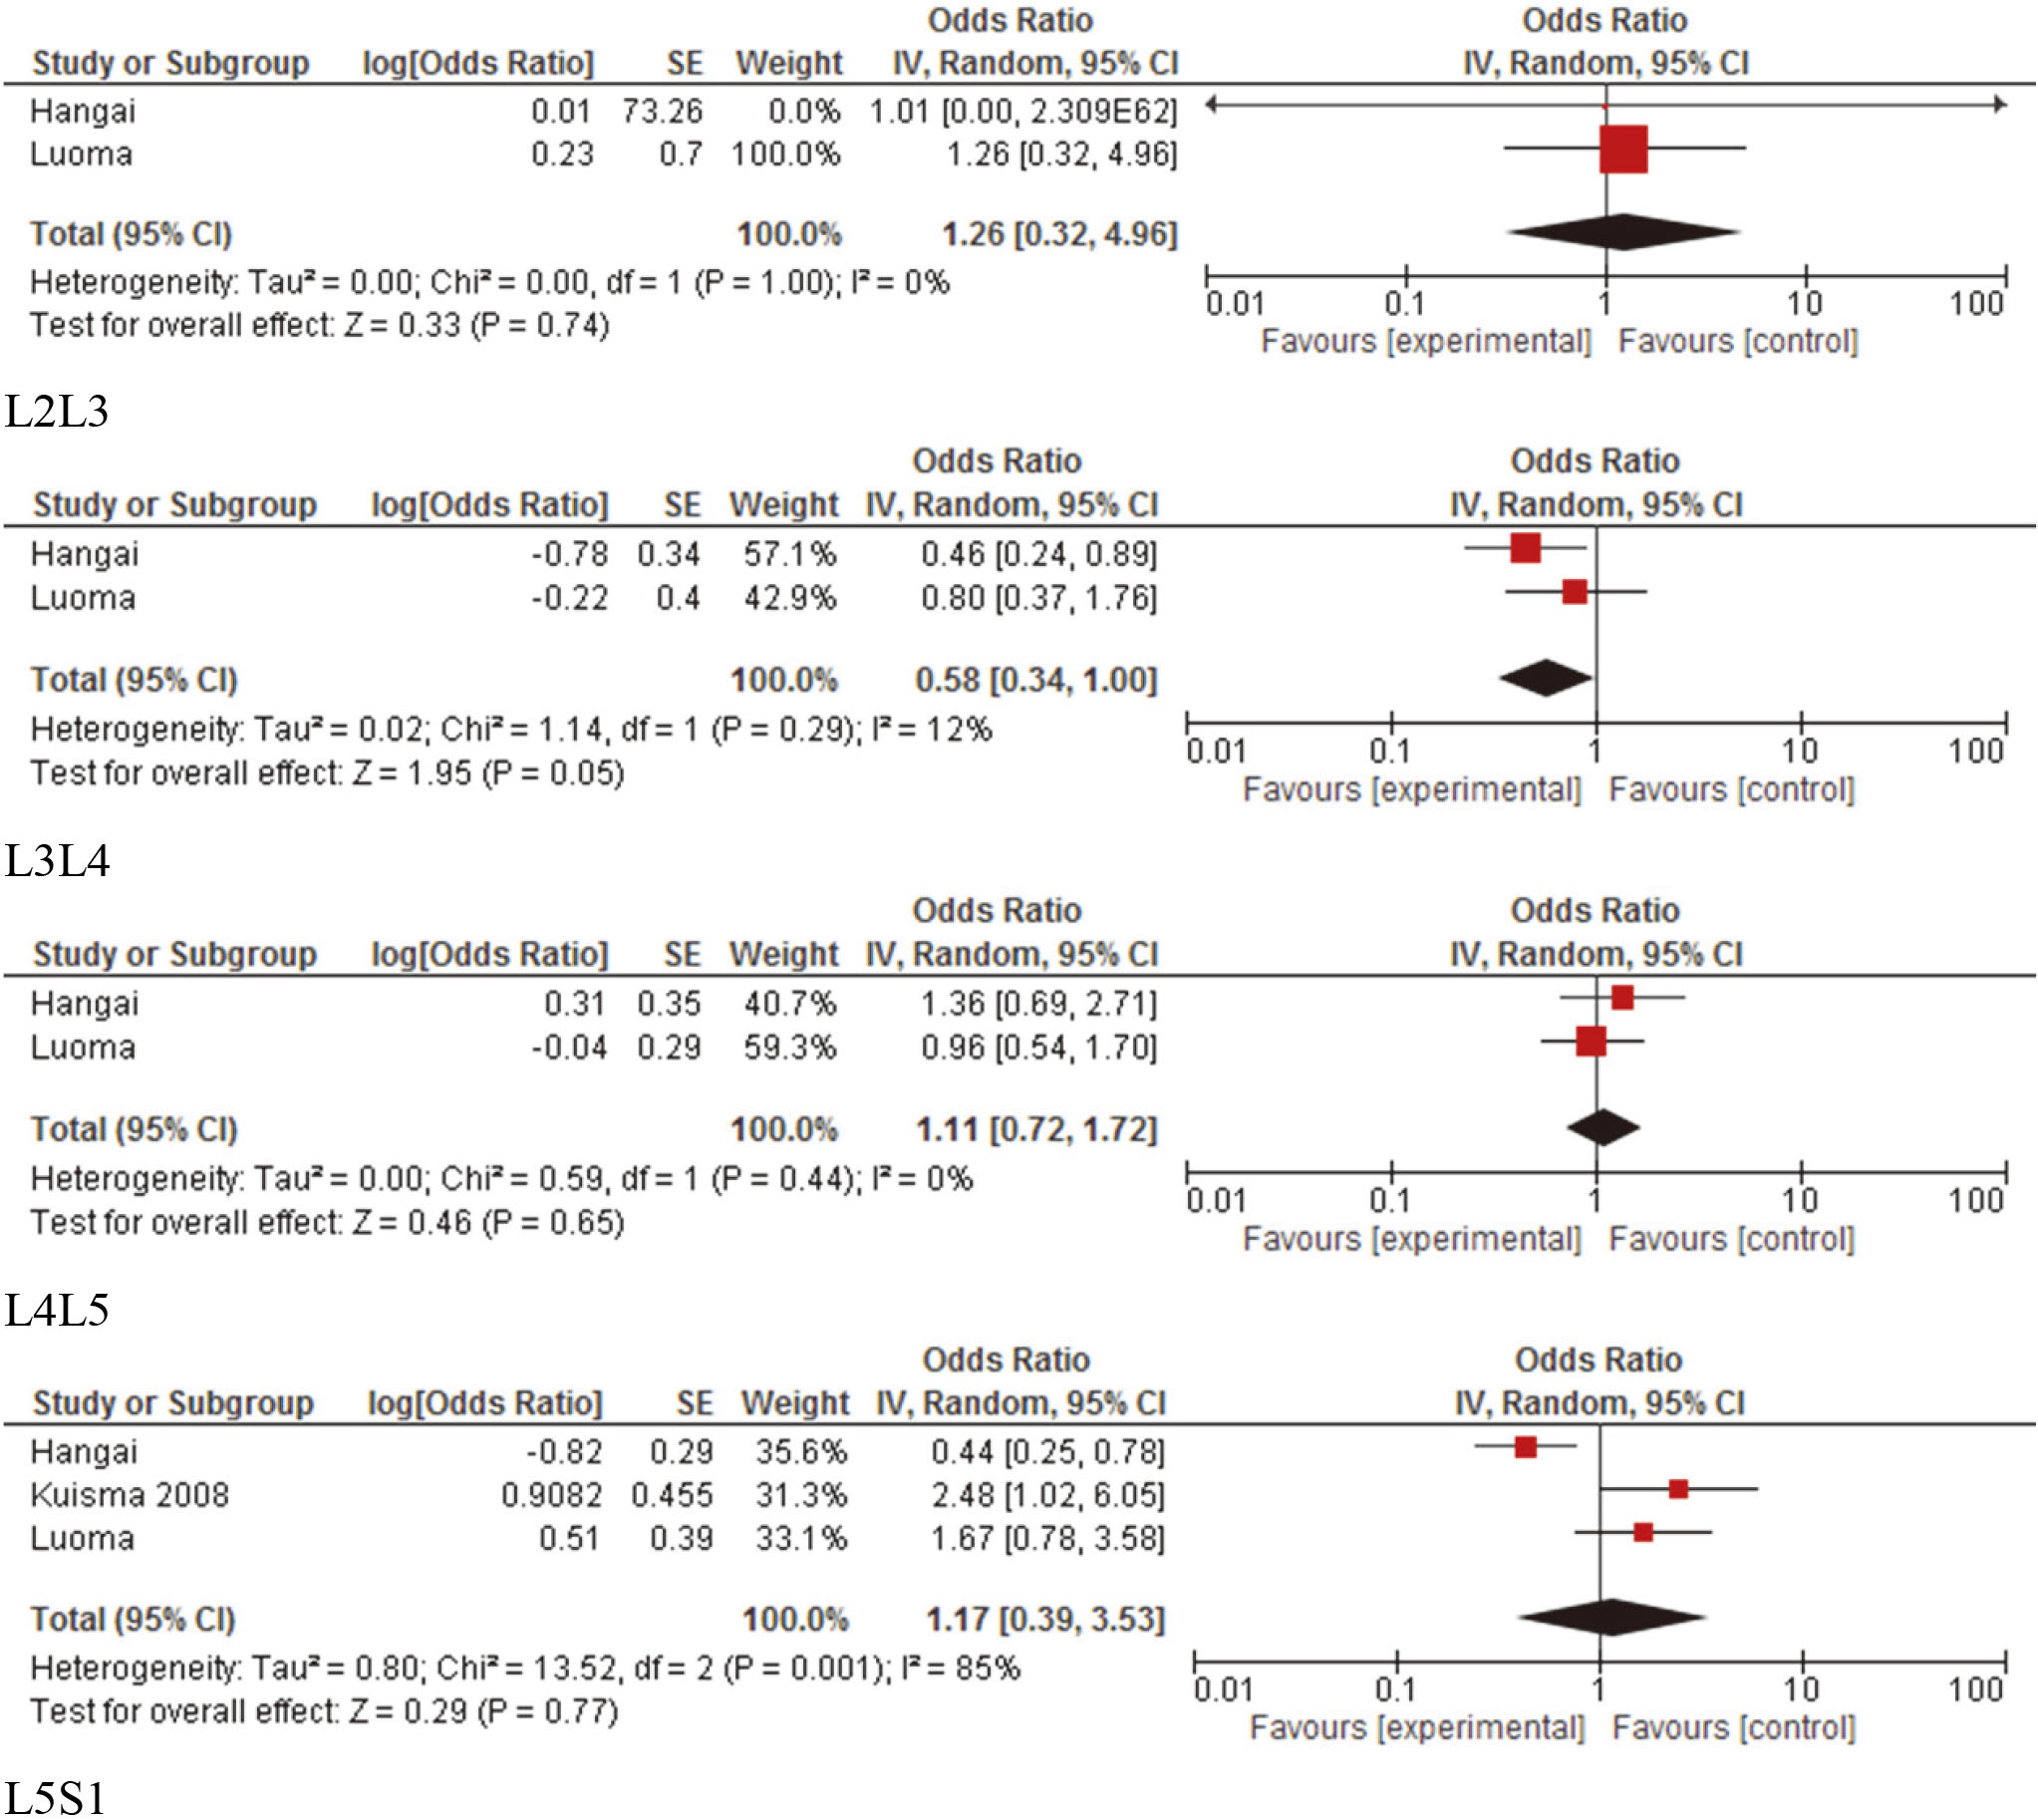
Figure 2.
Forest plots of pooled disc degeneration (signal intensity) measures separated per spine level.
3.3Study characteristics
There were 15 studies evaluating the association between WBV and spine degeneration. Eight studies included driving as the exposure (e.g., cars and ambulances) [17, 18, 19, 20, 21, 22, 23, 24], 1 included tractor drivers [25], 1 included drivers and machine operators [26], 1 included train conductors [27], 1 included helicopter pilots [28] and 3 included other flight pilots [29, 30, 31].
3.4Outcomes
Results of studies for each outcome are presented in Table 2.
Table 2
Results
| Study | Type of loading or exposure | Outcomes | Study results and RevMan analysis |
|---|---|---|---|
| Disc degeneration | |||
| Battie et al. 2002 | Driving | Quantitative assessment of signal intensity | RevMan: There were no associations between WBV and signal intensity. Upper lower back (UL) (Mean difference |
| Hangai et al. 2008 | History of working as a driver | Disc degeneration (signal intensity with modified Pirfmann’s classification) (for each level from L1 to S1) | RevMan: Occupational driving was not significantly associated with disc degeneration L1L2 (OR |
| Kuisma et al. 2008 | Train engineers and factory workers | Disc degeneration (Pirfmann’s classification) (for each level from L1 to S1) | There was no association with WBV and outcomes when considering the whole spine and level V Pfirman degeneration (OR |
| Kumar et al. 1999 | Driving (tractor) | Signal intensity (summary score for all levels together) | There was no association between WBV and any of the outcomes. (no data just p values presented). |
| Luoma et al. 1998 | Drivers, carpenters, and office workers | Disc degeneration (qualitative assessment of signal intensity) (for each level from L2 to S1) | RevMan: There was no association between disc degeneration and whole body vibration. L2L3 (OR |
| Savage et al. 1997 | Ambulance men, hospital porters, car production workers, brewery drayman and office workers | Disc degeneration (qualitative signal intensity assessment) (summary score for all levels together) | RevMan: There was no difference between ambulance drivers and office workers (OR |
| Sovelius et al. 2008 | G forces (pilot) | Disc degeneration (qualitative signal intensity assessment 0–2) (for each level from L2 to S1 and all levels together) | RevMan: There was no association between exposure to G forces and outcomes for all levels together (OR |
| Disc height | |||
| Battie et al. 2002 | Driving | Disc height (summary measures for lower and upper lumbar levels) | RevMan: Drivers had significantly reduced disc height at the lower lumbar levels although this difference was so small that it was negligible. Upper lower back (UL) (Mean difference |
| Brinckmann et al. 1998 | Different occupations such as mine workers, steelworkers, and normative data of nonexposed individuals | Disc height (for each level from T12 to S1) | Whole body vibration was only associated with disc height on a few occasions suggesting the presence of chance findings for levels found to be statistically significant. |
| Frymoyer et al. 1984 | Whole-body vibration vehicular Other forms of vibration | Disc space narrowing (for each level from L3 to S1) | There was no association with whole body vibration and disc space narrowing. |
| Kumar et al. 1999 | Driving (tractor) | Disc height (summary score for all levels together) | There was no association between WBV and disc height (no data just p values presented). |
| Sovelius et al. 2008 | G forces (pilot) | Disc height (qualitative) | There was no association between exposure to G forces and disc height (no data provided). |
| Videman et al. 2000 | Rally driving | Disc height narrowing | There was no association between disc height and driving (no data presented) |
| Overall measure of degeneration | |||
| Byeon et al. 2013 | Whole-body vibration (helicopter) | Overall degeneration score (disc height | RevMan: There was no statistically significant degeneration differences between groups. (OR |
| Hendriksen et al. 1999 | G forces (pilot) | Degenerative changes of the lumbar spine. Not clear which. Results on L34 osteophytic spurring and L5S1 discopathy | There was no association between exposure to G forces and outcomes (no data presented). |
|
Table 2, continued | |||
|---|---|---|---|
| Study | Type of loading or exposure | Outcomes | Study results and RevMan analysis |
| Disc bulge or herniation | |||
| Battie et al. 2002 | Driving | Disc bulge (summary measures for lower and upper lumbar levels) | RevMan: There were no difference between groups in terms of disc bulge. Upper lower back (UL) (Mean difference |
| Kumar et al. 1999 | Driving (tractor) | Disc bulge (Summary score for all levels together) | There was no association between WBV and disc bulge. (no data just p values presented). |
| Luoma et al. 1998 | Drivers, carpenters and office workers | Disc bulge (quantitative) (for each level from L2 to S1) | RevMan: Machine drivers had more anterior and posterior bulge than office workers at L5S1 although this association became non-significant when back accidents were added to the model (OR |
| Sovelius et al. 2008 | G forces (pilot) | Disc bulge (qualitative) (quantitative) (for each level from L2 to S1) | There was no association between exposure to G forces and disc bulge (no data provided). |
| Videman et al. 2000 | Rally driving | Disc herniation | RevMan: There was no association between disc bulge and driving (OR |
| Modic changes | |||
| Kuisma et al. 2008 | Train engineers and factory workers | Modic changes | RevMan: There was no association with WBV and Modic changes type I (OR |
| Wu et al. 2019 | Daily vehicle use | Modic changes | There was an association with daily vehicle use and Modic changes (OR |
| Schmorl’s nodes | |||
| Aydog et al. 2004 | Fighter pilots, helicopter pilots, transports pilots with matched controls | Schmorl’s nodes | RevMan: There were no significant changes in Schmorl’s nodes between those exposed to whole body vibration and controls. (OR |
| Frymoyer et al. 1984 | Whole-body vibration vehicular Other forms of vibration | Schmorl’s nodes | There was no association with whole body vibration and Schmorl’s nodes (no data presented). |
| Endplate lesions | |||
| Battie et al. 2002 | Driving | Endplate irregularities (summary measures for lower and upper lumbar levels) | RevMan: Driving was not associated with endplate lesions Upper endplate_Upper lower back (UL) (Mean difference |
| Videman et al. 2000 | Rally driving | Endplate irregularities | RevMan: There was no association between endplate irregularities and driving (OR |
| Osteophytes | |||
| Aydog et al. 2004 | Fighter pilots, helicopter pilots, transports pilots with matched controls | Spondylolysis (summary measures for all lumbar levels together) | RevMan: There were no significant spinal changes between those exposed to whole body vibration and controls. (OR |
| Battie et al. 2002 | Driving | Osteophytes (summary measures for lower and upper lumbar levels) | Driving was not associated with the presence of osteophytes (no data presented for calculation). |
| Frymoyer et al. 1984 | Whole-body vibration vehicular Other forms of vibration | Osteophytes (for each level from L3 to S1) | There was no association with whole body vibration and the presence of osteophytes. (no data presented). |
| Hendriksen et al. 1999 | G forces (pilot) | Osteophytes | There was no association between exposure to G forces and the presence of osteophytes. (no data presented for calculation). |
| Videman et al. 2000 | Rally driving | Osteophytes (for all levels) | RevMan: There was a significant difference between driving and the presence of osteophytes (OR |
|
Table 2, continued | |||
|---|---|---|---|
| Study | Type of loading or exposure | Outcomes | Study results and RevMan analysis |
| Lumbar Spondylolisthesis | |||
| Ishimoto et al. 2019 | Driving for | Spondylolisthesis (from L1/2 to L5/S1) | There were 117 with spondylolisthesis and 605 controls. Cases were more than twice as likely to report occupational driving |
| Lumbar Spinal Stenosis | |||
| Ishimoto et al. 2018 | Driving for | Qualitative assessment by a spine surgeon of the presence of central canal stenosis (2/3 narrowing) | There were 13 cases of severe LSS and 22 controls. There was no association between driving |
Disc degeneration: There were 7 studies evaluating the association of WBV exposure and disc degeneration, as defined by a decrease in signal intensity. Different methods were used to evaluate signal intensity (the translucent appearance of the disc) across studies (e.g., 0–2 qualitative analysis, Pfirrmann grade) [18, 19, 20, 21, 25, 27, 30]. Of the seven studies, only two of the studies with low to moderate quality identified a significant difference between WBV exposure groups [18, 27]. Hangai et al. [18] found lower signal intensity in those with history of working as a driver compared to those without occupational driving histories but only at L3/4 and L5/S1. Similarly, Kuisma et al. [27] found a lower signal intensity in train engineers compared to factory workers, but only when the spine was evaluated as a whole and not by level.
Only three studies evaluated disc signal intensity using similar outcomes and evaluated a similar WBV exposure to allow quantitative analyses. See Fig. 2 for meta-analysis results [18, 19, 27]. The pooled analysis of two studies [18, 19] for L2/3, L3/4, L4/5 included 434 participants, and the pooled analysis of three studies [18, 19, 27] for L5/S1 included 662 participants. None of the pooled results demonstrated a significant association between WBV and disc degeneration. Therefore, there is moderate quality evidence, downgraded by inconsistency, of no association between WBV and disc degeneration.
Disc height: Disc height can be measured on imaging using quantitative or qualitative measures and is a surrogate measure of disc degeneration. Six studies evaluated disc height or disc height narrowing [17, 21, 22, 25, 26, 30]. Pooling was not performed given the significant variability in the outcome measurements or the absence of enough information to allow pooling. Only one moderate quality study [26] identified decreased disc height in machine operators, but only on a few of the smaller subgroups evaluated within a large study, suggesting the possibility of chance findings. Therefore, due to the indirectness of the results, there is moderate quality evidence of no association between WBV and disc height.
Osteophytes: Of the 5 studies evaluating the presence of osteophytes, the study by Videman et al. [17] was the only one that found a significant difference in osteophytes’ presence between WBV exposure groups, considering all levels together. However, this difference was not clinically important. Therefore, there is moderate quality evidence downgraded by indirectness, of no association between WBV and the presence of osteophytes.
Modic changes: Two studies evaluated Modic changes [24, 27]. Modic changes represent lesions of the vertebral endplate that is adjacent to the bone marrow. Given the significant variability in the outcome measurements, pooling was not performed. One moderate quality study showed that there is no association between WBV and Modic changes type I and type II in train engineers and factory workers [27]. However, another moderate quality study found an association when assessed in daily vehicle users but not when looking a work time spent in a vehicle [24]. Given the inconsistency of the results, it is unclear whether WBV is associated with greater likely of Modic changes.
Spondylolisthesis: One case-control study of moderate quality evaluated lumbar spondylolisthesis [23]. This study evaluated lumbar spondylolisthesis with lumbar radiography and found that cases were more than twice as likely to report occupational driving
All other comparisons of overall degeneration [28, 29], spinal stenosis [32], disc bulging [17, 21], Schmorl’s nodes [22, 31], and endplate defects or lesions [17, 21] were not significantly associated with WBV exposure. Therefore, given the indirectness, there is low or very low quality evidence that WBV is not associated with an increased likelihood of disc bulging and the presence of Schmorl’s nodes or endplate abnormalities.
4.Discussion
The results of this review yield moderate to low quality evidence suggesting that there is not an association between whole body vibration and spine degeneration. Specifically, there was moderate quality evidence from a meta-analysis suggesting no association between WBV and disc degeneration measured in terms of signal intensity. Qualitative synthesis also demonstrated moderate quality evidence of no association between disc height narrowing or the presence of osteophytes with WBV. Further there was inconsistent evidence to discard an association between WBV and Modic changes. There was also low quality evidence from one study of an association of driving exposure
The results of this review are similar to the review by Bible et al. [2, 17], demonstrating no to poor association between WBV and spine degeneration. However, the larger number of studies included in this review and the separate comparisons per outcome made it easier to compare between studies and build stronger conclusions. Taken together, our findings do not support a clear or substantial association between WBV exposure and the increased likelihood of lumbar spine degeneration. Although these results do not allow for conclusions regarding back pain, these results suggest that WBV is unlikely to cause structural changes that would lead to low back pain.
This study has several strengths, including the relatively large number of included studies and the use a meta-analysis. We were limited, however, by the heterogeneity between the included studies in terms of the types of WBV exposures and outcomes collected. Different outcomes were also collected, including different methods to evaluate the same construct (e.g., qualitative, and quantitative assessments of disc signal). Further, even when similar exposures to WBV were evaluated (e.g., pilot), it was not possible to evaluate the impact of long term versus short term exposure, as well as frequency of exposure. Finally, the poor methodological quality of some of the studies, with only a small portion assessing degeneration longitudinally, limits interpretation regarding the progression of spine degeneration.
5.Conclusion
We conclude that despite the limitations of this review in terms of quality of studies and heterogeneity of exposures and outcomes, there is moderate to low quality evidence to suggest that there is not a relationship between WBV and spine degeneration. The results of this study do not currently support the assertion that motorized vehicle and WBV exposure accelerates degeneration and causes structural damage to the spine.
Funding
No funding was received for this study.
Supplementary data
The supplementary files are available to download from http://dx.doi.org/10.3233/BMR-181350.
Conflict of interest
There are no conflicts of interest to declare.
References
[1] | Seidel H. On the relationship between whole-body vibration exposure and spinal health risk. Industrial Health. (2005) ; 43: (3): 361-77. |
[2] | Bible JE, Choemprayong S, O’Neill K, Devin CJ, Spengler DM. Whole-body vibration. Is there a causal relationship to specific imaging findings of the spine? Spine. (2012) ; 37: (21): E1348-E55. |
[3] | NIOSH. Musculoskeletal disoerders and workplace factors. US Department of Health and Human Services. (1997) . |
[4] | WCB Alberta. Low back pain. A progressive Etiology (2016) . Available from: https//www.wcb.ab.ca/providers/medref08.asp. |
[5] | Government of Alberta, Employment and Immigration, Work Safe Alberta. Best Practices_ Vibration at the work site. (2010) ; https//work.alberta.ca/documents/WHS-PUB_gs007.pdf. |
[6] | Luoma K, Riihimaki H, Luukkonen R, Raininko R, Viikari-Juntura E, Lamminen A. Low back pain in relation to lumbar disc degeneration. Spine. (2000) ; 25: (4): 487-92. |
[7] | Özcan-Ekşi EE, Ekşi M, Akçal MA. Severe lumbar intervertebral disc degeneration is associated with modic changes and fatty infiltration in the paraspinal muscles at all lumbar levels, except for L1-L2: A cross-sectional analysis of 50 symptomatic women and 50 age-matched symptomatic men. World Neurosurg. (2019) ; 122: : e1069-e77. |
[8] | Ekşi M, Özcan-Ekşi EE, Orhun Ö, Huet SE, Turgut VU, Pamir MN. Association between facet joint orientation/tropism and lumbar intervertebral disc degeneration. Br J Neurosurg. (2020) : 1-8. |
[9] | Ekşi M, Özcan-Ekşi EE, Orhun Ö, Turgut VU, Pamir MN. Proposal for a new scoring system for spinal degeneration: Mo-fi-disc. Clin Neurol Neurosurg. (2020) ; 198: : 106120. |
[10] | Higgins JP, Green S. Cochrane handbook for systematic reviews of interventions: John Wiley & Sons; (2011) . |
[11] | Liberati A, Altman DG, Tetzlaff J, Mulrow C, Gotzsche PC, Ioannidis JP, et al. The PRISMA statement for reporting systematic reviews and meta-analyses of studies that evaluate health care interventions: Explanation and elaboration. Journal of Clinical Epidemiology. (2009) ; 62: (10): e1-34. |
[12] | Huguet A, Hayden JA, Stinson J, McGrath PJ, Chambers CT, Tougas ME, et al. Judging the quality of evidence in reviews of prognostic factor research: Adapting the GRADE framework. Syst Rev. (2013) ; 2: : 71. |
[13] | The Newcastle-Ottowa Scale (NOS) for assessing the quality of nonrandomised studies in meta-analyses [Internet]. Ottawa Hospital Research Institute. (2011) . |
[14] | Modesti PA, Reboldi G, Cappuccio FP, Agyemang C, Remuzzi G, Rapi S, et al. Panethnic differences in blood pressure in europe: A systematic review and meta-analysis. PLoS ONE [Electronic Resource]. (2016) ; 11: (1): e0147601. |
[15] | Collaboration C. Review Manager (RevMan). [5.3. 5]. Oxford; (2015) . |
[16] | Higgins JPT, Green S. Cochrane Handbook for Systematic Reviews of Interventions 5.1.0 [updated March 2011]. In: The Cochrane Library. Chichester, UK: John Wiley & Sons, Ltd. |
[17] | Videman T, Simonen R, Usenius J, Osterman K, Battie M. The long-term effects of rally driving on spinal pathology. Clinical Biomechanics. (2000) ; 15: (2): 83-6. |
[18] | Hangai M, Kaneoka K, Kuno S, Hinotsu S, Sakane M, Mamizuka N, et al. Factors associated with lumbar intervertebral disc degeneration in the elderly. Spine Journal. (2008) ; 8: (5): 732-40. |
[19] | Luoma K, Riihimaki H, Raininko R, Luukkonen R, Lamminen A, Viikari-Juntura E. Lumbar disc degeneration in relation to occupation. Scandinavian Journal of Work, Environment & Health. (1998) ; 24: (5): 358-66. |
[20] | Savage RA, Whitehouse GH, Roberts N. The relationship between the magnetic resonance imaging appearance of the lumbar spine and low back pain, age and occupation in males. European Spine Journal. (1997) ; 6: (2): 106-14. |
[21] | Battie MC, Videman T, Gibbons LE, Manninen H, Gill K, Pope M, et al. Occupational driving and lumbar disc degeneration: A case-control study. Lancet. (2002) ; 360: (9343): 1369-74. |
[22] | Frymoyer JW, Newberg A, Pope MH, Wilder DG, Clements J, MacPherson B. Spine radiographs in patients with low-back pain. An epidemiological study in men. Journal of Bone and Joint Surgery, American Volume. (1984) ; 66: (7): 1048-55. |
[23] | Ishimoto Y, Cooper C, Ntani G, Yamada H, Hashizume H, Nagata K, et al. Is radiographic lumbar spondylolisthesis associated with occupational exposures? Findings from a nested case control study within the Wakayama spine study. BMC Musculoskeletal Disorders. (2019) ; 20: (1): 1-8. |
[24] | Wu J, Huang J, Battié MC, Wang Y. Lifestyle and lifetime occupational exposures may not play a role in the pathogenesis of Modic changes on the lumbar spine MR images. The Spine Journal. (2020) ; 20: (1): 94-100. |
[25] | Kumar A, Varghese M, Mohan D, Mahajan P, Gulati P, Kale S. Effect of whole-body vibration on the low back. A study of tractor-driving farmers in north India. Spine. (1999) ; 24: (23): 2506-15. |
[26] | Brinckmann P, Frobin W, Biggeman M, Tillotson M, Burton K. Quantification of overload injuries to thoracolumbar vertebrae and discs in persons exposed to heavy physical exertions or vibration at the workplace. Part II. Occurrence and magnitude of overload injury in exposed cohorts. Clinical Biomechanics. (1998) ; 13: (SUPPL. 2): S36. |
[27] | Kuisma M, Karppinen J, Haapea M, Niinimaki J, Ojala R, Heliovaara M, et al. Are the determinants of vertebral endplate changes and severe disc degeneration in the lumbar spine the same? A magnetic resonance imaging study in middle-aged male workers. BMC Musculoskeletal Disorders. (2008) ; 9: : 51. |
[28] | Byeon JH, Kim JW, Jeong HJ, Sim YS, Kim DK, Choi JK, et al. Degenerative changes of spine in helicopter pilots. Annals of Rehabilitation Medicine. (2013) ; 37: (5): 706-12. |
[29] | Hendriksen IJ, Holewijn M. Degenerative changes of the spine of fighter pilots of the Royal Netherlands Air Force (RNLAF). Aviation Space & Environmental Medicine. (1999) ; 70: (11): 1057-63. |
[30] | Sovelius R, Salonen O, Lamminen A, Huhtala H, Hamalainen O. Spinal MRI in fighter pilots and controls: A 13-year longitudinal study. Aviation Space and Environmental Medicine. (2008) ; 79: (7): 685-8. |
[31] | Aydog ST, Turbedar E, Demirel AH, Tetik O, Akin A, Doral MN. Cervical and lumbar spinal changes diagnosed in four-view radiographs of 732 military pilots. Aviation Space & Environmental Medicine. (2004) ; 75: (2): 154-7. |
[32] | Ishimoto Y, Cooper C, Ntani G, Yamada H, Hashizume H, Nagata K, et al. Factory and construction work is associated with an increased risk of severe lumbar spinal stenosis on MRI: A case control analysis within the wakayama spine study. Am J Ind Med. (2019) ; 62: (5): 430-8. |


