
Electromyography activities in patients with lower lumbar disc herniation
Abstract
BACKGROUND:
Lumbar disc herniation (LDH) can affect lower limb muscle function resulting in an abnormal gait. This study aims to use surface electromyography (SEMG) to evaluate patients with L
METHODS:
Twenty L
RESULTS:
Reduced MPF and MF was found in TA measurements of the L5 Group and LG measurements of the S1 Group. The MPF and MF of the TA of symptomatic limbs of the L5 Group were reduced when compared to asymptomatic limbs (
CONCLUSION:
TA is affected in patients with LDH of L
1.Introduction
Lumbar disc herniation (LDH) is the most common cause of radicular pain in osteopathic patients, with the prevalence of LDH estimated to be between 3.7% and 5.1% [1]. Symptoms can include lower limb claudication and limitation in mobility. Surgical treatment is required to relieve these symptoms [2, 3]. More than 90% of LDH occurs in the L4/L5 and L5/S1 segments [4]. Preliminary diagnosis and evaluation of LDH is completed using a thorough analysis of the patient’s medical history, a general physical examination, a neurological examination, and imaging [5]. LDH is mainly caused by the degeneration of the lumbar spine and can affect the patient’s ability to walk [6].
In addition to lumbar spine degeneration, LDH patients also often experience reduced muscle strength and decreased endurance. There is evidence to suggest that highly fatigable lumbar muscles are closely related to LDH [7]. Although the exact pathophysiology of LDH remains elusive, the evaluation of related muscles is valuable when assessing these patients. Among objective analysis methods, magnetic resonance imaging (MRI) and electromyography (EMG) are the most common used methods to assess muscle activity in healthy subjects and in patients [8].
MRI is useful when determining the root causes of back pain or radiating pain, and assessing the presence of LDH. The prognostic value of MRI on lumbar surgery is widely accepted, however it has not yet been confirmed in the diagnosis of the compressed nerve root [9]. This is because although MRI is highly sensitive and can provide excellent anatomical data, it cannot provide information about the physiological and functional status of neural and muscular tissues, which has a higher clinical relevance [9]. Currently, EMG relies on disposable needle electrodes which, when inserted into relevant muscles, measure nerve conduction parameters and reflect the state of the nerve function [10, 11]. There are, however, some limitations to the clinical applications of using a needle electrode, exemplified by the relative complexity and invasiveness of the procedure, the risk of infection, and the ability to collect only static EMG data [12]. Despite many the many studies that focus on the use of EMG in this capacity, it remains to be demonstrated whether this technology can be used to gather reliable data in a way that is convenient and noninvasive. Surface electromyography (SEMG) appears to be more convenient for both patients and researchers when analyzing lower back muscle fatigue in laboratory studies and in clinical trials [13]. SEMG is a biological electrical signal of the neuromuscular system that is guided and recorded by electrodes stuck to the surfaces of muscles [14]. SEMG detection is simple, non-invasive, and convenient for patients. It can be used for muscles in a static state as well as for observing changes in muscle activity throughout numerous sports. Since pain perception influences the development of activity limitations in patients with LDH, it is important to assess muscle function and activation while patients are walking. Additionally, muscle deficits may contribute to gait disturbances or limps [7], and if we can identify the patterns of lower limb muscle activities in LDH patients using SEMG while walking, we can effectively guide their evaluation, diagnosis, and treatment.
The purpose of this study is to determine the characteristics of lower limb muscle activities using SEMG in patients with LDH. Additionally, we hope to provide previously unattainable information for the clinical evaluation of these patients using SEMG signals.
Table 1
General characteristics of the subjects
| L5 Group | S1 Group | Healthy | ||||
|---|---|---|---|---|---|---|
| Male:Female | 8:2 | 6:4 | 8:2 | |||
| Age (year) | 32.6 | 36.9 | 28.5 | |||
| Height (cm) | 176.5 | 171.6 | 175.0 | |||
| Weight (kg) | 79.1 | 71.7 | 71.3 | |||
| JOA score (0–100) | 11.7 | 12.4 | / | |||
| Leg pain VAS (0–10) | 6.8 | 7.3 | / | |||
| Lumbar pain VAS (0–10) | 4.4 | 1.4 | / | |||
JOA: Japanese Orthopedic Association; VAS: Visual Analogue Scale.
2.Materials and methods
2.1Participants
Twenty lumbar disc herniation (LDH) patients with L4/L5 protrusion and compression of only the L5 nerve root (L5 Group), twenty LDH patients with L5/S1 protrusion and compression of only the S1 nerve root (S1 Group), and twenty healthy controls (Healthy) were recruited for this study. The patients in the L5 and S1 Groups were diagnosed with LDH through medical history, general physical exam, neurological exam, preoperative lumbar MRI, and intraoperative observation. Specially, patients in the L5 Group were diagnosed with L4/L5 LDH, while patients in the S1 Group were diagnosed with L5/S1 LDH. All patients were required to be able to ambulate at least 50 m. General characteristics are shown in Table 1. Patients with the following symptoms were excluded: (1) Suffering spine endogenous diseases, including spinal cord tumor and syringomyelia; (2) Suffering severe respiratory or heart disease, and having limited movement capacity; (3) Patients with other diseases, such as of the joint or neuromuscular systems; (4) Patients who were pregnant, immunosuppressed, or diagnosed with cancer; or (5) Patients with major motor weakness in lower limbs, limited spinal range of motion, and other diseases that could impair walking capacity.
All subjects signed the informed consent form, and the experiment was approved by the Ethics Committees of Capital Medical University, Beijing, China.
2.2Instruments
2.2.1Surface electromyography (SEMG) measurement
SEMG was measured using a DELSYS wireless dynamic EMG tester (Trigno
2.2.2Gait measurement
The gait was measured using a portable high speed camera (GoPro Hero3, GoPro Inc., USA). A GoPro is small, light, and easy to transport. The shooting rate is set to 120 frames per second with 8.33 ms per frame time.
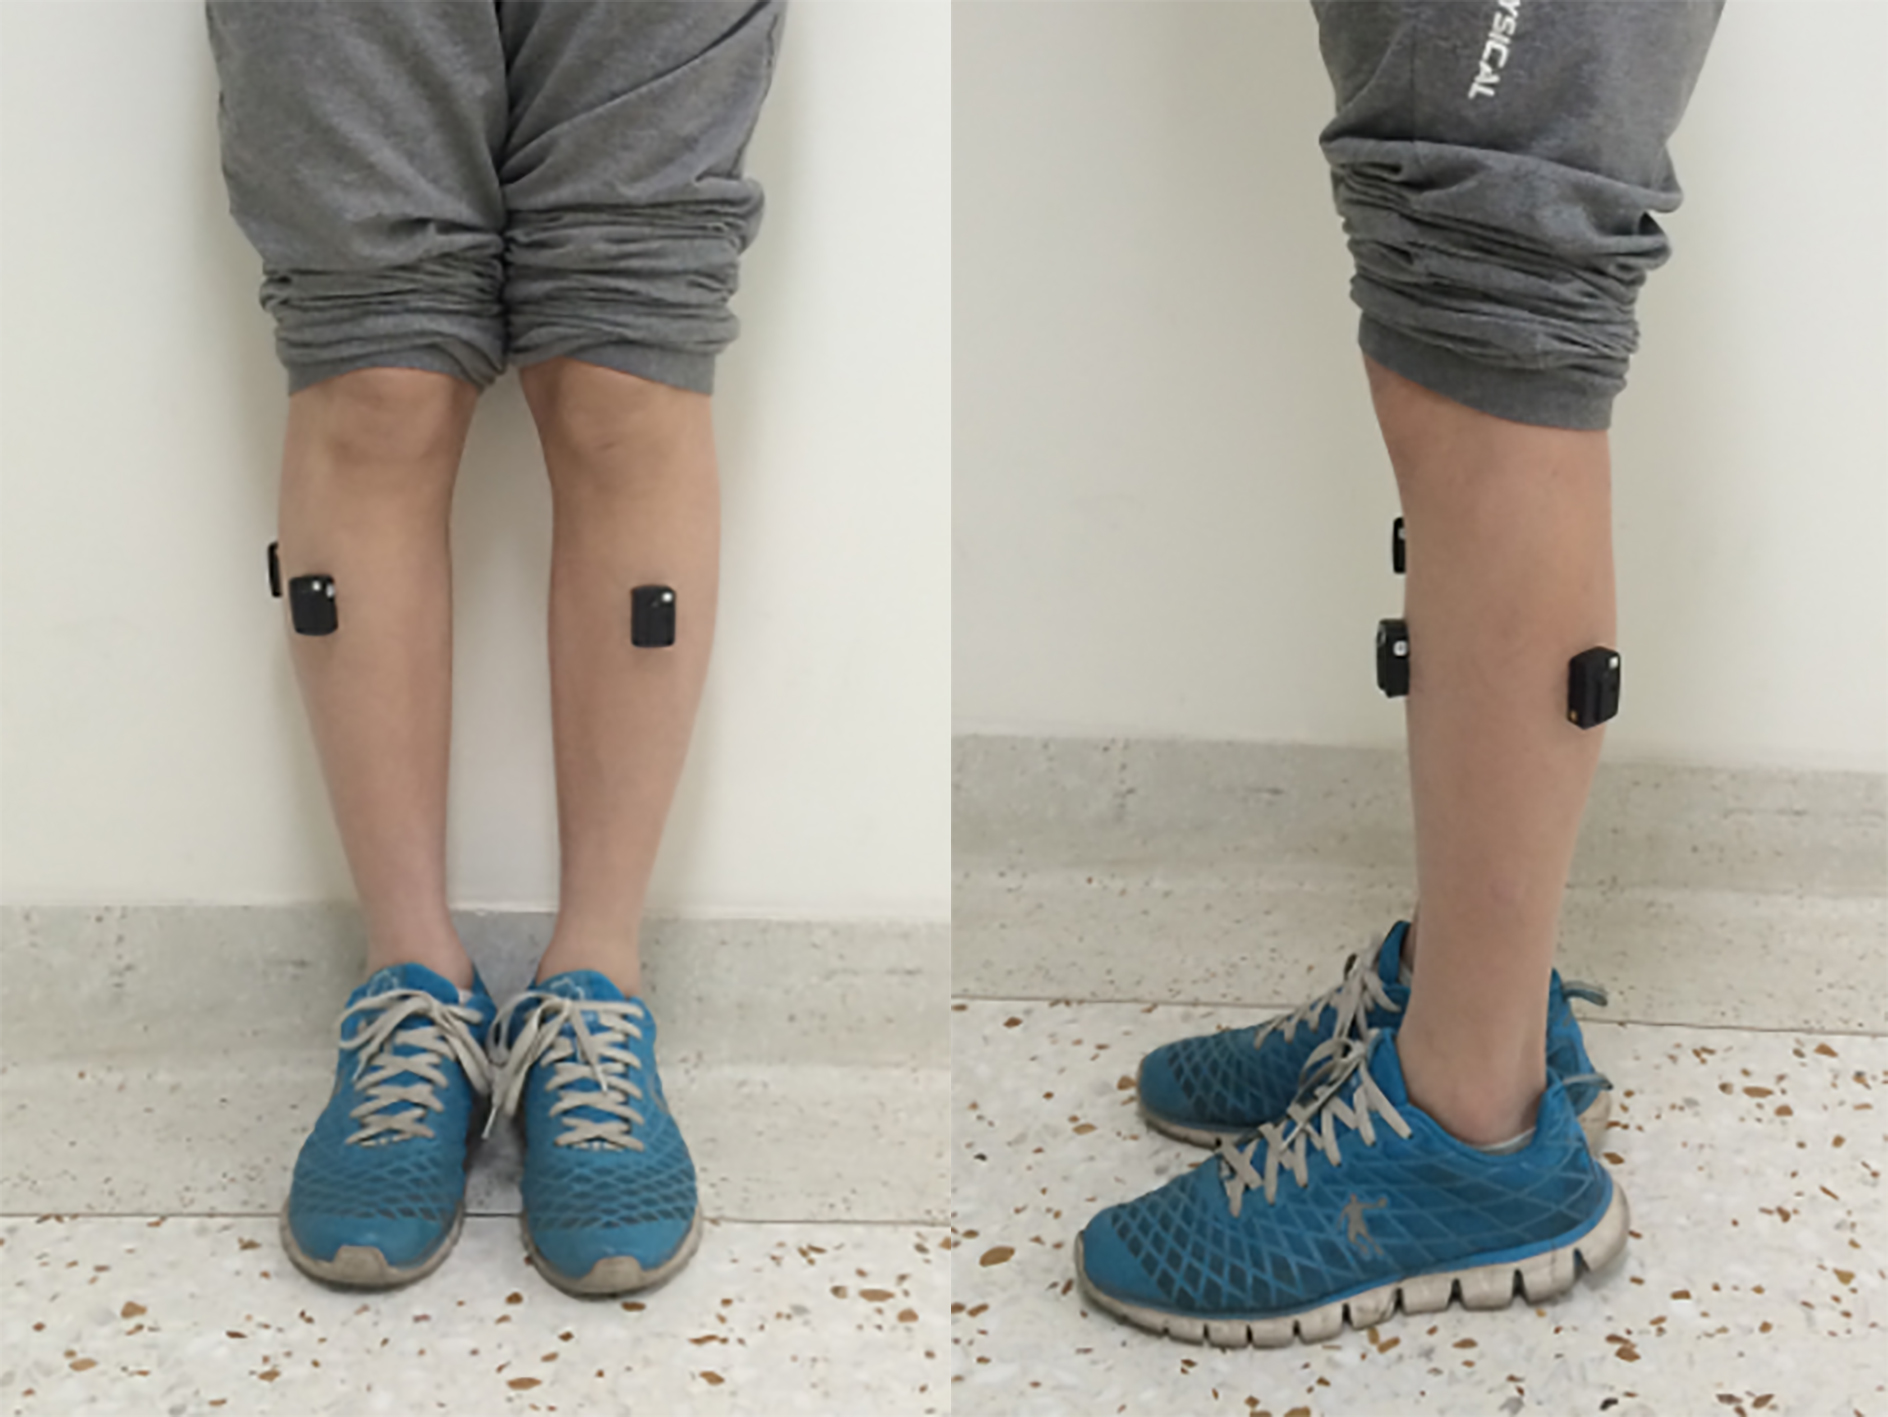
Figure 1.
Patient: male, 26 years old, L
2.3Experimental methods
Previous studies have shown that L5 nerve root compression can result in tibialis anterior (TA) dysfunction, and S1 nerve root compression can result in lateral gastrocnemius (LG) dysfunction [15, 16]. Therefore, the SEMG signals from the bilateral TA and LG were collected. The largest portion of the muscle belly was identified and then the skin was scraped, sanded, and cleaned to increase electrode conductivity, and finally the wireless electrode was attached to the skin (Fig. 1). Subjects walked back and forth on a 10 m flat floor independently and at natural speed and cadence. Throughout this movement, EMG signals were collected by the DELSYS wireless dynamic EMG tester, and at least 20 gait cycles were captured and synced with a high speed camera.
A small, portable high-speed camera (GoPro Hero3, GoPro Inc., USA) was used to identify the gait cycles with a shooting rate of 120 frames per second. A GoPro camera was used to record gait cycles and to capture the light flash when the DELSYS wireless dynamic EMG tester was triggered by the Trigno Trigger Adapter (Trigno Wireless Systems, Delsys Inc., USA). From the trigger action time, gait and EMG data can be synchronized.
Table 2
SEMG parameters of TA and LG of patients
| Parameters/groups | L5 Group | S1 Group | ||||
|---|---|---|---|---|---|---|
| Symptomatic | Asymptomatic | Symptomatic | Asymptomatic | |||
| side | side | side | side | |||
| TA | ||||||
| RMS-peak (uV) | 60.41 | 69.74 | 0.45 | 53.60 | 87.45 | 0.06 |
| MPF (HZ) | 70.52 | 89.03 | 0.01 | 77.45 | 92.00 | 0.15 |
| MF (HZ) | 50.66 | 68.56 | 0.01 | 57.62 | 70.39 | 0.19 |
| LG | ||||||
| RMS-peak (uV) | 29.96 | 44.17 | 0.14 | 47.51 | 66.90 | 0.32 |
| MPF (HZ) | 88.40 | 94.93 | 0.28 | 76.63 | 98.27 | 0.01 |
| MF (HZ) | 64.69 | 74.26 | 0.23 | 57.49 | 79.15 | 0.02 |
Figure 2.
Average RMS of lower limb of healthy participants. a. TA of healthy group. b. LG of healthy group. X axis: RMS (uV); Y axis: gait cycle (%).
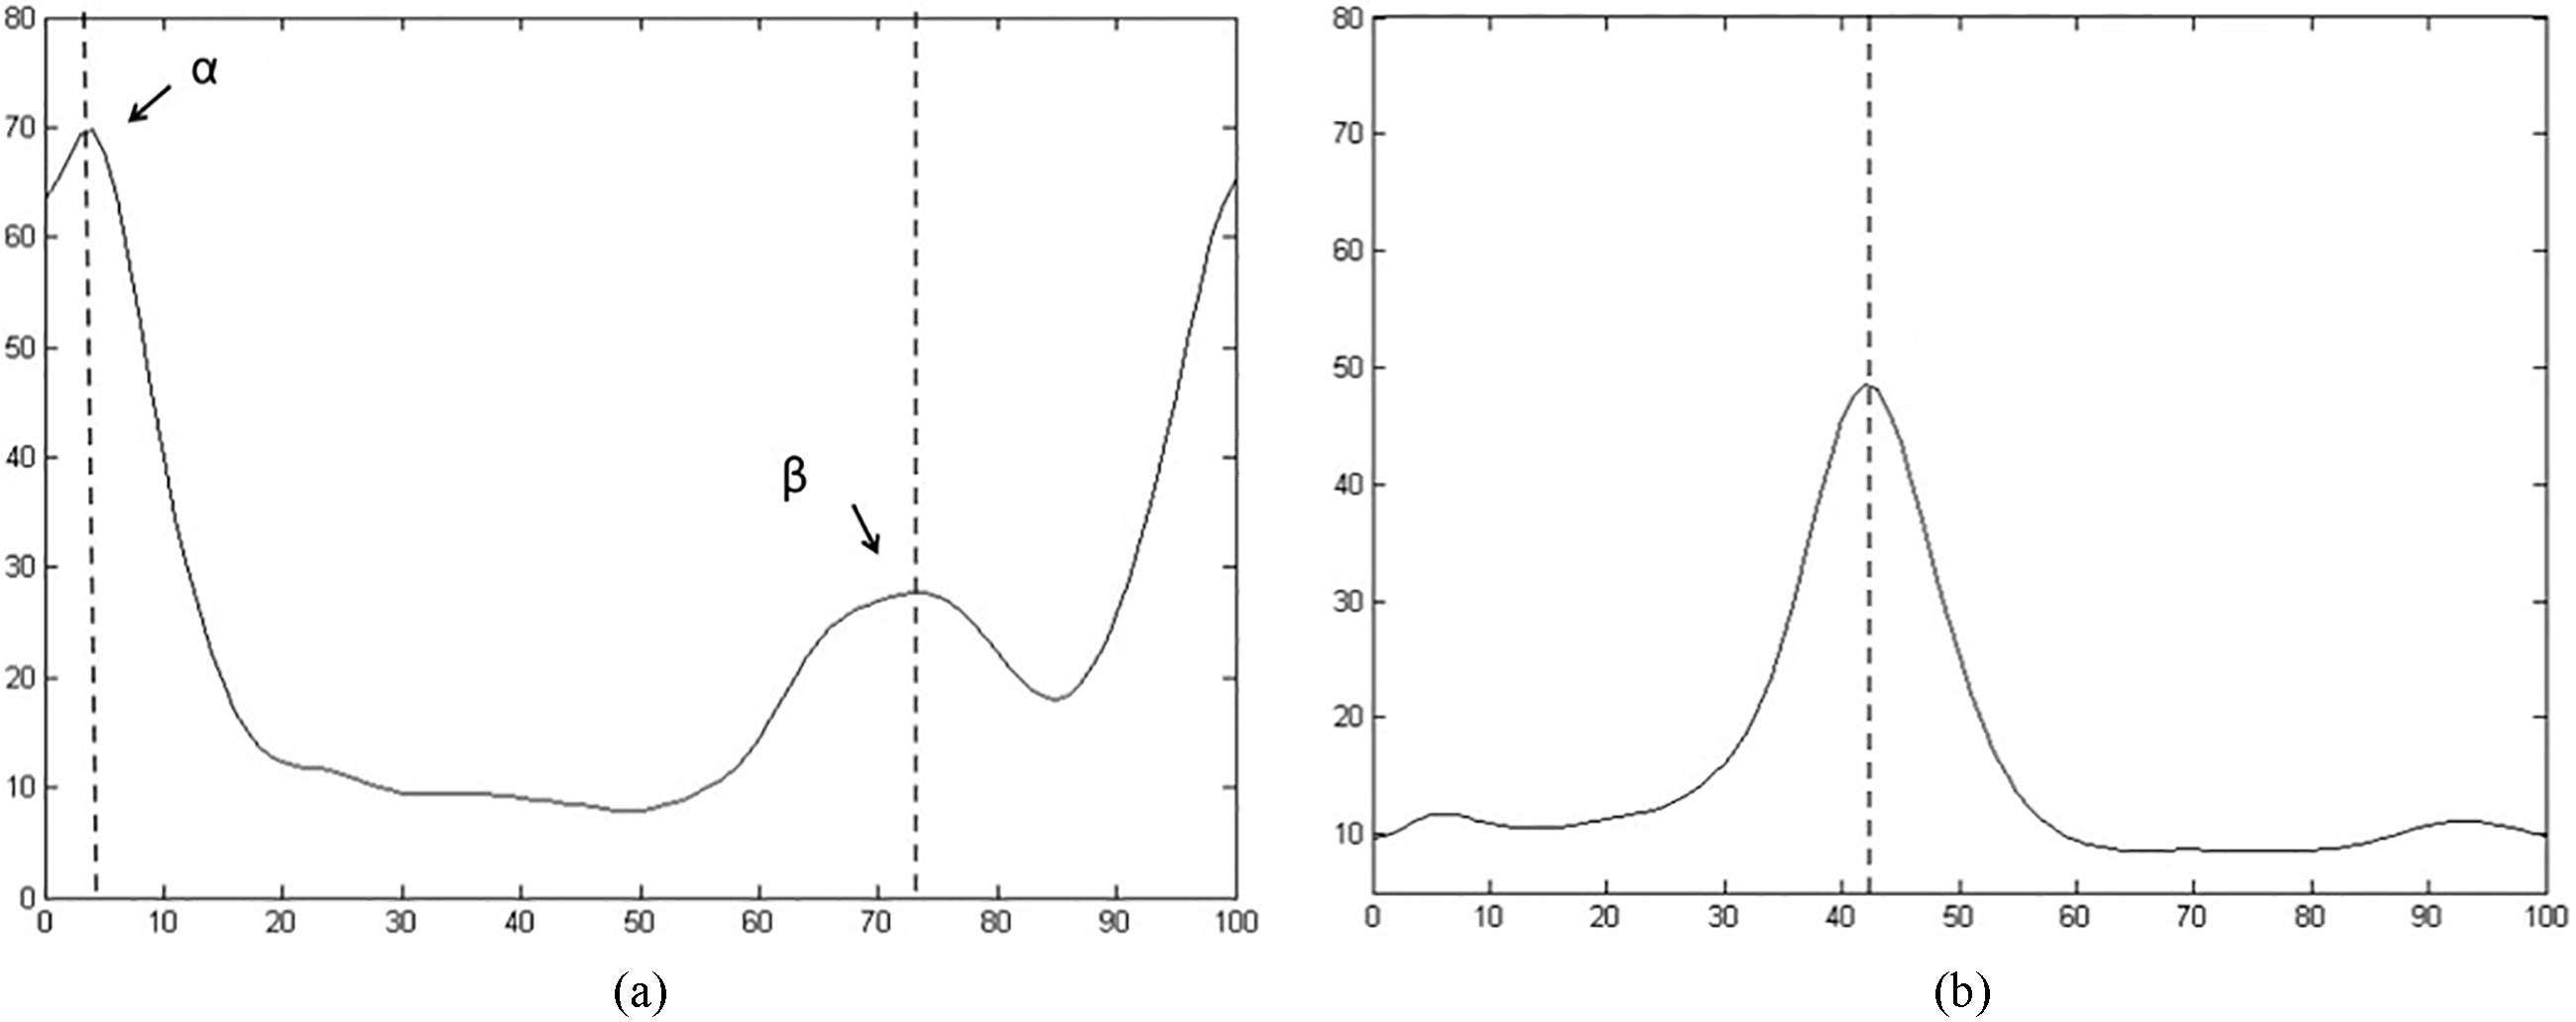
Figure 3.
Average of RMS of L5 Group. a. TA of symptomatic limb. b. LG of symptomatic limb. c. TA of asymptomatic limb. d. LG of asymptomatic limb. X axis: RMS (uV); Y axis: gait cycle (%).
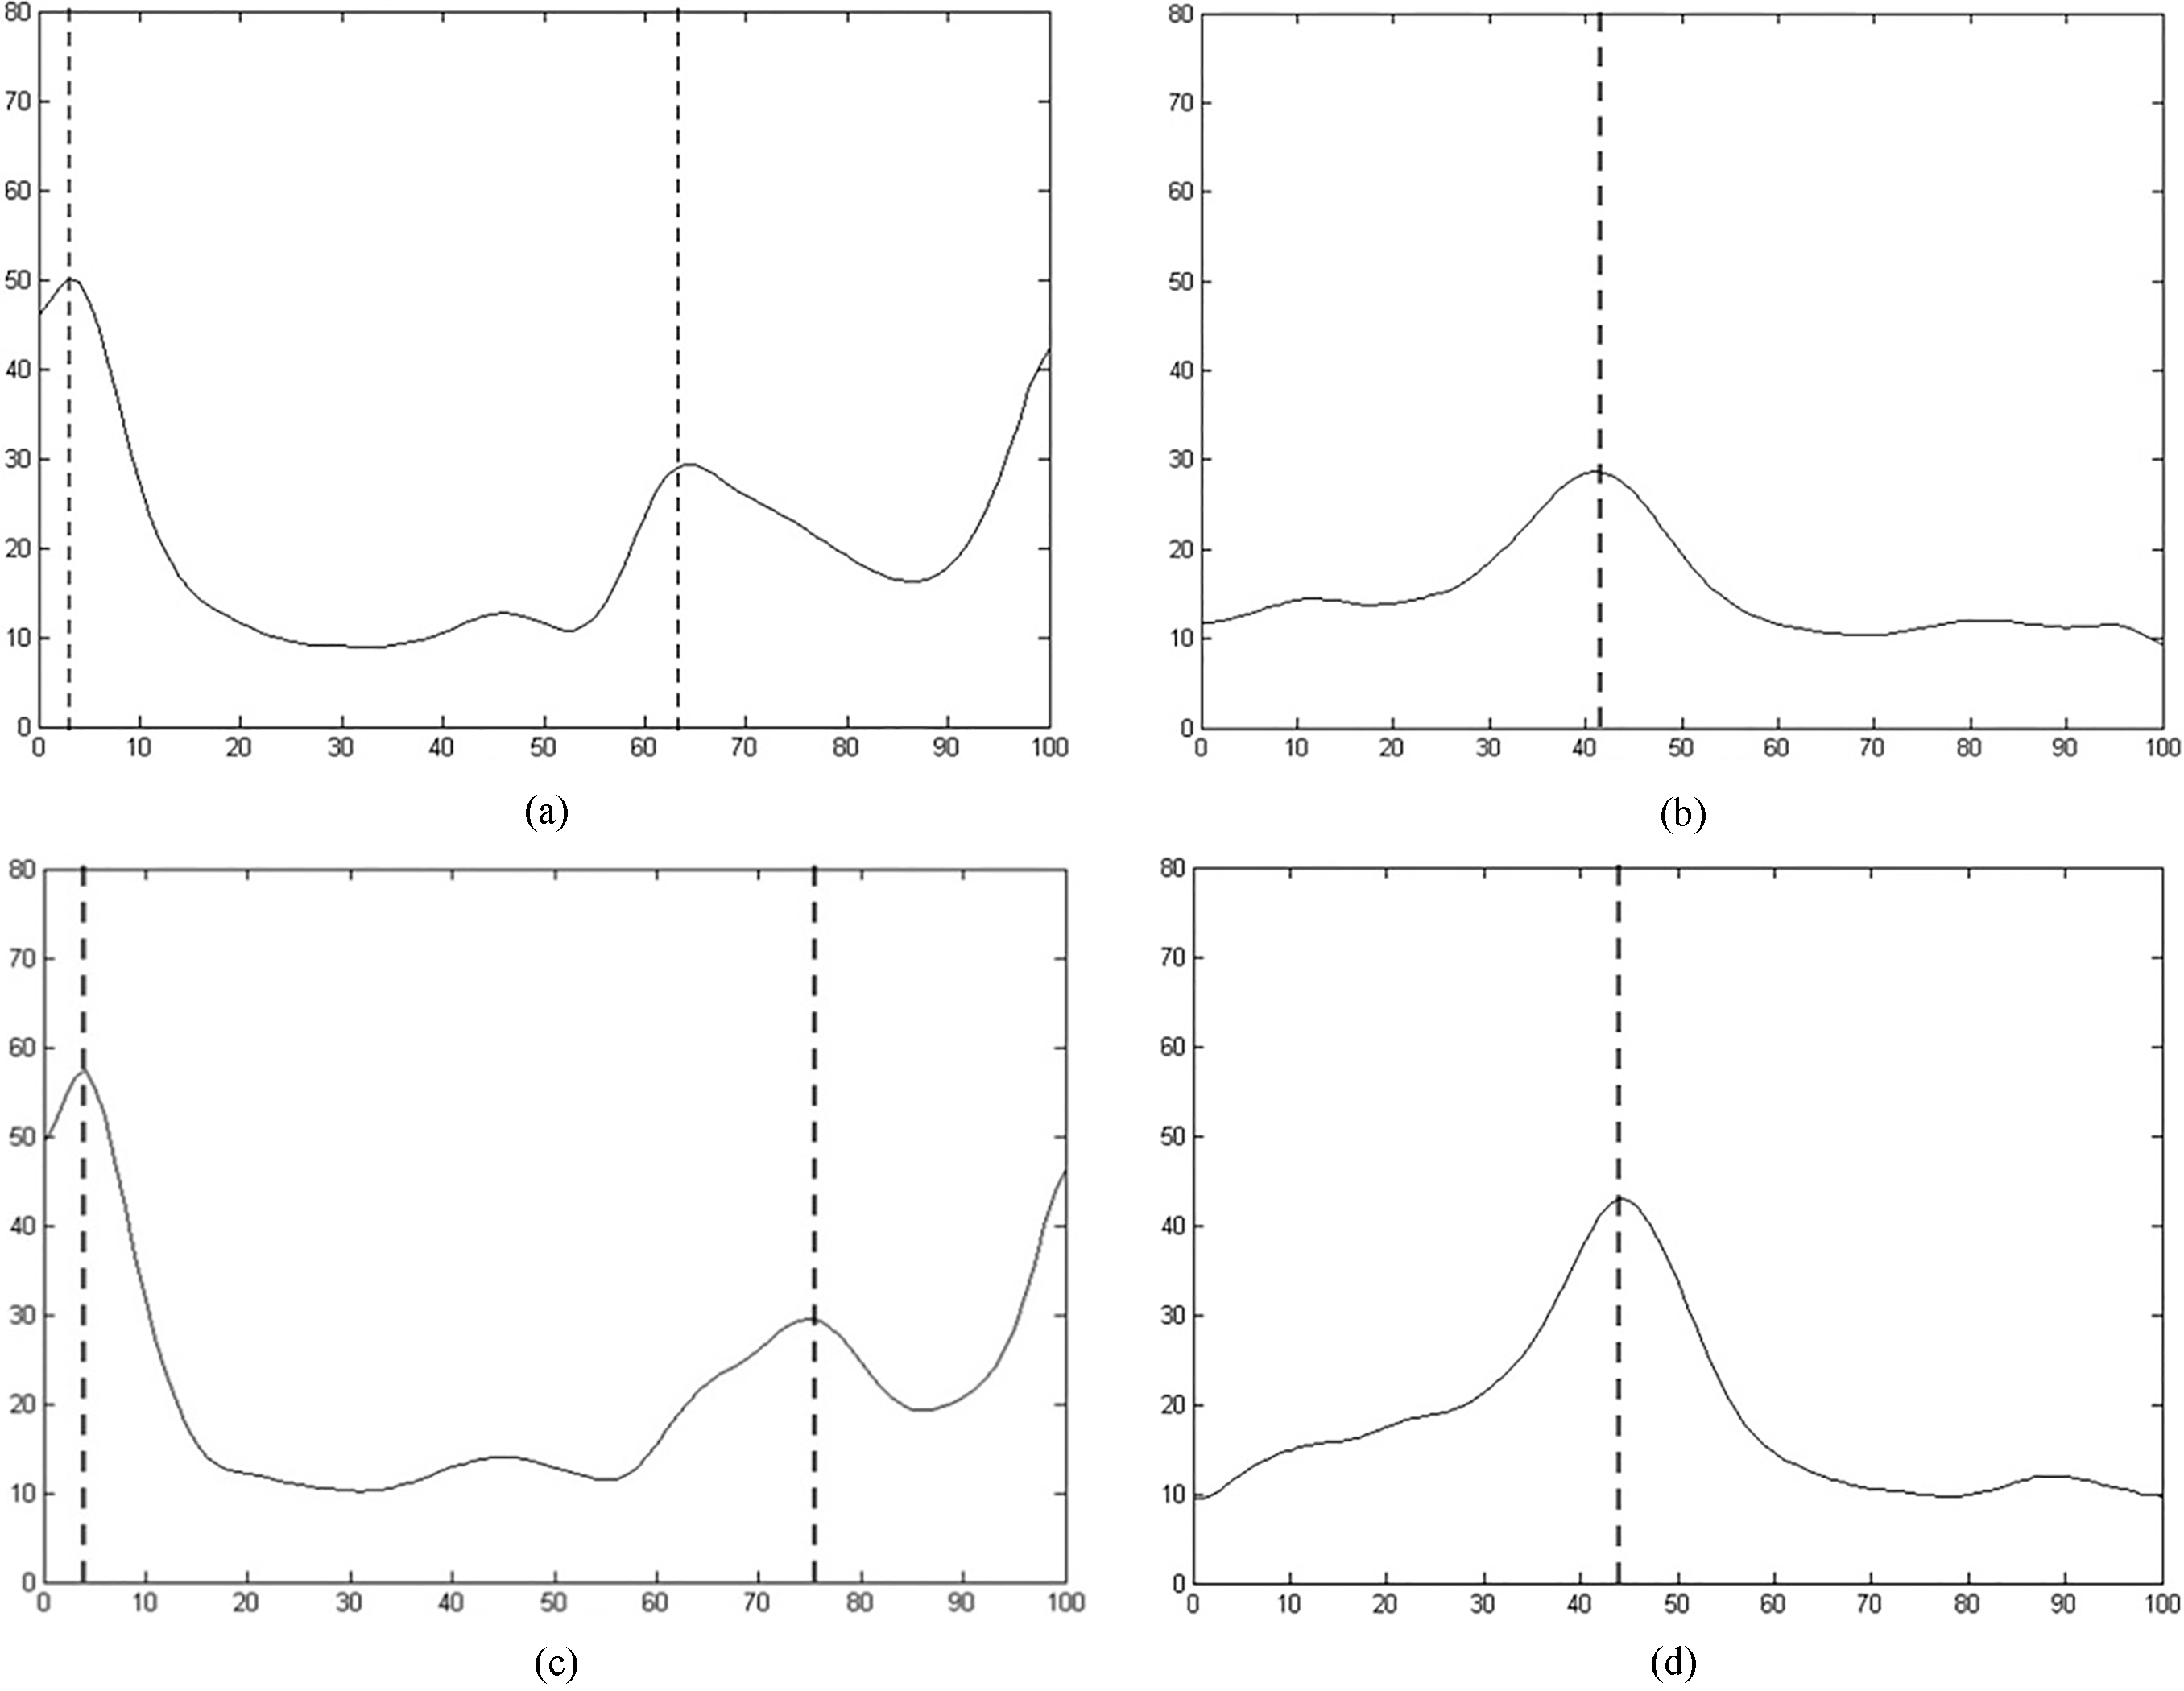
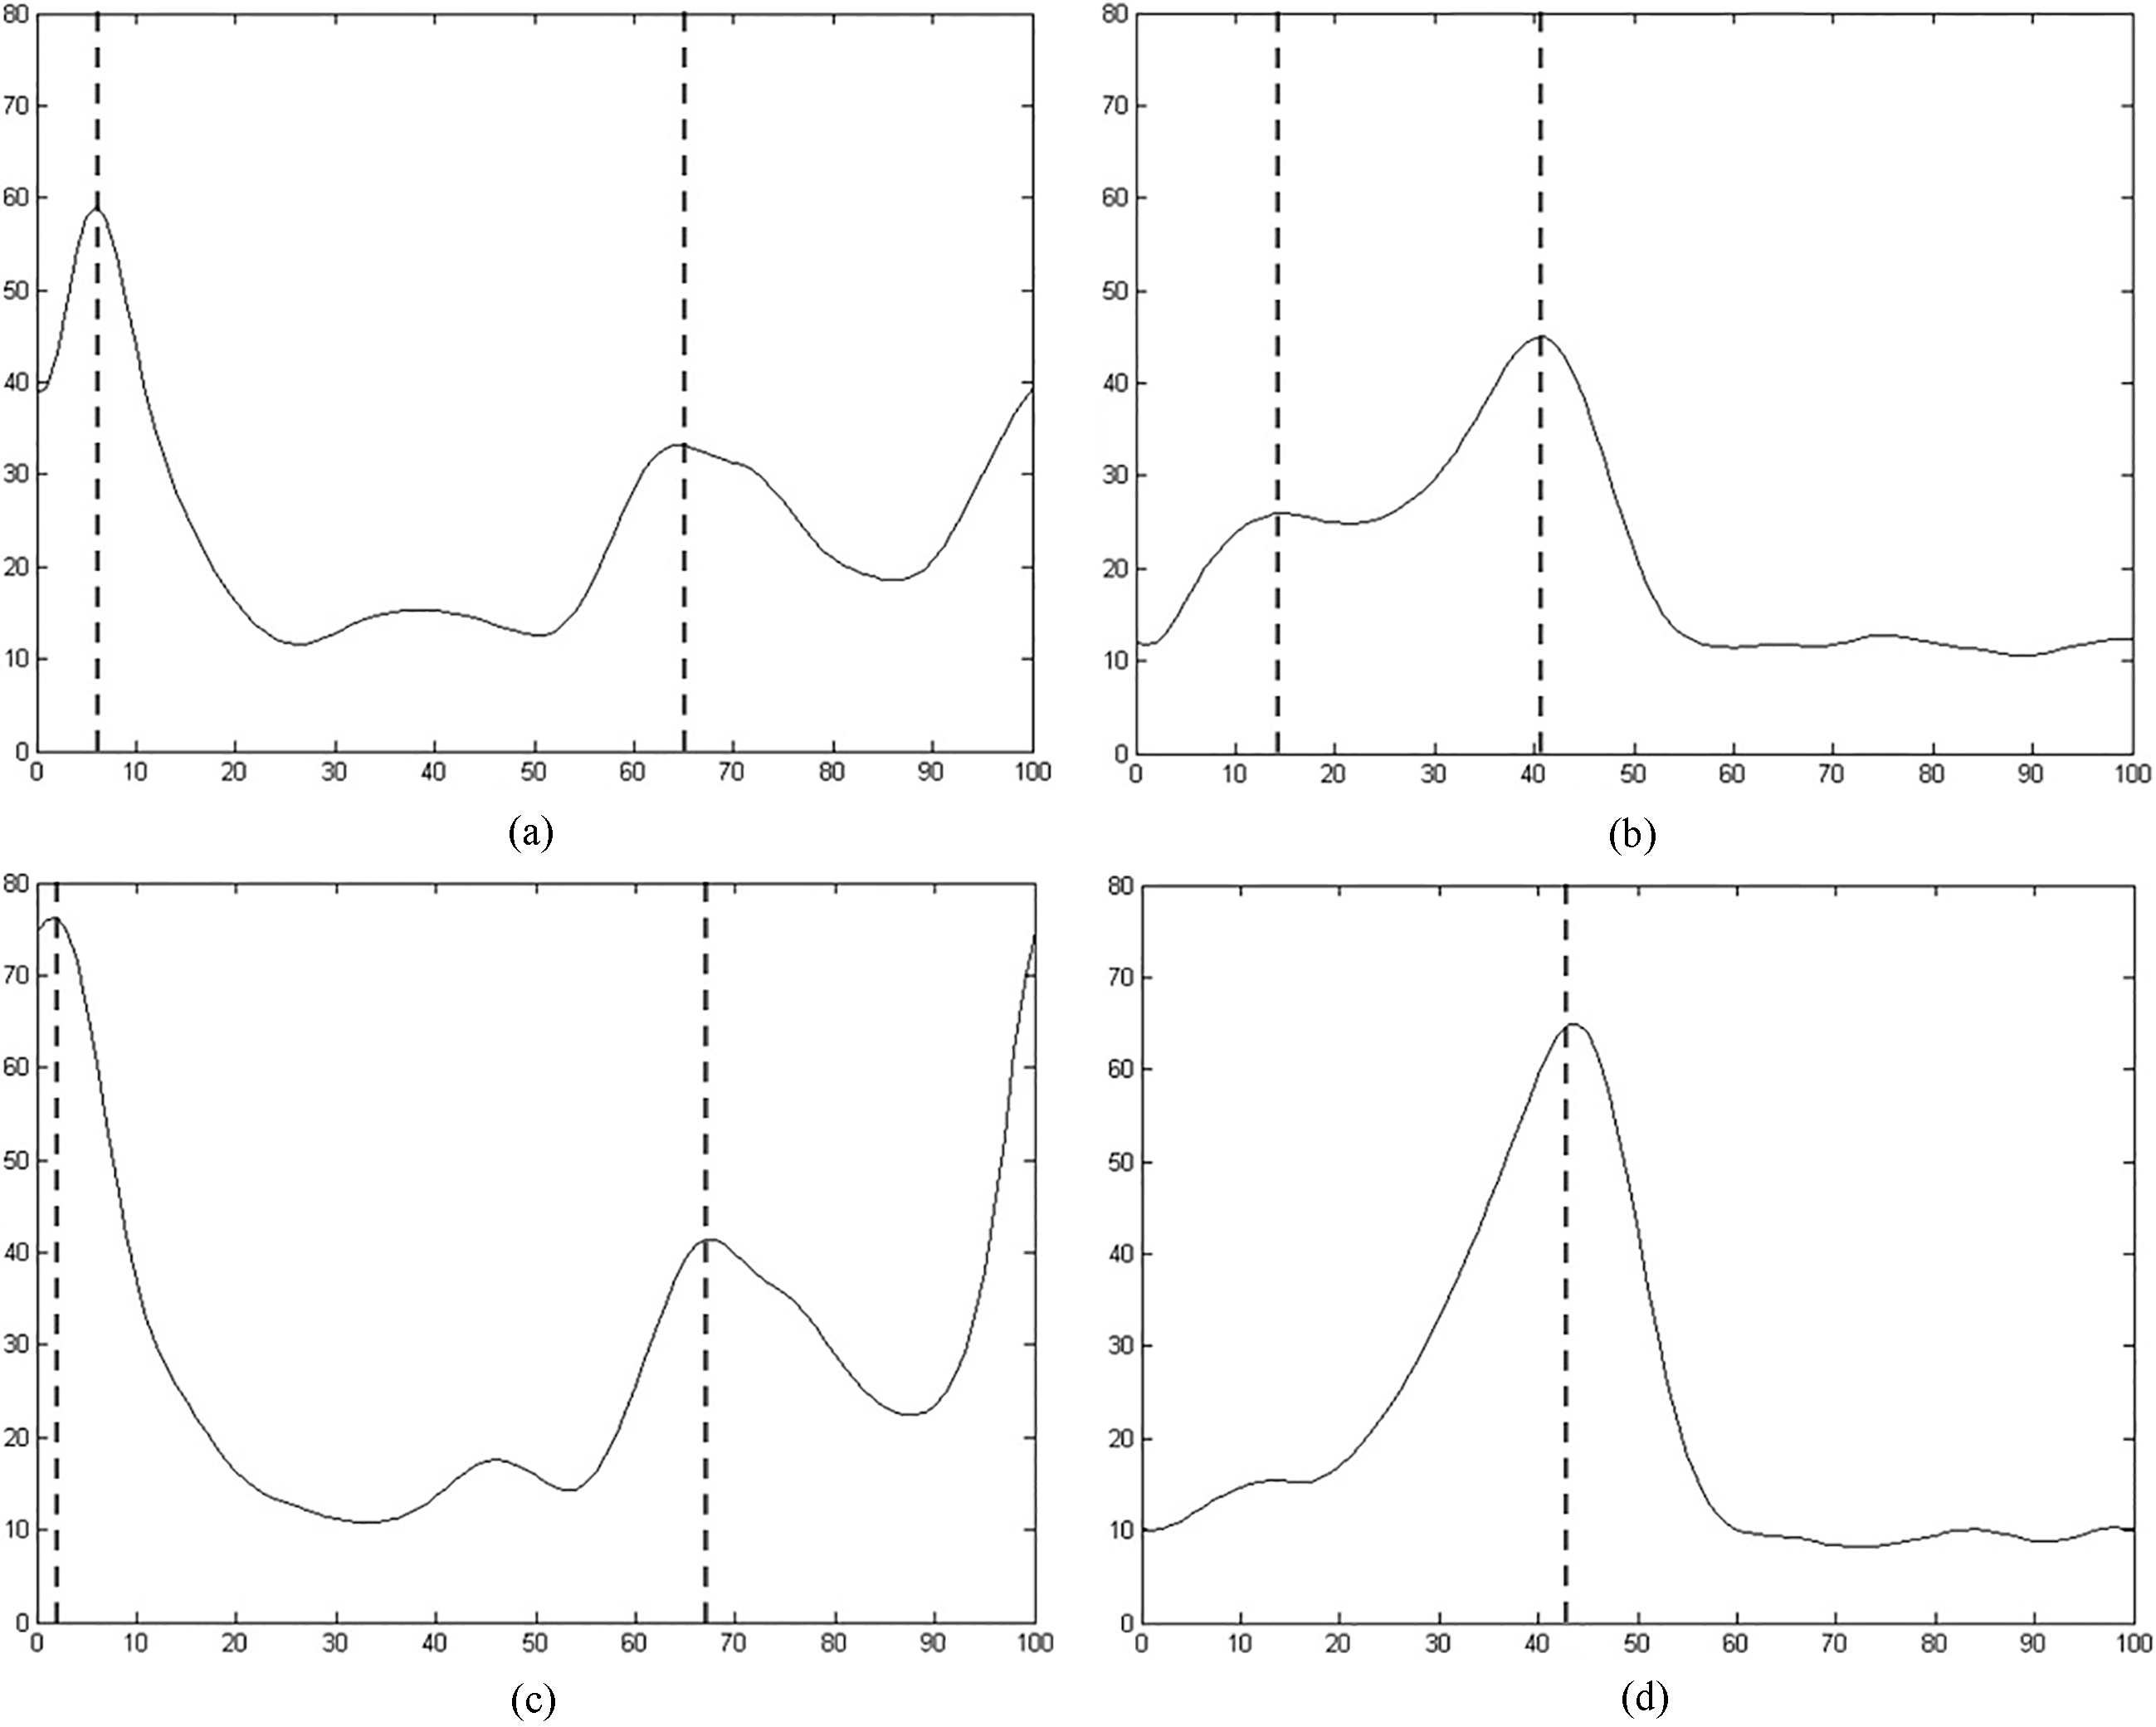
Figure 4.
Average of RMS of S1 Group. a. TA of symptomatic limb. b. LG of symptomatic limb. c. TA of asymptomatic limb. d. LG of asymptomatic limb. X axis: rRMS (uV); Y axis: gait cycle (%).
2.4Data analysis
The SEMG data of 20 gait cycles for each subject was distracted, processed, and analyzed through MATLAB software after eliminating noise. First, in the time domain, the RMS of the SEMG signals in each gait cycle was calculated using the 30 ms window and the 20 ms step duration [17]. Next, the RMS values were obtained by averaging all 20 gait cycles [18]. The average RMS of the 20 subjects of each group were calculated for comparison between the three groups. The RMS values and the curve of the healthy controls were used for normal reference. The difference of the RMS of each muscle was compared between the symptomatic side and the asymptomatic side of the patients in the L5 and S1 Groups. Second, in the frequency domain, the SEMG signals were processed using a Fourier transform and the mean power frequency (MPF) and the median frequency (MF) of each gait cycle was calculated [19]. Finally, the values of MPF and MF of each participant were calculated from the average of all 20 gait cycles.
2.5Statistical analysis
The RMS, MPF, and MF of the L5 and S1 Groups were analyzed by SPSS 19 software. A paired student
3.Results
The SEMG signals between the symptomatic limb and asymptomatic limb are significantly different, however there were no significant differences between the two lower limbs in healthy controls (Table 2). In the L5 Group, the MPF and MF of the TA of the symptomatic side were significantly smaller than that of the asymptomatic side (side
The RMS curves of the three groups of patients are shown in Figs 2–4. There were no significant differences in the RMS values between the two groups. However, there were some differences in the RMS curve in patients with LDH. First, compared to the asymptomatic limb of L4/L5 LDH patients, the
4.Discussion
The different SEMG activities of L4/L5 and L5/S1 intervertebral disc herniation patients indicates the different muscle function states of the patients while walking, The results also provide additional information for further nerve and muscle evaluation. SEMG is a technique that can record the electrical activities of many motor units using electrodes, which makes it non-invasive and easy to operate. It also has the ability to observe the dynamic state of a muscle. Malone et al. validated the reliability of using SEMG for patients, and he also describes the differences of SEMG signals between patients with cervical spondylosis myelopathy and healthy controls, as well as the changes one year after analysis with SEMG [20, 21, 22]. This research demonstrated that SEMG can accurately reflect the state of neuromuscular function in patients. SEMG has also been used for the evaluation of muscle function in patients with LDH [23, 24, 25, 26]. Preliminary studies showed that the evaluation of muscle function using both frequency and time domains was more specific and objective than the simple biomechanical method [27]. However, the majority of these studies focused on the observation of SEMG signals in paravertebral muscles and other muscles in lumbar area. Few studies focused on the changes of lower limb muscles in LDH patients, and the dynamic states of their muscles.
In frequency domain analysis, the MPF and MF show different expressions in L4/L5 and L5/S1 patients. In patients with L4/L5 LDH, the MPF the MF of the TA on the symptomatic side were significantly smaller than that of the contralateral side, while in the patients with L5/S1 LDH, the MPF and the MF of the LG on the symptomatic side were significantly smaller than that of the contralateral side. Previous studies demonstrated that these two parameters in the frequency domain reflected the degree of muscle fatigue, which itself was measured by the left shift of the spectrum of SEMG signals and the decrease in MPF and MF during ambulation [28]. These results suggest that the TA in patients with L4/L5 LDH appears more easily fatigable, while the LG in patients with L5/S1 LDH appears more fatigable while walking.
In time domain analysis, the RMS of the normal control group (Fig. 2a and b) was used as a reference. For the symptomatic and asymptomatic limbs of the L4/L5 and the L5/S1 LDH patients, we found that there was a significant difference between the two groups regarding gait cycle. A gait cycle can be divided into eight phases, including initial contact, loading response, mid stance, terminal stance, pre-swing, initial swing, mid swing, and terminal swing [29]. The lower limb muscles play distinctive roles in each phase. Under normal circumstances, the TA controls ankle dorsiflexion and contracts in the initial contact period so as to help the forefoot decline smoothly. Thus, the RMS curve of the SEMG showed an
Our study evaluated SEMG activities of lower limb muscles in patients with L4/L5 and L5/S1 LDH while walking. SEMG can reflect the functional status of lower limb muscles quantitatively, effectively standardizing the evaluation of muscle strength and overcoming any lingering problems of subjectivity [31, 32]. Additionally, SEMG can provide information on the state of both nerve and muscle tissues, helping doctors to better analyze patients, estimate prognosis, and offer treatment.
5.Conclusion
In this study, SEMG was used to detect activities of various lower limb muscles in patients with L4/L5 and L5/S1 LDH. We found that the TA is affected for patients with LDH of L4/L5, and the LG is affected for patients with LDH of L5/S1. We demonstrated that SEMG can be used to identify dysfunction in lower limb muscles related to LDH accurately, conveniently, and non-invasively.
Acknowledgments
We thank the individuals and their families who participated in this project. This work was partly supported by The Foundation from Beijing Rehabilitation Hospital (No. 2018-004,2018-006).
Conflict of interest
The authors have no conflict of interest to report.
References
[1] | Abrishamkar S, Kouchakzadeh M, Mirhosseini A, Tabesh H, Rezvani M, Moayednia A, et al. Comparison of open surgical discectomy versus plasma-laser nucleoplasty in patients with single lumbar discherniation. J Res Med Sci. (2015) ; 20: : 1133-7. doi: 10.4103/1735-1995.172979. |
[2] | Huang YP, Bruijn SM, Lin JH, Meijer OG, Wu WH, Abbasi-Bafghi H, et al. Gait adaptations in low back pain patients with lumbar disc herniation: trunk coordination and arm swing. Eur Spine J. (2011) ; 20: : 491-9. doi: 10.1007/s00586-010-1639-8. |
[3] | Lee JH, An JH, Lee SH, Seo IS. Three-dimensional gait analysis of patients with weakness of ankle dorsiflexor as a result of unilateral L5 radiculopathy. J Back Musculoskelet Rehabil. (2010) ; 23: : 49-54. doi: 10.3233/BMR-2010-0248. |
[4] | Xu DR, Song YD, Wang H, Li SG. Meta-analysis of lumbar disc herniation in Chinese adolescent. Zhong Hua Yi Xue Za Zhi. (2013) ; 45: : 3606-9. doi: 10.3760/cma.j.issn.0376-2491.2013.45.011. |
[5] | Al Nezari NH, Schneiders AG, Hendrick PA. Neurological examination of the peripheral nervous system to diagnose lumbar spinal disc herniation with suspected radiculopathy: a systematic review and meta-analysis. Spine J. (2013) ; 13: : 657-74. doi: 10.1016/j.spinee.2013.02.007. |
[6] | MacWilliams BA, Rozumalski A, Swanson AN, Wervey R, Dykes DC, Novacheck TF, et al. Three-dimensional lumbar spine vertebral motionduring running using indwelling bone pins. Spine. (2014) ; 39: : E1560-5. doi: 10.1097/BRS.00000000. |
[7] | Ramos LAV, França FJR, Callegari B, Burke TN, Magalhase MO, Marques AP. Are lumbar multifidus fatigue and transversus abdominis activation similar in patients with lumbar disc herniation and healthy controls? A case control study. Eur Spine J. (2016) : 1435-42. doi: 10.1007/s00586-015-4375-2. |
[8] | MohseniBandpei MA, Rahmani N, Majdoleslam B, Abdollahi L, Ali SS, Ahmad A. Reliability of surface electromyography in the assessment of paraspinal musclefatigue: an updated systematic review. J Manipulative Physiol Ther. (2014) : 37: : 510-21. doi: 10.1016/j.jmpt.2014.05.006. |
[9] | Lee JH, Lee SH. Clinical usefulness of electrodiagnostic study to predict surgical outcomes in lumbosacral disc herniation or spinal stenosis. Eur Spine J. (2015) : 24: : 2276-80. doi: 10.1007/s00586-014-3475-8. |
[10] | Murley GS, Buldt AK, Trump PJ, Wickham JB. Tibialis is posterior EMG activity during barefoot walking in people with neutral foot posture. J Electromyogr Kinesiol. (2009) ; 19: : 69-77. doi: 10.1016/j.jelekin.2007.10.002. |
[11] | Pitt MC. Nerve conduction studies and needle EMG in very small children. Eur J Paediatr Neurol. (2012) ; 16: : 285-91. doi: 10.1016/j.ejpn.2011.07.014. |
[12] | Nolan CM, Hashisaki PA, Dundas DF. An outbreak of soft-tissue infections due to Mycobacterium fortuitum associated with electromyography. J Infect Dis. (1991) ; 163: : 1150-3. doi: 10.1093/infdis/163.5.1150. |
[13] | Farina D, Gazzoni M, Merletti R. Assessment of low back muscle fatigue by surfaceEMG signal analysis: methodological aspects. J Electromyogr Kinesiol. (2003) ; 13: : 319-32. doi: 10.1016/S1050-6411(03)00040-3. |
[14] | Frigo C, Crenna P. Multichannel SEMG in clinical gait analysis: a reviewandstate-of-the-art. ClinBiomech (Bristol, Avon). (2009) ; 24: : 236-45. doi: 10.1016/j.clinbiomech.2008.07.012. |
[15] | Barr K. Electrodiagnosis of lumbar radiculopathy. Phys Med Rehabil Clin N Am. (2013) ; 24: (1): 79-91. doi: 10.1016/j.pmr.2012.08.011. |
[16] | Wang Y, Nataraj A. Foot drop resulting from degenerative lumbar spinal diseases: clinical characteristics and prognosis. Clin Neurol Neurosurg. (2014) ; 117: (2): 33-39. doi: 10.1016/j.clineuro.2013.11.018. |
[17] | Merletti R, Botter A, Troiano A, Merlo E, Minetto MA. Technology and instrumentationfor detection and conditioning of the surface electromyocurveic signal: state of the art. ClinBiomech (Bristol, Avon). (2009) ; 24: : 122-34. doi: 10.1016/j.clinbiomech.2008.08.006. |
[18] | Gabel RH, Brand RA. The effects of signal conditioning on the statistical analyses ofgait EMG. Electroencephalogr Clin Neurophysiol. (1994) ; 93: : 188-201. doi: 10.1016/0168-5597(94)90040-X. |
[19] | Heydari A, Nargol AV, Jones AP, Humphrey AR, Greenough CG. EMG analysis of lumbar paraspinal muscles as a predictor of the risk of low-back pain. Eur Spine J. (2010) ; 19: : 1145-52. doi: 10.1007/s00586-010-1277-1. |
[20] | Malone A, Meldrum D, Gleeson J, Bolger C. Reliability of surface electromyographytiming parameters in gait in cervical spondylotic myelopathy. J Electromyogr Kinesiol. (2011) ; 21: : 1004-10. doi: 10.1016/j.jelekin.2011.09.003. |
[21] | Malone A, Meldrum D, Gleeson J, Bolger C. Electromyocurveic characteristics of gaitimpairment in cervical spondylotic myelopathy. Eur Spine J. (2013) ; 22: : 2538-44. doi: 10.1007/s00586-013-2928-9. |
[22] | Malone A, Meldrum D, Bolger C. Three-dimensional gait analysis outcomes at 1 year following decompressive surgery for cervical spondylotic myelopathy. Eur Spine J. (2015) ; 24: : 48-56. doi: 10.1007/s00586-014-3267-1. |
[23] | Ronager J, Christensen H, Fuglsang-Frederiksen A. Power spectrum analysis of the EMGpattern in normal and diseased muscles. J Neurol Sci. (1989) ; 94: : 283-94. doi: 10.1016/0022-510X(89)90237-2. |
[24] | Dedering Å. Lumbar muscle fatigue and subjective health measurements in patients with lumbar disc herniation 2 years after surgery. Eur Spine J. (2012) ; 21: : 646-54. doi: 10.1007/s00586-011-2109-7. |
[25] | Supuk TG, Skelin AK, Cic M. Design, development and testing of a low-cost SEMG system and its use in recording muscle activity in humangait. Sensors (Basel). (2014) ; 14: : 8235-58. doi: 10.3390/s140508235. |
[26] | Djordjevic O, Konstantinovic L, Miljkovic N, Bijelic G. Relationship between electromyocurveic signal amplitude and thickness change of the trunk muscles in patients with and without low back pain. Clin J Pain. (2015) ; 31: : 893-902. doi: 10.1097/AJP.0000000000000179. |
[27] | Boccia G, Dardanello D, Rosso V, Pizzigalli L, Rainoldi A. The application of SEMG in aging: a mini review. Gerontology. (2015) ; 61: : 477-84. doi: 10.1159/000368655. |
[28] | González-Izal M, Malanda A, Gorostiaga E, Izquierdo M. Electromyocurveic models to assess muscle fatigue. J Electromyogr Kinesiol. (2012) ; 22: : 501-12. doi: 10.1016/j.jelekin.. |
[29] | Mononen ME, Jurvelin JS, Korhonen RK. Implementation of a gait cycle loading intohealthy and meniscectomised knee joint models with fibril-reinforced articular cartilage. Comput Methods Biomech Biomed Engin. (2015) ; 18: : 141-52. doi: 10.1080/10255842.2013.783575. |
[30] | Jung Y, Jung M, Lee K, Koo S. Ground reaction force estimation using an insole-type pressure mat and joint kinematics during walking. J Biomech. (2014) ; 47: : 2693-9. doi: 10.1016/j.jbiomech.2014.05.007. |
[31] | Rainville J, Childs LA, Pena EB, Suri P, Limke JC, Jouve C, et al. Quantification of walking abilityin subjects with neurogenic claudication from lumbar spinal stenosis – a comparative study. Spine J. (2012) ; 12: : 101-9. doi: 10.1016/j.spinee.2011.12.006. |
[32] | Conrad BP, Shokat MS, Abbasi AZ, Vincent HK, Seay A, Kennedy DJ. Associationsof self-report measures with gait, range of motion and proprioception in patients with lumbar spinal stenosis. Gait Posture. (2013) ; 38: : 987-92. doi: 10.1016/j.gaitpost.2013.05.010. |


