
A model-based simulator for smart homes: Enabling reproducibility and standardization
Abstract
Scientific contributions in the area of smart environments cover different tasks of ambient intelligence including action and activity recognition, anomaly detection, and automated enactment. Algorithms solving these tasks need to be validated against sensor logs of smart environments. In order to acquire these datasets, expensive facilities are needed, containing sensors, actuators and an acquisition infrastructure. Even though several freely accessible datasets are available, each of them features a very specific set of sensors, which can limit the introduction of novel approaches that could benefit of particular types of sensors and deployment layouts. Additionally, acquiring a dataset requires a considerable human effort for labeling purposes, thus further limiting the creation of new and general ones. In this paper, we propose a model-based simulator capable to generate synthetic datasets that emulate the characteristics of the vast majority of real datasets while granting trustworthy evaluation results. The datasets are generated using the eXtensible Event Stream – XES international standard commonly used for representing event logs. Finally, the datasets produced by the simulator are validated against two real scenario’s logs from the literature.
1.Introduction
Smart environments connect computing devices and other smart devices to everyday settings and tasks. In particular, Cook and Das [12] define a smart environment as “a small world where different kinds of smart devices are continuously working to make inhabitants’ lives more comfortable”. Smart environments aim to satisfy the experience of individuals and to improve their lives [7], by replacing the hazardous work, physical labor, and repetitive tasks with automated agents. Examples include smart homes, smart cities and smart factories (the terms smart manufacturing and Industry 4.0 are often used in Europe).
The traditional features of a smart environment are (i) remote control of devices, (ii) the devices’ communication, using a middleware, and wireless communication to create the connected environment, (iii) information acquisition/dissemination from sensor network, (iv) daily life enhancement through smart devices, and (v) predictive and decision-making capabilities.
In particular, the interest in smart spaces has increased in the previous years thanks to the introductions of devices, such as the Google Nest thermostat, which are able, thanks to artificial intelligence techniques to learn human preferences and to use them to anticipate user needs, proactively making decisions on actions to take on the environment (e.g., increasing or lowering the house temperature).
Scientific contributions in the area of smart environments cover different tasks of ambient intelligence including action and activity recognition, anomaly detection and automated enactment. Algorithms solving these tasks need to be validated against sensor logs of smart environments. In order to acquire these datasets, expensive facilities are needed, containing sensors, actuators and an acquisition infrastructure. In addition, frequently employed smart home hubs (e.g., voice assistants like Amazon Echo Dot) do not allow accessing raw data.
Even though several freely accessible datasets are available, each of them features a very specific set of sensors, which can limit the introduction of novel approaches that could benefit of particular types of sensors and deployment layouts. Additionally, acquiring a dataset requires a considerable human effort for labeling purposes, thus further limiting the creation of new and general ones. Also, labeling is an error prone activity, which makes the quality of the available datasets unclear. As a consequence, the vast majority of approaches available in the literature are evaluated against datasets gathered in university labs; datasets that are not general and/or whose quality cannot be taken for granted.
For this reason, smart environments are one of the many disciplines where we are witnessing the replication crisis (or replicability crisis or reproducibility crisis), i.e., an ongoing methodological crisis in which it has been found that many scientific studies are difficult or impossible to replicate or reproduce [24,44].
Even if the crisis is more evident in social sciences, the inability to replicate the studies of others has important impacts also in the smart environments area. In order to advance in this area, researchers need open datasets as without them, developed techniques can neither be compared nor validated in a reproducible way, which hinders the innovation in the area. Without comparable and proved techniques, practitioners, industries and users will not be confident in large investments and deployments, thus in turn not increasing the number of testbed and living labs and datasets: a dramatic spiral that hinders the whole research community.
In addition to the above mentioned aspects, a recent research trend [27] focuses on the possibility to analyze smart environments in terms of the ongoing processes by relying on the Internet-of-Things – IoT. A (business) process is a collection of related, structured activities or tasks by people or equipment with a specific goal. A Cyber-Physical System CPS [34] integrates computation with physical processes, i.e., business process where vast majority of tasks happen in the physical world. As such, modern smart spaces can be considered examples of CPSs, where human routines are the processes of interest. In CPS, embedded computers and networks monitor and control the physical processes, usually with feedback loops where physical processes affect computations and vice versa. Physical processes in smart spaces are called Activities of Daily Living – ADLs. ADLs are anyway usually employed as high level labels, without considering inner details. In order to fully support CPSs, datasets must be labeled not only for higher-level processes (e.g., human activities of daily living), but also for fine-grained actions (e.g., opening a door).
In order to tackle the above challenges, we present a model-based simulator able to generate synthetic datasets using the eXtensible Event Stream – XES international standard format and containing all the necessary labels. The simulator is based on human activity models, and is able to emulate the characteristics of the vast majority of real datasets while granting trustworthy evaluation results. Such datasets can be employed to propose, for instance, challenges organised in conferences and workshops, to produce fair comparisons between different approaches, and/or to replicate the features of already available datasets and extend them.
The rationale between this effort is that while the evaluation of algorithms in smart spaces through real datasets still remain important, the possibility to easily create custom datasets by fine tuning a virtual space and available sensors, could greatly improve the evaluation of proposed algorithms. In particular, thanks to the proposed simulator, it will be possible to evaluate the performance of algorithms depending on the availability and distribution in space of sensors and actuators. Also, this simulator could be employed as a design tool for smart spaces targeted at improving the performance of already available algorithms.
In order to assess the simulator, we evaluate the quality of the datasets that it can generate, in terms of how good they can emulate reality, in comparison with two real scenario state-of-the-art datasets.
The paper is organized as follows. Section 2 introduces the reader to the field, describing available datasets and concepts referred throughout the text. Section 3 describes the proposed simulator and the output’s data format. Section 4 evaluates the quality of the datasets produced by the simulator. Section 5 compares our simulator to other similar tools available in literature. Finally, Section 6 concludes the paper with discussion and future works.
2.Background
Authors in the field of smart spaces sometimes use as synonyms a variety of terms to refer to the state of the environment and the tasks humans perform in it. To avoid misunderstandings, we use the following terminology as introduced in [38,46]:
– Action. Atomic interaction with the environment or a part of it (e.g., a device), either performed by human inhabitants or by devices. Recognizing actions can be easy or difficult depending on the sensors installed. In some cases, methods to recognize activities and habits skip the action recognition phase, only using the raw measurements in the sensor log.
– Activity. A sequence of actions or sensor events with a final goal (e.g., the sequence composed by the following actions: washing the dishes, cleaning the sink, cleaning kitchen’s closets which together compose the activity cleaning the kitchen). In extreme cases an action can be an activity itself (e.g., ironing). Activities can be collaborative, including actions by multiple users and can interleave one each other. The granularity (i.e., the temporal extension and complexity) of considered activities cannot be precisely specified.
– Habit. A sequence or interleaving of activities that happen in specific contextual conditions (e.g., what a human inhabitant does every morning between 08:00 and 10:00).
In the following of this paper, we will focus on using models of activities expressed using the behavior pattern modeling formalism described later in this section.
2.1.Available smart space datasets
As this paper proposes a simulator which produces in output synthetic datasets that can be used as a benchmark for algorithms in smart spaces, it is useful to analyze in detail what datasets are available in literature and which are the common limitations that make this simulator and its output helpful to the community.
Table 1
List of available smart space datasets. Links verified as of 2023-01-05
| Project | Dataset | Type | Sensors | Values | Inhabitants | Activities | Labels | Length | Notes |
| [40]a | 1 | Stream | 3 PIR, 4 door, 1 flush, 2 pressure, 2 electric | Discrete | 1 | 10 | Yes | 14 days | |
| 2 | Stream | 5 PIR, 3 magnetic, 1 flush, 2 pressure, 1 electric | Discrete | 1 | 10 | Yes | 21 days | ||
| [49]b | 1 | Summary | 77 activation/deactivation or opening/closing | Discrete | 1 | 13 | Yes | 16 days | |
| 2 | Summary | 84 activation/deactivation or opening/closing | Discrete | 1 | 9 | Yes | 16 days | ||
| ARAS [1]c | Snapshot | 6 photocells, 3 force, 3 contact, 6 distance, 1 IR, 1 temperature | Discrete | 2 | 27 | Yes | 30 days | Two independent datasets from two different houses | |
| HIS [25]d | Stream | 6 PIR, 5 door, 1 temperature, 6 microphones, 5 cameras, armpit accelerometers for each person | Mixed | 10 | 7 | Yes | – | Controlled experiment | |
| Opportunity [43]e | Stream | IMUs and accelerometer attached to subjects (3 each), objects and devices | Real | 4 | 9 | Yes | – | Controlled experiment | |
| [51]f | Stream | 14 switch sensors attached to devices and doors | Discrete | 1 | 7 | Yes | 30 days | ||
| MAVPAD [55]g | Stream | 97 different sensors including PIR sensors, switch sensors, temperature sensors | Mostly discrete | – | – | No | 48 days | ||
| [3]h | Stream | Smartphone accelerometers | Real | 30 | 6 | Yes | – | Controlled experiment | |
| Orange4Home [17]i | Stream | More than 200 different device and environmental sensors | Mixed | 1 | 7 | Yes | 28 days | Controlled experiment | |
| CASAS [13,47]j | 17 aruba | Stream | 30 PIR, 4 door switches, 3 temperature sensors | Mixed | 1 | 11 | Yes | 2 years | |
| 20 kyoto | Stream | 50 PIR plus, item, door, device and environmental sensors | Mixed | 2 | – | No | 2 years | ||
| 10 tulum | Stream | 31 PIR, 5 temperature sensors | Mixed | 2 | 16 | Yes | 2 years |
f Cf. http://ailab.wsu.edu/mavhome/research.html. Follow the “Tim van Kasteren activity recognition dataset” link.
g Cf. http://ailab.wsu.edu/mavhome/research.html. Follow the “MavPad 2005 Sensor Data” link.
j Cf. the CASAS project currently contains 66 datasets. In this Table we propose a selection of three datasets: (i) a labeled single-user dataset (Aruba), (ii) an unlabeled multi-user dataset (Kyoto) and (iii) a labeled multi-user dataset (Tulum). The complete list of available logs can be found at http://casas.wsu.edu/datasets/.
Table 1 reports essential information about state-of-the-art datasets widely employed by the smart space community. In particular, for each dataset in the Project and Dataset columns (with a citation and/or a symbolic name), the following features are represented:
– Type. Sensor values can be represented in the dataset in different ways, which usually reflect the input expected by the algorithm they were introduced for. Most commonly, sensor values are represented in the form of a stream, i.e., of a temporally ordered sequence of measurements, where each row contains a timestamp (optional), an originating sensor, a value, and a set of markers (optional). In other cases, such values are reported as snapshots of the environment, i.e., the state of sensors is sampled, usually with a fixed period, reporting for each sensor the last value or a set of aggregated measures (e.g., the mean) over the values during the period. A last example is represented by datasets where for each execution of an activity, a summary of sensor measurements is reported. This last case can be seen as a special case of snapshot datasets where the period coincides with the execution time of an activity.
– Sensors. Each dataset usually contains a set of sensors that can be roughly divided between those providing information about the environment (e.g., temperature sensors, humidity sensors and light detectors), and those providing direct information about human behaviour (e.g., a smart watch recording the number of heartbeats per minute). Nonetheless, environmental sensors may provide indirect information about humans (e.g., an increasing temperature measurement in the bathroom can be the result of a human having a shower) and vice versa. Another classification distinguishes body-worn sensors (e.g., a smart watch) and environmental attached sensors. Information obtained by sensors is always affected by a certain degree of uncertainty and imprecision due to noise and intrinsic features of the sensor [9] (e.g., a presence infrared sensor provide information about the position of a human but not information about which action the human is performing, with the exception of what can be inferred by the position of the sensor).
– Values. Values provided by sensors can be either discrete (e.g., ON-OFF sensors) or continuous (e.g., temperature sensors).
– Inhabitants. The number of inhabitants involved in the dataset acquisition process can have a profound impact on tasks usually performed in a smart house. As an example, when sensors do not directly allow to recognize which inhabitant is responsible for triggering a specific sensor event, activity recognition can be very complex. This being said, models trained with datasets involving multiple users can be more generic and robust. An important aspect is whether the users are present in the smart space at the same time or in separate sessions, and in the first case how they can be identified.
– Activities. The number of different activities that the dataset captures.
– Labeling. In most datasets, participants are required to perform, or to label, a certain set of activities. Having labeled activities allows to create specific models to perform activity-specific tasks such as recognition and prediction. Activities can be performed by single users or collaboratively by multiple users. Labels usually refer to what activity/ies is/are performed in a specific time range and are applied (i) by researchers in case of controlled experiments (i.e., experiments where participants are asked to perform specific tasks), or (ii) by participants through specific labeling tools. In the latter case, while on the one hand acquired data are more realistic, on the other hand labeling can be imprecise. When multiple users participate in the experiment, usually labeling comprises the specific inhabitant responsible for each sensor event.
– Length. The size of a dataset in terms of days of acquisition, influence the robustness of extracted models or the validity of performance evaluation.
The simulator proposed in this paper allows to generate datasets combining any of the above features.
2.2.Business process management and process mining for smart spaces
A business process is a set of interrelated tasks performed in a company in order to conduct specific functions (e.g., ordering goods). The goal of Business Process Management – BPM [22] is to document, enact and analyze business processes. In particular, BPM offers a wide range of graphical formalisms to describe temporal and logical relationships between tasks in a business process, the data manipulated during the process execution, and the involved resources.
A business process leaves traces of its execution in the form of logs. In the last decade a strong research community arose around the possibility of applying data mining and machine learning to those logs. The term process mining is used to refer to such techniques.
Three types of process mining are usually identified. The first type of process mining is defined as discovery. A discovery technique takes an event log and produces a model without using any a-priori information. The second type of process mining is called conformance. Here, an existing process model is compared with an event log of the same process. Conformance checking can be used to check if reality, as recorded in the log, conforms to the model and vice versa. The third type of process mining is defined as enhancement. Here, the idea is to extend or improve an existing process model using information about the actual process recorded in some event log.
In the recent years, researchers investigated the possibility of applying BPM and Process Mining to the IoT field [27,36] and underlying processes. Smart homes can be considered an application scenario of IoT and smart home management systems are typical examples of CPSs. Here, processes are human routines, defined as activities and habits at the beginning of this section. The application of BPM and process mining to smart homes requires to face many challenges [37] including the fact that human processes are potentially very context dependent (falling in the category of so called artful processes [11]), and the mismatch between sensor logs obtained from smart homes, and event logs usually employed in BPM. In particular, event logs are usually much more coarse grained than sensor logs rather resembling what we called actions at the beginning of the section. Nonetheless, this kind of approach has been fruitfully employed in smart homes [6,21,32,50,52].
Let us now consider possible employments of the mentioned techniques in a smart home scenario. In first place, models of human habits and activities can be used for prediction and enactment. By following a human through a routine, the next or the future actions can be predicted, automatically enacting them if they can be inferred with a certain confidence and if they are safe. In second place, models of human habits can be automatically discovered (process discovery) from logs instead of manually defining them, as manual definition is usually a hard task. In third place, models can be compared at runtime with the actual behavior stored in the logs (conformance checking) in order to detect potentially harmful deviations and raising alarms.
As a last point, deviations from the model can be used to automatically update processes through process enhancement.
In this paper, BPM models are used mainly as a simulation storyboard. From the above considerations though, it is evident how producing datasets similar to those available for BPM and process mining can benefit the entire smart space community, adding new research possibilities while allowing for the application of classical approaches, as witnessed by the evaluation section.
2.3.Behavior pattern models
Each BPM formalism is best suited for certain categories of processes, supporting specific process features (e.g., the need to represent exceptional or undocumented behavior). As a consequence, human processes in smart spaces may require specific formalisms. In particular, authors in [45,46] introduce a specific BPM formalisms, extending the Hierarchical Task Analysis – HTA meta-model [4], that we will denote as context-adaptive behavior pattern modeling formalism or simply behavior pattern modeling formalism in the rest of paper, to deal with human processes in smart homes.
![An example of behaviour pattern taken from [45].](https://ip.ios.semcs.net:443/media/ais/2023/15-2/ais-15-2-ais220016/ais-15-ais220016-g001.jpg)
Figure 1 shows an example of a behavior pattern taken from [45]. As it can easily be seen, the task “Waking up” is hierarchically defined as the sequence of tasks “BathroomHeating.turnOn”, “Adapt Bedroom” and “ApplianceController.makeOff”, where “Adapt Bedroom” is a composite task that is in its turn refined into other tasks and so on. Tasks at the same level of the hierarchy can be instantiated according to different constraints. For example, the symbol
– A context situation, which is associated to a behaviour pattern. It indicates the set of context conditions that must be satisfied in order to execute the full set of coordinated services. It is depicted by a note associated to the root task of the hierarchy that defines the behaviour pattern. For instance, Fig. 1 presents a context-adaptive version of the “WakingUp” behaviour pattern. Its context situation indicates that the behaviour pattern should be executed every working day, at 7:30 a.m.
– Task context preconditions, which can be associated to any task of a hierarchy except the root task. They indicate that the task (and therefore also its subtasks) must be executed if and only if the task precondition is satisfied. They are defined over contextual variables and are depicted between brackets just before the task name. For instance, the system must turn the bathroom heating on only if the bathroom temperature is
– Context-dependent constraints, which can be defined to coordinate the execution of tasks that have been obtained from the temporal refinement of the same parent task. As explained earlier, constraints of this type are depicted by means of arrows between subtasks. These constraints are the following:
∗
∗
In this paper, we used HTA to represent the models that are fed as input to the proposed simulation tool. With respect to other modelling formalisms in the BPM area, HTA are more suitable to represent human activities and habits, as they easily make possible to model conditions, which are fundamental as triggers for human actions.
Noteworthy, the employment of HTA as a modelling tool for generation purposes, does not require to use the same formalisms also for analytics and process mining. In particular, HTA is well suited for prediction and conformance checking but not for discovery and enhancement.
2.4.XES – eXtensible Event Stream
Fig. 2.
Example of event log represented by using the XES formalism. This file contains a set of traces (defined through the trace tag), each one composed by a sequence of events (defined through the event tag).
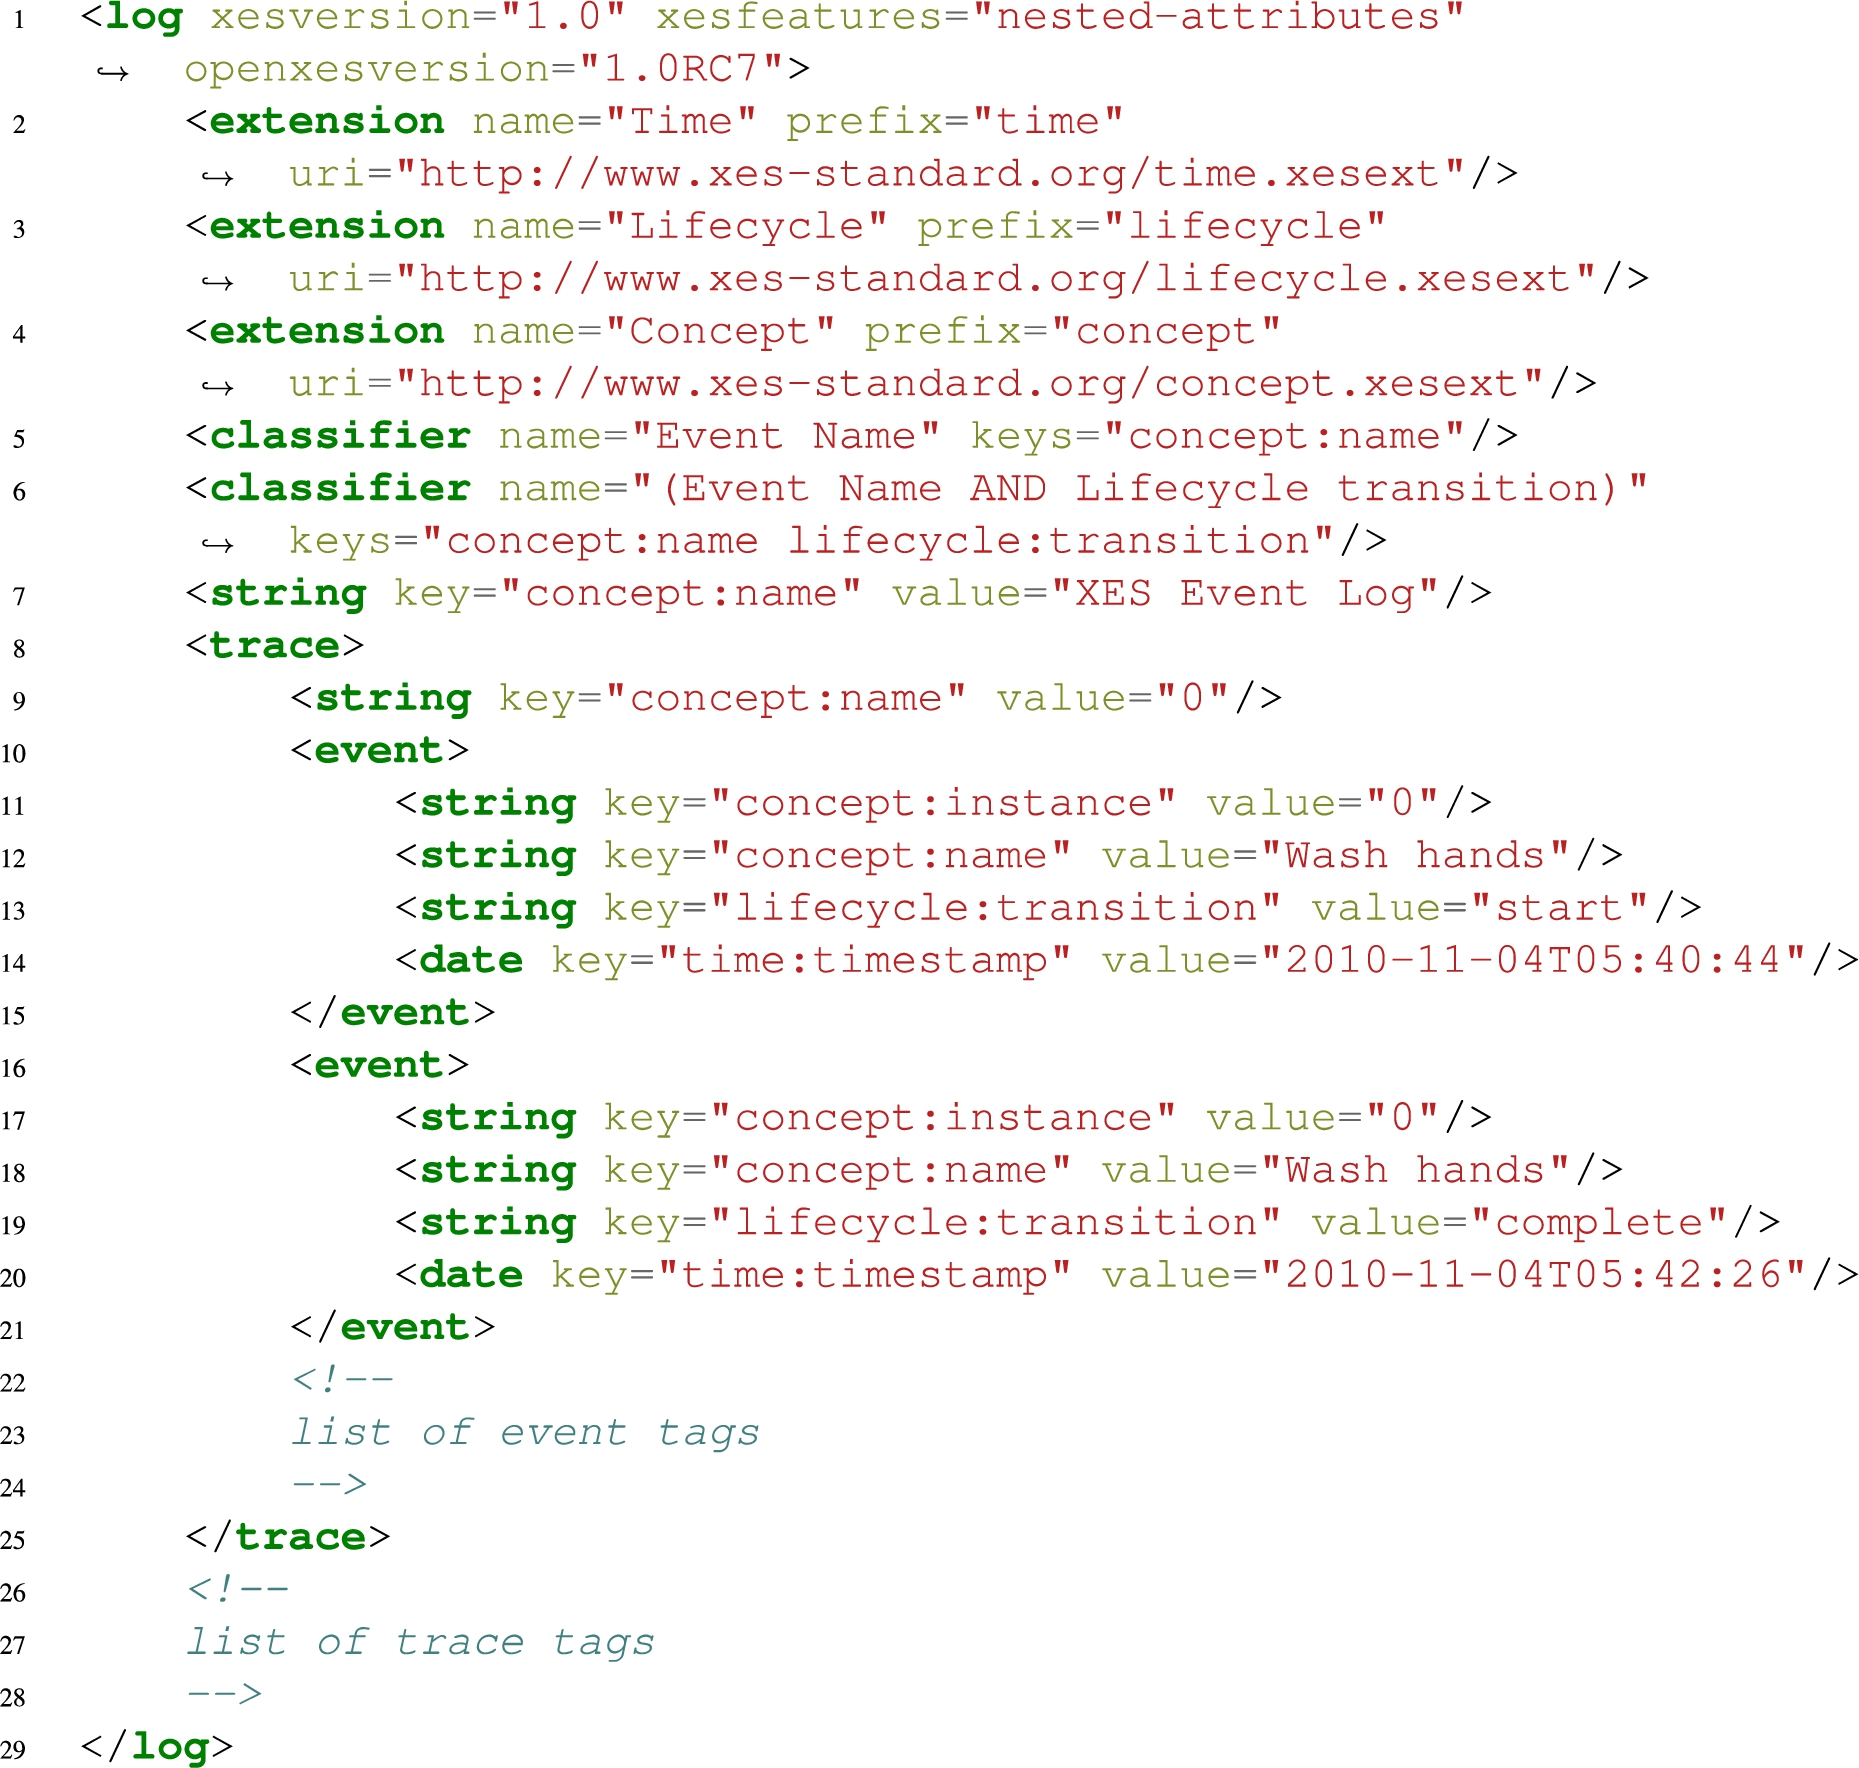
Event logs produced by BPMS are usually made available by the BPM and Process Mining community in the form of eXtensible Event Stream – XES files. XES [53] is an IEEE standard based on XML.
XES event logs are divided into traces, each representing the execution log of a specific instance of a process. Each trace contains a set of events ordered by timestamp. An identification number is assigned to each trace and each event. Attributes can be associated to logs, traces and events but XES does not prescribe a fixed set of mandatory attributes for each element (log, trace, and event); an event can have any number of attributes. However, to provide semantics for such attributes, the log refers to so-called extensions.
An XES log also defines an arbitrary number of classifiers. Each classifier is specified by a list of attributes. Any two events that have identical values with respect to these attributes are considered to be equal for that classifier. These attributes should be mandatory event attributes. For instance, if a classifier is specified by both a name and a resource attribute, then two events are mapped onto the same class if their name and resource attributes coincide. In this case, by equal events we mean actions that compose an activity that have the same name and the same life cycle. The life cycle’s attribute defines whether the event refers to the start or end of the related action (with the values start and complete respectively). In Fig. 2, an example of an XES log has been provided. In particular, the header provides information about the XES formalism and the classifiers used. The actions are defined as a sequence of event tags (e.g. wash hands) and grouped into traces. Each event provides information about the name of the action, when the action occurred and its life cycle through its attributes. In Section 3.2 is shown how a behavior pattern (like the one shown in Fig. 1) can be translated using this XES notation.
Our simulator produces logs in the XES format. The motivation for this choice is twofold. In first place, as stated in Section 1, as part of the growing trend aiming at applying BPM and process mining, we want to make datasets easily analyzable by using tools from the community, which takes as input XES files. In second place, XES is a standard for storing streaming data, which makes it particularly suitable for data coming from smart space sensors.
3.Design and realization of the simulator
The simulator proposed in this paper follows the framework described in [31], in which the authors propose a model to simulate daily activities. Section 3.1 introduces the main features of the original framework. We enriched the simulator with (i) the support for model-based simulation using context-adaptive behaviour patterns, which allow to model branches and conditions that are typical of human activities (see Section 3.2) (ii) the possibility to simulate multiple users (see Section 3.3), and (iii) the possibility to export data as XES (see Section 3.4).
3.1.Original simulation framework
The original framework is based on three main components: (i) the house model, (ii) the human model and (iii) the acting model.
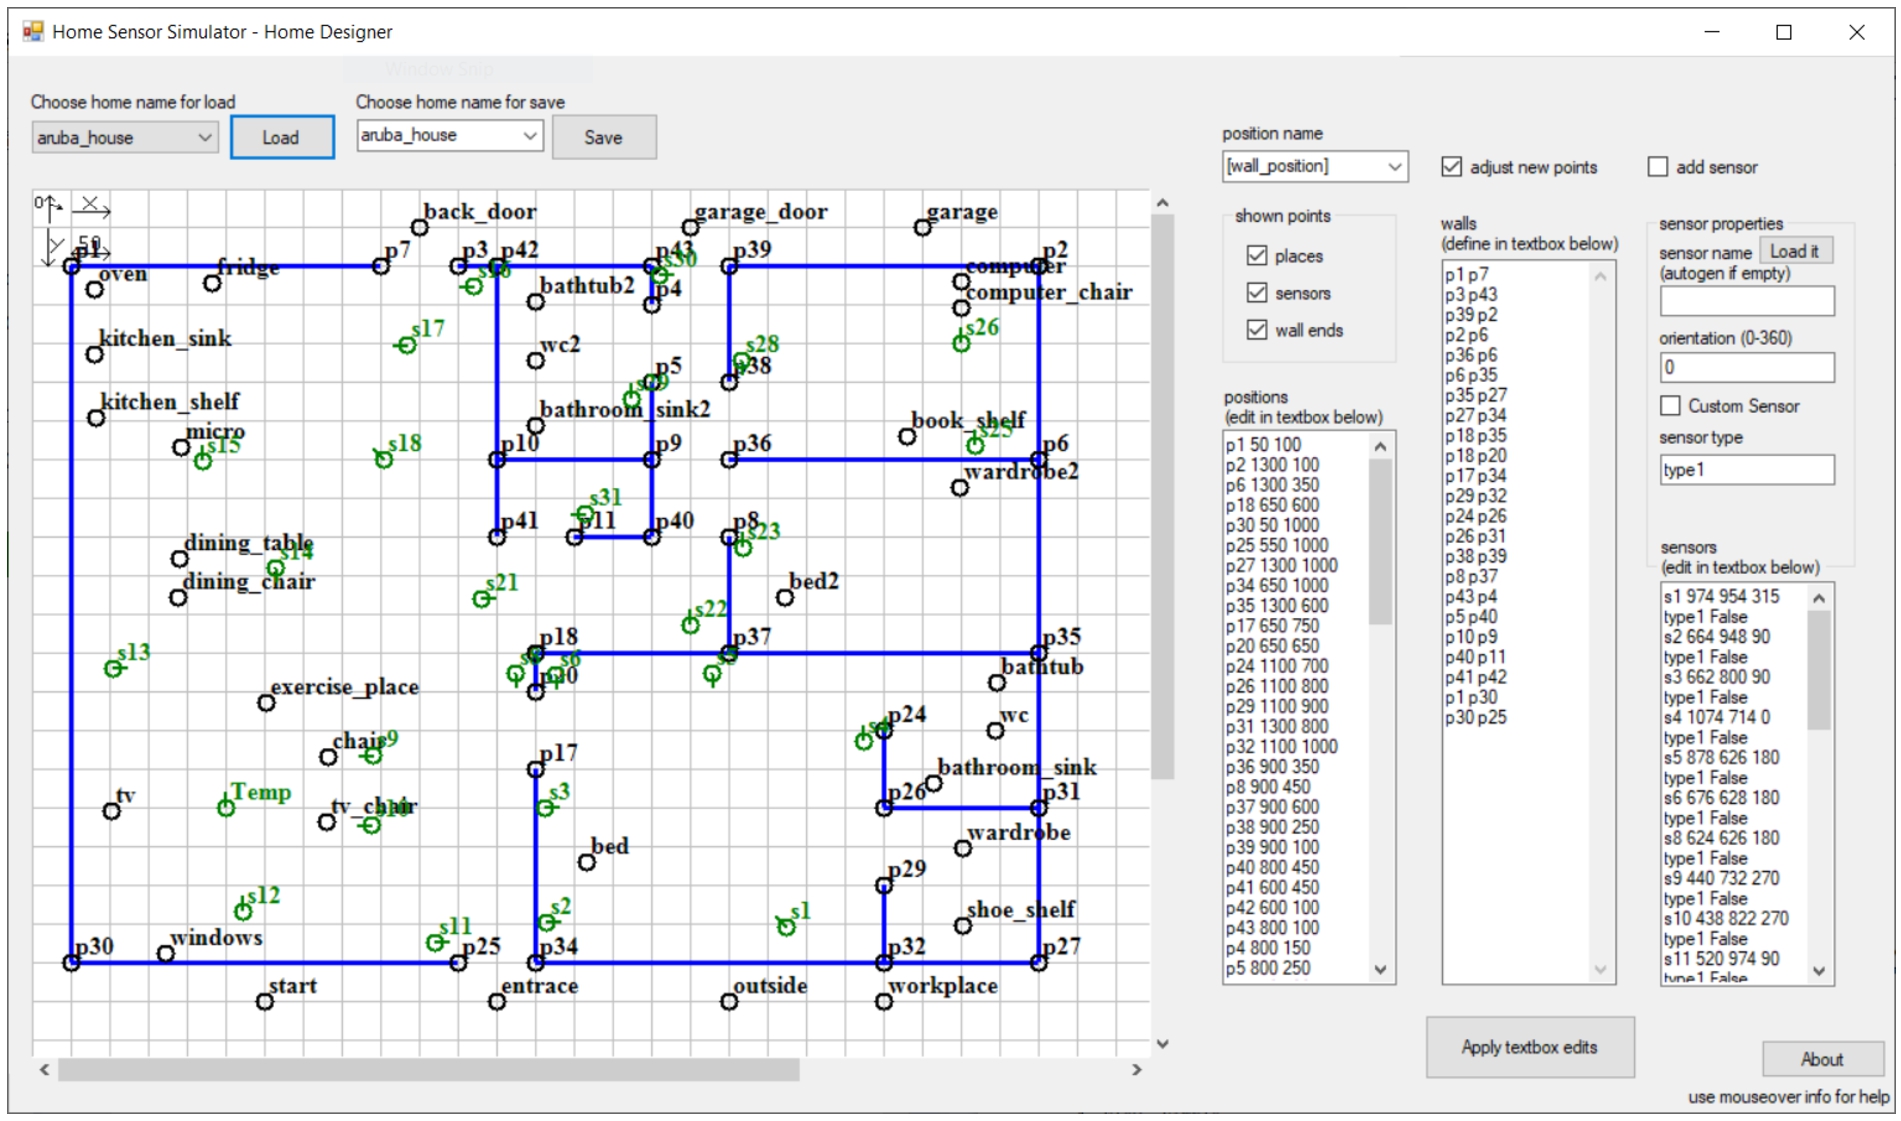
1. The house model models the environment in which the simulated inhabitant(s) live(s) (in our case, a smart house). With such model it is possible to set the layout of the house. Walls, as in a real house, delimit areas of the virtual environment, thus limiting the possible movement trajectories of simulated human inhabitants. In Fig. 3, a screenshot of the simulator’s component used to design the layout of a house model has been provided. The position of walls is considered fixed and the positions of walls and doors are therefore considered constant parameters. Next to this, variable parameters can also be defined, e.g., temperature, humidity, whether the television is on or off. In addition, several positions can be defined within the already defined layout. Positions represent all the locations with which an inhabitant may interact during the day. (e.g. the bed, the TV, the sink, the bookshelf). Finally, the positions of sensors can also be defined through this model. They are represented as a triple
2. The human model is used to simulate different inhabitants with different behavior profiles. It consists of a set of constant parameters describing the character of each inhabitant such as his/her speed, or his/her frequency at feeling different needs (e.g., tiredness, thirstiness). For instance, an inhabitant could need eight hours of sleeping, while another much less. One could drink a lot of water every day, the other consumes less. These parameters, together with environmental parameters from the house model, describe the overall state of the current situation. This information is used to control the next event to be simulated. A detailed description of how events are handled by the simulator will be given later in this section.
3. Finally, the acting model provides the mathematical definition of the simulated events (described afterwords) and it is used to simulate the monitoring of an inhabitant in his/her smart environment. Simulated motion sensors log if they detect the inhabitant. The distance from the sensor and the angle of the inhabitant relative to the sensor’s direction is also logged. The non-motion sensors (e.g., temperature, humidity, light sensors) are implemented as environmental variables, e.g., the value of the temperature. Actions and other custom functions can modify them. For instance, by opening the tap, the variable related to water consumption will be increased by this action.
Fig. 3.
A possible smart home layout that can be designed through the Home Designer tool. In particular, here we have recreated the smart environment used to extract the state-of-the-art testbed, called aruba, from the CASAS project (see Section 4.2). The original 2-dimensional map is provided by the authors of the testbed themselves.
The simulation is performed on the basis of a virtual clock, thus allowing to generate data for long periods of times with short computation time.
At each simulation step (i.e., at each tick of the virtual clock), the values assigned to the parameters (defined in the three models already discussed) are reevaluated according to custom mathematical formulas. For instance, the tiredness of an inhabitant could be expressed as a formula that increases the related value (from the human model) at every simulation step. Such value could be increased more or less quickly, depending on how the formula is defined by the final user.
The simulator supports two different kinds of events:
– main events, i.e., what we have defined as human activities in Section 2. They represent a higher level of abstraction with respect to bottom events (see below). A main event contains a sequence of actions (i.e., bottom events) to be executed. For instance, the main event describing the activity cook_and_eat (see Fig. 4) is composed by the following list of actions: go_fridge, get_ingredients_from_fridge, go_kitchen_shelf, and so on. This sequence of actions, in their entirety, compose the main event itself.
– bottom events, i.e., what we have defined as actions in Section 2. They represent a lower level of abstraction with respect to main events. They are executed by the inhabitant in the smart environment, and they influence the human and environmental variables during their execution. There is a sub-category of bottom events called movement events. Movement events are labeled with the prefix go_ and they trigger the movement of a person to a specific goal position, from the list of positions already defined in the house model.
Furthermore, all main events have an interrupt parameter. Main events can be interrupted by other main events. The original event will only resume when the interrupting one is concluded, if no other interruption happens. As happens in real life, a person could interrupt the lunch to answer an urgent call. Only when the call is finished he/she will resume eating.
Then, at every simulation step the main event with the highest value of priority (among all the main events defined in the acting model) is executed. Only a main event with higher priority can interrupt it. In this case, the interrupted main event is paused and pushed in a queue. It will be restored only after that the interrupting main event is concluded. A detailed description of how it works can be found in [31].
Fig. 4.
Example of main event describing the activity cook_and_eat. This activity is composed by a list of actions, also called bottom events. The priority of the event (see row 2) is provided by a formula taking into account the fact of being in a particular moment of the day (through the $attime built-in formula), the necessities (through the human variables @(warm_food_need) and @(hunger)) and preferences of the specific inhabitant (through the human constant @(c_f)). The interrupt value (see row 3) defines the minimum priority another main event needs to interrupt this event. Finally, at row 5, the sequence of bottom events to be generated (i.e., actions to be executed by the human inhabitant to perform the activity), is reported. Among these bottom events we have movement actions (e.g., go_fridge that are automatically translated in a movement of the inhabitant to the position named fridge) and other actions, such as use_oven that are further specified.
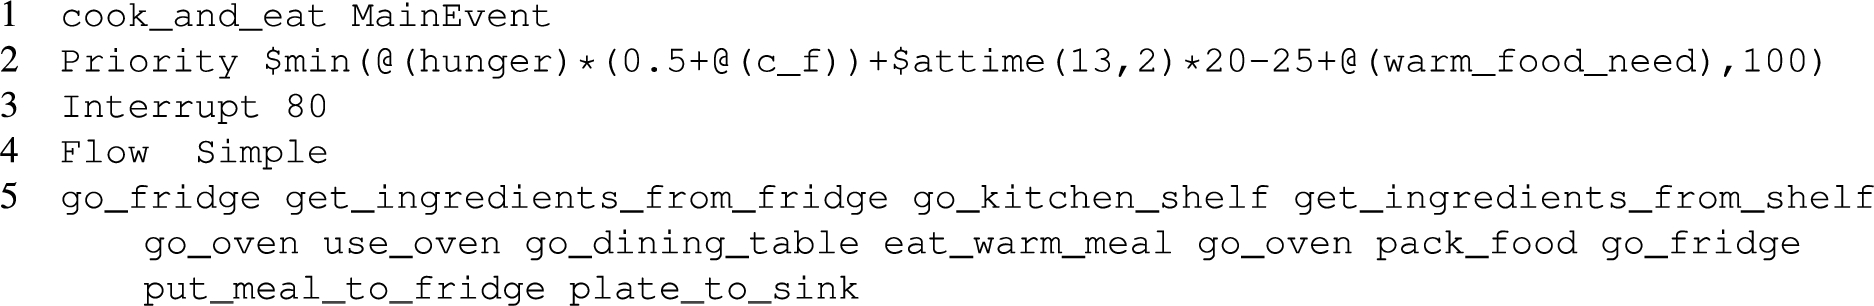
Fig. 5.
Example of bottom event describing the action use_oven. In particular, the duration of each action (in seconds) is randomly chosen in the interval Duration ± DurationDeviation (in the figure
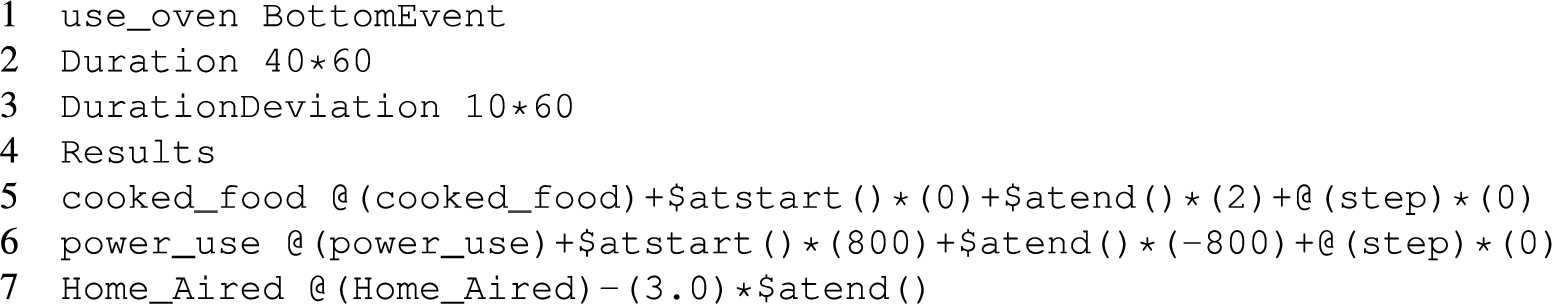
Figures 4 and 5 respectively show an example of a main event describing the activity cook_and_eat, and a bottom event describing the action use_oven.
3.2.Model-based simulation
Fig. 6.
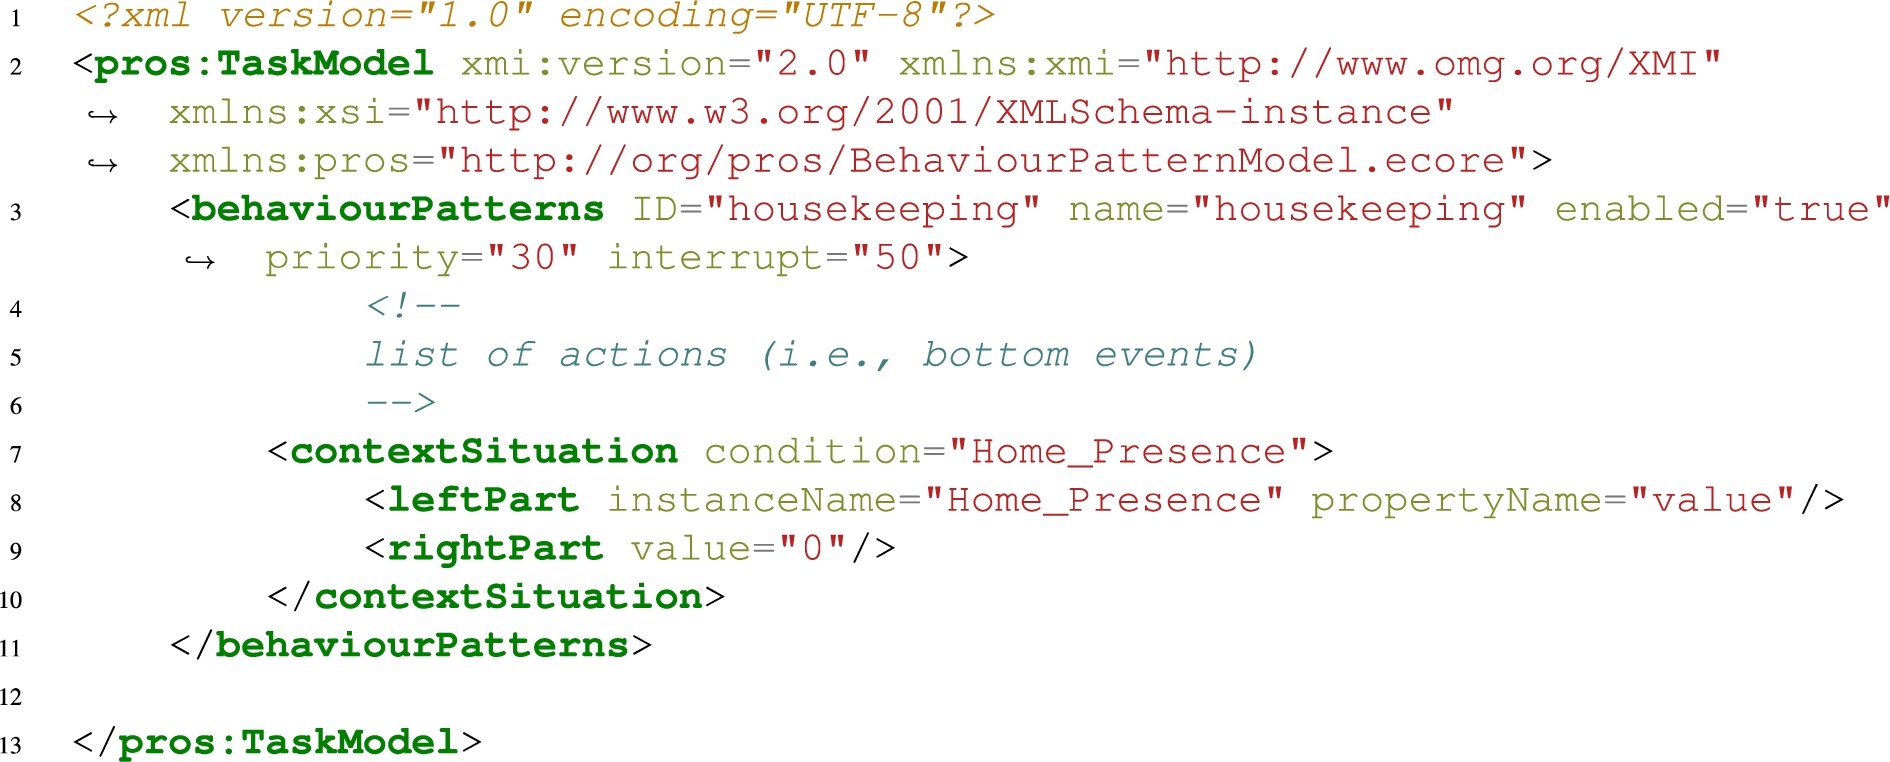
Example of task model translated by using the XML notation. The task model include a behaviourPatterns tag, which describes and models an activity (i.e., a main event), in this case housekeeping. It is composed of a list of actions (i.e., bottom events) defined through the refinements tag (see Fig. 7). In this case, there is also a contextSituation tag: the entire activity can start only if the inhabitant is at home (i.e., the Home_Presence parameter is set to 0).
As discussed, the main event construct in the original framework only allows to model activities that are unconstrained flows of events [31]. For this reason, we extended the simulator to support behaviour patterns for describing and modeling more complex activities as shown in [45,46].
Fig. 7.
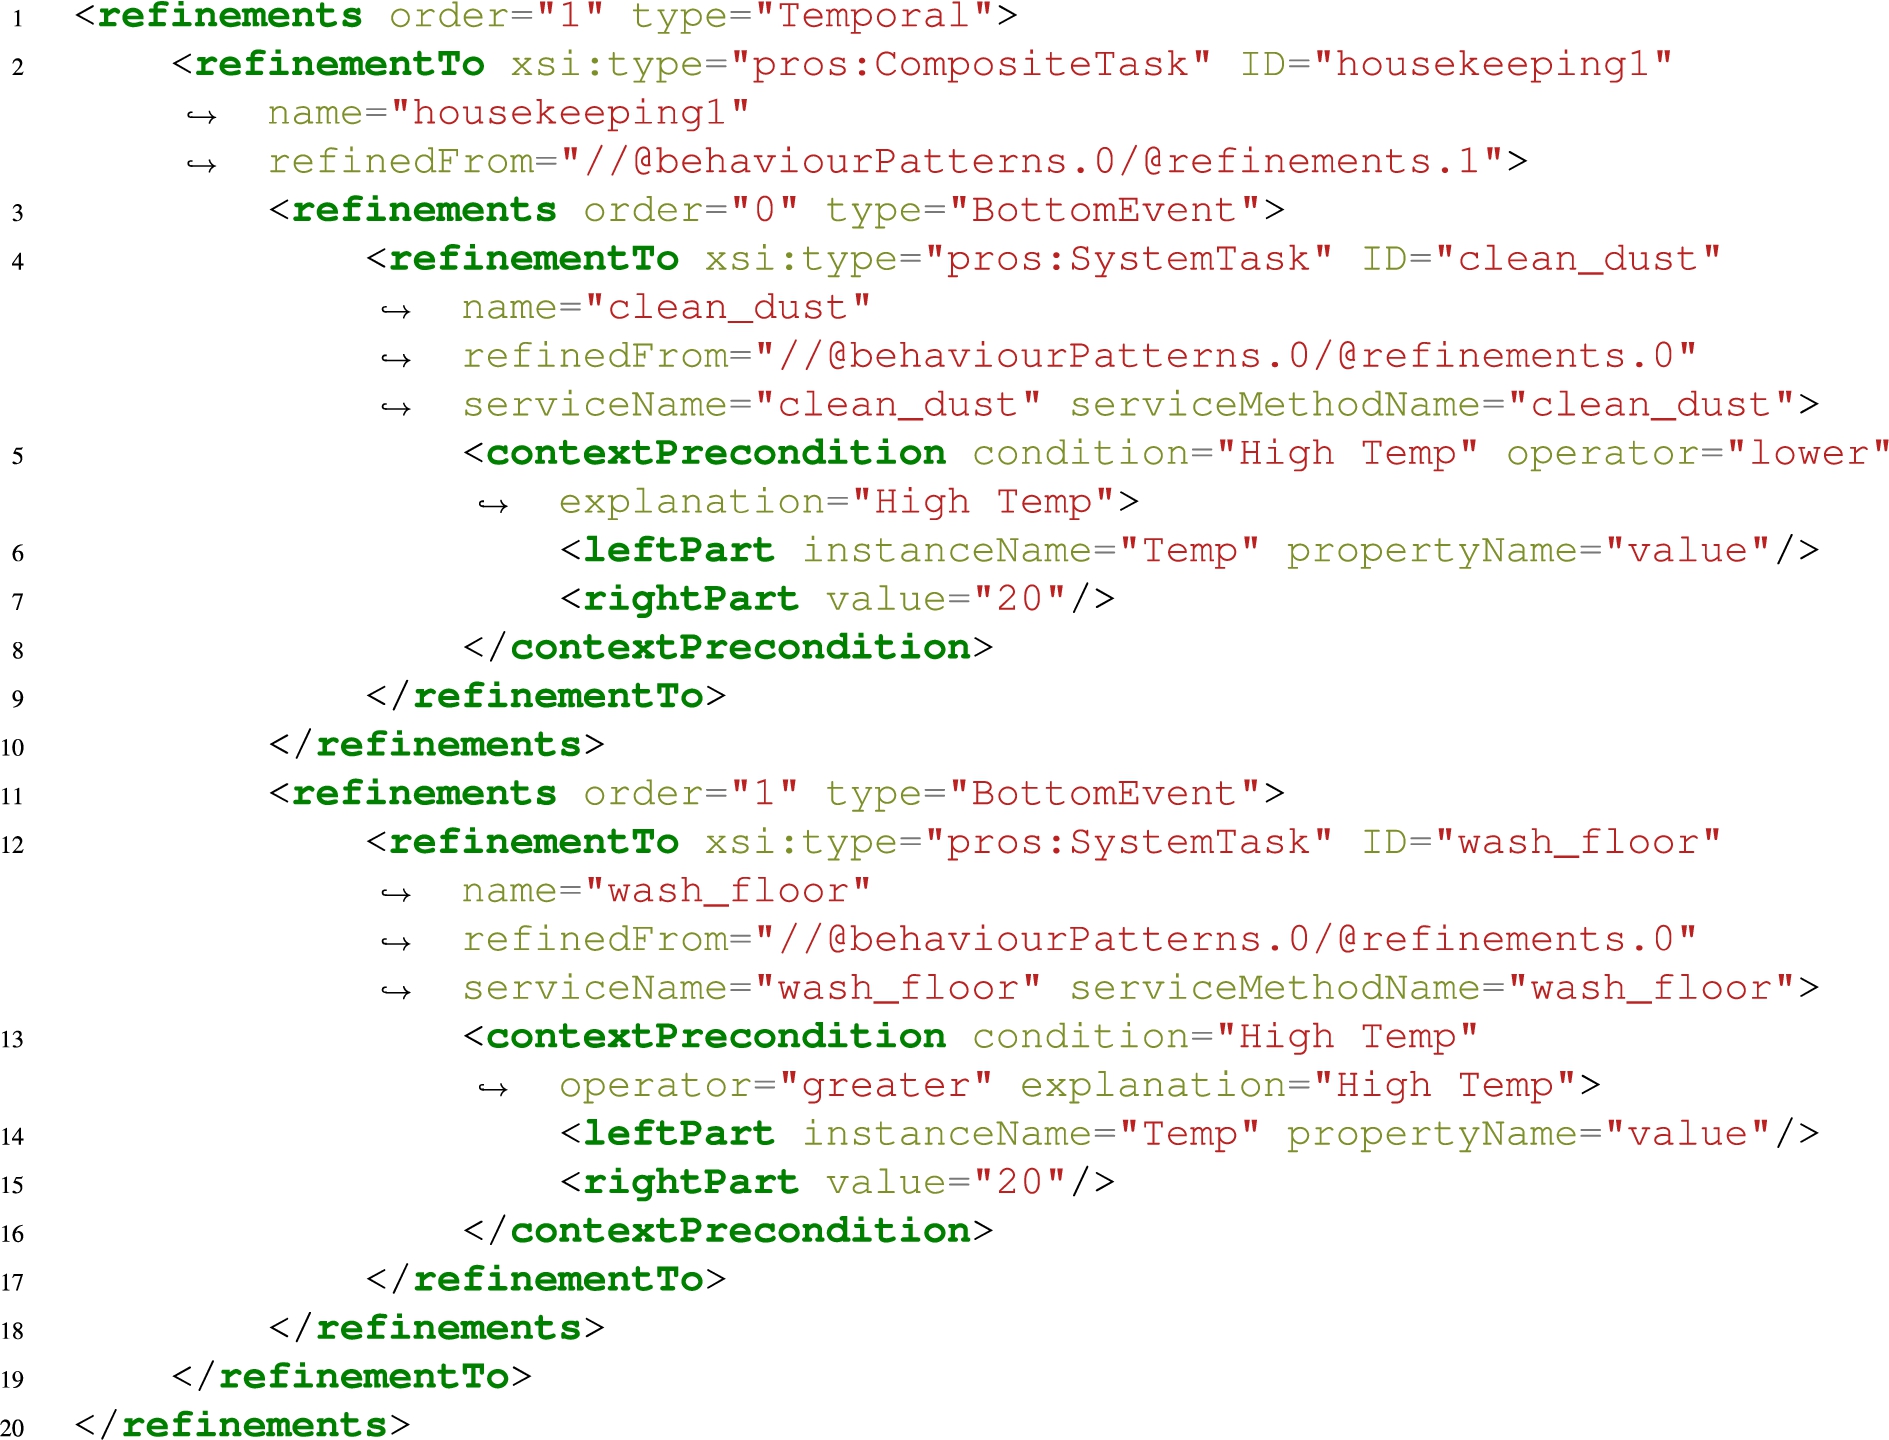
Example of CompositeTask represented using the XML notation. In this case, the task contains an exclusive branch: if the temperature registers a warm day then the BottomEvent wash_floor will be executed. Otherwise, the BottomEvent clean_dust will be performed.
Behaviour pattern introduces an XML notation (as described in [45]), which for our purposes has been extended to support some features of the simulator, such as priorities and action durations. The behaviourPatterns tag (inside the taskModel tag) models an activity. The tag has been enriched with two additional properties: priority and interrupt (see example in Fig. 6). With these parameters, the simulator, that parses the XML file, can establish when the corresponding activity can start and eventually when it can be interrupted by an other activity with highest priority.
Within the behaviourPatterns tag, a series of refinements tags are defined, which represent the set of actions of which the activity is composed. Each refinement can be enriched with a contextPrecondition, expressed as a boolean formula over simulator variables, which determine whether the related action is executed or not (e.g., if the temperature outside is greater than 20 degrees, then perform the action wash_the_floor. See example in Fig. 7).
There exist three types of refinements, identified by the type property:
– BottomEvent maps to bottom events in the original simulator, thus modeling an action performed by the smart space inhabitant which directly involves an object or a service inside the smart environment (e.g., clean_dust in Fig. 7).
– moveevent refinements model a movement action of the inhabitant to reach a specific point inside the smart house (e.g., go_computer);
– CompositeTask refinements are composed of a set of simple refinements (bottom events and/or movement events) and/or other nested composite tasks. This particular kind of refinement allows to model exclusive branches inside the action flow. Depending on the current environmental context, the simulator can make decisions about the next refinement to follow.
The refinementsTo tag contains the name of the refinement declared in the refinements father tag and is used as identifier within the simulation. Finally, each refinementTo tag may contain a temporalRelationship tag that identifies specific order restrictions among the actions of the activity modeled in task-model language. For instance, as happens in the example provided in Fig. 7, the action wash_floor is executed only if the value related to the temperature in the environment is greater than 20. Otherwise, the action clean_dust is executed.
Each behaviour pattern optionally includes a contextSituation tag containing a condition, in the form of a logical expression, which must be checked to verify whether the modeled activity can be executed or not (e.g., if it is a working day then start the work activity. See also example in Fig. 6). This tag differs from the previously introduced contextPrecondition, which refers to the conditions required to start the entire activity and not a single composing action.
3.3.Multi-inhabitant simulation
The simulator described in [31] allows to define different behavior profiles through the human model. However, it is restricted to simulate the daily activity of a single human inhabitant. In order to make the simulator capable of replicating real life scenarios, we added the possibility to instantiate more than one inhabitant in the simulated environment, each with its own human model, i.e., its own human behavioral profile.
In Section 3 we discussed how priority and interrupt parameters are handled during the simulation. That process allows to manage the sequence of simulated activities performed by a single inhabitant.
To add the possibility to simulate multiple inhabitants, within the same simulation, that process is replicated n times, where n is the number of virtual inhabitants. In this case, the simulator relies on common house and acting models (i.e., same environment and same set of available events), and several human models, in order to differentiate the behavior of each simulated inhabitant.
Each instance of this process (i.e., each simulated inhabitant), writes on a common log and is labeled with a unique identifier. As result, the simulator produces a single event log containing the interleaved series of activities performed by the n users, each with its own identifier.
3.4.Data export in XES
Data generated in the context of the simulation are stored using the XES format described in Section 2.4 (an example is shown in Fig. 2). In particular, the simulator produces as an output three different logs: a segmented event log, an unsegmented event log and a sensor log.
The segmented event log contains a different trace for each execution of an activity. Each trace includes two attributes traceId and name denoting respectively the identifier of the trace and the name of the activity performed in that trace. The presence of the name attribute represents an important difference with respect to classical process mining event logs, where traces represent different execution of the very same process. Here instead we have different execution of different activities (the equivalent of processes in process mining). Traces contain events representing the execution of actions from virtual inhabitants. For each action we can have one event, in case of immediate actions, or two events in case of actions with a duration. Each event included in a trace consists of (i) an eventId globally identifying the event, (ii) a concept:name attribute indicating the name of the action, (iii) a time:timestamp attribute indicating the occurrence time, in the virtual clock, of the event, (iv) a lifecycle:transition attribute that can assume the values start and complete denoting respectively the beginning of the action and the end (immediate events only have the complete event), and (v) a org:resource attribute indicating the identifier of the virtual inhabitant performing the action. The attributes containing a colon represent standard XES attribute identified by a name. Such a log easily allows for the application of supervised machine learning method for activity recognition and modeling as all of the occurrences of a specific activities are labeled and encapsulated in the concept of XES trace.
The unsegmented log is made up of a single trace containing a sequence of events as described for the segmented log file. As such, events coming from multiple activities and multiple users are interleaved and not labeled with the corresponding activity. This log can be used for unsupervised learning techniques where labels are either not relevant or must be automatically found. In the latter case, the ground truth can be read from the segmented log file.
Finally, the sensor log file contains sensor measurements from the environment. This XES file, as the unsegmented log contains a single trace. Each event in this trace represent a sensor measurement containing a set of attributes consisting of (i) a concept:name attribute representing the name of the sensor, (ii) a org:resource attributes whose value can be SYSTEM if the sensor measurement is from the environment or an inhabitant identifier if the sensor is inhabitant specific (e.g., the position sensor), (iii) a time:timestamp attribute indicating the triggering time of the sensor measurement in the virtual clock, (iv) an eventId attribute indicating the identifier of the event, corresponding to those used in the segmented and unsegmented log files, that influences the sensor measurement, and (v) a value attribute containing the measured value for the sensor. The sensor log can be employed when the object of the analysis is the direct recognition of activities from sensor measurements, or when the goal is to learn action models from sensor measurements.
The described logs are automatically obtained from the simulator by mapping main event repetitions to traces (which describe the execution of an activity), bottom events to events (which denote the execution of an action) and sensor measurements to virtual sensor output in the simulator as a consequence of a sensor event or of bottom events. The three log files can be integrated by means of event and trace identifiers, which allow to map sensor measurements to events and events to traces.
The simulator, with all its new features, can be downloaded at the URL in the footnote.11 The repository does not only include the executables needed to run the tool, but also a set of models including human models, house models, acting models and behaviour patterns as described in this Section. The goal of this repository is to provide a shared workspace the community can contribute to. The creation of models is indeed an expensive task, thus the availability of such a repository can speed up the definition of scenarios to produce workbenches.
4.Validation
Simulators are usually evaluated by comparing a real dataset from a smart space with a dataset generated with the simulator. Usual comparison-based approaches are:
Such comparisons are possibly accompanied by usability questionnaires [2,19]. As the simulation tool proposed in this paper is fully configurable, we do not evaluate the features of the produced dataset, which vary according to the simulation parameters. Instead, we propose a twofold evaluation. In Section 4.2, we first discuss which of the features available in free datasets are supported by our tool. In Section 4.2, we demonstrate how we can apply a seminal activity recognition algorithm to a synthetically generated datasets reproducing the features of the ones originally employed for validation, obtaining very similar results in performance evaluation, thus demonstrating how the synthetic dataset can be as good as a real one as a mean to evaluate algorithms for smart spaces. Finally, in Section 4.3 we show the results obtained in the evaluation’s phase.
4.1.Replicability of datasets available in literature
In order to assess the suitability of our tool to replicate the features of real and freely available datasets of Section 2.1, we will discuss how each of them is supported.
As a first aspect, the proposed tool produces sensor measurements in the form of stream. This is the most powerful of the sensor value representation modalities as it is always possible to turn a stream of sensor measurements into snapshots or summaries as these latter simply reduce the time granularity, whereas the opposite is in general not possible. At this moment it is not possible to directly choose the last two modalities, which require performing a simple pre-processing of data.
Concerning the types of sensors supported, our tool can be used to easily introduce any kind of environment attached sensors. It is also possible, though more difficult, to simulate body-worn sensors. Environment attached sensors can provide information about both humans and the environment itself. Sensors can produce both discrete and continuous values.
Our tool can be configured to produce a dataset containing any number of simulated inhabitants and any number of activities. Additionally, actions in datasets and sensor measurements are precisely labeled with respect to the virtual inhabitant doing/triggering them and activity performed at that time. The tool does not support collaborative activities between inhabitants that are found in some datasets (e.g., in the CASAS project repository).
The tool allows to produce datasets of any length, which is a great advantage as real-life datasets are typically rather short (i.e., activities are not performed many times, which makes it difficult for algorithms to pick up patterns in the sensor log that correspond to specific activities). However, a long real dataset may show a variability arguably higher than a synthetic dataset. Event though it is possible to artificially add noise, as argued for example in [37], the description of human activities in the form of a business process (especially using so called imperative modeling techniques, which behavior pattern formalism belongs to), cannot catch the entire freedom and variability a human has, thus producing a representation which is usually idealized.
One of the advantage of our simulator with respect to real datasets is that the dataset include both the action events and sensor measurements, which is something unprecedented, and which allows to perform analysis not only of activities but also of actions.
4.2.Truthfulness evaluation
In order to evaluate the truthfulness of the datasets produced by our simulator, and its suitability as an evaluation mean for algorithms in the smart space community, we have replicated as closely as possible two real scenario datasets from the CASAS project. The goal of this project is to treat environments as intelligent agents, where the status of the residents and their physical surroundings are perceived using sensors; on the basis of this information, a smart home can select and automate actions that meet the needs and preferences of its inhabitants, improving the comfort, the safety and/or the productivity. The reason for this choice relies on the major impact this project has had on the community and the availability as source code of algorithms that are often used as benchmarks [15,16,20,23,28,37].
Among the several ones available at the link in the footnote,22 we selected two real scenario datasets:
1. a single-user dataset, namely aruba [14]. This dataset is a partially labeled sensor log that contains data collected in a real life scenario. The inhabitant interacts with 4 temperature sensors, 31 motion sensors, and 4 door closure sensors. This dataset contains 6477 labeled activities. It includes eleven different labels: Bed_to_toilet, Eating, Enter_home, Leave_home, Housekeeping, Meal_preparation, Relax, Resperate, Sleeping, Wash_dishes and Work. We replicated the dataset by modeling a similar set of activities performed by the single inhabitant, by using the behavior pattern modeling formalism. We here only consider seven of them, skipping the infrequent ones. In addition, the Other_activity label is skipped as too generic. Additionally, we recreated the original layout of the aruba’s smart environment, provided by the authors of the testbed themselves, by using the Home Designer component of the simulator (see Fig. 3), including the same list and positioning of sensors.
2. a multi-user dataset, namely tulum [13]. This dataset is a partially labeled sensor log that contains data collected in a real life scenario by two inhabitants. The two volunteers interact with 5 temperature sensors and 31 motion sensors. This dataset contains 12637 labeled activities. It includes sixteen different labels: R1_Sleeping_in_Bed, Personal_Hygiene, Bathing, Leave_Home, Enter_Home, Meal_Preparation, Watch_TV, Eating, Bed_Toilet_Transition, R2_Sleeping_in_Bed, Work_Table, Work_Bedroom_2, Yoga, Wash_Dishes, Work_LivingRoom and Work_Bedroom_1. Labels’ prefixes R1 and R2 denote the inhabitant that performed the Sleeping_in_Bed activity. We replicated the dataset by modeling a similar set of activities performed by the two inhabitants, by using the behavior pattern modeling formalism. We here only consider eight of them, skipping the infrequent ones. In addition, the Other_activity label is skipped as too generic. Additionally, we recreated the original layout of the tulum’s smart environment, provided by the authors of the testbed themselves, by using the Home Designer component of the simulator, including the same list and positioning of sensors.
Then, we evaluated the performance of a state-of-the-art human Activity Recognition algorithm, against both the real datasets (i.e., aruba and tulum from the CASAS project) and the synthetic datasets produced by our simulator “emulating” the original ones. Such datasets produced by our simulator can be found at the link in the footnote.33
As a validation mean we chose the Activity Learning (AL) software tool from the CASAS project itself [14], which is freely downloadable from http://casas.wsu.edu/tools/. AL contains a number of activity learning components, which include activity modeling and recognition (AR), activity discovery (AD), and activity prediction (AP). In particular, among the different algorithms included in the repository we used the AR component. Such component learns models of activities from sensor data and can use these models to automatically label a sequence of sensor data with the corresponding activity. The AR algorithm is a sliding window based approach which learns models of activities from sensor data and can use these models to automatically label a sequence of sensor data with the corresponding activity. For the classification task, for learning the activity models, AR adopts Support Vector Machines (SVM). Further details are discussed in [33].
The rationale behind this choice is that this algorithm is one the most representative example of AR in literature. In addition AR is by far the most frequently tackled problem in the community.
4.3.Results
Firstly, we can notice a difference in terms of sensor activations produced by the simulation with respect to the dataset selected as testbed. The aruba dataset proposes an average of 6676 sensor activations/day, while its synthetic emulated counterpart, produced by the simulator, has an average of 202 sensor activations/day. The tulum dataset proposes an average of 8311 sensor activations/day, while its synthetic emulated counterpart, produced by the simulator, has an average of 546 sensor activations/day.
These differences can be filled artificially by tuning up the simulator. For instance, by increasing or decreasing the value related to the virtual clock, i.e, the mechanism which manages the frequency of the simulation steps over time. Low values will increase the number of sensor activations generated over time, conversely high values will decrease them. It is also possible to adjust the noise level of the produced synthetic log, further increasing or decreasing the number of sensor activations generated over time.
However, this discrepancy in terms of sensor activations/day does not imply differences in the behavior and in the quality of the synthetic datasets produced by the simulator. By running the AR algorithm, we computed the activity recognition accuracy score for each pair of datasets, the state-of-the-art dataset used as benchmark and its synthetic emulated counterpart produced by the simulator.
The aruba dataset resulted in a score of 0.994607, while its synthetic counterpart resulted in a score of 0.993711. The related confusion matrixes are shown in Tables 2 and 3. The differences in terms of numbers in such tables are due to the discrepancy of sensor activations discussed at the beginning of this section.
In a similar way, the tulum dataset resulted in an activity recognition accuracy of 0.994997, while its synthetic counterpart resulted in a score of 0.991672. The related confusion matrixes are shown in Tables 4 and 5.
This shows that the synthetic logs produced by the simulator are comparable to their state-of-the-art counterparts (aruba and tulum) used as benchmark, and therefore that the simulator is able to replicate a real behavior such as that collected in the datasets used as testbed, whether single-user or multi-user.
Table 2
The confusion matrix obtained by running the AR algorithm on the aruba dataset
| Sleeping | Relax | Work | Meal_preparation | Housekeeping | Bed_to_toilet | Wash_dishes | |
| Sleeping: | 5695 | 0 | 0 | 0 | 0 | 0 | 0 |
| Relax: | 0 | 19751 | 0 | 2 | 1 | 0 | 0 |
| Work: | 0 | 0 | 3597 | 0 | 1 | 0 | 0 |
| Meal_preparation: | 0 | 3 | 0 | 15343 | 0 | 0 | 0 |
| Housekeeping: | 0 | 5 | 1 | 1 | 5803 | 0 | 0 |
| Bed_to_toilet: | 0 | 0 | 0 | 0 | 0 | 249 | 0 |
| Wash_dishes: | 0 | 0 | 0 | 7 | 2 | 0 | 2207 |
Table 3
The confusion matrix obtained in output by running the AR algorithm on the dataset produced by the simulator “emulating” the original aruba dataset
| Sleeping | Relax | Work | Meal_preparation | Housekeeping | Bed_to_toilet | Wash_dishes | |
| Sleeping: | 267 | 0 | 0 | 0 | 1 | 0 | 0 |
| Relax: | 0 | 269 | 0 | 1 | 2 | 0 | 0 |
| Work: | 0 | 1 | 396 | 1 | 1 | 0 | 0 |
| Meal_preparation: | 0 | 0 | 0 | 673 | 1 | 0 | 0 |
| Housekeeping: | 0 | 1 | 0 | 1 | 141 | 0 | 0 |
| Bed_to_toilet: | 0 | 0 | 2 | 0 | 0 | 145 | 0 |
| Wash_dishes: | 0 | 0 | 0 | 0 | 0 | 0 | 152 |
Table 4
The confusion matrix obtained by running the AR algorithm on the tulum dataset
| R1_Sleeping | Personal_Hygiene | Bathing | Meal_Preparation | Watch_TV | Eating | R2_Sleeping | Wash_Dishes | |
| R1_Sleeping: | 4655 | 7 | 3 | 0 | 3 | 0 | 28 | 0 |
| Personal_Hygiene: | 6 | 20555 | 29 | 12 | 13 | 8 | 3 | 3 |
| Bathing: | 5 | 31 | 12855 | 1 | 3 | 2 | 1 | 1 |
| Meal_preparation: | 0 | 13 | 9 | 85121 | 44 | 99 | 1 | 8 |
| Watch_TV: | 1 | 17 | 2 | 49 | 82782 | 66 | 0 | 8 |
| Eating: | 0 | 13 | 3 | 135 | 106 | 60608 | 1 | 13 |
| R2_Sleeping: | 13 | 6 | 3 | 0 | 0 | 1 | 33597 | 0 |
| Wash_Dishes: | 1 | 4 | 0 | 20 | 16 | 20 | 0 | 7999 |
Table 5
The confusion matrix obtained in output by running the AR algorithm on the dataset produced by the simulator “emulating” the original tulum dataset
| R1_Sleeping | Personal_Hygiene | Bathing | Meal_Preparation | Watch_TV | Eating | R2_Sleeping | Wash_Dishes | |
| R1_Sleeping: | 207 | 1 | 1 | 0 | 1 | 3 | 6 | 0 |
| Personal_Hygiene: | 3 | 281 | 3 | 2 | 2 | 0 | 3 | 1 |
| Bathing: | 2 | 6 | 137 | 0 | 0 | 0 | 1 | 0 |
| Meal_preparation: | 0 | 4 | 2 | 3659 | 21 | 36 | 0 | 1 |
| Watch_TV: | 0 | 5 | 0 | 13 | 4673 | 7 | 2 | 2 |
| Eating: | 0 | 2 | 0 | 32 | 12 | 2932 | 0 | 3 |
| R2_Sleeping: | 6 | 1 | 1 | 1 | 1 | 0 | 940 | 0 |
| Wash_Dishes: | 0 | 0 | 1 | 5 | 0 | 3 | 0 | 418 |
5.Related work
We can classify the existing human dataset generation tools as follows: model-based, interactive, or hybrid.
The model-based approaches specify activity models that define the events that will be simulated and when they need to be executed [48]. For instance, PerSim [35] allows users to model contexts as state subspaces with the activities that are allowed to happen and that change the state space moving to a different context. In PerSim, activities are modelled as sequences of actions, which describe how a virtual character interacts with a set of objects and possibly changes their status. The tool provides a graphical user interface (GUI) for visualizing the activities in 3D and generates the sensor data in the Sensory Dataset Description Language. The tool is not available freely in the public domain. Veronese et al. [54] present SHARON (Simulator of Human Activities, Routines and Needs), a simulator that can generate sensor data using two different models: an agent-based model (with deterministic behavioural pattern descriptions) and a stochastic one (based on sample data activations distributions). The generator reproduces the human behaviour in terms of Activities of Daily Living (ADL) scheduling, by extracting the most suited activity based on the human needs and habits. Kamara-Esteban et al. [29] and Renoux and Klugl [42] use agent-based simulation: instead of scripting each activity independently they model the rules an agent follows to decide about its daily activities. This reduces the burden of generating several days of data. Authors in [8] proposes a method based on a specifically defined automation language to generate movement traces between a simulated environment. Also, recently, authors in [10] proposed an event based tool able to generate a dataset by learning from examples.
Interactive approaches focus on modelling the environment and environmental components instead of activities, and provide simulation software to simulate the interaction of a human inhabitant (or an avatar) with those components (typically sensors). For instance, the Intelligent Environment Simulation (IE Sim) [39] tool generates datasets that capture normal and abnormal ADLs of inhabitants. It allows the researcher to design smart homes by providing a 2D graphical top-view of the floor plan and adding different sensors to it. Using an avatar, the user can simulate ADLs. The format of the generated dataset is homeML [20]. To the knowledge of the authors, IE Sim is not publicly available. Ariani et al. [5] developed a tool to simulate the resident’s movement through a 2D model map of a smart home. The sensors located in the map respond to the movements and produce binary outputs, indicating the presence of activity in defined locations. The approach supports multi-occupant simulation. The output signals of the sensors can be saved in an XML file and then exported into an Excel spreadsheet for further analysis. It contains: start/end time, sensor ID, sensor condition, and sensor type. Park et al. [41] propose a simulator built with Unity3D (https://unity3d.com) and provide a 3D environment. The simulator can be used to generate inhabitants’ datasets for classification problems by interacting with the environment.
Each approach has its advantages and disadvantages. When generating datasets, the model-based approaches are capable of generating bigger datasets, but the granularity of captured interactions may not be as fine as the interactive approaches and it can be difficult to intuitively and accurately act on models to generate significant differences in activity completion [26,48]. On the other hand, the interactive approaches usually take a longer time and more manual effort to produce the datasets, as they usually simulate and capture the interactions in real time.
Hybrid approaches try to deal with some of these limitations by combining the ability of model-based tools to generate large datasets in a reasonable time while keeping the fine-grained interactions that are exhibited by the interactive tools.
For instance, IE Sim [39] proposes a combination of an interactive 2D avatar-based approach with a probabilistic sampling of passive infrared sensors in order to increase realism of the simulated data. The interactive approach is used to generate data resulting from the interaction of the avatar with smart objects, while the model-based approach is used to generate data resulting from passive motion sensors in a room.
Alshammari et al. [2] propose OpenSHS, where interactive generation of data for small periods of time is combined with model-based approach to aggregate these periods into full days. OpenSHS uses an interactive approach allowing the participant to simulate his/her context-specific events but they allow fast-forwarding to specify the time span of a certain activity without simulating it at real time. A replication algorithm is used to aggregate events and generate the large dataset by repeating the existing state of all devices during the specified period.
Finally, most of the available simulation tools lack the flexibility to add and customise new sensors or devices and have difficulties to support multiple inhabitant simulation.
Our simulator falls in the category of model-based approaches. At the best of our knowledge, in this category, no solution available in literature provide all of the following features: multi-inhabitant simulation, low level raw sensor measurement generation, fully configurable sensor set, definition of both continuous and discrete valued sensors, hierarchical dataset generation, process model based simulation.
6.Conclusions
In this paper, we presented a simulator for smart homes based on process models of human activities expressed using behavior patterns. In addition, we propose a common way to represent produced datasets by leveraging a standard successfully employed in the field of business process logs, i.e., the XES format.
The simulator allows to generate data for multiple independent virtual inhabitants. The proposed tool can be configured to support any of the features of freely available datasets and can be used to define challenges and benchmarks addressing different sets of sensors and environment layout and conditions. In the evaluation section, we proved that the tool was able to produce datasets with characteristics similar to those of freely available datasets, and that the produced datasets can be used to evaluate state-of-the-art techniques producing results similar to those obtained with a real dataset.
Additionally, our simulator can produce a dataset including both the sensor level and the action level, which is something unmatched in available datasets.
At the current stage, the simulator is not able to simulate collaborative activities between different inhabitants, but they are only addressed by a very limited number of works in the scientific literature.
In addition, the simulator is only able to model sensors attached to the environment as the modeling cost of body-worn sensors is too high. This can be considered a minor limitation, as these latter are mainly employed to recognize particular human movements (e.g., falling) and replicating experiments is relatively simple with respect to those requiring a whole environment.
While modeling human activities using behavior patterns is simple and immediate, modeling sensors and devices inside the simulator may not be straightforward. One of our aims is to promote the employment of the simulator public repository in the community as a facility to collaborate by proposing new models that then can be combined in order to ease the generation of freely available datasets.
Notes
Acknowledgements
The work of Silvestro Veneruso, Francesco Leotta and Massimo Mecella has been partly funded by the Sapienza project “Novel Process Mining Techniques for Discovering IoT-enhanced Business Processes” (ID RM120172B3B5EC34), by the Regione Lazio project “SivalaNet” (Det. n. G02540) and by the PNRR project 11, spoke 8 (CUP: B53C22004130001). The work of Yannis Bertrand and Estefanía Serral was supported by the Flemish Fund for Scientific Research (FWO) with grant number G0B6922N.
Conflict of interest
None to report.
References
[1] | H. Alemdar, H. Ertan, O.D. Incel and C. Ersoy, ARAS human activity datasets in multiple homes with multiple residents, in: 2013 7th Intl. Conf. on Pervasive Computing Technologies for Healthcare and Workshops, IEEE, (2013) , pp. 232–235. |
[2] | N. Alshammari, T. Alshammari, M. Sedky, J. Champion and C. Bauer, Openshs: Open smart home simulator, Sensors 17: (5) ((2017) ), 1003. doi:10.3390/s17051003. |
[3] | D. Anguita, A. Ghio, L. Oneto, X. Parra and J.L. Reyes-Ortiz, A public domain dataset for human activity recognition using smartphones, in: Esann, Vol. 3: , (2013) , p. 3. |
[4] | J. Annett, Hierarchical task analysis, in: Handbook of Cognitive Task Design, Vol. 2: , (2003) , pp. 17–35. doi:10.1201/9781410607775.ch2. |
[5] | A. Ariani, S.J. Redmond, D. Chang and N.H. Lovell, Simulation of a smart home environment, in: 2013 3rd Intl. Conf. on Instrumentation, Communications, Information Technology and Biomedical Eng. (ICICI-BME), IEEE, (2013) , pp. 27–32. |
[6] | A. Aztiria, A. Izaguirre, R. Basagoiti, J.C. Augusto and D.J. Cook, Discovering frequent sets of actions in intelligent environments, in: Intelligent Environments, (2009) , pp. 153–160. |
[7] | A. Bono-Nuez, R. Blasco, R. Casas and B. Martín-del-Brío, Ambient intelligence for quality of life assessment, Journal of Ambient Intelligence and Smart Environments 6: (1) ((2014) ), 57–70. doi:10.3233/AIS-130241. |
[8] | A. Burattin, Linac: A smart environment simulator of human activities, in: Process Mining Workshops: ICPM 2021 International Workshops, Eindhoven, The Netherlands, October 31–November 4, 2021, Revised Selected Papers, Vol. 433: , Springer Nature, (2022) , p. 60. doi:10.1007/978-3-030-98581-3_5. |
[9] | P. Castro and R. Munz, Managing context data for smart spaces, IEEE Personal Communications 7: (5) ((2000) ), 44–46. doi:10.1109/98.878537. |
[10] | A. Chio, D. Jiang, P. Gupta, G. Bouloukakis, R. Yus, S. Mehrotra and N. Venkatasubramanian, Smartspec: Customizable smart space datasets via event-driven simulations, in: 2022 IEEE International Conference on Pervasive Computing and Communications (PerCom), IEEE, (2022) , pp. 152–162. doi:10.1109/PerCom53586.2022.9762405. |
[11] | C.D. Ciccio and M. Mecella, Mining constraints for artful processes, in: International Conference on Business Information Systems, Springer, (2012) , pp. 11–23. doi:10.1007/978-3-642-30359-3_2. |
[12] | D. Cook and S. Das, Smart Environments: Technology, Protocols and Applications, Wiley-Interscience, (2005) . |
[13] | D.J. Cook, Learning setting-generalized activity models for smart spaces, IEEE intelligent systems 2010: (99) ((2010) ), 1. |
[14] | D.J. Cook, A.S. Crandall, B.L. Thomas and N.C. Krishnan, CASAS: A smart home in a box, Computer 46: (7) ((2013) ), 62–69. doi:10.1109/MC.2012.328. |
[15] | A. Crandall and D.J. Cook, Learning activity models for multiple agents in a smart space, in: Handbook of Ambient Intelligence and Smart Environments, Springer, (2010) , pp. 751–769. doi:10.1007/978-0-387-93808-0_28. |
[16] | A.S. Crandall and D.J. Cook, Coping with multiple residents in a smart environment, Journal of Ambient Intelligence and Smart Environments 1: (4) ((2009) ), 323–334. doi:10.3233/AIS-2009-0041. |
[17] | J. Cumin, G. Lefebvre, F. Ramparany and J.L. Crowley, A dataset of routine daily activities in an instrumented home, in: Intl. Conf. on Ubiquitous Computing and Ambient Intelligence, Springer, (2017) , pp. 413–425. |
[18] | J. Dahmen and D. Cook, SynSys: A synthetic data generation system for healthcare applications, Sensors 19: (5) ((2019) ), 1181. doi:10.3390/s19051181. |
[19] | M. Davies and V. Callaghan, iWorlds: Generating artificial control systems for simulated humans using virtual worlds and intelligent environments, Journal of Ambient Intelligence and Smart Environments 4: (1) ((2012) ), 5–27. doi:10.3233/AIS-2011-0129. |
[20] | E. De-La-Hoz-Franco, P. Ariza-Colpas, J.M. Quero and M. Espinilla, Sensor-based datasets for human activity recognition – A systematic review of literature, IEEE Access 6: ((2018) ), 59192–59210. doi:10.1109/ACCESS.2018.2873502. |
[21] | M. Dimaggio, F. Leotta, M. Mecella and D. Sora, Process-based habit mining: Experiments and techniques, in: 2016 Intl IEEE Conf.s on Ubiquitous Intelligence & Computing (UIC), IEEE, (2016) , pp. 145–152. |
[22] | M. Dumas, M. La Rosa, J. Mendling, H.A. Reijers et al., Fundamentals of Business Process Management, Vol. 1: , Springer, (2013) . |
[23] | L. Esposito, F. Leotta, M. Mecella and S. Veneruso, Unsupervised segmentation of smart home logs for human habit discovery, in: 2022 18th International Conference on Intelligent Environments (IE), (2022) , pp. 1–8. doi:10.1109/IE54923.2022.9826776. |
[24] | D. Fanelli, How many scientists fabricate and falsify research? A systematic review and meta-analysis of survey data, PLOS ONE 4: (5) ((2009) ). |
[25] | A. Fleury, M. Vacher and N. Noury, SVM-based multimodal classification of activities of daily living in health smart homes: Sensors, algorithms, and first experimental results, IEEE transactions on information technology in biomedicine 14: (2) ((2009) ), 274–283. doi:10.1109/TITB.2009.2037317. |
[26] | Y. Francillette, E. Boucher, A. Bouzouane and S. Gaboury, The virtual environment for rapid prototyping of the intelligent environment, Sensors 17: (11) ((2017) ), 2562. doi:10.3390/s17112562. |
[27] | C. Janiesch, A. Koschmider, M. Mecella, B. Weber, A. Burattin, C. Di Ciccio, G. Fortino, A. Gal, U. Kannengiesser, F. Leotta et al., The Internet of things meets business process management: A manifesto, IEEE Systems, Man, and Cybernetics Magazine 6: (4) ((2020) ), 34–44. |
[28] | D. Janssen, F. Mannhardt, A. Koschmider and S.J. van Zelst, Process model discovery from sensor event data, in: International Conference on Process Mining, Springer, (2020) , pp. 69–81. |
[29] | O. Kamara-Esteban, G. Azkune, A. Pijoan, C.E. Borges, A. Alonso-Vicario and D. López-de-Ipiña, MASSHA: An agent-based approach for human activity simulation in intelligent environments, Pervasive and Mobile Computing 40: ((2017) ), 279–300. doi:10.1016/j.pmcj.2017.07.007. |
[30] | E. Kim, S. Helal, J. Lee and S. Hossain, The making of a dataset for smart spaces, in: Intl. Conf. on Ubiquitous Intelligence and Computing, Springer, (2010) , pp. 110–124. |
[31] | B. Kormányos and B. Pataki, Multilevel simulation of daily activities: Why and how? in: 2013 IEEE Intl. Conf. on Computational Intelligence and Virtual Environments for Measurement Systems and Applications (CIVEMSA), IEEE, (2013) , pp. 1–6. |
[32] | A. Koschmider, D. Janssen and F. Mannhardt, Framework for process discovery from sensor data, in: 10th Intl. Workshop on Enterprise Modeling and Information Systems Architectures (EMISA), Vol. 2627: , (2020) , pp. 32–38. |
[33] | N. Krishnan and D. Cook, Activity recognition on streaming sensor data, Pervasive and mobile computing 10: ((2014) ), 138–154. doi:10.1016/j.pmcj.2012.07.003. |
[34] | E.A. Lee, Cyber physical systems: Design challenges, in: 2008 11th IEEE International Symposium on Object and Component-Oriented Real-Time Distributed Computing (ISORC), IEEE, (2008) , pp. 363–369. |
[35] | J.W. Lee, S. Cho, S. Liu, K. Cho and S. Helal, Persim 3D: Context-driven simulation and modeling of human activities in smart spaces, IEEE Transactions on Automation Science and Eng. 12: (4) ((2015) ), 1243–1256. doi:10.1109/TASE.2015.2467353. |
[36] | F. Leotta, A. Marrella and M. Mecella, IoT for BPMers. challenges, case studies and successful applications, in: Intl. Conf. on Business Process Management, Springer, (2019) , pp. 16–22. doi:10.1007/978-3-030-26619-6_3. |
[37] | F. Leotta, M. Mecella and J. Mendling, Applying process mining to smart spaces: Perspectives and research challenges, in: Intl. Conf. on Advanced Information Systems Eng., Springer, (2015) , pp. 298–304. |
[38] | F. Leotta, M. Mecella, D. Sora and T. Catarci, Surveying human habit modeling and mining techniques in smart spaces, Future Internet 11: (1) ((2019) ), 23. doi:10.3390/fi11010023. |
[39] | J. Lundström, J. Synnott, E. Järpe and C.D. Nugent, Smart home simulation using avatar control and probabilistic sampling, in: 2015 IEEE Intl. Conf. on Pervasive Computing and Communication Workshops (PerCom Workshops), IEEE, (2015) , pp. 336–341. doi:10.1109/PERCOMW.2015.7134059. |
[40] | F. Ordóñez, P. De Toledo, A. Sanchis et al., Activity recognition using hybrid generative/discriminative models on home environments using binary sensors, Sensors 13: (5) ((2013) ), 5460–5477. doi:10.3390/s130505460. |
[41] | B. Park, H. Min, G. Bang and I. Ko, The user activity reasoning model in a virtual living space simulator, Intl. Journal of Software Eng. and Its Applications 9: ((2015) ), 53–62. doi:10.14257/ijseia.2015.9.6.06. |
[42] | J. Renoux and F. Klugl, Simulating daily activities in a smart home for data generation, in: 2018 Winter Simulation Conf. (WSC), IEEE, (2018) , pp. 798–809. doi:10.1109/WSC.2018.8632226. |
[43] | D. Roggen, A. Calatroni, M. Rossi, T. Holleczek, K. Förster, G. Tröster, P. Lukowicz, D. Bannach, G. Pirkl, A. Ferscha et al., Collecting complex activity datasets in highly rich networked sensor environments, in: 2010 Seventh Intl. Conf. on Networked Sensing Systems (INSS), IEEE, (2010) , pp. 233–240. doi:10.1109/INSS.2010.5573462. |
[44] | Scientific American, Is There a Reproducibility Crisis in Science? https://www.scientificamerican.com/video/is-there-a-reproducibility-crisis-in-science/. |
[45] | E. Serral, P. Valderas and V. Pelechano, Context-adaptive coordination of pervasive services by interpreting models during runtime, The Computer Journal 56: (1) ((2013) ), 87–114. doi:10.1093/comjnl/bxs019. |
[46] | E. Serral, P. Valderas and V. Pelechano, Addressing the evolution of automated user behaviour patterns by runtime model interpretation, Software & Systems Modeling 14: (4) ((2015) ), 1387–1420. doi:10.1007/s10270-013-0371-3. |
[47] | G. Singla, D.J. Cook and M. Schmitter-Edgecombe, Tracking activities in complex settings using smart environment technologies, Intl. Journal of Biosciences, Psychiatry, and Technology (IJBSPT) 1: (1) ((2009) ), 25–35. |
[48] | J. Synnott, C. Nugent and P. Jeffers, Simulation of smart home activity datasets, Sensors 15: (6) ((2015) ), 14162–14179. doi:10.3390/s150614162. |
[49] | E.M. Tapia, S.S. Intille and K. Larson, Activity recognition in the home using simple and ubiquitous sensors, in: Intl. Conf. on Pervasive Computing, Springer, (2004) , pp. 158–175. doi:10.1007/978-3-540-24646-6_10. |
[50] | N. Tax, N. Sidorova and W.M. van der Aalst, Discovering more precise process models from event logs by filtering out chaotic activities, Journal of Intelligent Information Systems 52: (1) ((2019) ), 107–139. doi:10.1007/s10844-018-0507-6. |
[51] | T. Van Kasteren, A. Noulas, G. Englebienne and B. Kröse, Accurate activity recognition in a home setting, in: Proceedings of the 10th Intl. Conf. on Ubiquitous Computing, (2008) , pp. 1–9. |
[52] | S.J. van Zelst, F. Mannhardt, M. de Leoni and A. Koschmider, Event abstraction in process mining: Literature review and taxonomy, Granular Computing ((2020) ), 1–18. |
[53] | H. Verbeek, J.C. Buijs, B.F. Van Dongen and W.M. Van Der Aalst, Xes, xesame, and prom 6, in: Intl. Conf. on Advanced Information Systems Eng., Springer, (2010) , pp. 60–75. |
[54] | F. Veronese, A. Masciadri, A.A. Trofimova, M. Matteucci and F. Salice, Realistic human behaviour simulation for quantitative ambient intelligence studies, Technology and Disability 28: (4) ((2016) ), 159–177. doi:10.3233/TAD-160453. |
[55] | G.M. Youngblood and D.J. Cook, Data mining for hierarchical model creation, IEEE Transactions on Systems, Man, and Cybernetics, Part C (Applications and Reviews) 37: (4) ((2007) ), 561–572. doi:10.1109/TSMCC.2007.897341. |


