
Erratum to: Short Term Economic Evaluation of the Digital Platform “Support, Monitoring and Reminder Technology for Mild Dementia” (SMART4MD) for People with Mild Cognitive Impairment and Their Informal Caregivers
Zartashia Ghani, Sanjib Saha, Johan Jarl, Martin Andersson, Johan Sanmartin Berglund, Peter Anderberg
[Journal of Alzheimer’s Disease, 86(4) (2022) 1629–1641, DOI 10.3233/JAD-215013]
http://doi.org/10.3233/JAD-215013
Correction Summary. This contribution corrects cost data from our previously published version in which the 6-month cost data was not censored at baseline and 6-month survey dates. Consequently, the average costs for persons with mild cognitive impairment (PwMCI) and their informal caregivers include costs that occurred outside the initial 6-month period for both intervention and control groups. In this erratum, we have repeated the analysis after appropriately censoring the costs. The results led to numerical differences. However, as both the intervention and control groups have been treated exactly the same, the differences between groups remain insignificant and the general interpretation of the results stand as presented in the original publication. The interpretation of the results in terms of cost-effectiveness has changed for informal caregivers, shifting from “dominant” to “not cost-effective”, and for dyads, shifting from “less costly and less effective” to “more costly and less effective”. Consequently, ICER and CEAC curves have also changed (see Corrected Fig. 1). However, these changes did not affect the conclusion of the article.
On page 1629, the Result section in the Abstract states:
“For PwMCI, the mean difference in total costs between intervention and standard care was € 12 (95% CI: –2090 to 2115) (US$ = € 1.19) and the mean QALY change was –0.004 (95% CI: –0.009 to 0.002). For informal caregivers, the cost difference was –€ 539 (95% CI: –2624 to 1545) and 0.003 (95% CI: –0.002 to 0.008) for QALY. The difference in cost and QALY for PwMCI and informal caregivers combined was –€ 527 (95% CI: –3621 to 2568) and –0.001 (95% CI: –0.008 to 0.006). Although generally insignificant differences, this indi- cates that SMART4MD, compared to standard care was: 1) more costly and less effective for PwMCI, 2) less costly and more effective for informal caregivers, and 3) less costly and less effective for PwMCI and informal caregivers combined.”
This should instead read as follows:
“For PwMCI, the mean difference in total costs between intervention and standard care was €396 (95% CI: –444 to 1236) (1 €= US$1.19) and the mean QALY change was –0.004 (95% CI: –0.009 to 0.002). For informal caregivers, the cost difference was €178 (95% CI: –715 to 1071) and 0.003 (95% CI: –0.002 to 0.008) for QALY. The difference in cost and QALY for PwMCI and informal caregivers combined was €574 (95% CI: –641 to 1789) and –0.001 (95% CI: –0.008 to 0.006). Although generally insignificant differences, this indicates that SMART4MD, compared to standard care was: 1) more costly and less effective for PwMCI, 2) more costly and more effective for informal caregivers, and 3) more costly and less effective for PwMCI and informal caregivers combined.”
On page 1631, in the second paragraph one of the inclusion criteria was “had Wi-Fi in their home”:
This should instead be removed and not considered as part of the eligibility criteria in the trial, since participants in the intervention group were provided with data-enabled tablets. This correction pertains to the description of our analytic sample and does not affect the results of the study or their interpretation.
On page 1633, the sensitivity analysis number 6 “Removing top 5% cost outliers” in the Method section states:
“The top 5% (cost≥€ 25,741) were removed from the analysis to exclude the high-cost outliers.”
This should instead read as follows:
“The top 5% (cost≥€ 7,995 for PwMCI; cost≥€ 8,559 for informal caregivers; and cost≥€ 13,516 for PwMCI and informal caregivers combined) were removed from the analysis to exclude the high-cost outliers.”
On page 1633, the first paragraph under the heading “Cost measures” in the Result section states the cost results:
“The total 6-month cost per PwMCI in the intervention and control group was on average €8,188 and €8,175 per person, respectively (Table 2). The greatest share of healthcare costs in both groups was related to outpatient care (75%). For informal caregivers, the total 6-month cost for intervention and control groups were on average €6,050 and €6,589, respectively (Table 2). Informal caregivers in the intervention group had higher outpatient and lower inpatient costs compared to the control group. The total 6-month cost for the dyads was lower for the intervention group (€14,238) compared to the control group (€14,764). None of the cost differences between the groups was statistically significant.”
Original Table 2
Number of healthcare visits and related cost (€) for the participants (mean and standard error)
| PwMCI | Informal Caregiver | |||
| Intervention (n = 173) | Control (n = 172) | Intervention (n = 173) | Control (n = 172) | |
| Outpatient care visits | 24.16 (1.91) | 23.56 (1.96) | 17 (1.57) | 16.77 (1.58) |
| Inpatient admissions | 0.31 (0.05) | 0.38 (0.06) | 0.28 (0.06) | 0.35 (0.06) |
| Inpatient days | 2.36 (0.76) | 2.01 (0.49) | 2.79 (1.15) | 3.86 (1.59) |
| Outpatient care cost | 6,155 (532) | 6,148 (510) | 4,346 (469) | 4,222 (405) |
| Inpatient care cost | 2,033 (417) | 2,027 (385) | 1,704 (403) | 2,367 (478) |
| Total cost | 8,188 (762) | 8,175 (751) | 6,050 (763) | 6,589 (742) |
Note: Independent sample t-test is used to assess the statistical differences between intervention and control group (inter-group [between groups] analysis). No statistically significant differences were found.
This paragraph should instead read as follows:
“The total 6-month cost per PwMCI in the intervention and control group was on average €2,491 and €2,096 per person, respectively (Corrected Table 2). The greatest share of healthcare costs in both groups was related to outpatient care (77% in the intervention group and 78% in the control group). For informal caregivers, the total 6-month cost for intervention and control groups were on average €1,858 and €1,680, respectively (Corrected Table 2). The total 6-month cost for the dyads was higher for the intervention group (€4,349) compared to the control group (€3,776). None of the cost differences between the groups was statistically significant.”
Corrected Table 2
Number of healthcare visits and related cost (€) for the participants (mean and standard error)
| PwMCI | Informal Caregiver | |||
| Intervention (n = 173) | Control (n = 172) | Intervention (n = 173) | Control (n = 172) | |
| Outpatient care visits | 7.62 (0.71) | 6.27 (0.60) | 5.42 (0.63) | 4.48 (0.51) |
| Inpatient admissions | 0.08 (0.02) | 0.08 (0.02) | 0.08 (0.03) | 0.10 (0.03) |
| Inpatient days | 0.60 (0.34) | 0.23 (0.09) | 0.29 (0.12) | 0.57 (0.26) |
| Outpatient care cost | 1,930 (199) | 1,638 (161) | 1,303 (186) | 1,209 (151) |
| Inpatient care cost | 561 (245) | 457 (146) | 555 (256) | 471 (144) |
| Total cost | 2,491 (355) | 2,096 (249) | 1,858 (378) | 1,680 (251) |
Note: Independent sample t-test is used to assess the statistical differences between intervention and control group (inter-group [between groups] analysis). No statistically significant differences were found.
On page 1634–1635, the paragraphs under the heading “Cost-effectiveness analysis” in the Result section state the cost-effectiveness results:
“For PwMCI, the intervention was dominated by standard care as the intervention group had higher costs (€12) and lower QALY compared to the control group. This was also shown with the negative NMB (–€187) (Table 4 & Supplementary Table 5). The CE plane showed that incremental CE-pairs were spread in all four quadrants with 47% in the northwest quadrant (more costly and less effective). Given a WTP of €48,876 per QALY, the CEAC indicated that the intervention had less than 50% probability of being cost-effective (Fig. 1). However, as there was a gain in QoL-AD and MMSE scores in the intervention group compared to the control group, the ICERs for these outcome measures were €36 and €57 per unit gain in QoL-AD and MMSE, respectively.
Original Table 4
Differences in pooled mean cost and health effects with 95% CI, ICERs and NMB (€)
| Effectiveness measures | Sample sizea | Cost difference | Effect difference | ICERs | NMB | |||
| Intervention | Control | ΔC | Bootstrap 95% CI | ΔE | Bootstrap 95% CI | |||
| PwMCI | ||||||||
| mean QALY change | 173/138 | 172/158 | 12 | –2090.33 to 2115.28 | –0.00358 | –0.009 to 0.002 | Dominated | –187 |
| Adjusted QoL-AD | 173/173 | 172/171 | 12 | –2090.33 to 2115.28 | 0.3322 | –0.42 to 1.08 | 36 | |
| MMSE adjusted | 173/173 | 172/172 | 12 | –2090.33 to 2115.28 | 0.2100 | –0.12 to 0.54 | 57 | |
| Informal Caregiver | ||||||||
| mean QALY change | 173/138 | 172/157 | –539 | –2623.78 to 1545.42 | 0.0028 | –0.002 to 0.008 | Dominant | 676 |
| ZBI (adjusted) | 173/173 | 172/171 | –539 | –2623.78 to 1545.42 | 0.23 | –0.72 to 1.18 | Dominant | |
| Dyads (PwMCI plus Informal Caregiver) | ||||||||
| mean QALY change | 173/138 | 172/157 | –527 | –3621.48 to 2568.06 | –0.00083 | –0.008 to 0.006 | 634 940 | 486 |
Abbreviations: ICER: incremental cost-effectiveness ratio; MMSE: mini-mental state examination; NMB: net monetary benefit; PwMCI: person with mild cognitive impairment; QALY: quality-adjusted life years; QoL-AD: quality of life in Alzheimer disease; ZBI: Zarit Caregiver Burden Inventory. Note: Incremental effect with positive value represent improved outcomes. We reversed ZBI scores in order to obtain this. While dominance may be demonstrated, no significant differences in incremental costs and effects were found (Independent t-test). Adjustments were made on 6-month values of effectiveness measures by regressing them on baseline values. aNumber of participants available for cost estimation first, followed by number of participants available for health effects.
Original Table 5
Sensitivity analyses from healthcare provider perspective in ICERs
| No. | Scenarios | Sample sizea | Changes in cost (Bootstrap 95% CI) | Changes in effect (QALY) (Bootstrap 95% CI) | ICER (€) | |
| Intervention | Control | |||||
| PwMCI | ||||||
| Base case | 173/138 | 172/158 | 12 (–2090 to 2115) | –0.00358 (–0.009 to 0.002) | Dominated | |
| 1 | Complete case | 138/138 | 158/158 | 27 (–2078 to 2131) | –0.00358 (–0.009 to 0.002) | Dominated |
| 2 | Imputed QALY change | 173/173 | 172/172 | 12 (–2090 to 2115) | –0.0052 (–0.01 to –0.0005)* | Dominated |
| 3 | UK tariff | 173/138 | 172/158 | 12 (–2090 to 2115) | 0.000025 (–0.01 to 0.01) | 489 796 |
| 4 | Intervention cost | 173/138 | 172/158 | 185 (–1917 to 2288) | –0.00358 (–0.009 to 0.002) | Dominated |
| 5 | Removing zero healthcare cost | 164/130 | 165/153 | 115 (–2018 to 2248) | –0.00359 (–0.009 to 0.002) | Dominated |
| 6 | Removing high–cost outliers | 165/133 | 162/151 | 132 (–1234 to 1498) | –0.00377 (–0.009 to 0.001) | Dominated |
| 7a | Men only | 97/80 | 103/98 | –347 (–3232 to 2539) | –0.00428 (–0.0099 to 0.001) | 81 075 |
| 7b | Women only | 76/58 | 69/60 | 704 (–2353 to 3761) | –0.00258 (–0.01 to 0.007) | Dominated |
| 8a | Age≤70 | 21/19 | 22/21 | 2275 (–3695 to 8246) | 0.00550 (–0.0031 to 0.01) | 413 636 |
| 8b | Age>70 | 152/119 | 150/137 | –321 (2560 to 1917) | –0.004999 (–0.01 to 0.0007) | 64 213 |
| 9a | MMSE≤26 | 67/52 | 54/48 | –460 (–3917 to 2996) | –0.000507 (–0.01 to 0.009) | 907 477 |
| 9b | MMSE>26 | 106/86 | 118/110 | 138 (–2452 to 2729) | –0.0048 (–0.01 to 0.001) | Dominated |
| Informal Caregiver | ||||||
| Base case | 173/138 | 172/157 | –539 (–2623 to 1545) | 0.0028 (–0.002 to 0.008) | Dominant | |
| 1 | Complete case | 138/138 | 157/157 | –527 (–2806 to 1752) | 0.0028 (–0.002 to 0.008) | Dominant |
| 2 | Imputed QALY change | 173/173 | 172/171 | –539 (–2623 to 1545) | 0.0012 (–0.003 to 0.005) | Dominant |
| 3 | Removing zero healthcare cost | 153/122 | 151/137 | –665 (–2912 to 1583) | 0.0025 (–0.003 to 0.008) | Dominant |
| 4 | Removing high–cost outliers | 165/132 | 163/149 | –404 (–1672 to 863) | 0.0016 (–0.003 to 0.006) | Dominant |
| 5 | UK tariff | 173/138 | 172/157 | –539 (–2623 to 1545) | –0.0047 (–0.02 to 0.008) | 114 681 |
| 6a | Men only | 57/42 | 53/46 | –165 (–3748 to 3419) | 0.00177 (–0.005 to 0.009) | Dominant |
| 6b | Women only | 116/96 | 119/111 | –732 (–3313 to 1849) | 0.00321 (–0.003 to 0.0095) | Dominant |
| 7a | Age≤70 | 75/63 | 76/68 | –518 (–2694 to 1658) | 0.00699 (0.002 to 0.01) | Dominant |
| 7b | Age>70 | 98/75 | 96/89 | –613 (–3814 to 2588) | –0.000807 (–0.009 to 0.007) | 759 603 |
| 8a | ZBI=48 (No burden) | 42/42 | 47/47 | 2177 (–2744 to 7098) | –0.000084 (–0.009 to 0.009) | Dominated |
| 8b | ZBI<48 (Some burden) | 96/96 | 111/110 | –1650 (–4179 to 879) | 0.0039987 (–0.002 to 0.0098) | Dominant |
| Dyads (PwMCI plus Informal Caregiver) | ||||||
| Base case | 173/138 | 172/157 | –527 (–3621 to 2568) | –0.00083 (–0.008 to 0.006) | 634 940 | |
| 1 | Complete case | 138/138 | 157/157 | –450 (–3682 to 2782) | –0.00083 (–0.008 to 0.006) | 542 169 |
| 2 | Imputed QALY change | 173/173 | 172/171 | –527 (–3621 to 2568) | –0.004 (–0.01 to 0.002) | 131 750 |
| 3 | Intervention cost | 173/138 | 172/157 | –354 (–3449 to 2741) | –0.00083 (–0.008 to 0.006) | 426 506 |
| 4 | Removing zero healthcare cost | 172/137 | 172/157 | –444 (–3514 to 2627) | –0.00091 (–0.008 to 0.006) | 487 912 |
| 5 | Removing high-cost outliers | 171/138 | 170/157 | –770 (–3574 to 2034) | –0.0011 (–0.008 to 0.006) | 700 000 |
| 6 | UK tariff | 173/138 | 172/157 | –527 (–3621 to 2568) | –0.00495 (–0.02 to 0.01) | 106 465 |
| 7a | Men only | 151/119 | 155/143 | –402 (–3715 to 2912) | –0.00202 (–0.0096 to 0.006) | 199 010 |
| 8b | Women only | 170/135 | 171/157 | –638 (–3712 to 2437) | 0.0000088 (–0.007 to 0.007) | Dominant |
| 9a | Age≤70 | 84/71 | 81/72 | –887 (–4677 to 2903) | 0.00598 (–0.002 to 0.01) | Dominant |
| 9b | Age>70 | 161/127 | 155/140 | –1211 (–4461 to 2040) | –0.0025 (–0.01 to 0.005) | 484 400 |
Abbreviations: ICER: incremental cost-effectiveness ratio; MMSE: mini-mental state examination; PwMCI: person with mild cognitive impairment; QALY: quality-adjusted life years; ZBI: Zarit Caregiver Burden Inventory. aNumber of participants available for cost estimation first, followed by number of participants available for health effects. Note: Incremental effect with positive value represent improved outcomes. We reversed ZBI scores in order to obtain this. Significance levels: P < 0.05*, 0.01** and 0.001***.
Original Supplementary Table 5
Mean cost, health effect and differences by bootstrap (5000) for intervention and control group
| Intervention | Control | Difference (Intervention-Control) | |||||
| Mean | SE | Mean | SE | Mean | Bootstrap SE | Bootstrap 95% CI | |
| PwMCI | |||||||
| Change in EQ-5D-3L index score | –0.00714 | 0.0020 | –0.00355 | 0.0017 | –0.00358 | 0.0027 | –0.009 to 0.002 |
| MMSE adjusted | 27.59 | 0.12 | 27.38 | 0.11 | 0.2100 | 0.17 | –0.12 to 0.54 |
| Adjusted QoL-AD: composite score | 39.40 | 0.27 | 39.07 | 0.27 | 0.3322 | 0.38 | –0.42 to 1.08 |
| Average total cost | 8187.79 | 762.09 | 8175.31 | 750.69 | 12.48 | 1072.88 | –2090.33 to 2115.28 |
| Informal Caregiver | |||||||
| Change in EQ-5D-3L index score | –0.0026 | 0.0017 | –0.0054 | 0.0018 | 0.0028 | 0.0025 | –0.002 to 0.008 |
| Zarit burden adjusted | 43.28 | 0.33 | 43.05 | 0.36 | 0.23 | 0.49 | –0.74 to 1.20 |
| Average total cost | 6049.92 | 762.61 | 6589.10 | 742.20 | –539.18 | 1063.59 | –2623.78 to 1545.42 |
| Dyads (PwMCI plus Informal Caregiver) | |||||||
| Change in EQ-5D-3L index score | –0.0098 | 0.003 | –0.0089 | 0.003 | –0.00083 | 0.004 | –0.008 to 0.006 |
| Average total cost | 14237.7 | 1133.57 | 14764.41 | 1080.39 | –526.71 | 1578.99 | –3621.48 to 2568.06 |
Abbreviations: MMSE: mini-mental state exam; PwMCI: person with mild cognitive impairment; QoL-AD: quality of life in Alzheimer disease; ZBI: Zarit Caregiver Burden Inventory. Note: adjustments are made on baseline data of the estimates. No statistically significant differences were found.
For informal caregivers, the intervention dominated standard care, i.e., the intervention was less costly and more effective in terms of QALY, with a NMB of €676 (Table 4 & Supplementary Table 5). Sixty percent of the CE-pairs were in the southeast quadrant (less costly and more effective) followed by 26% in the northeast quadrant (more costly and more effective) in the CE-plane. The CEAC indicated that the intervention had 70% probability of being cost-effective at WTP of €48,876 per QALY for the caregivers (Fig. 1). Moreover, the intervention also dominated standard care in terms of ZBI.
Combining PwMCI and informal caregiver indicated that the intervention group had lower costs and lower QALY than the control group. This means that the intervention can be considered cost-effective if the society’s willingness-to-accept a QALY loss was lower than the estimated ICER of €634,940. Presenting these results in terms of the NMB (of €486) indicated that intervention was cost-effective at the WTP of €48,876 (Table 4 & Supplementary Table 5). Thirty-seven percent of the CE-pairs were in the southwest quadrant (less costly and less effective) in the CE-plane and the intervention had 60% probability of being cost-effective at €48,876 WTP.”
These paragraphs should instead read as follows:
“For PwMCI, the intervention was dominated by standard care as the intervention group had higher costs (€396) and lower QALY compared to the control group. This was also shown with the negative NMB (–€571) (Corrected Table 4 & Corrected Supplementary Table 5). The CE plane showed that incremental CE-pairs were spread in all four quadrants with 74 % in the northwest quadrant (more costly and less effective). Given a WTP of €48,876 per QALY, the CEAC indicated that the intervention had less than 25% probability of being cost-effective (Corrected Fig. 1). However, as there was a gain in QoL-AD and MMSE scores in the intervention group compared to the control group, the ICERs for these outcome measures were €1,192 and €1,886 per unit gain in QoL-AD and MMSE, respectively.
Corrected Table 4
Differences in pooled mean cost and health effects with 95% CI, ICERs and NMB (€)
| Effectiveness measures | Sample sizea | Cost difference | Effect difference | ICERs | NMB | |||
| Intervention | Control | ΔC | Bootstrap 95% CI | ΔE | Bootstrap 95% CI | |||
| PwMCI | ||||||||
| mean QALY change | 173/138 | 172/158 | 396 | –444 to 1236 | –0.00358 | –0.009 to 0.002 | Dominated | –571 |
| Adjusted QoL-AD | 173/173 | 172/171 | 396 | –444 to 1236 | 0.3322 | –0.42 to 1.08 | 1192 | |
| MMSE adjusted | 173/173 | 172/172 | 396 | –444 to 1236 | 0.2100 | –0.12 to 0.54 | 1,886 | |
| Informal Caregiver | ||||||||
| mean QALY change | 173/138 | 172/157 | 178 | –715 to 1071 | 0.0028 | –0.002 to 0.008 | 63,571 | –41 |
| ZBI (adjusted) | 173/173 | 172/171 | 178 | –715 to 1071 | 0.23 | –0.72 to 1.18 | 774 | |
| Dyads (PwMCI plus Informal Caregiver) | ||||||||
| mean QALY change | 173/138 | 172/157 | 574 | –641 to 1789 | –0.00083 | –0.008 to 0.006 | Dominated | –615 |
Abbreviations: ICER: incremental cost-effectiveness ratio; MMSE: mini-mental state examination; NMB: net monetary benefit; PwMCI: person with mild cognitive impairment; QALY: quality-adjusted life years; QoL-AD: quality of life in Alzheimer disease; ZBI: Zarit Caregiver Burden Inventory. Note: Incremental effect with positive value represent improved outcomes. We reversed ZBI scores in order to obtain this. While dominance may be demonstrated, no significant differences in incremental costs and effects were found (Independent t-test). Adjustments were made on 6-month values of effectiveness measures by regressing them on baseline values. aNumber of participants available for cost estimation first, followed by number of participants available for health effects.
Corrected Table 5
Sensitivity analyses from healthcare provider perspective in ICERs
| No. | Scenarios | Sample sizea | Changes in cost (Bootstrap 95% CI) | Changes in effect (QALY) (Bootstrap 95% CI) | ICER (€) | |
| Intervention | Control | |||||
| PwMCI | ||||||
| Base case | 173/138 | 172/158 | 396 (–444 to 1236) | –0.00358 (–0.009 to 0.002) | Dominated | |
| 1 | Complete case | 138/138 | 158/158 | 767 (–142 to 1677) | –0.00358 (–0.009 to 0.002) | Dominated |
| 2 | Imputed QALY change | 173/173 | 172/172 | 396 (–444 to 1236) | –0.0052 (–0.01 to –0.0005)* | Dominated |
| 3 | UK tariff | 173/138 | 172/158 | 396 (–444 to 1236) | 0.000025 (–0.01 to 0.01) | 15 840 000 |
| 4 | Intervention cost | 173/138 | 172/158 | 569 (–271 to 1409) | –0.00358 (–0.009 to 0.002) | Dominated |
| 5 | Removing zero healthcare cost | 148/120 | 141/130 | 356 (–626 to 1338) | –0.00336 (–0.009 to 0.002) | Dominated |
| 6 | Removing high-cost outliers | 163/130 | 165/153 | –19 (–431 to 393) | –0.00378 (–0.009 to 0.002) | 5026 |
| 7a | Men only | 97/80 | 103/98 | 589 (–689 to 1867) | –0.00428 (–0.0099 to 0.001) | Dominated |
| 7b | Women only | 76/58 | 69/60 | 206 (–764 to 1176) | –0.00258 (–0.01 to 0.007) | Dominated |
| 8a | Age≤70 | 21/19 | 22/21 | 715 (–1317 to 2747) | 0.00550 (–0.0031 to 0.01) | 130 000 |
| 8b | Age>70 | 152/119 | 150/137 | 344 (–587 to 1276) | –0.004999 (–0.01 to 0.0007) | Dominated |
| 9a | MMSE≤26 | 67/52 | 54/48 | 831 (–697 to 2360) | –0.000507 (–0.01 to 0.009) | Dominated |
| 9b | MMSE>26 | 106/86 | 118/110 | 112 (–865 to 1089) | –0.0048 (–0.01 to 0.001) | Dominated |
| Informal Caregiver | ||||||
| Base case | 173/138 | 172/157 | 178 (–715 to 1071) | 0.0028 (–0.002 to 0.008) | 63 571 | |
| 1 | Complete case | 138/138 | 157/157 | 308 (–754 to 1371) | 0.0028 (–0.002 to 0.008) | 110 000 |
| 2 | Imputed QALY change | 173/173 | 172/171 | 178 (–715 to 1071) | 0.0012 (–0.003 to 0.005) | 148 333 |
| 3 | Removing zero healthcare cost | 122/101 | 117/108 | 165 (–1056 to 1386) | 0.000386 (–0.006 to 0.006) | 427 461 |
| 4 | Removing high-cost outliers | 166/131 | 162/147 | 78 (–294 to 451) | 0.0014 (–0.003 to 0.006) | 55 714 |
| 5 | UK tariff | 173/138 | 172/157 | 178 (–715 to 1071) | –0.0047 (–0.02 to 0.008) | Dominated |
| 6a | Men only | 57/42 | 53/46 | 316 (–1421 to 2054) | 0.00177 (–0.005 to 0.009) | 178 531 |
| 6b | Women only | 116/96 | 119/111 | 111 (–904 to 1126) | 0.00321 (–0.003 to 0.0095) | 35 579 |
| 7a | Age≤70 | 75/63 | 76/68 | 191 (–452 to 834) | 0.00699 (0.002 to 0.01) | 27 325 |
| 7b | Age>70 | 98/75 | 96/89 | 148 (–1338 to 1634) | –0.000807 (–0.009 to 0.007) | Dominated |
| 8a | ZBI=48 (No burden) | 42/42 | 47/47 | 1293 (–1739 to 4324) | –0.000084 (–0.009 to 0.009) | Dominated |
| 8b | ZBI<48 (Some burden) | 96/96 | 111/110 | –114 (–886 to 657) | 0.0039987 (–0.002 to 0.0098) | Dominant |
| Dyads (PwMCI plus Informal Caregiver) | ||||||
| Base case | 173/138 | 172/157 | 574 (–641 to 1789) | –0.00083 (–0.008 to 0.006) | Dominated | |
| 1 | Complete case | 138/138 | 157/157 | 1090 (–308 to 2487) | –0.00083 (–0.008 to 0.006) | Dominated |
| 2 | Imputed QALY change | 173/173 | 172/171 | 574 (–641 to 1789) | –0.004 (–0.01 to 0.002) | Dominated |
| 3 | Intervention cost | 173/138 | 172/157 | 747 (–468 to 1962) | –0.00083 (–0.008 to 0.006) | Dominated |
| 4 | Removing zero healthcare cost | 162/131 | 157/143 | 508 (–791 to 1808) | –0.0017 (–0.009 to 0.006) | Dominated |
| 5 | Removing high-cost outliers | 162/127 | 165/152 | –188 (–860 to 483) | –0.0017 (–0.008 to 0.006) | 110 588 |
| 6 | UK tariff | 173/138 | 172/157 | 574 (–641 to 1789) | –0.00495 (–0.02 to 0.01) | Dominated |
| 7a | Men only | 151/119 | 155/143 | 828 (–516 to 2173) | –0.00202 (–0.0096 to 0.006) | Dominated |
| 8b | Women only | 170/135 | 171/157 | 539 (–693 to 1772) | 0.0000088 (–0.007 to 0.007) | 61 250 000 |
| 9a | Age≤70 | 84/71 | 81/72 | 229 (–868 to 1327) | 0.00598 (–0.002 to 0.01) | 38 294 |
| 9b | Age>70 | 161/127 | 155/140 | 393 (–923 to 1709) | –0.0025 (–0.01 to 0.005) | Dominated |
Abbreviations: ICER: incremental cost-effectiveness ratio; MMSE: mini-mental state examination; PwMCI: person with mild cognitive impairment; QALY: quality-adjusted life years; ZBI: Zarit Caregiver Burden Inventory. aNumber of participants available for cost estimation first, followed by number of participants available for health effects. Note: Incremental effect with positive value represent improved outcomes. We reversed ZBI scores in order to obtain this. Significance levels: P < 0.05*, 0.01** and 0.001***.
Corrected Supplementary Table 5
Mean cost, health effect and differences by bootstrap (5000) for intervention and control group
| Intervention | Control | Difference (Intervention-Control) | |||||
| Mean | SE | Mean | SE | Mean | Bootstrap SE | Bootstrap 95% CI | |
| PwMCI | |||||||
| Change in EQ-5D-3L index score | –0.00714 | 0.0020 | –0.00355 | 0.0017 | –0.00358 | 0.0027 | –0.009 to 0.002 |
| MMSE adjusted | 27.59 | 0.12 | 27.38 | 0.11 | 0.2100 | 0.17 | –0.12 to 0.54 |
| Adjusted QoL-AD: composite score | 39.40 | 0.27 | 39.07 | 0.27 | 0.3322 | 0.38 | –0.42 to 1.08 |
| Average total cost | 2491.45 | 355 | 2095.68 | 249 | 395.77 | 428.59 | –444.26 to 1235.80 |
| Informal Caregiver | |||||||
| Change in EQ-5D-3L index score | –0.0026 | 0.0017 | –0.0054 | 0.0018 | 0.0028 | 0.0025 | –0.002 to 0.008 |
| Zarit burden adjusted | 43.28 | 0.33 | 43.05 | 0.36 | 0.23 | 0.49 | –0.74 to 1.20 |
| Average total cost | 1857.78 | 378.04 | 1679.76 | 251.24 | 178.02 | 455.60 | –714.94 to 1070.98 |
| Dyads (PwMCI plus Informal Caregiver) | |||||||
| Change in EQ-5D-3L index score | –0.0098 | 0.003 | –0.0089 | 0.003 | –0.00083 | 0.004 | –0.008 to 0.006 |
| Average total cost | 4349.24 | 524.22 | 3775.44 | 339.01 | 573.80 | 619.92 | –641.22 to 1788.81 |
Abbreviations: MMSE: mini-mental state exam; PwMCI: person with mild cognitive impairment; QoL-AD: quality of life in Alzheimer disease; ZBI: Zarit Caregiver Burden Inventory. Note: adjustments are made on baseline data of the estimates. No statistically significant differences were found.
For informal caregivers, the intervention was more costly and more effective with an ICER of €63,571/QALY and a negative NMB of –€41 (Corrected Table 4 & Corrected Supplementary Table 5). Fifty-five percent of the CE-pairs were in the northeast quadrant (more costly and more effective) followed by 32% in the southeast quadrant (less costly and more effective) in the CE-plane. The CEAC indicated that the intervention had less than 50% probability of being cost-effective at WTP of €48,876 per QALY for the caregivers (Corrected Fig. 1). Moreover, the ICER for ZBI was €774 per unit reduction in caregiving burden.
Combining PwMCI and informal caregiver indicated that the intervention group had higher costs and lower QALY than the control group. This means that the intervention was dominated by standard care with a negative NMB of –€615 (Corrected Table 4 & Corrected Supplementary Table 5). Forty-nine percent of the CE-pairs were in the northwest quadrant (more costly and less effective) in the CE-plane and the intervention had less than 25% probability of being cost-effective at €48,876 WTP.”
On page 1636, the fourth and fifth lines of the paragraph under the heading “Sensitivity and subgroup analyses” in the Result section state the sensitivity and subgroup results:
“The exceptions were the results stratified for men and above 70 years of age for PwMCI, where the intervention appeared to be less costly and less effective as compared to base case results (intervention dominated by standard care).”
These lines should instead read as follows:
“The exceptions were the results after removing high-cost outliers for PwMCI, where the intervention appeared to be less costly and less effective as compared to base case results, although still not cost-effective. For informal caregivers, intervention was dominant for caregivers having some burden (ZBI<48).”
On page 1636, the third and following lines of the second paragraph in the Discussion section state:
“In contrast, the intervention dominated standard care for informal caregivers. This implies that the SMART4MD intervention was more beneficial to the caregivers than the PwMCI. This is further enhanced by the results using care burden (ZBI) as the outcome measure. When combining PwMCI and caregivers, the intervention reduced both the costs and QALY, indicating that resources could be saved at the expense of loss of quality of life in the range of the present WTP threshold. The CEAC curve showed that the intervention has <50%, 70%, and 60% probability of being cost-effective for the PwMCI, caregivers and dyads respectively at €48,876 WTP, indicating a likelihood to be considered good value for money for caregivers and dyads.”
These lines should instead read as follows:
“For informal caregivers, the intervention was not cost-effective at the threshold of €48,876 used in this study. However, the results using care burden (ZBI) as the outcome measure showed a reduction in caregiving burden at a higher cost. When combining PwMCI and caregivers, the intervention was dominated by standard care. The CEAC curve showed that the intervention has <25% probability of being cost-effective for the PwMCI and dyads and <50% probability of being cost-effective for caregivers at €48,876 WTP. This indicates that the intervention is not considered to be good value for money.”
On page 1637, the first line of the last paragraph in the Discussion section states:
“In contrast, considering other outcome measures besides QALY for PwMCI, the ICER were €36 per QoL-AD gain and €57 per MMSE score gain, respectively.”
This line should instead read as follows:
“In contrast, considering other outcome measures besides QALY for PwMCI, the ICER were €1,192 per QoL-AD gain and €1,886 per MMSE score gain, respectively.”
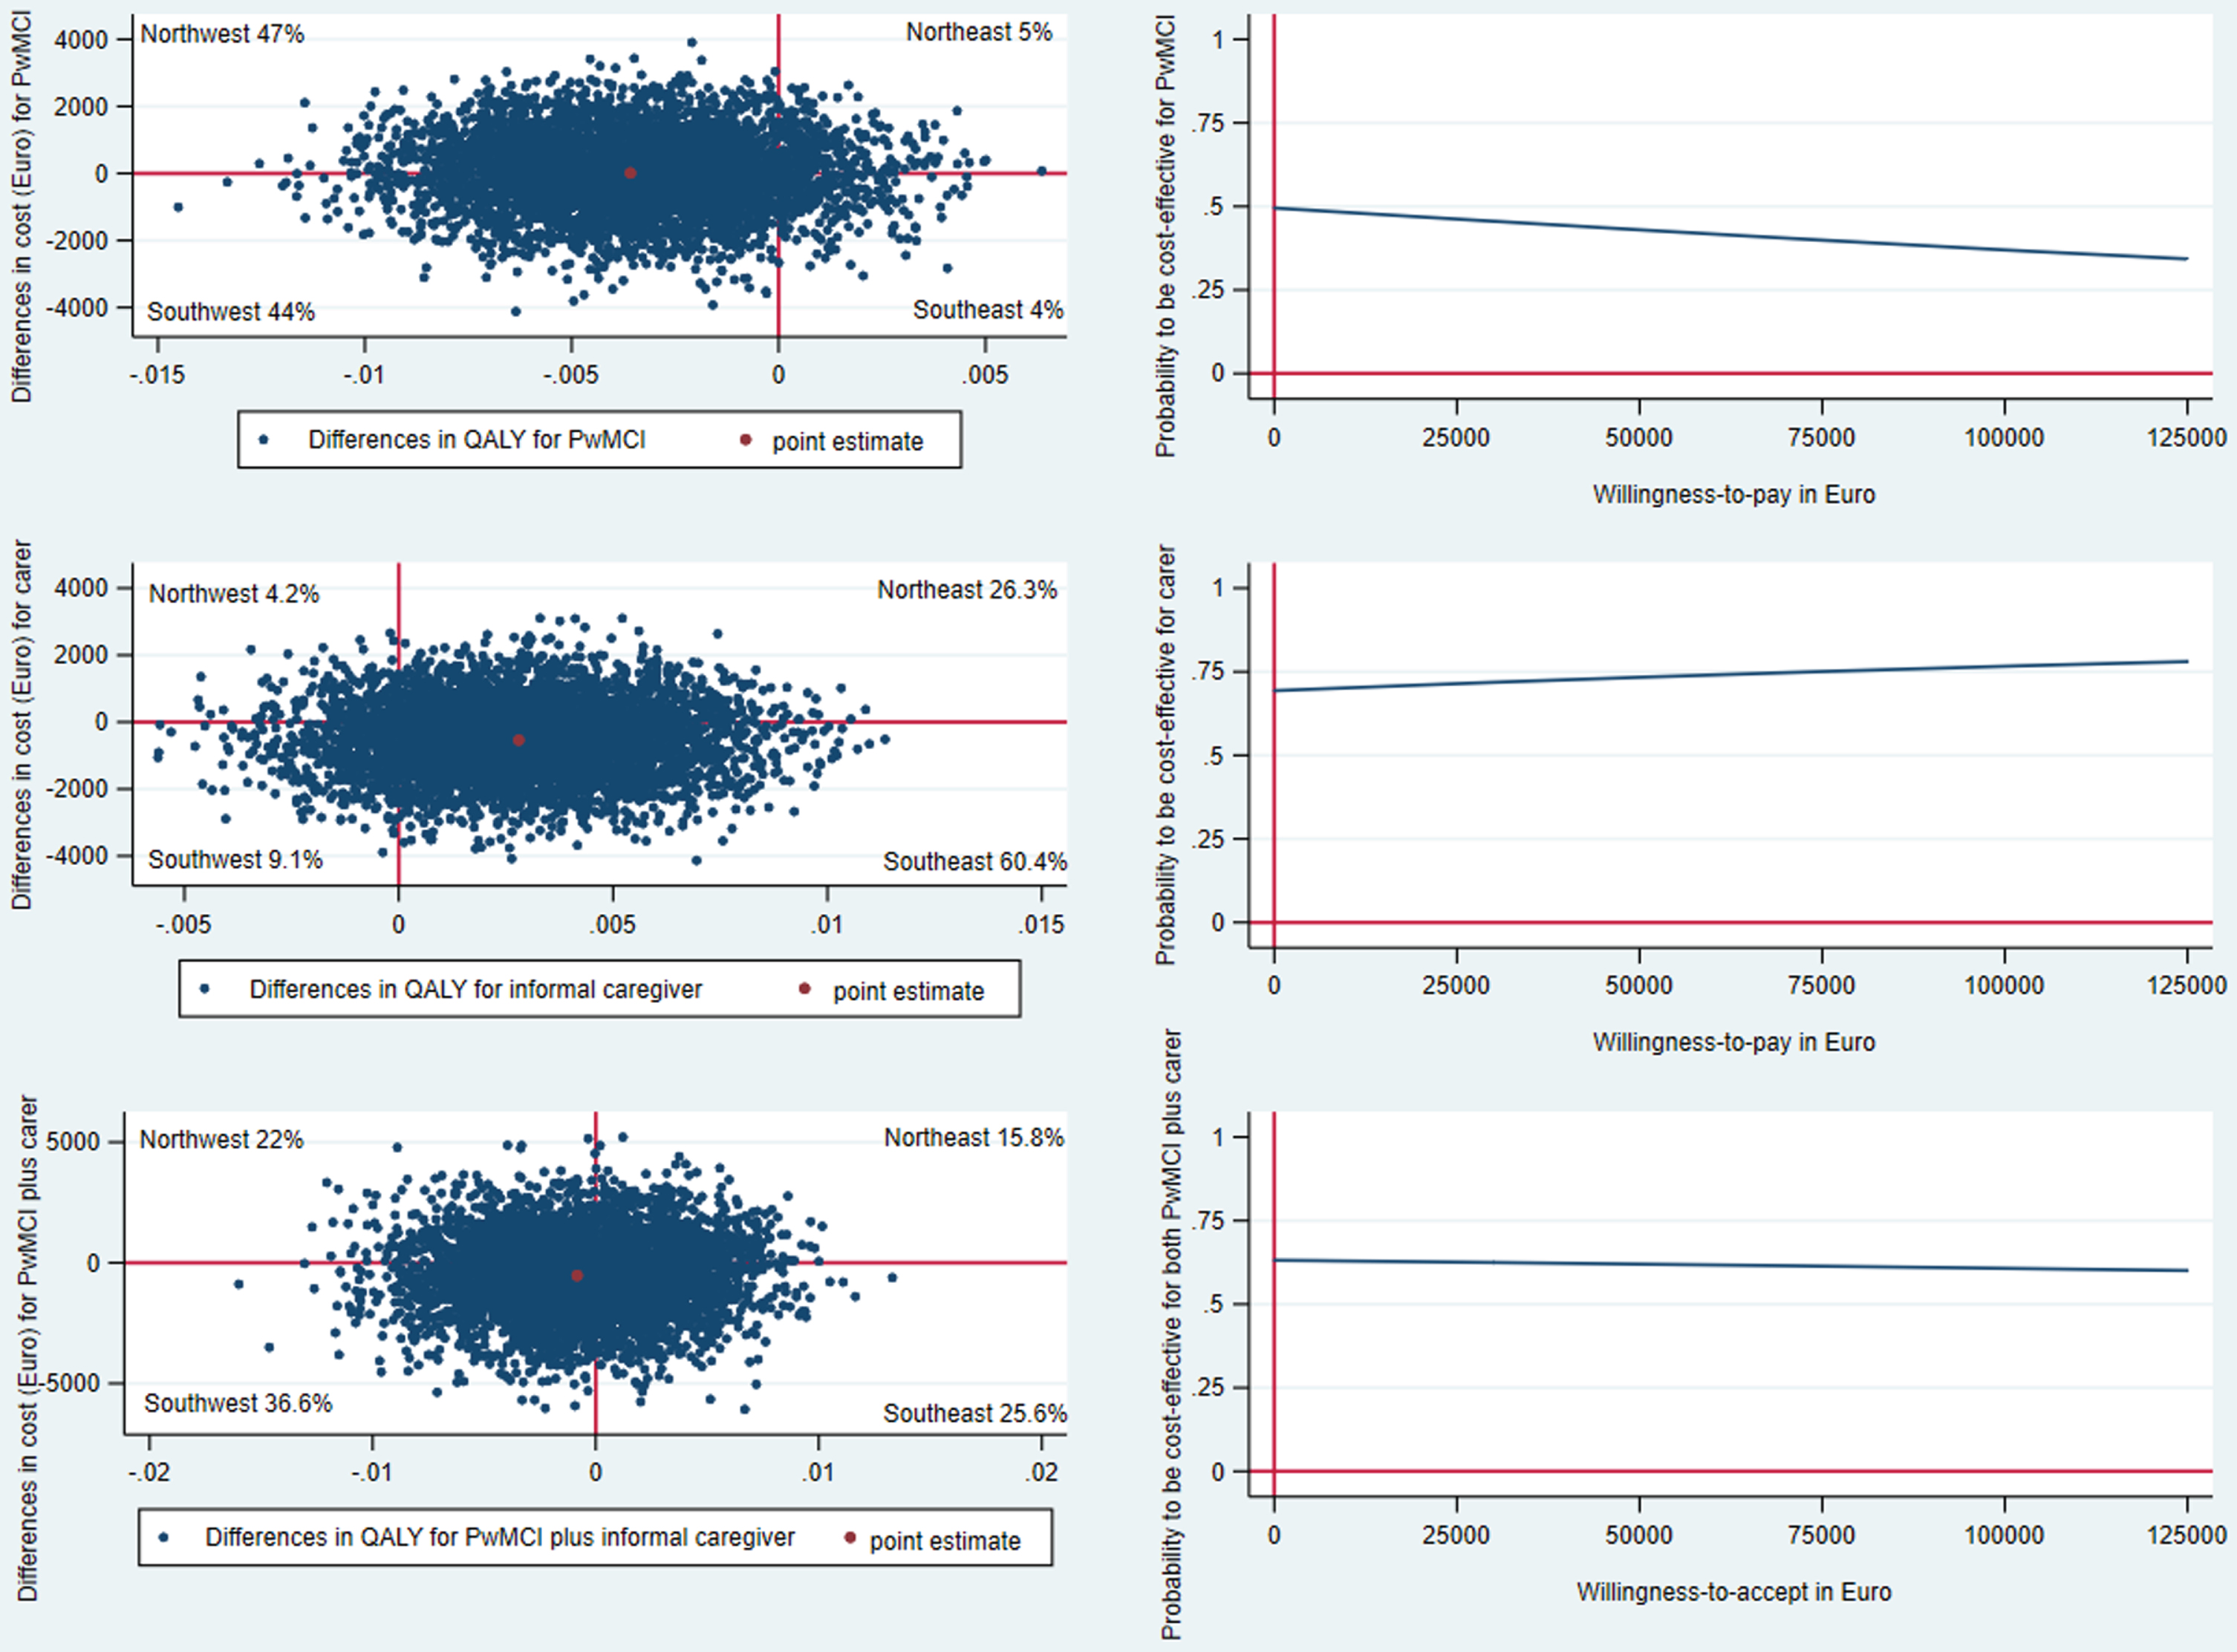
Original Figure 1
Original Fig. 1
CE-plane from healthcare provider perspective and CEAC indicates probability of the SMART4MD being cost-effective at different values (€) of willingness-to-pay per QALY gain.
Corrected Fig. 1
CE-plane from healthcare provider perspective and CEAC indicates probability of the SMART4MD being cost-effective at different values (€) of willingness-to-pay per QALY gain.
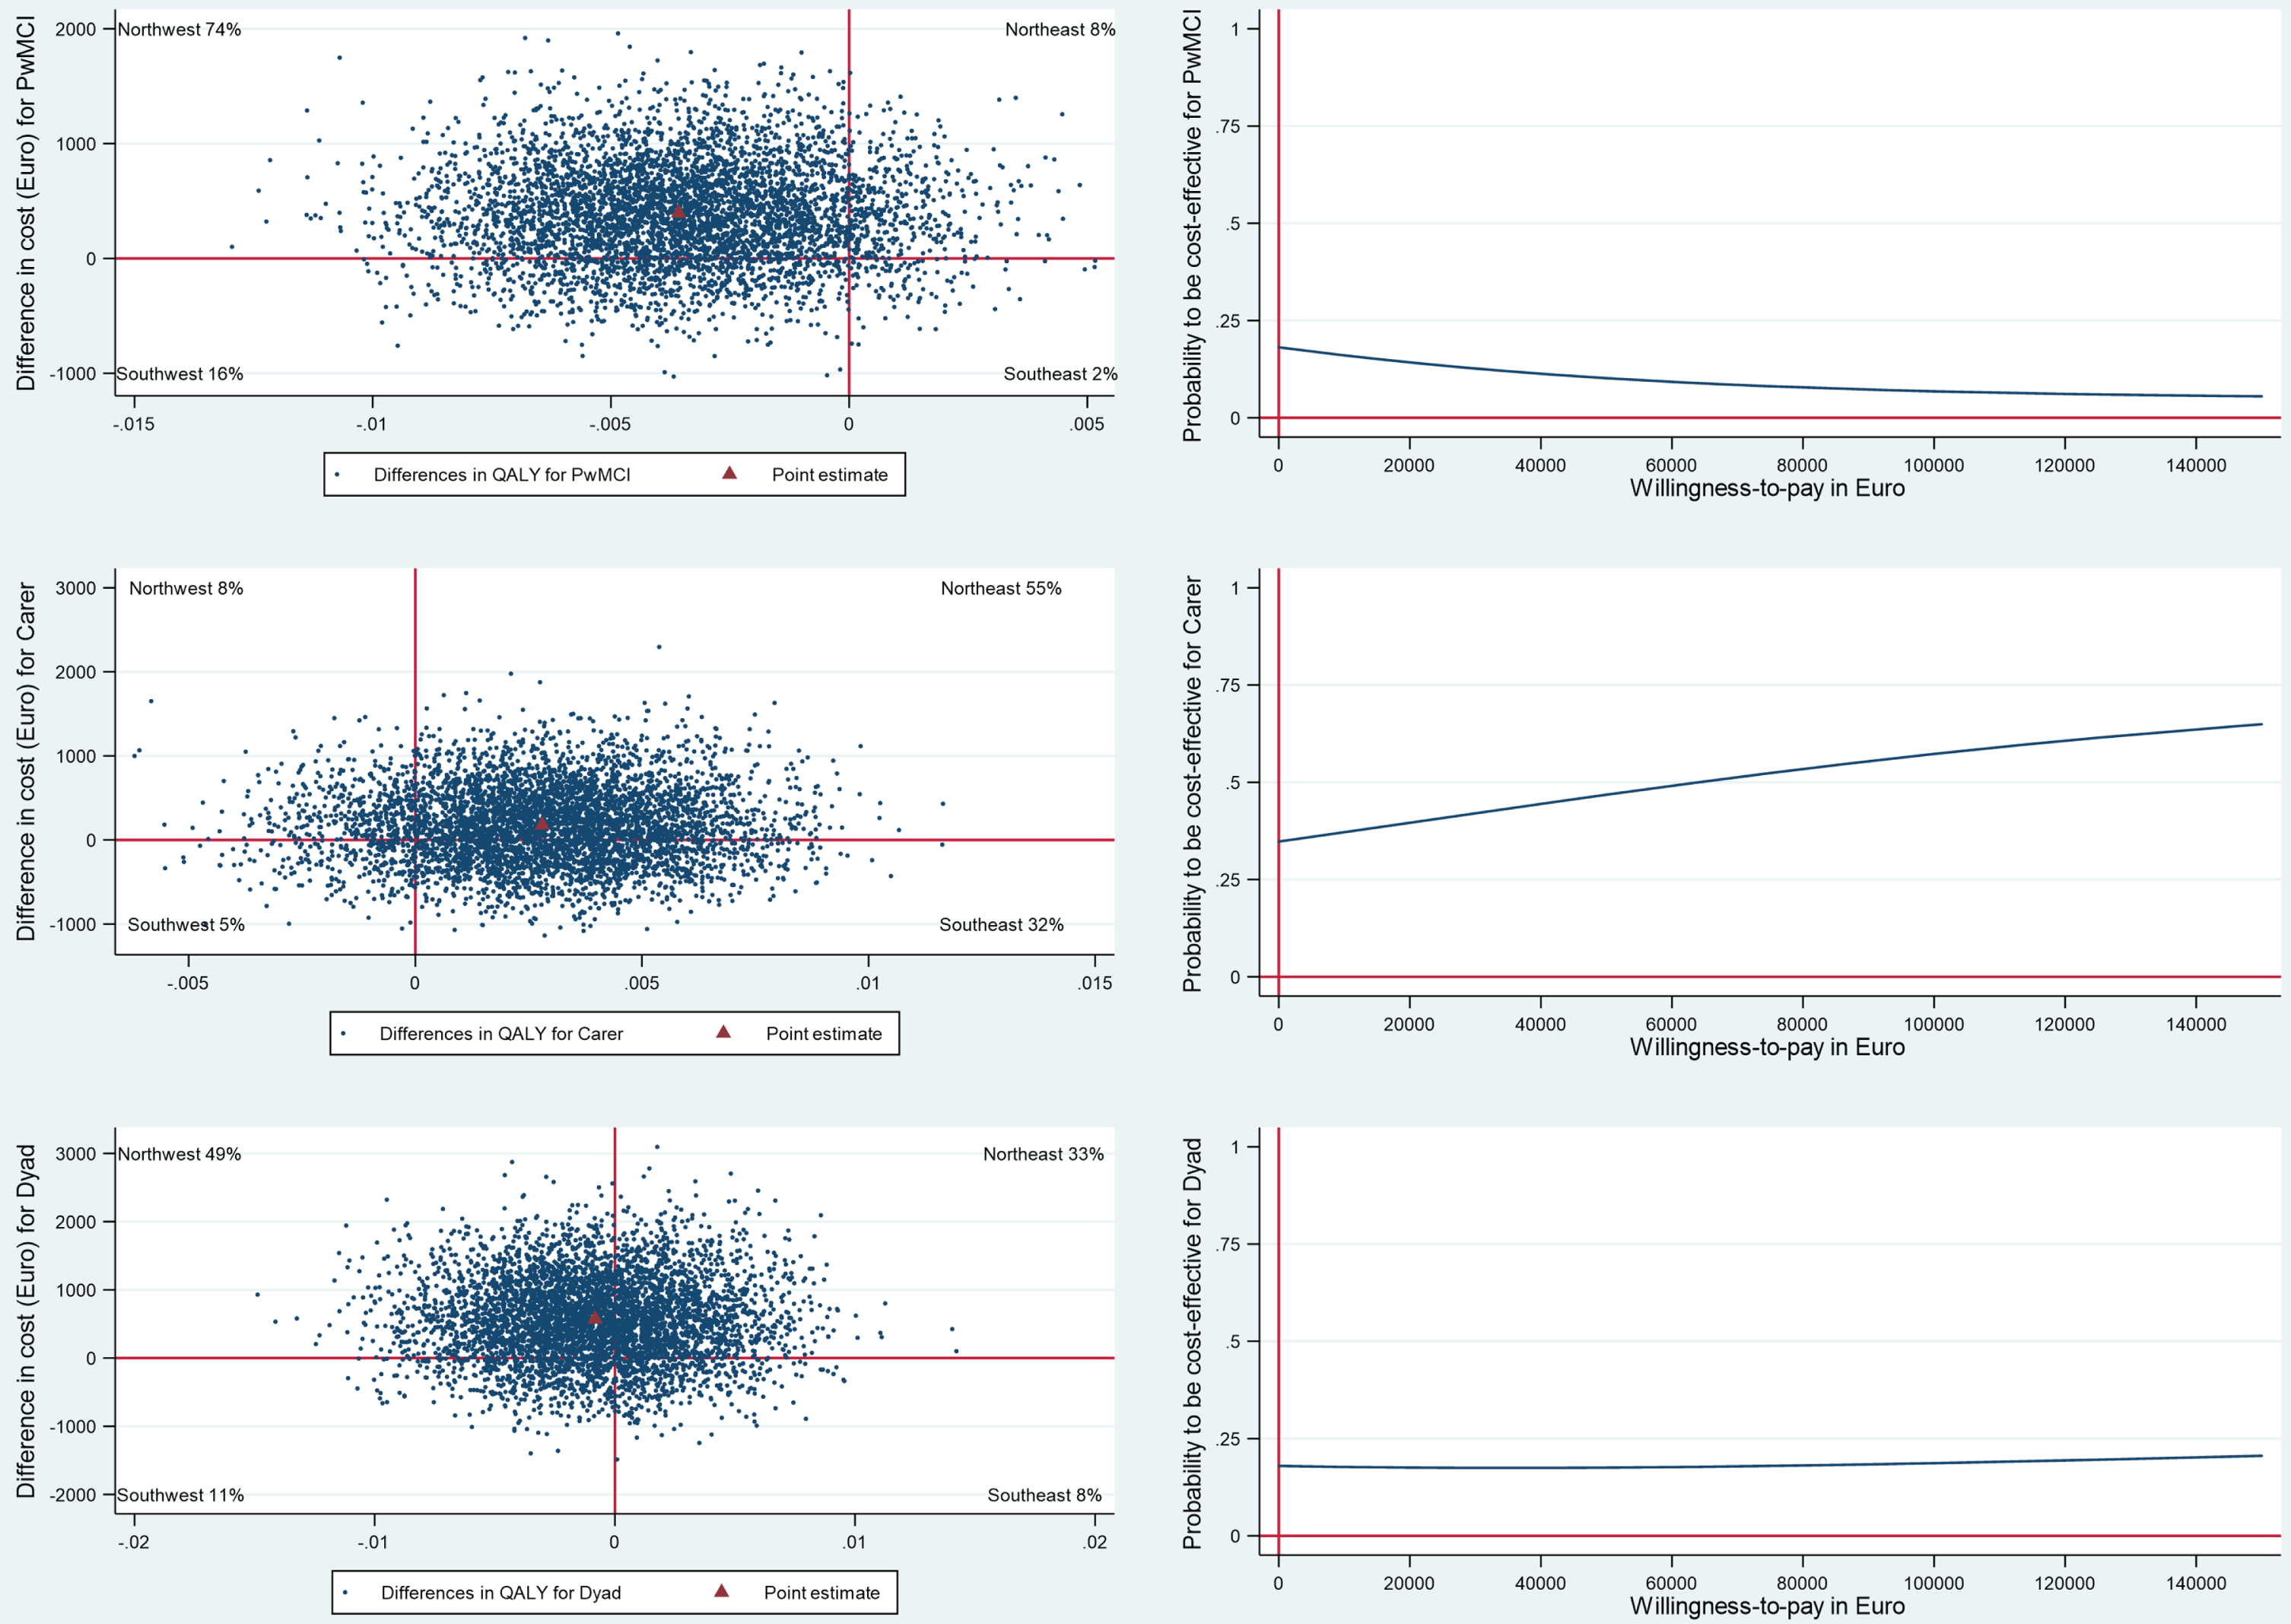
Explanation of Corrected Figure 1
The point estimate in the CE-plane for PwMCI remains in the northwest quadrant but has shifted upward within this quadrant, as incremental costs have increased from € 12 to € 396. As a result, the probability of the intervention being cost-effective has decreased from less than 50% to less than 20%, as indicated in the corresponding CEAC.
For informal caregivers, the point estimate in the CE-plane shifted from the southeast quadrant to the northeast quadrant. This occurred as incremental costs changed from being negative (€ –539) in the original to positive (€ 178) in the corrected version. Consequently, the probability of the intervention being cost-effective decreased from 70% to less than 50%, as shown in the corresponding CEAC.
Similarly, for dyads, the point estimate in the CE-plane shifted from the southwest quadrant to the northwest quadrant. This change was due to incremental costs switching from negative (€ –527) in the original version to positive (€ 574) in the corrected version. As a result, the probability of the intervention being cost-effective decreased from 60% to less than 25%, as indicated in the corresponding CEAC.
REFERENCES
[1] | Lozano R , Naghavi M , Foreman K , Lim S , Shibuya K , Aboyans V , Abraham J , Adair T , Aggarwal R , Ahn SY , et al. ((2012) ) Global and regional mortality from 235 causes of death for 20 age groups in 1990 and 2010: A systematic analysis for the Global Burden of Disease Study 2010. Lancet 380: , 2095–2128. |
[2] | Murray CJ , Vos T , Lozano R , Naghavi M , Flaxman AD , Michaud C , Ezzati M , Shibuya K , Salomon JA , Abdalla S , et al. ((2012) ) Disability-adjusted life years (DALYs) for 291 diseases and injuries in 21 regions, 1990-2010: A systematic analysis for the Global Burden of Disease Study 2010. Lancet 380: , 2197–2223. |
[3] | Wimo A , Guerchet M , Ali GC , Wu YT , Prina AM , Winblad B , Jonsson L , Liu Z , Prince M ((2017) ) The worldwide costs of dementia 2015 and comparisons with 2010. Alzheimers Dement 13: , 1–7. |
[4] | Wimo A , Jönsson L , Fratiglioni L , Sandman PO , Gustavsson A , Sköldunger A , Johansson L ((2016) ) The societal costs of dementia in Sweden 2012 - relevance and methodological challenges in valuing informal care. Alzheimers Res Ther 8: , 59–59 . |
[5] | Wübker A , Zwakhalen SM , Challis D , Suhonen R , Karlsson S , Zabalegui A , Soto M , Saks K , Sauerland D ((2015) ) Costs of care for people with dementia just before and after nursing home placement: Primary data from eight European countries. Eur J Health Econ 16: , 689–707. |
[6] | Fisher GG , Franks MM , Plassman BL , Brown SL , Potter GG , Llewellyn D , Rogers MAM , Langa KM ((2011) ) Caring for individuals with dementia and cognitive impairment, not dementia: Findings from the aging, demographics, and memory study. J Am Geriatr Soc 59: , 488–494. |
[7] | World Health Organization (2002) Active Ageing–A policy framework. |
[8] | Alzheimer’s Society (August 2015) What is mild cognitive impairment (MCI). Alzheimer’s Society: United against Dementia. |
[9] | Mitchell AJ , Shiri-Feshki M ((2009) ) Rate of progression of mild cognitive impairment to dementia–meta-analysis of 41 robust inception cohort studies. Acta Psychiatr Scand 119: , 252–265. |
[10] | Martínez-Alcalá CI , Pliego-Pastrana P , Rosales-Lagarde A , Lopez-Noguerola JS , Molina-Trinidad EM ((2016) ) Information and Communication Technologies in the Care of the Elderly: Systematic Review of Applications Aimed at Patients With Dementia and Caregivers. JMIR Rehabil Assist Technol 3: , e6. |
[11] | Anderberg P , Barnestein-Fonseca P , Guzman-Parra J , Garolera M , Quintana M , Mayoral-Cleries F , Lemmens E , Sanmartin Berglund J ((2019) ) The Effects of the Digital Platform Support Monitoring and Reminder Technology for Mild Dementia (SMART4MD) for People With Mild Cognitive Impairment and Their Informal Carers: Protocol for a Pilot Randomized Controlled Trial. JMIR Res Protoc 8: , e13711. |
[12] | Husereau D , Drummond M , Petrou S , Carswell C , Moher D , Greenberg D , Augustovski F , Briggs AH , Mauskopf J , Loder E ((2013) ) Consolidated Health Economic Evaluation Reporting Standards (CHEERS) statement. BMJ 346: , f1049. |
[13] | Greenberg SA ((2012) ) The geriatric depression scale (GDS). Best Practices in Nursing Care to Older Adults 4: , 1–2. |
[14] | Annual average exchange rates (2018),The Central Bank of Sweden [Sveriges Riskbank]. https://www.riksbank.se/en-gb/statistics/search-interest–exchange-rates/annual-average-exchange-rates/?y=2018&m=9&s=Comma&f=y. |
[15] | Diagnosis Related Group (DRG), Hawaii Medical Service Association, HMSA, https://hmsa.com/portal/PROVIDER/zav_pel.fh.DIA.650.htm. |
[16] | Regionala priser och ersättningar för södra sjukvårdsregionen [Regional prices and reimbursements for the southern healthcare region] (2017) ,Södra regionvårdsnämnden [Southern regional care board], https://sodrasjukvardsregionen.se/. |
[17] | Regionala priser och ersättningar för södra sjukvårdsregionen [Regional prices and reimbursements for the southern healthcare region] (2018) ,Södra regionvårdsnämnden [Southern regional care board], https://sodrasjukvardsregionen.se/. |
[18] | Rabin R , de Charro F ((2001) ) EQ-5D: A measure of health status from the EuroQol Group. Ann Med 33: , 337–343. |
[19] | Burström K , Sun S , Gerdtham U-G , Henriksson M , Johannesson M , Levin L-Å , Zethraeus N ((2014) ) Swedish experience-based value sets for EQ-5D health states. Qual of Life Res 23: , 431–442. |
[20] | Manca A , Hawkins N , Sculpher MJ ((2005) ) Estimating mean QALYs in trial-based cost-effectiveness analysis: The importance of controlling for baseline utility. Health Econ 14: , 487–496. |
[21] | Hoe J , Katona C , Roch B , Livingston G ((2005) ) Use of the QOL-AD for measuring quality of life in people with severe dementia—the LASER-AD study. Age Ageing 34: , 130–135. |
[22] | Folstein MF , Folstein SE , McHugh PR ((1975) ) “Mini-mental state”. A practical method for grading the cognitive state of patients for the clinician. J Psychiatr Res 12: , 189–198. |
[23] | Logsdon RG , Gibbons LE , McCurry SM , Teri L ((1999) ) Quality of life in Alzheimer’s disease: Patient and caregiver reports. J Mental Health Aging 5: , 21–32. |
[24] | Bédard M , Molloy DW , Squire L , Dubois S , Lever JA , O’Donnell M ((2001) ) The Zarit Burden Interview: A New Short Version and Screening Version. Gerontologist 41: , 652–657. |
[25] | Drummond MF , Sculpher MJ , Claxton K , Stoddart GL , Torrance GW ((2015) ). Methods for the economic evaluation of health care programmes, Oxford University Press. |
[26] | SBU (mars 2017) SBU (Statens Beredning för medicinsk och social utvärdering) [Swedish Agency for Health Technology Assessment and Assessment of Scoial Services], pp. 1-167. |
[27] | Paulden M ((2020) ) Calculating and Interpreting ICERs and Net Benefit. PharmacoEconomics 38: , 785–807. |
[28] | Lavori PW , Dawson R , Shera D ((1995) ) A multiple imputation strategy for clinical trials with truncation of patient data. Stat Med 14: , 1913–1925. |
[29] | Rubin D ((1987) ) Multiple Imputation for Nonresponse in Surveys, Wiley & Sons, New York. |
[30] | Dolan P ((1997) ) Modeling valuations for EuroQol health states. Med Care 35: , 1095–1108. |
[31] | Kukull WA , Larson EB , Teri L , Bowen J , McCormick W , Pfanschmidt ML ((1994) ) The Mini-Mental State Examination score and the clinical diagnosis of dementia. J Clin Epidemiol 47: , 1061–1067. |
[32] | Andrews JS , Desai U , Kirson NY , Zichlin ML , Ball DE , Matthews BR ((2019) ) Disease severity and minimal clinically important differences in clinical outcome assessments for Alzheimer’s disease clinical trials. Alzheimers Dement (NY) 5: , 354–363. |
[33] | Meeuwsen EJ , Melis RJ , Van Der Aa GC , Golüke-Willemse GA , De Leest BJ , Van Raak FH , Schölzel-Dorenbos CJ , Verheijen DC , Verhey FR , Visser MC , Wolfs CA , Adang EM , Olde Rikkert MG ((2012) ) Effectiveness of dementia follow-up care by memory clinics or general practitioners: Randomised controlled trial. BMJ 344: , e3086. |
[34] | Hounsome N , Orrell M , Edwards RT ((2011) ) EQ-5D as a quality of life measure in people with dementia and their carers: Evidence and key issues. Value Health 14: , 390–399. |
[35] | Neumann PJ ((2005) ) Health utilities in Alzheimer’s disease and implications for cost-effectiveness analysis. Pharmacoeconomics 23: , 537–541. |
[36] | Green C , Shearer J , Ritchie CW , Zajicek JP ((2011) ) Model-based economic evaluation in Alzheimer’s disease: A review of the methods available to model Alzheimer’s disease progression. Value Health 14: , 621–630. |
[37] | Christiansen L , Lindberg C , Sanmartin Berglun J , Anderberg P , Skär L ((2020) ) Using Mobile Health and the Impact on Health-Related Quality of Life: Perceptions of Older Adults with Cognitive Impairment. Int J Environ Res Public Health 17: , 2650. |
[38] | Piculell E , Skär L , Sanmartin Berglund J , Anderberg P , Bohman D ((2021) ) Using a Mobile Application for Health Communication to Facilitate a Sense of Coherence: Experiences of older persons with cognitive impairment. Int J Environ Res Public Health 18,: , 11332. |
[39] | Quintana M , Anderberg P , Sanmartin Berglund J , Frögren J , Cano N , Cellek S , Zhang J , Garolera M ((2020) ) Feasibility-usability study of a tablet app adapted specifically for persons with cognitive impairment-SMART4MD (Support Monitoring and Reminder Technology for Mild Dementia). Int J Environ Res Public Health 17: , 6816. |
[40] | Ghani Z , Jarl J , Sanmartin Berglund J , Andersson M , Anderberg P ((2020) ) The cost-effectiveness of mobile health (mHealth) Interventions for older adults: Systematic review. Int J Environ Res Public Health 17: , 5290. |
[41] | Stoddart A , van der Pol M , Pinnock H , Hanley J , McCloughan L , Todd A , Krishan A , McKinstry B ((2015) ) Telemonitoring for chronic obstructive pulmonary disease: A cost and cost-utility analysis of a randomised controlled trial. J Telemed Telecare 21: , 108–118. |
[42] | Witt Udsen F , Lilholt PH , Hejlesen O , Ehlers L ((2017) ) Cost-effectiveness of telehealthcare to patients with chronic obstructive pulmonary disease: Results from the Danish TeleCare North’ cluster-randomised trial. BMJ Open 7: , e014616. |
[43] | Cubo E , Mariscal N , Solano B , Becerra V , Armesto D , Calvo S , Arribas J , Seco J , Martinez A , Zorrilla L , Heldman D ((2016) ) Prospective study on cost-effectiveness of home-based motor assessment in Parkinson’s disease. J Telemed Telecare 23: , 328–338. |
[44] | Katalenich B , Shi L , Liu S , Shao H , McDuffie R , Carpio G , Thethi T , Fonseca V ((2015) ) Evaluation of a Remote Monitoring System for Diabetes Control. Clin Ther 37: , 1216–1225. |
[45] | Ramsey SD , Willke RJ , Glick H , Reed SD , Augustovski F , Jonsson B , Briggs A , Sullivan SD ((2015) ) Cost-effectiveness analysis alongside clinical trials II-An ISPOR Good Research Practices Task Force report. Value Health 18: , 161–172. |
[46] | van Asselt AD , van Mastrigt GA , Dirksen CD , Arntz A , Severens JL , Kessels AG ((2009) ) How to deal with cost differences at baseline. Pharmacoeconomics 27: , 519–528. |
[47] | Glick HA ((2011) ) Sample size and power for cost-effectiveness analysis (part 1). Pharmacoeconomics 29: , 189–198. |


