
The Relationship Between Physical Activity and Non-Modifiable Risk Factors on Alzheimer’s Disease and Brain Health Markers: A UK Biobank Study
Abstract
Background:
Modifiable (physical activity) and non-modifiable (sex and genotype) risk factors interact to affect Alzheimer’s disease (AD) risk. Further investigation is necessary to understand if these factors influence brain volume and cognition.
Objective:
The study aimed to assess the effect of physical activity, APOE genotype, and sex on AD risk, brain volume, and cognition.
Methods:
UK Biobank data from 2006 to 2023 was accessed. Physical activity was measured by accelerometers, and International Physical Activity Questionnaire. Outcomes were AD incidence; brain volume (ventricular cerebrospinal fluid and total brain); and cognition (executive function, memory, visuospatial ability, processing speed, and reaction time). Logistic and linear regression models were conducted.
Results:
69,060 participants met inclusion criteria (mean age: 62.28 years, SD: 7.84; 54.64% female). Higher self-reported (OR = 0.63, 95% CI [0.40, 1.00], p = 0.047) and accelerometer-assessed (OR = 0.96 [0.93, 0.98], p = 0.002) physical activity was associated with lower disease incidence. Smaller ventricular cerebrospinal fluid volume (β= – 65.43 [– 109.68, – 17.40], p = 0.007), and larger total brain volume (β= 4398.46 [165.11, 8631.82], p < 0.001) was associated with increased accelerometer-assessed and self-reported physical activity respectively. Both brain volume analyses were moderated by sex. Increased accelerometer-assessed physical activity levels were associated with faster reaction time (β= – 0.43 [– 0.68, – 0.18], p = 0.001); though poorer visuospatial ability (β= – 0.06 [– 0.09, – 0.03], p < 0.001), and executive function (β= 0.49 [0.31, 0.66], p < 0.001; β= 0.27 [0.10, 0.45], p = 0.002) was related to self-reported physical activity levels.
Conclusions:
Higher levels of physical activity reduce AD risk independently of non-modifiable risk factors. Moderation of sex on brain volume highlighted the importance of incorporating non-modifiable risk factors in analysis.
BACKGROUND
Dementia is a neurodegenerative condition that affects cognitive functioning.1 Alzheimer’s disease (AD) is the most common form of dementia; accounting for 6-7 million new cases annually.2 AD incidence is expected to increase as the population ages, resulting in a growing burden on individuals affected by the disease and their carers, in addition to wider society and economics.3 Therefore, a better understanding of methods to prevent or delay the onset of AD is urgently needed.
Deterioration of brain structure and cognitive ability are typically evident decades before an AD diagnosis;4,5 and can be considered indicators of brain health. Specifically, accelerated shrinking of total brain volume and increasing ventricular volume can predict progression from mild cognitive impairment (MCI) to AD.6 Declines in cognitive domains, including executive function;7 memory;8 visuospatial ability;9 processing speed;10 and reaction time (RT)11 may accompany these structural changes.
Key non-modifiable risk factors for AD are sex, with women twice as likely as men to be diagnosed,12 and the Apolipoprotein (APOE) ɛ4 genotype. Homozygous carriers of APOE4 have up to an 8-fold increased risk of developing AD.13 Interactions between sex and genetics substantially heighten AD risk for female carriers of APOE4 (compared to non-carriers, females are 1.81× more likely to have AD, but males are only 1.27× more likely).14 Magnetic resonance imaging (MRI) scans show that APOE4 carriers have reduced grey matter volume and larger ventricular cerebrospinal fluid (CSF) volume compared to non-carriers.15 Additionally, the APOE4 genotype is associated with poorer cognitive abilities, including memory, and executive function.16
Approximately 40% of AD risk is the result of modifiable risk factors, including physical inactivity.17 Regular physical activity (PA) has a direct effect on neuronal health and cognition18,19 and has been associated with reduced AD risk;20–22 though there is not enough evidence to state causation. Systematic reviews23,24 have identified some benefits of exercise in randomized controlled trials (RCTs), compared to usual care or active control groups, for preventing dementia, but RCTs are typically conducted in small sample sizes (often underpowered)25 and with short intervention and follow-up periods; therefore, conclusive evidence for the benefits of physical activity is lacking.26 Additional research is needed to be able to better understand the relationship between daily PA and dementia accounting for non-modifiable risk factors, and thus to move towards evidence-based guidance on exercise prescription for dementia.
Higher levels of PA are associated with larger total brain volume27 and less self-reported cognitive decline28 in cross-sectional investigations, though this relationship can be mediated by non-modifiable risk factors. Low and high levels of PA have a greater effect on cognitive decline in APOE4 carriers compared to non-carriers.29,30 Active women outperform active men in executive function tests.31 In mid-life, APOE4 carriers may experience a decline in hippocampal volume with low PA, while non-carriers remain stable.32 Middle-aged females show increased brain volume with low-intensity PA compared to men.31 However, Brown et al. (2022)33 found that men with higher PA, showed increased grey matter and right hippocampal volume compared to women.
It’s likely that non-modifiable risk factors for AD interact with modifiable protective factors, such as PA, to amplify AD risk. Although RCTs have explored risk reduction via PA, few assess APOE genotype or disaggregate data by sex. Therefore, this observational study aims to better understand how the relationship between PA, AD incidence, brain volume, and cognitive function is influenced by sex and APOE genotype. This information may contribute towards the development of personalized guidance for a tailored PA program dependent on sex or APOE genotype.
METHODS
This study follows Strengthening the Reporting of Observational Studies in Epidemiology (STROBE) guidelines.34 The protocol for this project was approved by the UK Biobank (project application number: 99415).
Participants and setting
Participants were recruited by mail to the UK Biobank (UKB) from 2006– 2010 (instance 0: baseline).35 Invited participants were aged between 40– 69, lived within 25 miles of UKB assessment centers, and registered with the National Health Service (NHS). Ethical approval was granted by the NHS National Research Ethics Service. Participants supplied written consent.
Exposure
International Physical Activity Questionnaire (IPAQ)36 was used to assess self-reported PA at baseline. The UKB categorized participants as having low, moderate, or high activity.
Objectively measured physical activity (accelerometer-assessed PA) was collected by wrist worn Axivity AX3 triaxial accelerometers worn continuously for seven days between February 2013 and December 2015.37 Average acceleration was recorded (milligravities; mg/week). For context, when walking at 1.6 mph, the average acceleration on wrist-worn accelerometers is 27.9 mg, and at 2.2 mph, it is 34.1 mg.38
APOE genotype was extracted from whole exome sequence data published in 2022 (see Supplementary Material 1 and Supplementary Table 1) and categorized as non-carrier/APOE4 heterozygous/APOE4 homozygous. Sex was self-reported at baseline.
Primary outcome
AD incidence was established from linked NHS records until March 2023, regardless of diagnosis date.
Cognitive outcomes
The following cognitive tests were completed at instance 2 (follow up) by touchscreen: Trail Making Test B (TMT-B) (participants sequentially pressed a series of digits and letters; executive function); numeric memory (participants recalled two digits, with the number of digits increasing by one after each successful recall, up to a maximum of 12; memory); pairs matching (participants matched cards shown briefly on the screen; the first round had 3 pairs of cards, and the second had 6; visuospatial ability); symbol digit substitution task (SDST) (participants inputted symbols into a grid, using a grid of corresponding symbols and letters as a guide; processing speed); and RT (participants were shown two cards simultaneously and pressed a button if they matched, for 12 rounds; RT).
Neuroimaging outcomes
Full body MRI scans in a standard Siemans Kyra 3T scanner were completed at follow up.39 The UKB pre-processed data to calculate tissue volumes (mm3), including total brain volume (grey and white matter) and ventricular CSF volume.39
Covariates
The following covariates were controlled for from follow up assessment: suspected Bipolar or depression; ethnicity (White/Asian/Black/Mixed); smoking; education (none/secondary/higher); cardiovascular disease; alcohol intake (none/rarely/frequently); sleep duration (<7 hours/7– 9 hours/>9 hours); diabetes; body mass index (underweight/healthy/overweight/obese/severely obese); social activity (none/rarely/frequently); Townsend Index of Multiple Deprivation Score (IMD); and age (calculated from date of birth to date of follow up visit) (see Supplementary Table 2 in Supplementary Material 1 for details of how these variables were generated from the UK Biobank database).
Statistical analysis
An a priori power analysis was conducted using G*Power version 3.1.9.740 for estimation of sample size; based on previously published UKB data on dementia risk reduction as a result of physical activity.41 It was calculated that the risk of dementia was reduced between 40– 84% depending on the type and frequency of physical activity conducted, compared to conducting less than the recommended amount of physical activity per week. An average value of 62% risk reduction was taken. Average acceleration was extracted, M = 28.23 (SD = 8.34) from Rowlands et al. (2021).42 With a Type 1 error rate of 5% and 80% power, the sample size needed was N = 27,431, to have a 5% chance of incorrectly rejecting the null hypothesis in detecting a 62% reduction in AD risk.
Analyses were conducted in R version 4.2.2; models were fitted using the base stats package. All tests were two-sided. Outliers were identified for accelerometer-assessed PA, executive function and RT using Tukey fences. Percentage correct scores were generated for the SDST, numeric memory and pairs matching tasks (see Supplementary Material 1 for further details). AD incidence was analyzed using logistic multivariable regression models, brain volume (total brain volume and ventricular CSF volume) and cognitive function (executive function, memory, processing speed, visuospatial ability, and RT) were analyzed using linear multivariable regression models. accelerometer-assessed PA and self-reported PA were analyzed in separate models. Each outcome was analyzed with two models. The first model included PA, APOE genotype, and sex; the second (full) added in all covariates. The reference values were as follows: sex (female); ethnicity (White); APOE genotype (non-carrier); IPAQ group (low); depression/bipolar diagnosis (no depression or single depressive episode only); smoking status (no); level of education (none); CVD diagnosis (no); diabetes diagnosis (no); frequency of alcohol intake (never); sleep duration (7– 9 hours); frequency of social visits (never) and BMI (healthy).
Interactions between PA, APOE genotype, and sex were considered in the first model alone, to avoid potential convergence issues in the full models. Interactions were examined by considering the p value for the overall interaction term; and, if significant, examining the individual level interaction terms in the model. Model assumptions were tested (see Supplementary Material 1). All variables were examined to determine whether assumptions were met, and if violated, the appropriate transformation was made to the variable. If assumption violations were unable to be corrected by transformation, then models that were robust to the assumption violations were also conducted.
As follow up times for AD incidence varied, AD incidence rates were estimated using Poisson regression models. Time to follow up (from baseline to AD diagnosis (or if no AD diagnosis, last data collection in March 2023)) (measured in days) was an offset term.
The relationship between accelerometer-assessed and self-reported physical activity was examined by Spearman’s rank correlation.
Post-hoc sensitivity analyses on models with significant findings were conducted to investigate the impact of missing data. Missing data was classified as any participant that would have otherwise been eligible for the study but was ineligible due to missing data for: suspected Bipolar or depression, smoking, alcohol intake, IMD, social activity, qualifications, diabetes, CVD, sleep duration, BMI, or ethnicity.
A multiple imputation approach, with best- and worst-case covariate data inputted with respect to Alzheimer’s Disease risk (see Supplementary Material 2) was used.
Eligibility criteria
Participants were required to have all key predictor and covariate data available for the complete-case analysis (though additional inclusion criteria was applied separately for brain structure and cognition). The following exclusion criteria were applied: outlying accelerometer-assessed PA, or UKB indicated a problem with accelerometer-assessed PA data quality; diagnosis of AD prior to accelerometer-assessed PA collection (brain structure and cognition: follow up visit) or up to six weeks afterwards; accelerometer removed for >3 days; ɛ2/ɛ4 APOE genotype (as this genotype contains both risk reducing and risk increasing alleles); and outlying cognitive data.
RESULTS
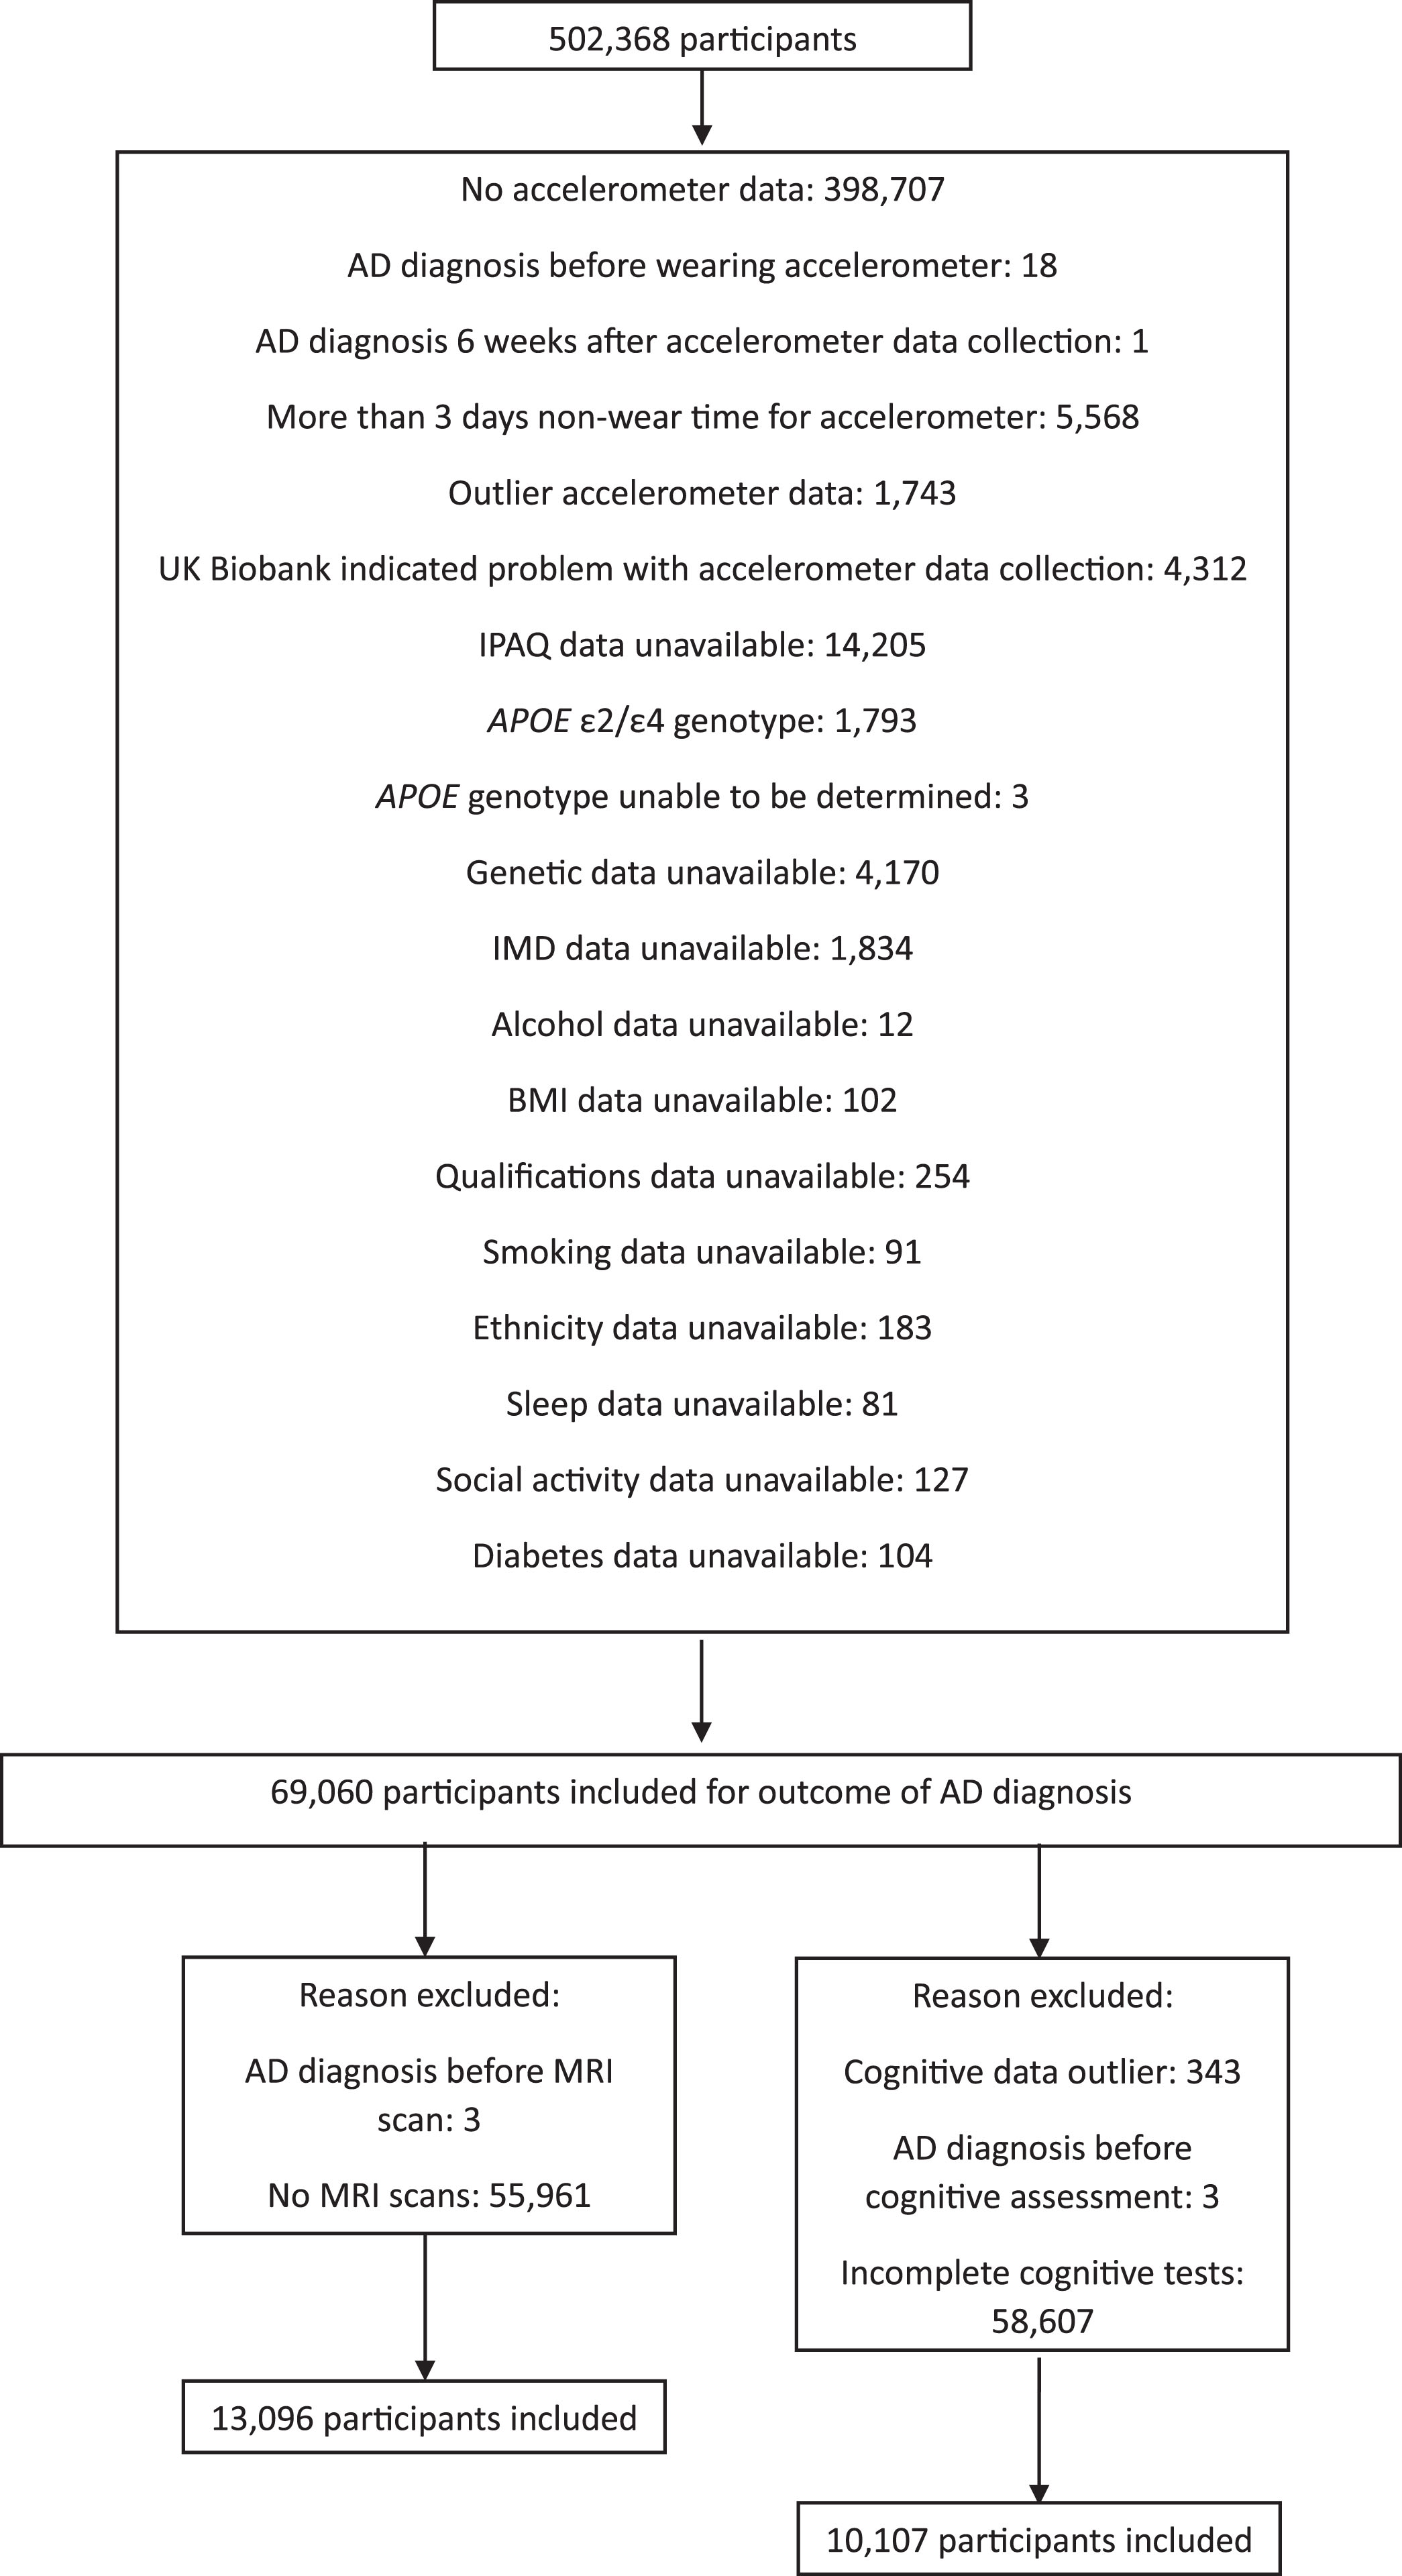
69,060 participants (Mean age = 62.28 (SD: 7.84) years; 54.64% female) were eligible for inclusion in this study for the outcome of AD incidence; with 13096 (Mean age = 61.62 (7.62) years; 53.38% female) and 10107 (Mean age = 60.69 (7.53) years; 51.99% female) eligible for the outcomes of brain volume and cognition, respectively (Fig. 1).
Fig. 1
Exclusion criteria applied to the participants. Left: Outcomes of volume of ventricular CSF and total brain volume; Right: Outcomes of executive function; processing speed; memory; reaction time; and visuospatial ability.
Eligible participants were typically White (97.05% of total sample) and had received higher education (73.12% of total sample). Participants had an overall acceleration average of 27.59 (SD: 7.21), and most were classed as moderately active by the IPAQ (42.91% of total sample). These trends were reflected across the total sample of 69060 participants, and the subgroups for the outcomes of brain volume and cognition (Table 1).
Table 1
Descriptive statistics summarized by outcome
| Total AD incidence group (included participants) (N = 69060) N(%) | AD incidence (N = 69060) N(%) | Total MRI group (N = 13096) N(%) | Total cognitive function group (N = 10107) N(%) | ||
| Yes (N = 141) | No (N = 68919) | ||||
| Sex | |||||
| Male | 31326 (45.36) | 79 (56.03) | 31247 (45.34) | 6105 (46.62) | 4852 (48.01) |
| Female | 37734 (54.64) | 62 (43.97) | 37672 (54.66) | 6991 (53.38) | 5255 (51.99) |
| Ethnicity | |||||
| White | 67022 (97.05) | 136 (96.45) | 66886 (97.05) | 12787 (97.64) | 9876 (97.71) |
| Asian | 796 (1.15) | <5 | 793 (1.15) | 132 (1.01) | 100 (0.99) |
| Black | 493 (0.71) | <5 | 492 (0.71) | 58 (0.44) | 37 (0.37) |
| Mixed | 749 (1.08) | <5 | 748 (1.09) | 119 (0.91) | 94 (0.93) |
| APOE genotype | |||||
| Non-carrier | 50983 (73.82) | 54 (38.30) | 50929 (73.90) | 9790 (74.76) | 7550 (74.70) |
| Heterozygous carrier | 16475 (23.86) | 66 (46.81) | 16409 (23.81) | 3009 (22.98) | 2334 (23.09) |
| Homozygous carrier | 1602 (2.32) | 21 (14.89) | 1581 (2.29) | 297 (2.27) | 223 (2.21) |
| Overall acceleration average (mg), Mean (SD) | 27.59 (7.21) | 23.84 (7.37) | 27.60 (7.21) | 28.09 (7.07) | 28.44 (7.05) |
| IPAQ group | |||||
| Low | 12330 (17.85) | 31 (21.99) | 12299 (17.85) | 2369 (18.09) | 1915 (18.95) |
| Moderate | 27097 (42.91) | 51 (36.17) | 29582 (42.92) | 5572 (42.55) | 4355 (43.09) |
| High | 29633 (39.24) | 59 (41.84) | 27038 (39.23) | 5155 (39.36) | 3837 (37.96) |
| Age (at follow up), Mean (SD) | 62.28 (7.84) | 70.13 (4.77) | 62.26 (7.83) | 61.62 (7.62) | 60.69 (7.53) |
| Depression/Bipolar status | |||||
| No depression or single depressive episode | 64787 (93.81) | 137 (97.16) | 64650 (93.81) | 12340 (94.23) | 9529 (94.28) |
| Bipolar | 204 (0.30) | <5 | 203 (0.29) | 34 (0.26) | 27 (0.27) |
| Recurrent depression | 4069 (5.89) | <5 | 4066 (5.90) | 722 (5.51) | 551 (5.45) |
| Smoking status | |||||
| No | 26621 (38.55) | 49 (34.75) | 26572 (38.56) | 5125 (39.13) | 3973 (39.31) |
| Yes | 42439 (61.45) | 92 (65.25) | 42347 (61.44) | 7971 (60.87) | 6134 (60.69) |
| Level of education | |||||
| None | 4862 (7.04) | 29 (20.57) | 4833 (7.01) | 507 (3.87) | 274 (2.71) |
| Secondary (GCSE/A level) | 13703 (19.84) | 28 (19.86) | 13675 (19.84) | 2054 (15.68) | 1491 (14.75) |
| Higher (University degree/professional qualification) | 50495 (73.12) | 84 (59.57) | 50411 (73.15) | 10535 (80.44) | 8342 (82.54) |
| CVD diagnosis | |||||
| No | 45123 (65.34) | 76 (53.90) | 45047 (65.36) | 7840 (59.87) | 6160 (60.95) |
| Yes | 23937 (34.66) | 65 (46.10) | 23872 (34.64) | 5256 (40.13) | 3947 (39.05) |
| Diabetes diagnosis | |||||
| No | 66155 (95.79) | 132 (93.62) | 66023 (95.80) | 12440 (95.00) | 9613 (95.11) |
| Yes | 2905 (4.21) | 9 (6.38) | 2896 (4.20) | 656 (5.00) | 494 (4.89) |
| Frequency of alcohol intake | |||||
| None | 4069 (5.89) | 20 (14.18) | 4049 (5.86) | 799 (6.10) | 605 (5.96) |
| Rarely (special occasions/1-3x per month) | 14211 (20.58) | 25 (17.73) | 14186 (20.58) | 2881 (22.00) | 2169 (21.46) |
| Frequently (more than 1/2x per week) | 50780 (73.53) | 96 (68.09) | 50684 (73.54) | 9416 (71.90) | 7333 (72.55) |
| Sleep duration | |||||
| Less than 7 hours | 15327 (22.19) | 38 (26.95) | 15289 (22.18) | 3036 (23.18) | 2333 (23.08) |
| 7 – 9 hours | 52897 (76.60) | 102 (72.34) | 52795 (76.60) | 9892 (75.53) | 7649 (75.68) |
| More than 9 hours | 836 (1.21) | <5 | 836 (1.21) | 168 (1.28) | 125 (1.24) |
| Social activity | |||||
| Never/no friends/family outside household | 931 (1.35) | <5 | 928 (1.35) | 176 (1.34) | 129 (1.28) |
| Rarely (once every few months/once a month) | 14994 (21.70) | 31 (21.99) | 14953 (21.70) | 2606 (19.90) | 2073 (20.51) |
| Frequently (more than once a week) | 53145 (76.95) | 107 (75.89) | 53038 (76.96) | 10314 (78.76) | 7905 (78.21) |
| BMI (kg/m2) | |||||
| Underweight (>18.5) | 417 (0.60) | <5 | 417 (0.61) | 100 (0.76) | 88 (0.87) |
| Healthy (< = 18.5 & <25) | 26852 (38.88) | 56 (39.72) | 26796 (38.88) | 5471 (41.78) | 4231 (41.86) |
| Overweight (< = 25 & <30) | 28502 (41.27) | 57 (40.43) | 28445 (41.27) | 5295 (40.43) | 4073 (40.30) |
| Obese (< = 30 & <40) | 12367 (17.91) | 24 (17.02) | 12343 (17.91) | 2108 (16.10) | 1610 (15.93) |
| Severely obese (< =40) | 922 (1.34) | <5 | 918 (1.33) | 122 (0.93) | 105 (1.04) |
| IMD, Mean (SD) | 14.59 (11.82) | 15.51 (12.59) | 14.59 (11.82) | 14.73 (11.86) | 13.93 (11.32) |
| AD incidence | 141 (0.20) | 141 (100.00) | 68919 (0.00) | – | – |
| Brain volume (mm3), Mean (SD) | |||||
| Volume of ventricular CSF | – | – | – | 47437.29 (20523.04) | – |
| Total brain volume (grey and white matter) | – | – | – | 1162172.00 (110413.10) | – |
| Cognitive function, Mean (SD) | |||||
| Duration to complete TMT-B (s) | – | – | – | – | 526.42 (164.69) |
| Reaction time (ms) | – | – | – | – | 585.59 (89.72) |
| Pairs matching (% correct) | – | – | – | – | 80.44 (11.38) |
| Numeric memory (% correct) | – | – | – | – | 82.36 (6.25) |
| SDST (% correct) | – | – | – | – | 95.77 (8.20) |
| Time to follow up (years), Mean (SD) | 13.86 (0.84) | 13.96 (0.84) | 13.86 (0.84) | – | – |
Note: Values given are N(%), unless otherwise stated in the row header. Note some values are reported as <5 due to UK Biobank reporting restrictions to preserve anonymity for small numbers.
There were 2,788 (4.04%) participants ineligible for analysis due to missing covariate data (see Supplementary Material 3; Supplementary Table 3). Excluded participants were more likely to be male, χ2(1) = 8.98, p = 0.003, and less likely to be White, χ2(3) = 47.88, p < 0.001, and have higher education, χ2(2) = 9.44, p = 0.009, than included participants (Supplementary Material 3; Supplementary Table 3). Excluded participants had lower average acceleration than included participants, t(71846) = 6.25, p < 0.001, but did not differ in distribution across IPAQ groups, χ2(2) = 5.69, p = 0.058.
There were 7,492 participants included in both the brain volume and cognition analyses. IMD score violated the assumptions of normal distribution and linear relationship with outcome (unimproved by transformation) and frequency of social activity violated the multicollinearity assumption. Therefore, both were removed from the full models. Time to complete the TMT-B underwent a square root transformation prior to analysis to correct the non-normal distribution. Percentage correct scores on the SDST, numeric memory, and pairs matching tasks were not normally distributed (unimproved by transformation). Consequently, Box-Cox (numeric memory) and Yeo-Johnson (SDST and pairs matching) transformed models were conducted, in addition to the uncorrected models (uncorrected models presented below as results unchanged for key predictors). For complete model statistics, see Supplementary Material 3 (Supplementary Tables 4–27).
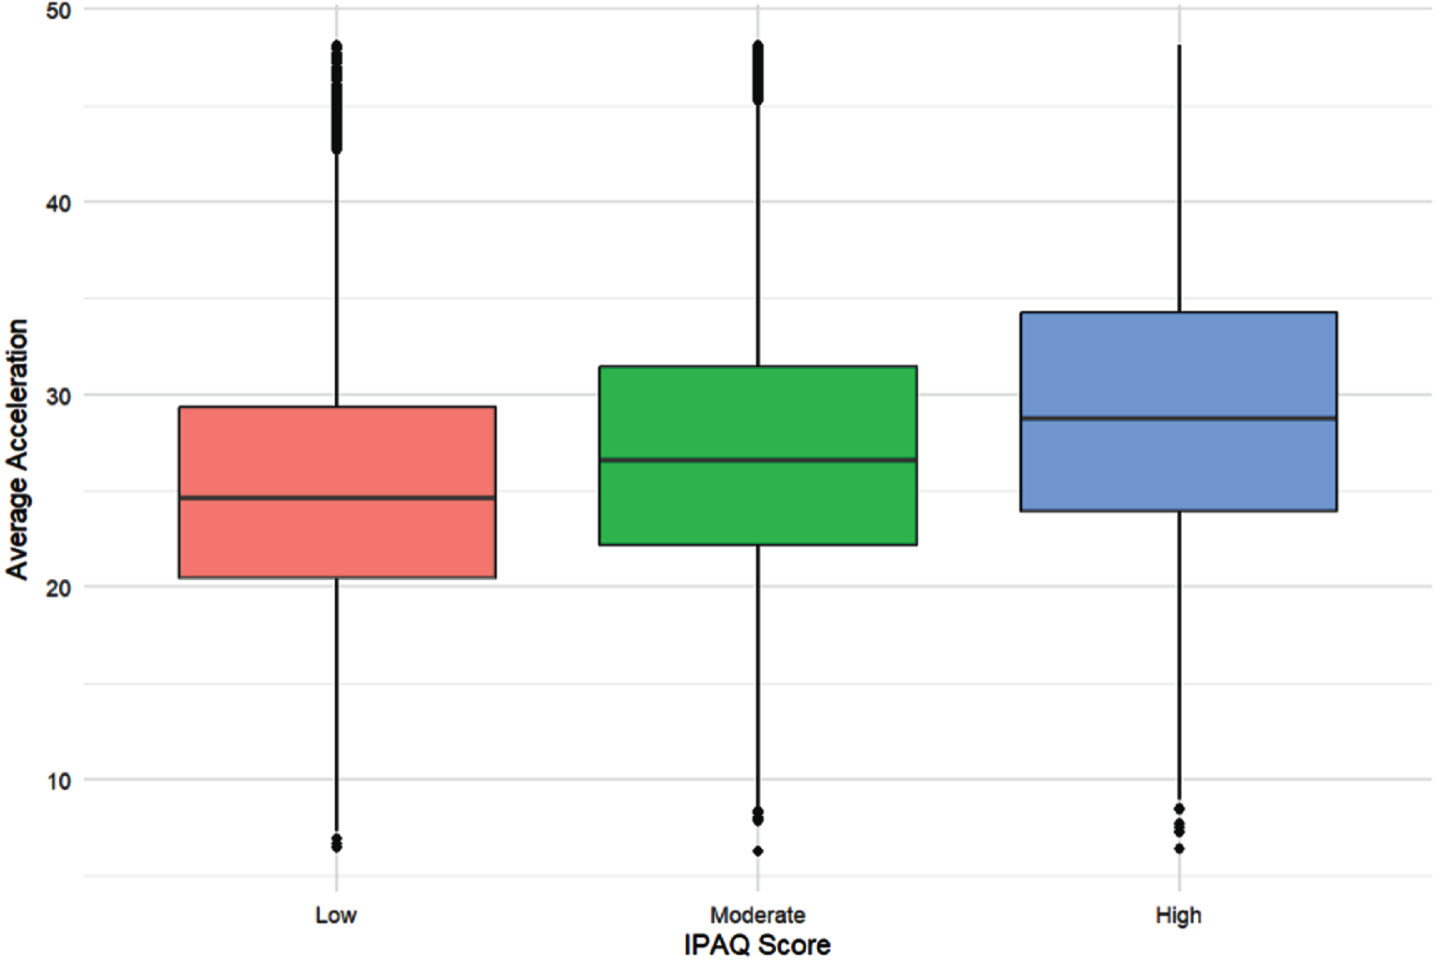
Examination of the relationship between IPAQ score and acceleration revealed that Spearman’s rank correlation showed a weak positive relationship between all three groups: AD incidence, r = 0.20, p < 0.001, brain volume, r = 0.20, p < 0.001, and cognition, r = 0.21, p < 0.001 (Fig. 2).
Fig. 2
A boxplot of the relationship between average acceleration and IPAQ group. N = 69,060 participants (IPAQ low: 12,330; IPAQ moderate: 27,097; IPAQ high; 29,633). The red box represents people in the low IPAQ group; the green box people in the moderate IPAQ group; and the blue box those in the high IPAQ group. The line in the middle of the box represents the median acceleration (mg/week) for each group. The boxes represent the interquartile range (IQR) (first to third quartile (Q1 to Q3)); and the whiskers extend to Q1/Q3 – /+ 1.5 * the IQR.
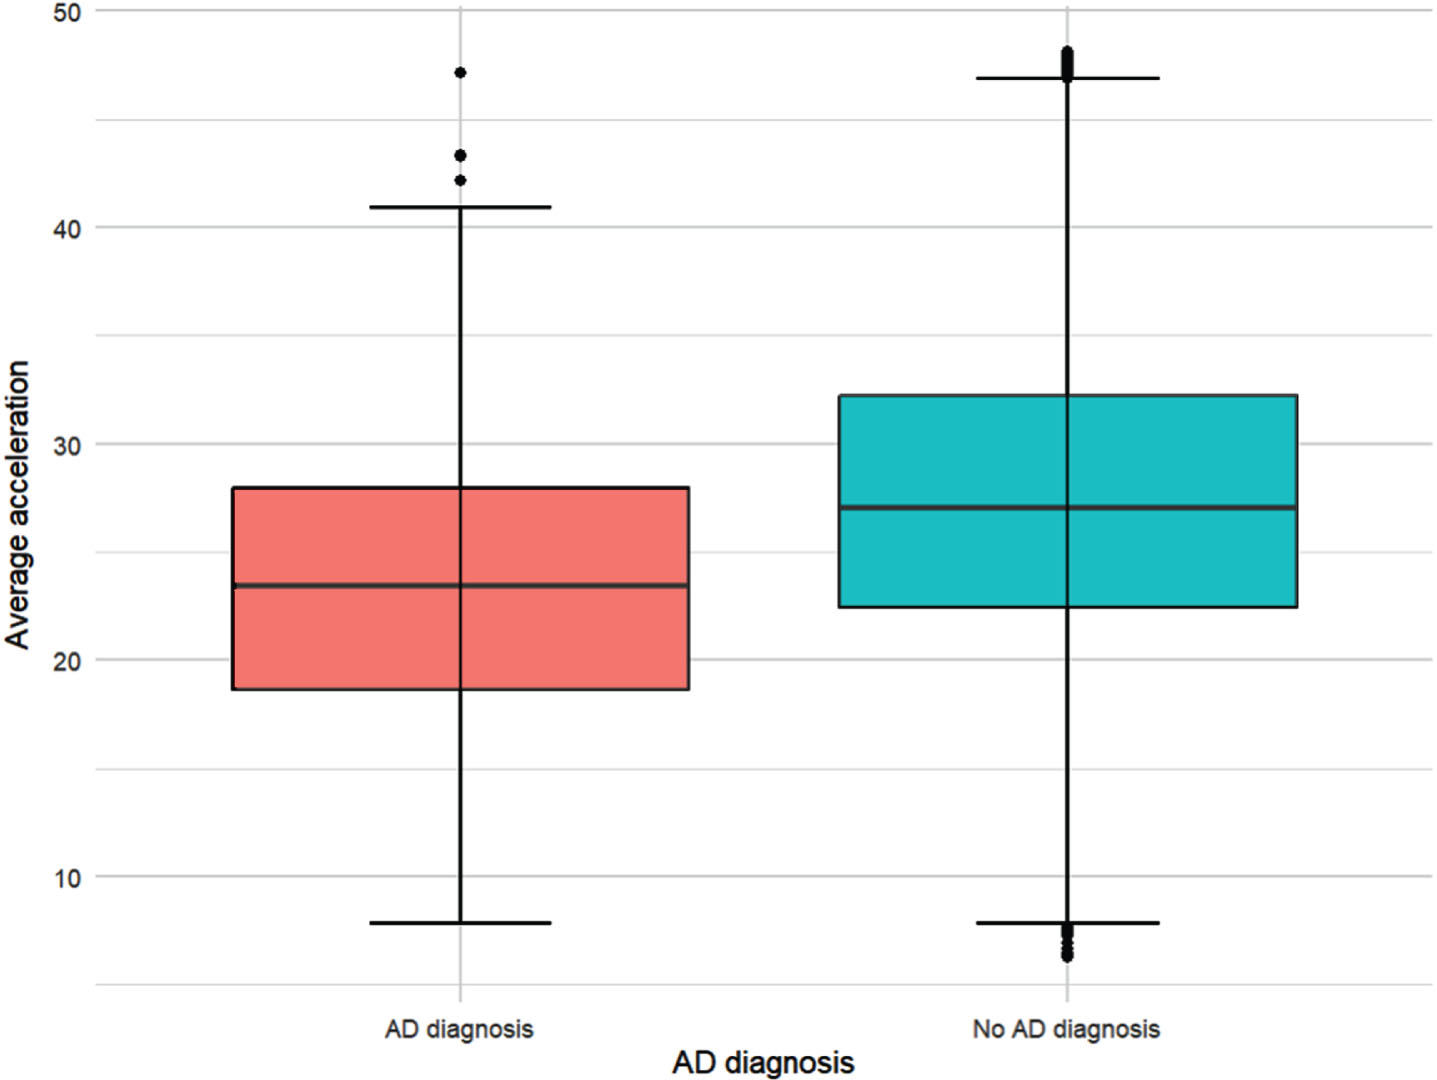
Higher levels of accelerometer-assessed PA were associated with a reduced risk of AD (OR [95% CI] = 0.96, [0.93, 0.98] p = 0.002) (Fig. 3).
Fig. 3
Average acceleration (mg/week) by AD diagnosis. N = 69,060 participants (141 with a diagnosis of AD; 68,919 without). The red box represents people with an AD diagnosis; and the blue box those without an AD diagnosis as of March 2023. The line in the middle of the box represents the median acceleration (mg/week) for each group. The boxes represent the interquartile range (IQR) (first to third quartile (Q1 to Q3)); and the whiskers extend to Q1/Q3 – /+ 1.5 * the IQR.
The OR of 0.96 in the full model represents a 4% reduction in the odds of receiving an AD diagnosis with an increase of 1 mg weekly accelerometer-assessed PA (see Methods for interpretation of units). Higher levels of self-reported PA were also associated with reduced AD risk. In the full model, participants with moderate activity levels were less likely to have AD than those with low activity, OR [95% CI] = 0.63, [0.40, 1.00], p = 0.047. In all AD incidence full models, APOE4 genotype was associated with increased AD risk for heterozygous (OR [95% CI] = 4.21, [2.93, 6.07], p < 0.001 (e.g., accelerometer-assessed PA)) and homozygous (OR [95% CI] = 15.14, [8.84, 25.01], p < 0.001 (e.g., accelerometer-assessed PA)) carriers. Findings for key predictors remained consistent in the Poisson model for accelerometer-assessed PA (Supplementary Table 4), but self-reported PA became non-significant in the self-reported PA Poisson regression model (Supplementary Table 6).
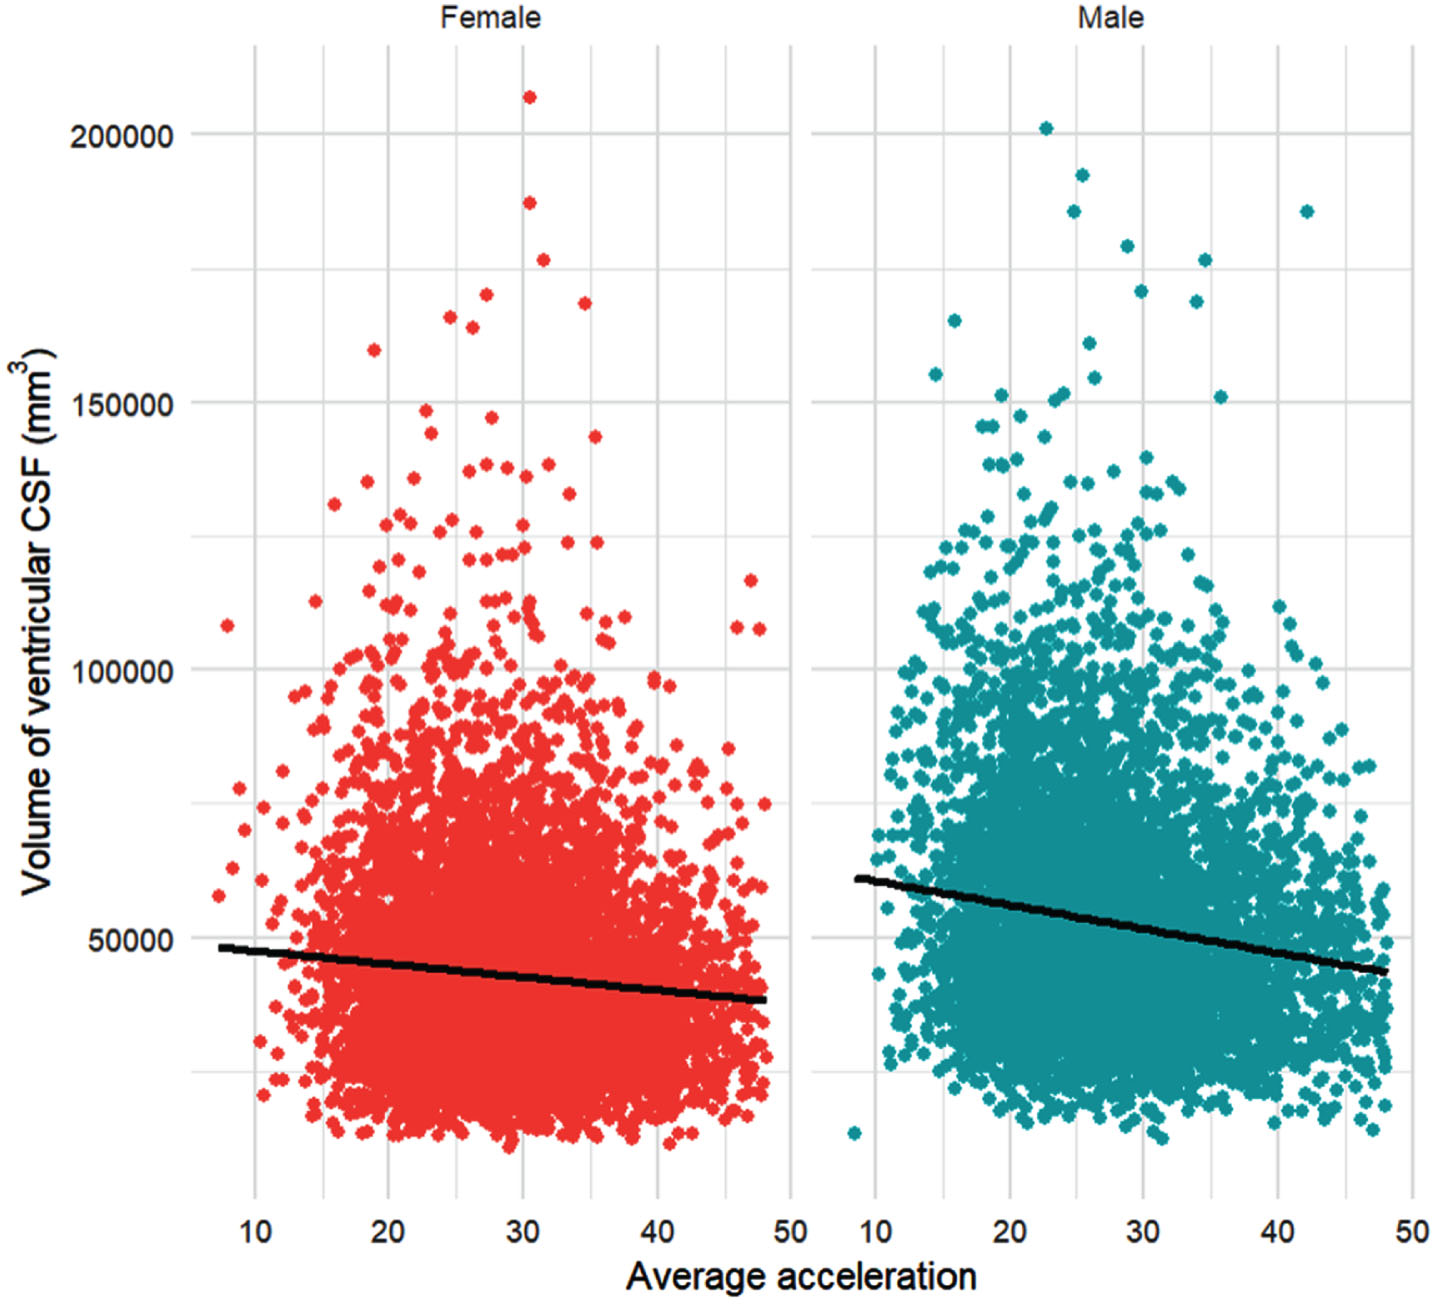
When associations between PA and ventricular CSF volume were assessed, higher levels of accelerometer-assessed PA were associated with a smaller ventricular CSF volume, in the full, β [95% CI] = – 63.54, [– 109.68, – 17.40], p = 0.007 model. The full model demonstrates that for every 1 mg/week increase in accelerometer-assessed PA; the volume of ventricular CSF reduces by 63.54 mm3 on average. In the initial model, there was a significant interaction between PA and sex, β [95% CI] = – 216.80, [– 328.52, – 105.08], p < 0.001. Compared to females, males had a larger ventricular CSF volume, and as acceleration increased, males experienced a steeper decline in this volume (Fig. 4).
Fig. 4
Average acceleration (mg/week) and volume of ventricular CSF (mm3), disaggregated by sex. N = 13,096 participants (6,105 male; 6,991 female). The red datapoints represent females, and the blue datapoints represent males. The lines of best fit represent the relationship between the volume of ventricular CSF (mm3) and average acceleration (mg/week).
Higher self-reported PA was associated with a larger ventricular CSF volume in the initial model, β [95% CI] = 1581.75, [12.12, 3151.38], p = 0.048; though this was non-significant in the full model. There was no evidence of APOE genotype influencing ventricular CSF volume (e.g., from accelerometer-assessed PA model: APOE4 heterozygous: β [95% CI] = 355.91, [– 373.73, 1085.55], p = 0.339; APOE4 homozygous: β [95% CI] = 722.92, [– 1337.00, 2782.83], p = 0.492.
There was little evidence of an effect of accelerometer-assessed PA on total brain volume; but those completing moderate levels of self-reported PA compared to those completing low levels had a larger total brain volume, β [95% CI] = 4398.46, [165.11, 8631.82], p = 0.042 in the full model. An interaction between IPAQ group and sex in the initial model β [95% CI] = 11430.15, [822.53, 22037.77], p = 0.035, occurred due to men having a larger brain volume on average. There was no evidence of an effect of APOE genotype on total brain volume in either the self-reported PA or accelerometer-assessed PA models (e.g., in the accelerometer-assessed PA model: APOE4 heterozygous: β [95% CI] = 1593.20, [– 1992.07, 5178.46], p = 0.384; APOE4 homozygous: β [95% CI] = – 527.74, [– 10649.64, 9594.17], p = 0.919.
There was little evidence of a relationship between accelerometer-assessed PA or self-reported PA alone on percentage correct scores on the SDST or the numeric memory task. Additionally, there was little evidence of an effect of APOE genotype on percentage correct scores on the SDST, numeric memory task, or pairs matching task, all p > 0.05 (see Supplementary Material).
There was a significant interaction between IPAQ-moderate and APOE4 heterozygous genotype on the numeric memory task, β [95% CI] = 1.13, [0.02, 2.25], p = 0.046; however, the higher-order interaction between self-reported PA and APOE genotype was non-significant, p = 0.092, suggesting little evidence of an interaction here.
Increasing accelerometer-assessed PA was associated with a faster RT, β [95% CI] = – 0.43, [– 0.68, – 0.18], p = 0.001; modified by APOE genotype, β [95% CI] = 0.94, [0.14, 1.75], p = 0.021. The decreasing RT with increasing accelerometer-assessed PA was more gradual for homozygous APOE4 carriers than non-carriers. self-reported PA was not associated with RT.
A longer duration to complete the TMT-B was associated with a higher self-reported PA group; high, β [95% CI] = 0.49, [0.31, 0.66], p < 0.001; moderate β [95% CI] = 0.27, [0.10, 0.45], p = 0.002, in the full model. The largest difference in mean duration to complete TMT-B was seen in high-activity APOE4 homozygous males, β [95% CI] = 2.80, [0.31, 5.29], p = 0.028; although the interaction between sex, APOE genotype, and self-reported PA in the initial model showed little evidence of interaction here, (p = 0.201). TMT-B duration was unrelated to accelerometer-assessed PA.
Higher accelerometer-assessed PA was associated with lower scores on the pairs matching task, β [95% CI] = – 0.06, [– 0.09, – 0.03], p < 0.001. Although the interaction term between IPAQ-moderate and APOE4 heterozygous carriers was significant, β [95% CI] = 2.13, [0.05, 4.20], p = 0.045, inspection of the higher-order interaction term demonstrated little evidence of interaction, p = 0.213.
Post-hoc sensitivity analyses showed that neither the best nor worst case scenarios affected the significance of any of the key predictors for the outcomes of AD incidence, volume of ventricular CSF, reaction time, or percentage correct on the pairs matching task (see Supplementary Material 2, Supplementary Tables 28–51). For the outcome of total brain volume, IPAQ group became unable to significantly predict this outcome in both the best, and worst, case models. Additionally, for duration to complete the TMT-B, IPAQ group remained significantly able to predict this in both best- and worst-case models; but average acceleration was also able to predict mean duration (higher acceleration associated with longer duration to complete the task).
DISCUSSION
This study examined the relationship between modifiable and non-modifiable risk factors for AD, and their effect on AD incidence and brain health. Increasing accelerometer-assessed PA and self-reported PA levels were associated with decreased AD risk and improvements in brain structure. PA showed some relationship with cognition; but findings were less clear than for other outcomes.
Accelerometer-assessed PA and self-reported PA predicted AD independently. This suggests that regardless of non-modifiable (sex and APOE genotype) and modifiable risk factor (health and lifestyle) status, increasing PA levels decreases the risk of AD. Only 141/69,060 people had received a diagnosis of AD at the time of publication, demonstrating the strength of PA as a predictor for AD. This supports the position that physical inactivity is a key modifiable risk factor for AD.
As accelerometer-assessed PA increased, the volume of ventricular CSF decreased. An increase in ventricular CSF volume is a key predictor of AD;6 therefore, this represents an additional mechanism through which PA may contribute to reduced AD risk. The preservation of ventricular volume may stem from improved maintenance of white and grey matter volume with increasing accelerometer-assessed PA.27,43 Sex-specific exercise preferences may influence the interaction between sex and accelerometer-assessed PA. Women typically focus more on lower body and weight loss exercises, while men prioritize enjoyment and muscle gain.44 This result aligns with findings that PA correlates with brain volume in men alone.33 The larger decrease in ventricular CSF volume with increasing PA in men may be partly attributed to better-preserved grey matter volume.
Moderate self-reported PA was associated with larger total brain volume compared to low activity. This somewhat aligns with findings that PA is linearly related to brain volume.27,45,46 However, brain volume was unaffected by accelerometer-assessed PA, and there was no difference between high and low IPAQ groups. Varied exercise intensities can contribute to brain volume maintenance,45 so it is possible that the typical intensity of PA performed was insufficient to alter brain volume. The interaction between self-reported PA and sex was the result of men having on average, larger brain volume than women; both showed similar trends.
Increasing accelerometer-assessed PA was associated with faster RT. Performing PA provides an opportunity to quicken responses and train cognitive skills that contribute to improved reaction times.47 Slower RT is associated with MCI and AD,48,49 but the mechanism linking this is unclear.48 Faster RT in older adults is associated with reduced fall risk,50 demonstrating the importance of PA in this population.
Surprisingly, compared to low activity, moderate and high self-reported PA levels were associated with a slower duration to complete the TMT-B. All combinations of sex and APOE genotype took longer to complete the TMT-B with increasing activity, except for homozygous APOE4 females. This contrasts with the finding that high levels of PA can mitigate accelerated cognitive decline in APOE4 carriers;51 though the small number of homozygous APOE4 participants here may influence the findings.
Increasing accelerometer-assessed PA was associated with worse visuospatial ability. However, further inspection of the data revealed that the difference between average percentage correct score on the pairs matching task between participants with low and high acceleration values was negligible. Neither processing speed nor memory were predicted by accelerometer-assessed PA or self-reported PA alone. Both have been associated with PA;52–55 though the null findings here may be the result of ceiling effects, as participants achieved high percentage correct scores.
Accelerometer-assessed PA and self-reported PA were well-matched, suggesting that responses were reliable. Despite this, they did not always predict the same outcomes. This may be as the IPAQ uses categories whereas accelerometer data records activity continuously. accelerometer-assessed PA and self-reported PA correspond well at the population level, however, on a case-by-case basis there may be discrepancies between them, leading to the disparity between the models.
This study had some key strengths. Firstly, the assessment of accelerometer-assessed PA and self-reported PA allowed for a better understanding of the relationship between both kinds of PA and the outcomes measured. Additionally, the large number of participants included in the study enabled the investigation of the relationship between PA and non-modifiable risk factors for AD. This demonstrated that there was some interaction between the two risk factor types, with possible implications for tailored physical activity interventions. Finally, the variables for this research were collected over a period of up to 17 years, allowing long-term associations between PA, and AD incidence, brain volume, and cognition to be ascertained.
Despite the strengths of this study, some limitations were present. Firstly, though numerous lifestyle covariates were included to account for relationships between these variables and PA; diet was not, as diet measurement in the UKB is complex and multi-faceted.56 Furthermore, causal relationships between variables cannot be drawn from the regression models used. Due to a small number of recorded AD diagnoses and large number of included covariates in the dataset, more appropriate time-to-event models would not converge so simpler regression models were used. Generalizability of the findings is limited by the lack of ethnic diversity in the UKB. Though the dataset was representative of the UK population at creation; it is now biased towards White participants.57
This study demonstrated that physical activity is related to AD incidence, brain volume, and cognition. Regardless of genetics and lifestyle factors, higher levels of PA can reduce AD risk. The relationship between physical activity and cognition was less clear here, though did suggest a role for physical activity in faster reaction times.
Finally, sex did mediate the relationship between physical activity and volume of ventricular cerebrospinal fluid; highlighting the importance of incorporating non-modifiable risk factors into data analysis to better understand how physical activity contributes to reduced Alzheimer’s disease risk. Future research could explore the relationship between PA and these outcomes in more diverse participants.
AUTHOR CONTRIBUTIONS
Felicity Spencer (Conceptualization; Data curation; Formal analysis; Methodology; Software; Visualization; Writing – original draft; Writing – review & editing); Richard Jonathan Elsworthy (Conceptualization; Methodology; Supervision; Writing – review & editing); Leigh Breen (Supervision; Writing – review & editing); Jonathan Bishop (Conceptualization; Data curation; Formal analysis; Methodology; Supervision; Validation; Writing – review & editing); Sol Morrissey (Conceptualization; Formal analysis; Methodology; Writing – review & editing); Sarah Aldred (Conceptualization; Methodology; Supervision; Writing – review & editing).
ACKNOWLEDGMENTS
This research has been conducted using the UK Biobank Resource under Application Number 99415. This work uses data provided by patients and collected by the NHS as part of their care and support.
FUNDING
Felicity Sarah Emma Spencer received funding provided by the MRC Trials Methodology Research Partnership (TMRP) Doctoral Training Partnership (DTP). Grant Number: MR/W006049/1.
CONFLICT OF INTEREST
The authors have no conflict of interest to report.
DATA AVAILABILITY
The data that support the findings of this study are available from the UK Biobank, but restrictions apply to the availability of these data, which were used under license (project number: 99415) for the current study, and so are not publicly available. Data are however available from the UK Biobank upon reasonable request.
SUPPLEMENTARY MATERIAL
[1] The supplementary material is available in the electronic version of this article: https://dx.doi.org/10.3233/JAD-240269.
REFERENCES
1. | NHS. What is dementia? https://www.nhs.uk/conditions/dementia/about-dementia/what-is-dementia/ ((2023) , accessed 11 November 2023). |
2. | World Health Organization. Dementia Fact Sheet, https://www.who.int/news-room/fact-sheets/detail/dementia ((2023) , accessed 11 November 2023). |
3. | World Health Organization. Dementia Fact Sheet, https://www.who.int/news-room/facts-in-pictures/detail/dementia ((2021) , accessed 11 November 2023). |
4. | Rajan K , Wilson R , Weuve J , et al. Cognitive impairment 18 years before clinical diagnosis of Alzheimer disease dementia. Neurology (2015) ; 85: : 898–904. |
5. | Tondelli M , Wilcock GK , Nichelli P , et al. Structural MRI changes detectable up to ten years before clinical Alzheimer’s disease. Neurobiol Aging (2012) ; 33: : e825–e836. |
6. | Li S , Okonkwo O , Albert M , et al. Variation in variables that predict progression from MCI to AD dementia over duration of follow-up. Am J Alzheimers Dis (Columbia) (2013) ; 2: : 12–28. |
7. | Voss SE and Bullock RA. Executive function: the core feature of dementia? Dement Geriatr Cogn Disord (2004) ; 18: : 207–216. |
8. | Jahn H . Memory loss in Alzheimer’s disease. Dialogues Clin Neurosci (2013) ; 15: : 445–454. |
9. | Corey-Bloom J . The ABC of Alzheimer’s disease: cognitive changes and their management in Alzheimer’s disease and related dementias. Int Psychogeriatr (2002) ; 14: (Suppl 1): 51–75. |
10. | Warkentin S , Erikson C , Janciauskiene S . rCBF pathology in Alzheimer’s disease is associated with slow processing speed. Neuropsychologia (2008) ; 46: : 1193–1200. |
11. | Gordon B and Carson K. The basis for choice reaction time slowing in Alzheimer’s disease. Brain Cogn (1990) ; 13: : 148–166. |
12. | Alzheimer’s Association. More women get Alzheimer’s than men: Why. https://www.alz.org/news/2020/more-women-get-alzheimer-s-than-men-why, ((2020) , accessed 12 November 2023). |
13. | Corder EH , Saunders AM , Strittmatter WJ , et al. Gene dose of apolipoprotein E type 4 allele and the risk of Alzheimer’s disease in late onset families. Science (1993) ; 261: : 921–923. |
14. | Altmann A , Tian L , Henderson VW , et al. Sex modifies the APOE-related risk of developing Alzheimer disease. Ann Neurol (2014) ; 75: : 563–573. |
15. | Hafsteinsdottir SH , Eiriksdottir G , Sigurdsson S , et al. Brain tissue volumes by APOE genotype and leisure activity-the AGES-Reykjavik Study. Neurobiol Aging (2012) ; 33: : e821–e828. |
16. | Small BJ , Rosnick CB , Fratiglioni L , et al. Apolipoprotein E and cognitive performance: a meta-analysis. Psychol Aging (2004) ; 19: : 592–600. |
17. | Livingston G , Huntley J , Sommerlad A , et al. Dementia prevention, intervention, and care: 2020 report of the Lancet Commission. Lancet (2020) ; 396: : 413–446. |
18. | Lopez-Ortiz S , Valenzuela PL , Seisdedos MM , et al. Exercise interventions in Alzheimer’s disease: A systematic review and meta-analysis of randomized controlled trials. Ageing Res Rev (2021) ; 72: : 101479. |
19. | de Frutos Lucas J , Sewell KR , Garcia-Colomo A , et al. How does apolipoprotein E genotype influence the relationship between physical activity and Alzheimer’s disease risk? A novel integrative model. Alzheimers Res Ther (2023) ; 15: : 22. |
20. | Beckett MW , Ardern CI , Rotondi MA . A meta-analysis of prospective studies on the role of physical activity and the prevention of Alzheimer’s disease in older adults. BMC Geriatr (2015) ; 15: : 9. |
21. | Zhong Q , Zhou R , Huang YN , et al. The independent and joint association of accelerometer-measured physical activity and sedentary time with dementia: a cohort study in the UK Biobank. Int J Behav Nutr Phys Activity (2023) ; 20: : 59. |
22. | del Pozo Cruz B , Ahmadi M , Naismith SL , et al. Association of daily step count and intensity with incident dementia in 78 430 adults living in the UK. JAMA Neurol (2022) ; 279: : 1059–1063. |
23. | Barreto PS , Andrieu S , Payoux P , et al. Physical activity and amyloid-beta brain levels in elderly adults with intact cognition and mild cognitive impairment. J Am Geriatr Soc (2015) ; 63: : 1634–1639. |
24. | Forbes D , Forbes SC , Blake CM , et al. Exercise programs for people with dementia. Cochrane Database Syst Rev (2015) ; 2015: : CD006489. |
25. | Coley N , Giulioli C , Aisen PS , et al. Randomised controlled trials for the prevention of cognitive decline or dementia: A systematic review. Ageing Res Rev (2022) ; 82: : 101777. |
26. | Andrieu S , Coley N , Lovestone S , et al. Prevention of sporadic Alzheimer’s disease: lessons learned from clinical trials and future directions. Lancet Neurol (2015) ; 14: : 926–944. |
27. | Spartano NL , Davis-Plourde KL , Himali JJ , et al. Association of accelerometer-measured light-intensity physical activity with brain volume: The Framingham Heart Study. JAMA Netw Open (2019) ; 2: : e192745. |
28. | Omura JD , Brown DR , McGuire LC , et al. Cross-sectional association between physical activity level and subjective cognitive decline among US adults aged >/=45 years, 2015. Prev Med (2020) ; 141: : 106279. |
29. | Niti M , Yap K-B , Kua E-H , et al. Physical, social and productive leisure activities, cognitive decline and interaction with APOE-epsilon4 genotype Chinese older adults. Int Psychogeriatr (2008) ; 20: : 237–251. |
30. | Fassier P , Kang JH , Lee IM , et al. Vigorous physical activity and cognitive trajectory later in life: prospective association and interaction by apolipoprotein E e4 in the Nurses’ Health Study. J Gerontol A Biol Sci Med Sci (2022) ; 77: : 817–825. |
31. | Barha CK , Best JR , Rosano C , et al. Sex-specific relationship between long-term maintenance of physical activity and cognition in the Health ABC Study: potential role of hippocampal and dorsolateral prefrontal cortex volume. J Gerontol A Biol Sci Med Sci (2020) ; 75: : 764–770. |
32. | Smith JC , Nielson KA , Woodard JL , et al. Physical activity reduces hippocampal atrophy in elders at genetic risk for Alzheimer’s disease. Front Aging Neurosci (2014) ; 6: : 61. |
33. | Brown BM , de Frutos Lucas J , Porter T , et al. Non-modifiable factors as moderators of the relationship between physical activity and brain volume: A cross-sectional UK Biobank study. J Alzheimers Dis (2022) ; 88: : 1091–1101. |
34. | von Elm E , Altman DG , Egger M , et al. The Strengthening the Reporting of Observational Studies in Epidemiology (STROBE) statement: guidelines for reporting observational studies. Lancet (2007) ; 370: : 1453–1457. |
35. | Allen N , Sudlow C , Downey P , et al. UK Biobank: Current status and what it means for epidemiology. Health Policy Technol (2012) ; 1: : 123–126. |
36. | Hagstromer M , Oja P , Sjostrom M . The International Physical Activity Questionnaire (IPAQ): a study of concurrent and construct validity. Public Health Nutr (2006) ; 9: : 755–762. |
37. | Doherty A , Jackson D , Hammerla N , et al. Large scale population assessment of physical activity using wrist worn accelerometers: The UK Biobank Study. PLoS One (2017) ; 12: : e0169649. |
38. | Dibben GO , Gandhi MM , Taylor RS , et al. Physical activity assessment by accelerometry in people with heart failure. BMC Sports Sci Med Rehabil (2020) ; 12: : 47. |
39. | UK Biobank Brain Imaging Documentation, https://biobank.ctsu.ox.ac.uk/crystal/crystal/docs/brain_mri.pdf, ((2022) , accessed 15 November 2023). |
40. | Faul F , Erdefelder E , Lang A-G , et al. G*Power 3: A flexible statistical power analysis program for the social, behavioral, and biomedical sciences. Behav Res Methods (2007) ; 39: : 175–191. |
41. | Petermann-Rocha F , Lyall DM , Gray SR , et al. Dose-response association between device-measured physical activity and incident dementia: a prospective study from UK Biobank. BMC Med (2021) ; 19: : 305. |
42. | Rowlands AV , Dempsey PC , Gillies C , et al. Association between accelerometer-assessed physical activity and severity of COVID-19 in UK Biobank. Mayo Clin Proc Innov Qual Outcomes (2021) ; 5: : 997–1007. |
43. | Wood KN , Nikolov R , Shoemaker JK . Impact of long-term endurance training vs. guideline-based physical activity on brain structure in healthy aging. Front Aging Neurosci (2016) ; 8: : 155. |
44. | Craft BB , Carrol Haley A , Lustyk M , et al. Gender differences in exercise habits and quality of life reports: assessing the moderate effects of reasons for exercise. Int J Lib Arts Soc Sci (2014) ; 2: : 65–76. |
45. | Tan ZS , Spartano NL , Beiser AS , et al. Physical activity, brain volume, and dementia risk: The Framingham Study. J Gerontol A Biol Sci Med Sci (2017) ; 72: : 789–795. |
46. | Melo Neves L , Ritti-Dias R , Juday V , et al. Objective physical activity accumulation and brain volume in older adults: an MRI and whole-brain volume study. J Gerontol A Biol Sci Med Sci (2023) ; 78: : 902–910. |
47. | Reigal RE , Barrero S , Martin I , et al. Relationships between reaction time, selective attention, physical activity, and physical fitness in children. Front Psychol (2019) ; 10: : 2278. |
48. | Andriuta D , Diouf M , Roussel M , et al. Is reaction time slowing an early sign of Alzheimer’s disease? A meta-analysis. Dement Geriatr Cogn Disord (2019) ; 47: : 281–288. |
49. | Sano M , Rosen W , Stern Y , et al. Simple reaction time as a measure of global attention in Alzheimer’s disease. J Int Neuropsychol Soc (1995) ; 1: : 56–61. |
50. | Okubo Y , Schoene D , Lord SR . Step training improves reaction time, gait and balance and reduces falls in older people: a systematic review and meta-analysis. Br J Sports Med (2017) ; 51: : 586–593. |
51. | Galle SA , Liu J , Bonnechere B , et al. The long-term relation between physical activity and executive function in the Rotterdam Study. Eur J Epidemiol (2023) ; 38: : 71–81. |
52. | Rathore A , Lom B . The effects of chronic and acute physical activity on working memory performance in healthy participants: a systematic review with meta-analysis of randomized controlled trials. Syst Rev (2017) ; 6: : 124. |
53. | Frederiksen KS , Jensen CS , Hogh P , et al. Aerobic exercise does not affect serum neurofilament light in patients with mild Alzheimer’s disease. Front Neurosci (2023) ; 17: : 1108191. |
54. | Erickson KI , Hillman C , Stillman CM . Physical activity, cognition, and brain outcomes: a review of the 2018 Physical Activity Guidelines. Med Sci Sports Exerc (2019) ; 51: : 1242–1251. |
55. | Hoffmann CM , Petrov ME , Lee RE . Aerobic physical activity to improve memory and executive function in sedentary adults without cognitive impairment: A systematic review and meta-analysis. Prev Med Rep (2021) ; 23: : 101496. |
56. | Shannon OM , Ranson JM , Gregory S , et al. Mediterranean diet adherence is associated with lower dementia risk, independent of genetic predisposition: findings from the UK Biobank prospective cohort study. BMC Med (2023) ; 21: : 81. |
57. | Fry A , Littlejohns TJ , Sudlow C . Comparison of sociodemographic and health-related characteristics of UK Biobank participants with those of the general population. Am J Epidemiol (2017) ; 186: : 1026–1034. |


