
Relationship Between Cerebrospinal Fluid Alzheimer’s Disease Biomarker Values Measured via Lumipulse Assays and Conventional ELISA: Single-Center Experience and Systematic Review
Abstract
Background:
Although Lumipulse assays and conventional ELISA are strongly correlated, the precise relationship between their measured values remains undetermined.
Objective:
To determine the relationship between Lumipulse and ELISA measurement values.
Methods:
Patients who underwent cerebrospinal fluid (CSF) Alzheimer’s disease (AD) biomarker measurements and consented to biobanking between December 2021 and June 2023 were included. The relationship between values measured via Lumipulse assays and conventional ELISA were evaluated by Passing-Bablok analyses for amyloid-β 1-42 (Aβ42), total tau (t-tau), and phospho-tau 181 (p-tau 181). Studies using both assays were systematically searched for in PubMed and summarized after quality assessment.
Results:
Regression line slopes and intercepts were 1.41 (1.23 to 1.60) and –77.8 (–198.4 to 44.5) for Aβ42, 0.94 (0.88 to 1.01) and 98.2 (76.9 to 114.4) for t-tau, and 1.60 (1.43 to 1.75) and –21.1 (–26.9 to –15.6) for p-tau181. Spearman’s correlation coefficients were 0.90, 0.95, and 0.95 for Aβ42, t-tau, and p-tau181, respectively. We identified 13 other studies that included 2,117 patients in total. Aβ42 slope varied among studies, suggesting inter-lab difference of ELISA. The slope and intercept of t-tau were approximately 1 and 0, respectively, suggesting small proportional and systematic differences. Conversely, the p-tau181 slope was significantly higher than 1, distributed between 1.5–2 in most studies, with intercepts significantly lower than 0, suggesting proportional and systematic differences.
Conclusions:
We characterized different relationship between measurement values for each biomarker, which may be useful for understanding the differences in CSF biomarker measurement values on different platforms and for future global harmonization.
INTRODUCTION
Alzheimer’s disease (AD), a leading cause of dementia, is characterized by amyloid-β plaques and phosphorylated tau tangles in the brain. Clinical diagnosis is not sufficiently specific [1] and biological confirmation via biomarkers is important [2, 3]. Measurement of cerebrospinal fluid (CSF) biomarkers is one of the main approaches for biological confirmation of the brain pathology [4–8] and various studies have confirmed that measurement of CSF Aβ 1-42 (Aβ42), total tau (t-tau), and tau phosphorylated at threonine 181 (p-tau 181) are useful for AD diagnosis [9]. Previous studies have predominantly used conventional enzyme-linked immunosorbent assays (ELISA) such as INNOTEST (Fujirebio Europe N.V., Ghent, Belgium) to measure Aβ42, t-tau, and p-tau 181, whereas Aβ42/40 ratio is currently recommended over Aβ42 itself [10, 11]. Widespread usage of CSF AD biomarkers is expected until blood-based biomarkers become available in clinical practice, for implementing disease-modifying therapies. However, comparing results measured by different laboratories or analytical platforms is difficult and efforts towards global standardization and quality control are ongoing worldwide [12, 13].
Fully automated immunoassays, including those using the LUMIPULSE system (FUJIREBIO INC., Tokyo, Japan), are advantageous because they reduce inter and intra-laboratory variations via automation [14]. These assays are now receiving approvals from local authorities worldwide and replacing conventional ELISA. Although strong correlations have been repeatedly reported between Lumipulse assays and conventional ELISA [15–25], their measurement values do not seem to be necessarily interchangeable, hampering the seamless understanding of previous and future AD biomarker studies. The relationship between these measurement values could be affected by differences in methodology between institutions/studies, or by the fundamental nature of assay characteristics.
The aim of this study was to elucidate the relationship between CSF AD biomarker values measured using Lumipulse assays and conventional ELISA.
MATERIALS AND METHODS
Participants and settings
All patients who underwent lumbar puncture for CSF biomarker measurement at the Tokyo Metropolitan Institute for Geriatrics and Gerontology between December 2021 and June 2023 were recruited for the Tokyo Medical Biobank. Those who consented to biobanking with sufficient remaining CSF samples were subjected to measurements using both Lumipulse assays and conventional ELISA as quality controls. The measured data from all patients with measurement results from both assays were retrospectively reviewed. This study was approved by the Institutional Review Board of the Tokyo Metropolitan Institute for Geriatrics and Gerontology. The remaining CSF, serum, and plasma samples were stored as part of the Tokyo Medical Biobank for future study.
Sample collection and storage
CSF samples were obtained using a standard lumbar puncture procedure. The first tube was sent for cell counting and routine biochemical testing. Subsequent CSF samples were directly collected in polypropylene low-binding tubes after confirming the absence of visible blood contamination, as recommended [26].
For the measurement of Aβ42, t-tau, and p-tau 181 using Lumipulse assays, CSF was directly collected into 2.5 mL sterile polypropylene low-binding tubes (False bottom tube CSF, Sarstedt AG & Ci. KG, Nümbrecht, Germany, Cat# 63.614.625) and stored at –80°C until measurement. The storage time before biomarker analysis was within eight months. Before amendment of the biobank protocol, CSF samples of 19 patients were directly collected into polypropylene low-binding tubes and aliquoted into 1.5 mL tubes (Proteosave SS 1.5 mL, Sumitomo Bakelite Co., Ltd., Tokyo, Japan, Cat# MS-4202X) and stored at –80°C until measurement. The storage time before biomarker analysis was within eight months. The measurement results of these samples using different handling methods were visually plotted and carefully evaluated to determine the possibility of bias before inclusion in the main analyses.
For the measurement of CSF p-tau 181 via ELISA, CSF was directly collected into an autoclaved 4 mL polypropylene tube (Serum tube, Sumitomo Bakelite Co., Ltd., Cat# MS-4604) as instructed, stored at –20 to –30°C, and collected the same day by a clinical laboratory company—LSI Medience Cooperation (Tokyo, Japan). The storage time before biomarker analysis was within two months.
For the measurement of Aβ42 and t-tau via ELISA, CSF was directly collected into polypropylene low-binding tubes and aliquoted into 1.5 mL tubes (Proteosave SS 1.5 mL, Sumitomo Bakelite Co., Ltd.) and stored at –80°C until measurement. The storage time before biomarker analysis was within 16 months.
Lumipulse assays
Measurements of CSF Aβ42, p-tau 181, and t-tau were conducted at FUJIREBIO INC. using LUMIPULSE G1200 and immunoreaction cartridges/calibration sets: β-amyloid 1-42 (Cat# 230336/260258), pTau 181 (Cat# 230350/260227), and Total Tau (Cat# 230312/260203). The intra-assay coefficient of variation (CV) for Aβ42, p-tau 181, and t-tau were 1.8–3.1, 0.8–3.3, and 2.7–4.4%, respectively, as stated by the manufacturer. Cut-off values for p-tau 181 and t-tau were predetermined at 56.5 and 404 pg/mL, respectively.
ELISA
The measurement of CSF p-tau 181 via ELISA was conducted at Tokiwa Chemical Industries Co., Ltd. (Tokyo, Japan) using the Finoscholar ELISA kit (Nipro Corp., Osaka, Japan), which is identical to the INNOTEST (Fujirebio Europe N.V.) assay [27]. CV was < 10%. The lower limit of quantification and reporting was 25 pg/ml. The cutoff value was set at 50 pg/mL.
The measurements of CSF Aβ42 and t-tau were conducted at Tokyo Metropolitan Institute for Geriatrics and Gerontology using INNOTEST β-amyloid (1-42) (Fujirebio Europe N.V.) and Finoscholar hTau (Nipro Corp.) performed as per manufacturer’s instructions. Intra-laboratory CV for CSF Aβ42 was calculated using the duplicated measurement results of run validation control (RVC) on three different days. The intra-laboratory CV was 7.1% using RVC2 (low concentration) and 10.8% using RVC1 (high concentration). Institutional cutoff values were predetermined at 500 and 300 pg/mL based on previous results [8, 28, 29].
Statistical analysis
Statistical analyses were conducted using MedCalc Statistical Software version 20.218 (MedCalc Software Ltd., Ostend, Belgium; https://www.medcalc.org; 2023). GraphPad Prism version 9 (GraphPad Software, San Diego, CA, USA) was used to generate graphs in the Supplementary Material. Samples with biomarker concentrations below the lower quantification limit were plotted and are provided in the scatter plot but were excluded from the main analyses. Missing data were addressed using a pairwise deletion approach. Categorical variables were presented as percentages and continuous variables were presented as mean±SD after confirming normal distribution. The differences in CSF biomarker measurement values between Lumipulse assays and conventional ELISA were visualized using Bland-Altman difference plots [30]. Regression lines for CSF concentration of Aβ42, t-tau, and p-tau 181 measured via Lumipulse assays and conventional ELISA were evaluated using the Passing-Bablok analysis, which is a robust non-parametric regression analysis assuming error in both x- and y-axis [31] suitable and recommended for method comparison studies in a situation when normal distribution is difficult to assume [32, 33]. Perpendicular residuals were used for the calculations. The median and 95% confidence intervals (95% CI) of the slope and intercept of the regression equation for each biomarker are provided. With sufficient sample size and small residuals, 95% CI of the slope including 1 and 95% CI of the intercept including 0 suggest a non-significant bias [31]. Residuals from the regression lines were also plotted in rank order, and the 95% CI are depicted in the figures. Although not necessarily recommended for assessing the agreement between the two analytical methods, Spearman’s correlation coefficients were also reported with 95% CI for comparison with previous studies.
Sample size estimate
A sufficient sample size for the Passing-Bablok analysis has been reported to be 30–90 when the relevant difference is defined as 10%, the measurement range is large, and sampling is uniform [34]. The Clinical and Laboratory Standards Institute (CLSI) guidelines for comparison of measurement procedures and bias estimation suggest at least 100 for manufacturing validation studies and 40 for those conducted in medical laboratories [32]. An interim analysis was conducted with a sample size of 66 and the sample size was increased to over 100 for p-tau181 based on the observed results.
Systematic review
A systematic review was conducted in compliance with the Preferred Reporting Items for Systematic Reviews and Meta-analysis (PRISMA) 2020 statement [35]. The protocol was registered with PROSPERO before formal screening (CRD 42023406903). Existing literature on the relationship between CSF AD biomarkers between Lumipulse assays and ELISA was screened from the PubMed database from 2017 (when the first Lumipulse AD biomarker assay β-amyloid 1-42 was released) to 2023; searched on April 6, 2023. The terms used were as follows: LUMIPULSE, CLEIA, “Chemiluminescent enzyme immunoassay,” Chemiluminescent AND Alzheimer, Fully-automated AND Alzheimer, and Biomarker AND Commutability. The inclusion criteria for the study were as follows: measurement of CSF AD biomarkers in the same samples using both Lumipulse assays and ELISA. The exclusion criteria were as follows:<10 cases and inability to extract data related to regression or correlation characteristics. Two authors (M.K. and S.K.) independently conducted the literature search and any disagreements were resolved through discussion. After selecting articles based on these criteria, their reference lists were also carefully assessed, and those meeting the criteria were included in the study.
The quality assessment of each study was conducted based on a quality assessment tool specific to biomarker measurement procedure comparison studies (QUABICS) (described in the Supplementary Material), which was modified from a quality assessment tool for cross-sectional studies of biomarker data (BIOCROSS) [36]. The quality of each study was assessed “as a study assessing the relationship between biomarker values measured in two assays” and not the study itself. Many studies provided biomarker correlation or regression data as a part of publication with different major objectives. Information on all studies is provided in tables, and only studies with moderate or high quality based on quality assessment scores were included in the forest plots and meta-analyses.
Primary information extracted from the literature included patient characteristics, measurement conditions, statistical methods, slopes and intercepts of the regression line, and correlation coefficients. The primary outcome measures were the slope and intercept of the regression line. The additional outcome measure was the correlation coefficient. Meta-analyses were conducted using a random-effects model. For the meta-analysis of slopes and intercepts, only studies reporting effective confidence intervals were included and analyzed using STATA/MP 18 (StataCorp LLC, TX, USA). For the meta-analysis of correlation coefficients, studies reporting mean values and sample sizes were included and analyzed using MedCalc version 20.218. Funnel plots were created to assess the possibility of publication bias.
RESULTS
Demographic characteristics of the participants
During this period, 166 patients who underwent lumbar puncture were recruited, and 138 consented for the Tokyo Medical Biobank. Sufficient CSF was unavailable in three patients because of technical difficulties. The remaining 135 patients were included in the study (recruitment rate: 81.3%). The demographic characteristics and availability of biomarker results of the participants are summarized in Table 1. Patients with frontotemporal lobar degeneration (FTLD) included those clinically diagnosed with frontotemporal dementia (FTD, n = 7), corticobasal syndrome (CBS, n = 9), or progressive supranuclear palsy (PSP, n = 3). Patients with other diseases included those clinically diagnosed with multiple system atrophy (n = 4), hydrocephalus (n = 4), amyotrophic lateral sclerosis (n = 2), and neuronal intranuclear inclusion disease (NIID, n = 2).
Table 1
Demographic characteristics and biomarker result availability of the 135 participants
| AD | DLB | FTLD | MCI (other) | PD | Other diseases | Total | |
| number of patients | 26 | 8 | 19 | 9 | 46 | 27 | 135 |
| Age (y) | 64.9±10.7 | 78.5±5.9 | 71.1±10.2 | 68.0±11.7 | 72.7±9.8 | 72.4±10.0 | 70.9±10.5 |
| Sex, Female% | 65.4% | 62.5% | 68.4% | 33.3% | 43.5% | 51.9% | 53.3% |
| LUMIPULSE results | 100% | 100% | 100% | 100% | 100% | 100% | 100% |
| p-tau181 ELISA results (in measurement range) | 100% (100%) | 100% (87.5%) | 100% (94.7%) | 100% (88.9%) | 100% (71.7%) | 100% (96.3%) | 100% (87.4%; 118/135) |
| Aβ42 and t-tau ELISA results | 50.0% | 50.0% | 47.4% | 44.4% | 48.1% | 50.0% | 48.9% (66/135) |
| APOE phenotype results | 88.5% | 87.5% | 84.2% | 100% | 89.1% | 100% | 91.1% |
| APOE ɛ4 carrier | 39.1% (9/23) | 28.6% (2/7) | 31.3% (5/16) | 11.1% (1/9) | 24.4% (10/41) | 22.2% (6/27) | 26.8% (33/123) |
AD, Alzheimer’s disease; DLB, dementia with Lewy bodies; FTLD, frontotemporal lobar degeneration; MCI, mild cognitive impairment; PD, Parkinson’s disease; n/a, not available.
Relationship between Lumipulse and conventional ELISA measurement values for each biomarker
Based on the scatter plots and Bland-Altman difference plots (Supplementary Figure 1) we decided to include all measured samples, although the results of Aβ42 need to be interpreted with caution for the effect of tube difference. Spearman’s correlation coefficient was 0.90 [95% CI: 0.84 to 0.94] for Aβ42, 0.95 [95% CI: 0.93 to 0.97] for t-tau, and 0.95 [95% CI: 0.93 to 0.97] for p-tau181. Using predetermined cutoffs, the binary results matched between the two assays at 95% for t-tau and 92% for p-tau181. Bland-Altman difference plot showed that the value of Aβ42 and p-tau181 was lower in ELISA in the higher range (Supplementary Figure 1D, F) suggesting proportional differences.
Passing-Bablok regression lines and residual plots are provided in Fig. 1A–F. The Cusum test showed no significant deviation from linearity. The regression line slope for Aβ42 was higher than 1 (1.41 [95% CI: 1.23 to 1.60]), and the 95% CI of intercept included 0 (–77.8 [95% CI: –198.4 to 44.5]) indicating a proportional difference towards lower values measured via ELISA (Fig. 1A, G). The subgroup analysis results differentiating the sampling procedures are shown in Supplementary Figure 2. The 95% CI of the regression line slope for t-tau included 1 (0.94 [95% CI: 0.88 to 1.01]) and the intercept was slightly higher than 0 (98.2 [95% CI: 76.9 to 114.4]), indicating a small systemic difference towards lower values measured via ELISA (Fig. 1B, G). The regression line slope for p-tau181 was significantly higher than 1 (1.60 [95% CI: 1.43 to 1.75]) and the intercept was significantly lower than 0 (–21.1 [95% CI: –26.9 to –15.6]) indicating a proportional and systematic difference (Fig. 1C, G). While the difference plot for Aβ42 and t-tau did not show outliers, two outlier residual values for p-tau181 were observed (Fig. 1D–F).
Fig. 1
Passing-Bablok regression lines and residual plots for Aβ42, t-tau, and p-tau181 using Lumipulse and ELISA. Each point represents the measurement results for each participant. Passing-Bablok regression lines with 95% confidence intervals (A–C) and residuals from the regression line plotted by rank order (D–F) are shown for Aβ42, t-tau, and p-tau181. The diagonal dotted lines represent lines or equalities (x = y). The horizontal and vertical lines represent the predetermined cutoffs. In the residual plots, outliers, defined as residuals outside the 4 SD limit are shown as red squares (F). (G) Median [95% CI] of slopes and intercepts and±1.96 residual standard deviation (RSD) intervals are summarized. Aβ42, amyloid-β 1-42; t-tau, total tau; p-tau 181, tau phosphorylated at threonine 181; ELISA, enzyme-linked immunosorbent assay.
![Passing-Bablok regression lines and residual plots for Aβ42, t-tau, and p-tau181 using Lumipulse and ELISA. Each point represents the measurement results for each participant. Passing-Bablok regression lines with 95% confidence intervals (A–C) and residuals from the regression line plotted by rank order (D–F) are shown for Aβ42, t-tau, and p-tau181. The diagonal dotted lines represent lines or equalities (x = y). The horizontal and vertical lines represent the predetermined cutoffs. In the residual plots, outliers, defined as residuals outside the 4 SD limit are shown as red squares (F). (G) Median [95% CI] of slopes and intercepts and±1.96 residual standard deviation (RSD) intervals are summarized. Aβ42, amyloid-β 1-42; t-tau, total tau; p-tau 181, tau phosphorylated at threonine 181; ELISA, enzyme-linked immunosorbent assay.](https://ip.ios.semcs.net:443/media/jad/2024/99-3/jad-99-3-jad240185/jad-99-jad240185-g001.jpg)
4.3Systematic review
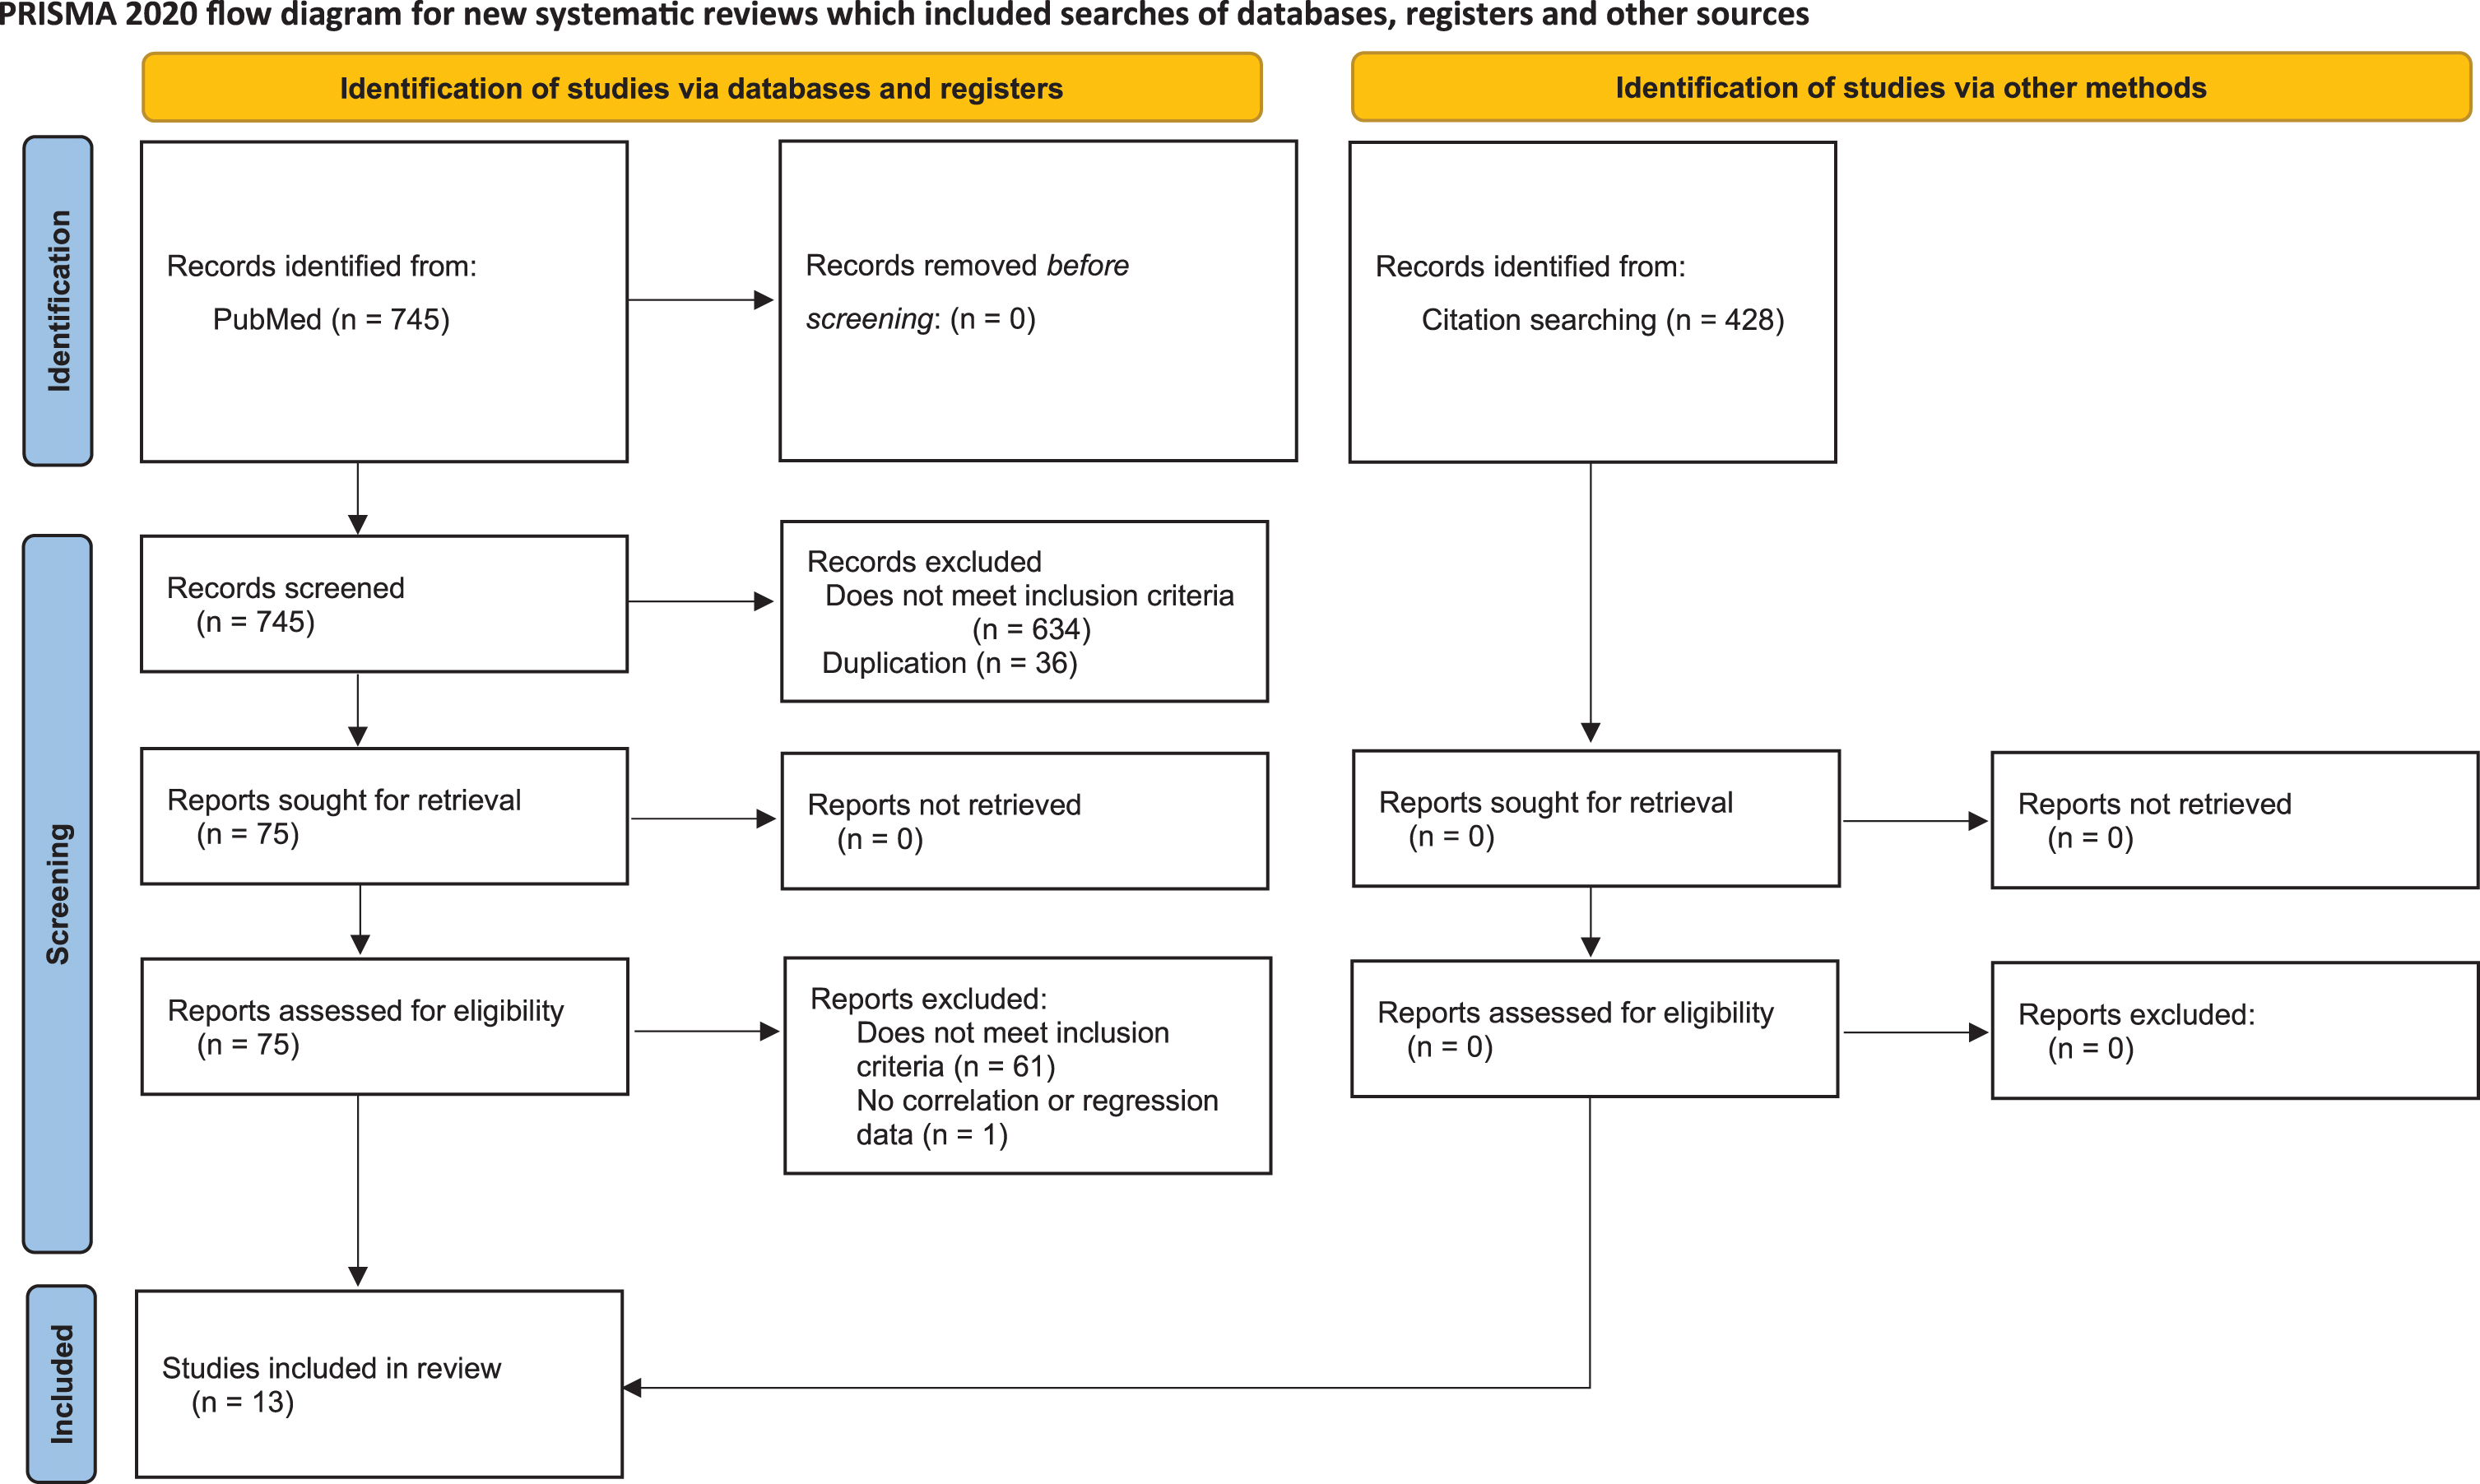
A flowchart of the screening process is provided in Fig. 2. First, 745 publications were identified via PubMed search. A total of 634 studies were excluded because they did not meet the inclusion criteria and thirty-six were excluded because of duplication. We carefully read the complete texts and supplementary materials of 75 publications and identified 13 that met the predetermined criteria. The reference lists of these publications were also evaluated, and we did not identify any additional publications that met the predetermined criteria. Therefore, 13 publications were included in this systematic review [15–25, 37, 38].
Fig. 2
Study screening process following the Preferred Reporting Items for Systematic Reviews and Meta-analysis (PRISMA) 2020.
A total of 2,117 patients were included in 13 studies (Table 2). Eleven studies were conducted in European countries, one was from the United States, and one was from Korea. The disease types of the populations included in the studies were AD dementia, mild cognitive impairment (MCI), cognitive normal, subjective cognitive decline, and other disease controls. Seven studies used Passing-Bablok analysis of the actual values to determine the regression line, whereas some studies used Pearson’s correlation line or log transformation before analyses or did not report the method to analyze the regression line. To measure the correlation coefficients, five studies used Pearson’s method, and five studies used Spearman’s method with actual values.
Table 2
Baseline characteristic information of studies included in the systematic review
| Author | Year | Participant | Number of participants | Statistical method for regression line | Statistical methods for correlation coefficient | ||||
| Country | Total | AD | MCI | CN | Disease Control | ||||
| Andreasson et al. | 2018 | Sweden | 34 | n/a | n/a | n/a | n/a | Passing-Bablok | Spearman |
| Kollhoff et al. | 2018 | USA | 30 | 6 | 12 | 9 | other dementia 3 | linear versus quadratic | log-transformed Pearson |
| Alcorea et al. | 2019 | Spain | 94 | 12 | 35 | 6 | DLB 30, FTD 9, other 2 | n/a | Pearson |
| Bayart et al. | 2019 | Belgium | 156 | 44 | 23 | 11 | other dementia 36 | Passing-Bablok | n/a |
| Leitão et al. | 2019 | Portugal | 120 | 80 | 0 | 40 | none | Passing-Bablok | Spearman |
| Paciotti et al. | 2019 | Italy | 80 | 42 | 23 | 0 | SCD 7, headache 4 epilepsy 3, psychiatric 1 | n/a | Spearman |
| Zecca et al. | 2019 | Italy | 49 | 16 | 12 | 0 | FTD 7, SCD 5, PD 4, ALS 3, DLB 1, CIDP 1 | Passing-Bablok | Pearson |
| Dakterzada et al. | 2021 | Spain | 149 | 34 | 94 | 0 | other dementia 21 | Pearson | Pearson |
| Keshavan et al. | 2021 | UK | 72 | n/a | n/a | n/a | n/a | log-transformed Pearson | log-transformed Pearson |
| Moon et al. | 2021 | Korea | 139 | 23 | 29 | 29 | SCD 58 | log-transformed Passing-Bablok | Spearman |
| Arcaro et al. | 2022 | Italy | 111 | 31 | 0 | 31 | other dementia 49 | Passing-Bablok | Pearson |
| Gobom et al. | 2022 | Sweden | 354 | n/a | n/a | n/a | n/a | Passing-Bablok | Pearson |
| Orellana et al. | 2022 | Spain | 729 | 37 | 647 | 0 | SCD 45 | Passing-Bablok | Spearman |
| Kurihara et al. | 2024 | Japan | 135 | 26 | 9 | 0 | DLB 8, FTLD 19, PD 46, MSA 4, iNPH 4, ALS 2, NIID 2 | Passing-Bablok | Spearman |
USA, United States of America; UK, United Kingdom; AD, Alzheimer’s disease (dementia); MCI, mild cognitive impairment; CN, cognitive normal; DLB, dementia with Lewy bodies; FTD, frontotemporal dementia; SCD, subjective cognitive decline; PD, Parkinson’s disease; ALS, amyotrophic lateral sclerosis; CIDP, chronic inflammatory demyelinating polyneuropathy; FTLD, frontotemporal lobar degeneration; MSA, multiple system atrophy; iNPH, idiopathic normal pressure hydrocephalus; ALS, amyotrophic lateral sclerosis; NIID, neuronal intranuclear inclusion disease; n/a, not available.
The results of the quality assessment as a biomarker measurement procedure comparison study using the QUABICS assessment tool are presented in Table 3. The agreement between the two raters and distribution of the total scores are summarized in Supplementary Figures 3 and 4. Four and six studies were evaluated to be of high and medium quality, respectively (Table 3).
Table 3
Quality assessment of studies based on the biomarker measurement procedure comparison studies (QUABICS) assessment tool
| Author | Total score | 1. Study Rational | 2-1. Study population selection | 2-2. Study population representativeness | 2-3. Study population characteristics | 3-1. Sampling and handling | 3-2. Detailed method description | 3-3. QC of each measurement | 4-1. Data analysis method | 4-2. Data reporting | 5. Data interpretation |
| Andreasson et al. | 12 | 2 | 0 | 0 | 0 | 2 | 2 | 2 | 2 | 0 | 2 |
| Kollhoff et al. | 11 | 2 | 1 | 0 | 2 | 2 | 2 | 1 | 0 | 0 | 1 |
| Alcorea et al. | 10 | 1 | 1 | 1 | 2 | 2 | 2 | 1 | 0 | 0 | 0 |
| Bayart et al. | 14 | 2 | 1 | 1 | 2 | 2 | 0 | 1 | 2 | 2 | 1 |
| Leitão et al. | 17 | 2 | 1 | 1 | 2 | 2 | 2 | 1 | 2 | 2 | 2 |
| Paciotti et al. | 10 | 2 | 1 | 1 | 2 | 2 | 1 | 0 | 0 | 0 | 1 |
| Zecca et al. | 17 | 2 | 1 | 0 | 2 | 2 | 2 | 2 | 2 | 2 | 2 |
| Dakterzada et al. | 13 | 2 | 2 | 1 | 2 | 2 | 2 | 0 | 0 | 0 | 2 |
| Keshavan et al. | 12 | 2 | 1 | 1 | 2 | 2 | 2 | 1 | 0 | 0 | 1 |
| Moon et al. | 15 | 2 | 2 | 2 | 2 | 2 | 2 | 0 | 2 | 0 | 1 |
| Arcaro et al. | 15 | 2 | 1 | 1 | 2 | 2 | 2 | 0 | 2 | 1 | 2 |
| Gobom et al. | 16 | 2 | 0 | 1 | 1 | 2 | 2 | 2 | 2 | 2 | 2 |
| Orellana et al. | 17 | 2 | 1 | 1 | 2 | 2 | 2 | 1 | 2 | 2 | 2 |
QC, quality control. Based on the distribution of total scores, total scores 16–20 and 12–15 were classified as high and medium quality respectively in this study (Supplementary Material).
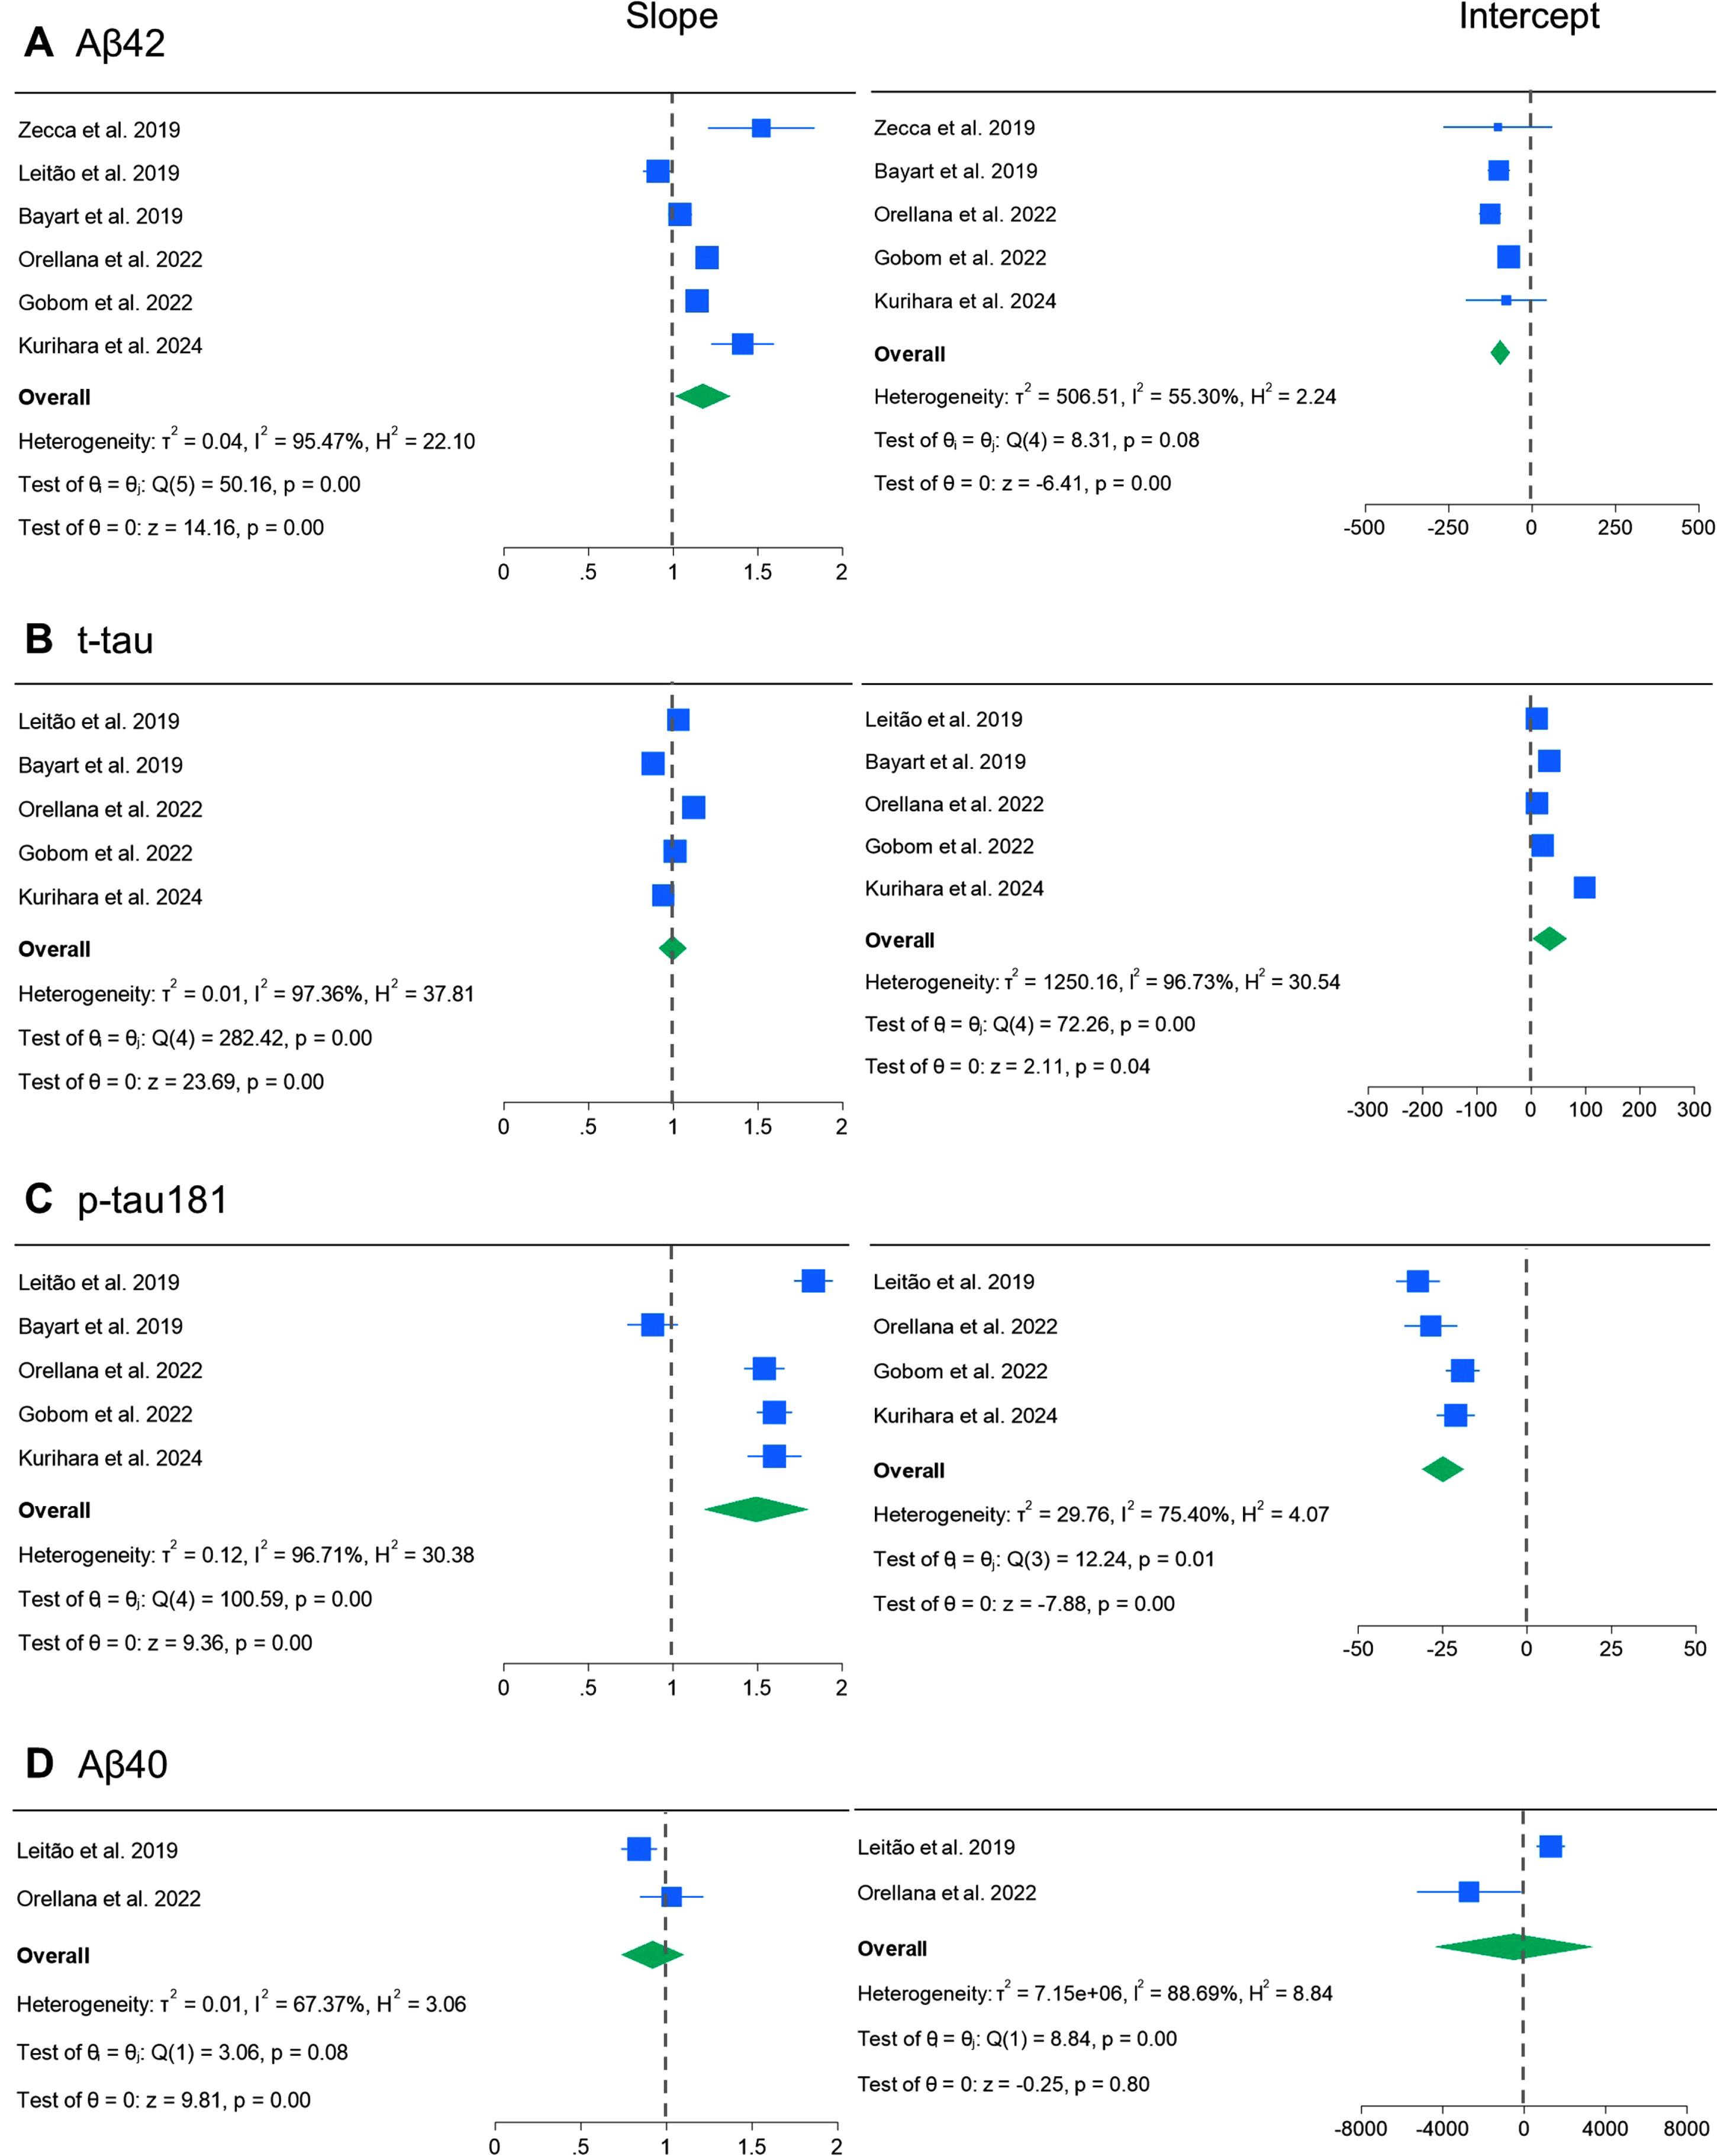
The primary outcome measures (slopes and intercepts of the regression line) and additional outcome measures (correlation coefficients) for each study are summarized in Table 4. As only one study for Aβ42 and one study for Aβ40 used other ELISA, and the remaining studies used INNOTEST or identical ELISA (Innotest), we focused on the relationship between Lumipulse and Innotest ELISA. Forrest plots and results of the meta-analysis of the primary outcome measures for each biomarker are shown in Fig. 3. Overall, although regression lines slopes of Aβ42 varied between studies and a study reported in 2019 showed values higher than 1 [20], the remaining results other than our study distributed close to 1 and the pooled slope was 1.17 (95% CI: 1.01 to 1.34). Intercepts tended to be lower than 0 and pooled intercept was –95.8 (95% CI: –125.0 to –66.5) (Fig. 3A). Slopes and intercepts of t-tau were distributed around 1 and 0 and pooled slopes and intercepts were 1.00 (95% CI: 0.91 to 1.08) and 34.0 (95% CI: 2.4 to 65.6), respectively (Fig. 3B). A single study reported slope lower than 1 [18] and the remaining five studies reported slopes of p-tau181 higher than 1 distributing from 1.5 to 2.0 [19, 21, 24, 25, 38] and the pooled slope was 1.49 (95% CI: 1.18 to 1.80) (Fig. 3C). The intercepts of p-tau181 were lower than 0 in all studies and pooled intercept was –24.9 (95% CI: –31.1 to –18.7) (Fig. 3C). Only two studies were found assessing for Aβ40 [19, 25] with different results (Fig. 3D). Pooled slope and intercept were 0.92 (95% CI: 0.74 to 1.10) and –504 (95% CI: –4420 to 3412), respectively. The correlation coefficient was 0.83–0.94, 0.79–0.98, 0.91–0.97, and 0.76–0.89 for Aβ42, t-tau, p-tau181, and Aβ40, respectively. The pooled correlation coefficients were 0.91 (95% CI: 0.89 to 0.93) for Aβ42, 0.96 (95% CI: 0.93 to 0.98) for t-tau, 0.95 (95% CI: 0.93 to 0.96) for p-tau, and 0.87 (95% CI: 0.83 to 0.90) for Aβ40 (SupplementaryFigure 5A–D). Publication bias was within the acceptable range, as assessed using funnel plots (Supplementary Figure 5E–H and SupplementaryFigure 6).
Table 4
Summary characteristics of studies included in the systematic review
| Author | Year | Aβ42 | t-tau | ||||||||
| n | ELISA method | Slope | Intercept | Correlation coefficient | n | ELISA method | Slope | Intercept | Correlation coefficient | ||
| Andreasson et al. | 2018 | 34 | INNOTEST | 1.64 (n/a) | n/a | 0.94 (n/a) | n/a | n/a | n/a | n/a | n/a |
| Kollhoff et al. | 2018 | 30 | INNOTEST | n/a | n/a | n/a** (0.96, 0.97) | n/a | n/a | n/a | n/a | n/a |
| Alcorea et al. | 2019 | n/a | INNOTEST | n/a | n/a | 0.94 (n/a) | n/a | INNOTEST | n/a | n/a | 0.95 (n/a) |
| Bayart et al. | 2019 | 115 | INNOTEST | 1.04 (0.97, 1.11) | –100 (–131, –64) | 0.94 (0.91, 0.96) | 115 | INNOTEST | 0.88 (0.88, 0.91) | 33 (21, 49) | 0.98 (0.97, 0.98) |
| Leitão et al. | 2019 | 120 | INNOTEST | 0.91 (0.83, 1.01) | –30* (–7, 8) | 0.93 (0.90, 0.95) | 120 | INNOTEST | 1.03 (0.97, 1.09) | 9.9 (–6.6, 27.4) | 0.98 (0.98, 0.99) |
| Paciotti et al. | 2019 | 80 | EURO-IMMUNE | n/a | n/a | 0.87 (0.82, 0.93) | 80 | INNOTEST | n/a | n/a | 0.91 (0.87, 0.95) |
| Zecca et al. | 2019 | 49 | INNOTEST | 1.52 (1.24, 1.87) | –103 (–287, 40) | 0.83 (n/a) | n/a | n/a | n/a | n/a | n/a |
| Dakterzada et al. | 2021 | 149 | INNOTEST | 0.98 (n/a) | n/a | 0.87 (n/a) | 149 | INNOTEST | 0.96 (n/a) | n/a | 0.95 (n/a) |
| Keshavan et al. | 2021 | 71 | INNOTEST | n/a | n/a | 0.89** (n/a) | 70 | INNOTEST | n/a | n/a | 0.79** (n/a) |
| Moon et al. | 2021 | 139 | INNOTEST | n/a | n/a | 0.91 (n/a) | 139 | INNOTEST | n/a | n/a | 0.83 |
| Arcaro et al. | 2022 | 111 | INNOTEST | 0.80 (n/a) | –60 (n/a) | 0.87 (0.81, 0.91) | 111 | INNOTEST | 0.97 (n/a) | 55.6 (n/a) | 0.97 (0.95, 0.98) |
| Gobom et al. | 2022 | 334 | INNOTEST | 1.14 (1.08, 1.19) | –71 (–92, –50) | 0.93 (n/a) | 354 | INNOTEST | 1.01 (0.98, 1.04) | 20.7 (12.9, 32.0) | 0.94 (n/a) |
| Orellana et al. | 2022 | 519 | INNOTEST | 1.20 (1.15, 1.26) | –127 (–160, –93) | 0.93 (n/a) | 364 | INNOTEST | 1.12 (1.09, 1.14) | 10.5 (1.1, 20.4) | 0.98 (n/a) |
| Kurihara et al. | 2024 | 66 | INNOTEST | 1.41 (1.23, 1.60) | –78 (–198, 45) | 0.90 (0.84, 0.94) | 66 | Finoscholar | 0.94 (0.88, 1.01) | 98.2 (76.9, 114.4) | 0.95 (0.93, 0.97) |
| Author | Year | p-tau 181 | Aβ40 | ||||||||
| n | ELISA method | Slope | Intercept | Correlation coefficient | n | ELISA method | Slope | Intercept | Correlation coefficient | ||
| Andreasson et al. | 2018 | n/a | n/a | n/a | n/a | n/a | n/a | n/a | n/a | n/a | n/a |
| Kollhoff et al. | 2018 | n/a | n/a | n/a | n/a | n/a | n/a | n/a | n/a | n/a | n/a |
| Alcorea et al. | 2019 | n/a | INNOTEST | n/a | n/a | 0.95 (n/a) | n/a | Merk-Millipore | n/a | n/a | 0.76 (n/a) |
| Bayart et al. | 2019 | 58 | INNOTEST | 0.88*** (0.77, 1.07) | –12.3 (na) | 0.93 (0.88, 0.96) | n/a | n/a | n/a | n/a | n/a |
| Leitão et al. | 2019 | 120 | INNOTEST | 1.83 (1.72, 1.95) | –32.3 (–39.3, –26.3) | 0.94 (0.90, 0.96) | 120 | INNOTEST | 0.84 (0.73, 0.94) | 1308 (599, 1997) | 0.89 (0.82, 0.94) |
| Paciotti et al. | 2019 | n/a | n/a | n/a | n/a | n/a | n/a | n/a | n/a | n/a | n/a |
| Zecca et al. | 2019 | n/a | n/a | n/a | n/a | n/a | n/a | n/a | n/a | n/a | n/a |
| Dakterzada et al. | 2021 | 149 | INNOTEST | 1.88 (n/a) | n/a | 0.95 (n/a) | n/a | n/a | n/a | n/a | n/a |
| Keshavan et al. | 2021 | 72 | INNOTEST | n/a | n/a | 0.94** (n/a) | n/a | n/a | n/a | n/a | n/a |
| Moon et al. | 2021 | 139 | INNOTEST | n/a | n/a | 0.91 (n/a) | 139 | INNOTEST | na | na | 0.86 (n/a) |
| Arcaro et al. | 2022 | 111 | INNOTEST | 1.81 (n/a) | –33.6 (n/a) | 0.95 (0.92, 0.96) | n/a | n/a | n/a | n/a | n/a |
| Gobom et al. | 2022 | 100 | INNOTEST | 1.60 (1.49, 1.70) | –19.1 (–24.3, –14.3) | 0.97 (n/a) | n/a | n/a | n/a | n/a | n/a |
| Orellana et al. | 2022 | 77 | INNOTEST | 1.54 (1.42, 1.66) | –28.5 (–35.3, –19.6) | 0.96 (n/a) | 44 | INNOTEST | 1.03 (0.85, 1.22) | –2707 (–5339, –233) | 0.81 (n/a) |
| Kurihara et al. | 2024 | 118 | Finoscholar | 1.60 (1.43, 1.75) | –21.1 (–26.9, –15.6) | 0.95 (0.93, 0.97) | n/a | n/a | n/a | n/a | n/a |
Mean/median (95% confidence interval) are listed. n: number of samples, n/a: not available. *the confidence interval of Aβ42 intercept by Leitão et al. did not include the median value [19]. **the Pearson’s correlation coefficient by Keshavan et al. was based on log-transformed values [22]. ***the slope of p-tau181 was provided as 0.88 in the manuscript by Bayart et al., although in the figure the slope seems to be more than 1 [18]. Aβ42, amyloid-β 1-42; t-tau, total tau; p-tau 181, tau phosphorylated at threonine 181.
Fig. 3
Forrest plot and meta-analysis of slopes and intercepts of the regression lines. Forrest plot and meta-analysis using random effect model for slopes and intercepts of Aβ42 (A), t-tau (B), p-tau181 (C), and Aβ40 (D). The square size for each study represents the study weight. Aβ42, amyloid-β 1-42; t-tau, total tau; p-tau 181, tau phosphorylated at threonine 181.
5DISCUSSION
We reported the results of a single-center analysis and systematic review of the relationship between cerebrospinal fluid AD biomarker values measured using Lumipulse assays and conventional Innotest ELISA. Although we confirmed a good correlation between all biomarkers, we identified different characteristics between the measured values for each biomarker.
The slope of the regression lines of Aβ42 varied between studies and two studies reported in 2018–2019 showed values close to 1.5 [15, 20]. This may be explained by the Aβ42 adjustment measured via Lumipulse assay based on certified reference materials since December 2018, which divides previous values by 1.46 [24]. Excluding these two reports, although some variances were observed between the studies, the slopes seemed to be distributed around 1 except for our study. The intercepts were lower than 0 in most studies, suggesting systematic differences. Although our results reflect the above adjustment, the regression line slope was higher than previous studies. Previous studies reported higher inter-lab CV in manual ELISA compared to automated Lumipulse assays [14, 39]; this difference is likely because of lower Aβ42 values in our ELISA measurement compared to these studies. Our study has a limitation that while CSF sample handling procedures were in line with the current recommendations [26] for all p-tau181 ELISA measurements and majority of the Lumipulse measurements, Aβ42 and t-tau ELISA were conducted using biobank samples using different sample handling protocols involving aliquoting, which may have decreased the concentration of Aβ42 through protein binding to tubes [26, 40, 41]. Although the sample size was extremely small to draw conclusions, subgroup analysis has suggested this hypothesis (Supplementary Figure 2). We did not compare the measurement values for Aβ40, since our institution have not measured Aβ40 in ELISA in the past, and we could only find two studies reporting slope or intercept of the regression line of Aβ40, with somewhat different results.
While some differences were observed between studies, the slopes and intercepts of t-tau were distributed close to 1 and 0, respectively, suggesting minimal proportional and systematic bias. Based on the small overall bias and variability between studies, the measurement results of t-tau between Lumipulse and Innotest ELISA may be interconvertible using a conversion formula, although the relationship should be confirmed in each laboratory and the formula must be locally adjusted.
In contrast, significant proportional and systematic differences were observed between the p-tau181 values. The regression line slope was significantly higher than 1 in five of six previous studies and in our study, distributed between 1.5–2.0. Although one study reported an outlying median slope value of 0.88 [18], the median regression line slope seemed to be greater than 1 in the figure. The regression line intercept was significantly lower than 0 in all studies distributing around –25 pg/mL. Pooled slope and intercepts were 1.49 (95% CI: 1.18 to 1.80) and –24.9 (95% CI: –31.1 to –18.7), respectively. The results of this systematic review suggest that the proportional and systematic differences in p-tau181 values reported in previous studies [19, 24, 25] are not specific to certain races or laboratories, but are fundamental in the Lumipulse and Innotest assays. The reason for this relationship, despite the use of similar antibody combinations, remains unclear and warrants further evaluation for future standardization.
One of the main advantages of fluid biomarkers is that we can obtain not only binary results (positive versus negative), but also continuous measurement values. Although the current research framework uses binary classification with single cutoffs [2], different cutoffs may be optimal for different situations. Tertiary classification using two cutoffs has been employed in the United States for CSF Aβ42/40 ratio [42]. Recently, using neuropathological data at autopsy as gold standard, we have shown that CSF p-tau181 levels are associated with both amyloid and tau pathology and suggested that using two different cut-offs may be useful to differentiate between patients into three groups; amyloid-negative, amyloid-positive with tau pathology limited in the transentorhinal region, and amyloid-positive with expanding tau pathology [8]. Moreover, fluid biomarkers may change dynamically after the administration of disease-modifying therapies in line with clinical benefits [43, 44] and could be important as disease-monitoring biomarkers. Therefore, understanding the direct relationship between biomarker measurement values across different platforms is important.
Although validating predetermined cutoff values was not the aim of this study, our scatter plots and regression lines indicated that predetermined Lumipulse cutoff values for t-tau and p-tau181 highly corresponded to our ELISA cutoff values based on previous autopsy data [28, 29] and the binary results matched well between the two assays. These results may support the use of predetermined Lumipulse cutoff values based on data obtained from other racial groups in Japanese patients.
While we conducted this systematic review, we experienced several issues that could be addressed in future biomarker measurement procedure comparison studies. First, the patient populations differed widely between the studies. Combining the results, as we did in this systematic review, is important to obtain a complete overview of the characteristics of the different platforms. Second, although CSF sample handling and analysis methods seem to be relatively standardized by virtue of global standardization efforts [12, 13, 26], statistical methods varied widely between studies. Based on previous recommendations [32, 33], we believe that the concentration value itself (not the logarithmic transform) should be evaluated using difference plots and a robust nonparametric method that assumes error in both the x- and y-axes in a situation where a normal distribution is difficult to assume, for example, the Passing-Bablok regression analysis. Third, data reporting also varied between studies. As recommended, the adjusted median and CI of the slope and interval should be reported [32, 33] for future global harmonization of the data.
There are several limitations to this study. First, as mentioned above, we used aliquoted biobank samples for Aβ42 and t-tau ELISA, which likely led to decreased Aβ42 value in ELISA because of protein binding to tubes. Second, we have not participated in the quality control program, and the measurement value of ELISA was not adjusted based on certified reference materials. Third, we searched only English articles in the systematic review and there may be several other studies reported in different languages.
In conclusion, while biomarkers measured by the Lumipulse assay and Innotest ELISA showed good correlation, we identified different characteristics between the measured values for each biomarker, which could be useful for a seamless understanding of previous and future AD biomarker studies. Our results should aid in understanding the differences in CSF biomarker results measured on different platforms and in future global harmonization.
AUTHOR CONTRIBUTIONS
Masanori Kurihara (Conceptualization; Data curation; Formal analysis; Funding acquisition; Investigation; Project administration; Visualization; Writing – original draft); Soichiro Kondo (Investigation; Validation; Writing – review & editing); Kensuke Ohse (Investigation; Writing – review & editing); Hisashi Nojima (Investigation; Writing – review & editing); Emiko Kikkawa-Saito (Investigation; Writing – review & editing); Atsushi Iwata (Funding acquisition; Supervision; Writing – review & editing).
ACKNOWLEDGMENTS
We thank all participants of Tokyo Medical Biobank for donating their clinical information and biosamples. We also thank all members of the Department of Neurology, Research Team for Neuroimaging, Healthy Aging Innovation Center (HAIC), and the Integrated Research Initiative for Living Well with Dementia (IRIDE) of the Tokyo Metropolitan Institute for Geriatrics and Gerontology (TMIG) for their assistance.
FUNDING
This study was supported by the Integrated Research Initiative for Living Well with Dementia (IRIDE) of the Tokyo Metropolitan Institute for Geriatrics and Gerontology, KAKENHI from the Japan Society for the Promotion of Science (JSPS) to M. Kurihara (JP23K14789), and by the Japan Agency for Medical Research and Development (AMED) to A. Iwata (JP23dk0207057h0002).
CONFLICT OF INTEREST
Hisashi Nojima and Emiko Kikkawa-Saito are employees of FUJIREBIO INC. Atsushi Iwata received a research grant from FUJIREBIO INC. The remaining authors declare no conflicts of interest relevant to this manuscript.
DATA AVAILABILITY
The datasets and full protocol for the present study are available from the corresponding author upon request.
SUPPLEMENTARY MATERIAL
[1] The supplementary material is available in the electronic version of this article: https://dx.doi.org/10.3233/JAD-240185.
REFERENCES
[1] | Beach TG , Monsell SE , Phillips LE , Kukull W ((2012) ) Accuracy of the clinical diagnosis of Alzheimer disease at National Institute on Aging Alzheimer Disease Centers, 2005-2010. J Neuropathol Exp Neurol 71: , 266–273. |
[2] | Jack CR , Bennett DA , Blennow K , Carrillo MC , Dunn B , Haeberlein SB , Holtzman DM , Jagust W , Jessen F , Karlawish J , Liu E , Molinuevo JL , Montine T , Phelps C , Rankin KP , Rowe CC , Scheltens P , Siemers E , Snyder HM , Sperling R , Jr. Contributors((2018) ) NIA-AA Research Framework: Toward a biological definition of Alzheimer’s disease. Alzheimers Dement 14: , 535–562. |
[3] | Dubois B , Villain N , Frisoni GB , Rabinovici GD , Sabbagh M , Cappa S , Bejanin A , Bombois S , Epelbaum S , Teichmann M , Habert MO , Nordberg A , Blennow K , Galasko D , Stern Y , Rowe CC , Salloway S , Schneider LS , Cummings JL , Feldman HH ((2021) ) Clinical diagnosis of Alzheimer’s disease: Recommendations of the International Working Group. Lancet Neurol 20: , 484–496. |
[4] | Strozyk D , Blennow K , White LR , Launer LJ ((2003) ) CSF Abeta 42 levels correlate with amyloid-neuropathology in a population-based autopsy study. Neurology 60: , 652–656. |
[5] | Clark CM , Xie S , Chittams J , Ewbank D , Peskind E , Galasko D , Morris JC , McKeel DW , Farlow M , Weitlauf SL , Quinn J , Kaye J , Knopman D , Arai H , Doody RS , DeCarli C , Leight S , Lee VM , Trojanowski JQ Jr. ((2003) ) Cerebrospinal fluid tau and beta-amyloid: How well do these biomarkers reflect autopsy-confirmed dementia diagnoses? Arch Neurol 60: , 1696–1702. |
[6] | Shaw LM , Vanderstichele H , Knapik-Czajka M , Clark CM , Aisen PS , Petersen RC , Blennow K , Soares H , Simon A , Lewczuk P , Dean R , Siemers E , Potter W , Lee VM , Trojanowski JQ , Alzheimer’s Disease Neuroimaging Initiative ((2009) ) Cerebrospinal fluid biomarker signature in Alzheimer’s disease neuroimaging initiative subjects. Ann Neurol 65: , 403–413. |
[7] | Tapiola T , Alafuzoff I , Herukka SK , Parkkinen L , Hartikainen P , Soininen H , Pirttila T ((2009) ) Cerebrospinal fluid beta-amyloid 42 and tau proteins as biomarkers of Alzheimer-type pathologic changes in the brain. Arch Neurol 66: , 382–389. |
[8] | Kurihara M , Matsubara T , Morimoto S , Arakawa A , Ohse K , Kanemaru K , Iwata A , Murayama S , Saito Y ((2024) ) Neuropathological changes associated with aberrant cerebrospinal fluid p-tau181 and Abeta42 in Alzheimer’s disease and other neurodegenerative diseases. Acta Neuropathol Commun 12: , 48. |
[9] | Olsson B , Lautner R , Andreasson U , Ohrfelt A , Portelius E , Bjerke M , Holtta M , Rosen C , Olsson C , Strobel G , Wu E , Dakin K , Petzold M , Blennow K , Zetterberg H ((2016) ) CSF and blood biomarkers for the diagnosis of Alzheimer’s disease: A systematic review and meta-analysis. Lancet Neurol 15: , 673–684. |
[10] | Hansson O , Lehmann S , Otto M , Zetterberg H , Lewczuk P ((2019) ) Advantages and disadvantages of the use of the CSF Amyloid beta (Abeta) 42/40 ratio in the diagnosis of Alzheimer’s disease. Alzheimers Res Ther 11: , 34;. |
[11] | Nojima H , Ito S , Kushida A , Abe A , Motsuchi W , Verbel D , Vandijck M , Jannes G , Vandenbroucke I , Aoyagi K ((2022) ) Clinical utility of cerebrospinal fluid biomarkers measured by LUMIPULSE((R)) system. Ann Clin Transl Neurol 9: , 1898–1909. |
[12] | Blennow K , Dubois B , Fagan AM , Lewczuk P , de Leon MJ , Hampel H ((2015) ) Clinical utility of cerebrospinal fluid biomarkers in the diagnosis of early Alzheimer’s disease. Alzheimers Dement 11: , 58–69. |
[13] | Zetterberg H , Blennow K ((2021) ) Moving fluid biomarkers for Alzheimer’s disease from research tools to routine clinical diagnostics. Mol Neurodegener 16: , 10. |
[14] | The Alzheimer’s Association QC program for CSF biomarkers,https://www.gu.se/en/neuroscience-physiology/the-alzheimers-association-qc-program-forcsf-and-blood-biomarkers,Accessed February 20, 2023. |
[15] | Andreasson U , Kuhlmann J , Pannee J , Umek RM , Stoops E , Vanderstichele H , Matzen A , Vandijck M , Dauwe M , Leinenbach A , Rutz S , Portelius E , Zegers I , Zetterberg H , Blennow K ((2018) ) Commutability of the certified reference materials for the standardization of beta-amyloid 1-42 assay in human cerebrospinal fluid: Lessons for tau and beta-amyloid 1-40 measurements. Clin Chem Lab Med 56: , 2058–2066. |
[16] | Kollhoff AL , Howell JC , Hu WT ((2018) ) Automation vs. experience: Measuring Alzheimer’s beta-amyloid 1-42 peptide in the CSF. Front Aging Neurosci 10: , 253. |
[17] | Alcolea D , Pegueroles J , Munoz L , Camacho V , Lopez-Mora D , Fernandez-Leon A , Le Bastard N , Huyck E , Nadal A , Olmedo V , Sampedro F , Montal V , Vilaplana E , Clarimon J , Blesa R , Fortea J , Lleo A ((2019) ) Agreement of amyloid PET and CSF biomarkers for Alzheimer’s disease on Lumipulse. Ann Clin Transl Neurol 6: , 1815–1824. |
[18] | Bayart JL , Hanseeuw B , Ivanoiu A , van Pesch V ((2019) ) Analytical and clinical performances of the automated Lumipulse cerebrospinal fluid Abeta(42) and T-Tau assays for Alzheimer’s disease diagnosis. J Neurol 266: , 2304–2311. |
[19] | Leitao MJ , Silva-Spinola A , Santana I , Olmedo V , Nadal A , Le Bastard N , Baldeiras I ((2019) ) Clinical validation of the Lumipulse G cerebrospinal fluid assays for routine diagnosis of Alzheimer’s disease. Alzheimers Res Ther 11: , 91. |
[20] | Zecca C , Brescia V , Piccininni M , Capozzo R , Barone R , Barulli MR , Logroscino G ((2019) ) Comparative evaluation of two immunoassays for cerebrospinal fluid beta-Amyloid(1-42) measurement. Clin Chim Acta 493: , 107–111. |
[21] | Dakterzada F , Lopez-Ortega R , Arias A , Riba-Llena I , Ruiz-Julian M , Huerto R , Tahan N , Pinol-Ripoll G ((2021) ) Assessment of the concordance and diagnostic accuracy between Elecsys and Lumipulse fully automated platforms and Innotest. Front Aging Neurosci 13: , 604119. |
[22] | Keshavan A , Wellington H , Chen Z , Khatun A , Chapman M , Hart M , Cash DM , Coath W , Parker TD , Buchanan SM , Keuss SE , Harris MJ , Murray-Smith H , Heslegrave A , Fox NC , Zetterberg H , Schott JM ((2021) ) Concordance of CSF measures of Alzheimer’s pathology with amyloid PET status in a preclinical cohort: A comparison of Lumipulse and established immunoassays. Alzheimers Dement (Amst) 13: , e12131. |
[23] | Moon S , Kim S , Mankhong S , Choi SH , Vandijck M , Kostanjevecki V , Jeong JH , Yoon SJ , Park KW , Kim EJ , Yoon B , Kim HJ , Jang JW , Hong JY , Park DH , Shaw LM , Kang JH ((2021) ) Alzheimer’s cerebrospinal biomarkers from Lumipulse fully automated immunoassay: Concordance with amyloid-beta PET and manual immunoassay in Koreans: CSF AD biomarkers measured by Lumipulse in Koreans. Alzheimers Res Ther 13: , 22. |
[24] | Gobom J , Parnetti L , Rosa-Neto P , Vyhnalek M , Gauthier S , Cataldi S , Lerch O , Laczo J , Cechova K , Clarin M , Benet AL , Pascoal TA , Rahmouni N , Vandijck M , Huyck E , Le Bastard N , Stevenson J , Chamoun M , Alcolea D , Lleo A , Andreasson U , Verbeek MM , Bellomo G , Rinaldi R , Ashton NJ , Zetterberg H , Sheardova K , Hort J , Blennow K ((2022) ) Validation of the LUMIPULSE automated immunoassay for the measurement of core AD biomarkers in cerebrospinal fluid. Clin Chem Lab Med 60: , 207–219. |
[25] | Orellana A , Garcia-Gonzalez P , Valero S , Montrreal L , de Rojas I , Hernandez I , Rosende-Roca M , Vargas L , Tartari JP , Esteban-De Antonio E , Bojaryn U , Narvaiza L , Alarcon-Martin E , Alegret M , Alcolea D , Lleo A , Tarraga L , Pytel V , Cano A , Marquie M , Boada M , Ruiz A ((2022) ) Establishing in-house cutoffs of CSF Alzheimer’s disease biomarkers for the AT(N) stratification of the Alzheimer Center Barcelona Cohort. Int J Mol Sci 23: , 6891. |
[26] | Hansson O , Batrla R , Brix B , Carrillo MC , Corradini V , Edelmayer RM , Esquivel RN , Hall C , Lawson J , Bastard NL , Molinuevo JL , Nisenbaum LK , Rutz S , Salamone SJ , Teunissen CE , Traynham C , Umek RM , Vanderstichele H , Vandijck M , Wahl S , Weber CJ , Zetterberg H , Blennow K ((2021) ) The Alzheimer’s Association international guidelines for handling of cerebrospinal fluid for routine clinical measurements of amyloid beta and tau. Alzheimers Dement 17: , 1575–1582. |
[27] | Kawarabayashi T , Nakamura T , Miyashita K , Fukamachi I , Seino Y , Shoji M ((2020) ) Novel ELISAs to measure total and phosphorylated tau in cerebrospinal fluid. Neurosci Lett 722: , 134826. |
[28] | Morimoto S , Takao M , Hatsuta H , Nishina Y , Komiya T , Sengoku R , Nakano Y , Uchino A , Sumikura H , Saito Y , Kanemaru K , Murayama S ((2017) ) Homovanillic acid and 5-hydroxyindole acetic acid as biomarkers for dementia with Lewy bodies and coincident Alzheimer’s disease: An autopsy-confirmed study. PLoS One 12: , e0171524. |
[29] | Kurihara M , Komatsu H , Sengoku R , Shibukawa M , Morimoto S , Matsubara T , Arakawa A , Orita M , Ishibashi K , Mitsutake A , Shibata S , Ishiura H , Adachi K , Ohse K , Hatano K , Ihara R , Higashihara M , Nishina Y , Tokumaru AM , Ishii K , Saito Y , Murayama S , Kanemaru K , Iwata A ((2023) ) CSF P-Tau181 and other biomarkers in patients with neuronal intranuclear inclusion disease. Neurology 100: ,e1009–e1019. |
[30] | Bland JM , Altman DG ((1986) ) Statistical methods for assessing agreement between two methods of clinical measurement. Lancet 1: , 307–310. |
[31] | Passing H , Bablok ((1983) ) A new biometrical procedure for testing the equality of measurements from two different analytical methods. Application of linear regression procedures for method comparison studies in clinical chemistry, Part I. J Clin Chem Clin Biochem 21: , 709–720. |
[32] | Clinical and Laboratory Standards Institute (CLSI) (2018) Measurement procedure comparison and bias estimation using patient samples. 3rd ed. CLSI guideline EP09c. |
[33] | Pum J ((2019) ) A practical guide to validation and verification of analytical methods in the clinical laboratory. Adv Clin Chem 90: , 215–281. |
[34] | Bablok W , Passing H ((1985) ) Application of statistical procedures in analytical instrument testing. J Automat Chem 7: , 74–79. |
[35] | Page MJ , McKenzie JE , Bossuyt PM , Boutron I , Hoffmann TC , Mulrow CD , Shamseer L , Tetzlaff JM , Akl EA , Brennan SE , Chou R , Glanville J , Grimshaw JM , Hrobjartsson A , Lalu MM , Li T , Loder EW , Mayo-Wilson E , McDonald S , McGuinness LA , Stewart LA , Thomas J , Tricco AC , Welch VA , Whiting P , Moher D ((2021) ) The PRISMA 2020 statement: An updated guideline for reporting systematic reviews. BMJ 372: , n71. |
[36] | Wirsching J , Grassmann S , Eichelmann F , Harms LM , Schenk M , Barth E , Berndzen A , Olalekan M , Sarmini L , Zuberer H , Aleksandrova K ((2018) ) Development and reliability assessment of a new quality appraisal tool for cross-sectional studies using biomarker data (BIOCROSS). BMC Med Res Methodol 18: , 122. |
[37] | Paciotti S , Sepe FN , Eusebi P , Farotti L , Cataldi S , Gatticchi L , Parnetti L ((2019) ) Diagnostic performance of a fully automated chemiluminescent enzyme immunoassay for Alzheimer’s disease diagnosis. Clin Chim Acta 494: , 74–78. |
[38] | Arcaro M , Fenoglio C , Serpente M , Arighi A , Fumagalli GG , Sacchi L , Floro S , D’Anca M , Sorrentino F , Visconte C , Perego A , Scarpini E , Galimberti D ((2022) ) A novel automated chemiluminescence method for detecting cerebrospinal fluid amyloid-beta 1-42 and 1-40, total tau and phosphorylated-tau: Implications for improving diagnostic performance in Alzheimer’s disease. Biomedicines 10: , 2667. |
[39] | Mattsson N , Andreasson U , Persson S , Arai H , Batish SD , Bernardini S , Bocchio-Chiavetto L , Blankenstein MA , Carrillo MC , Chalbot S , Coart E , Chiasserini D , Cutler N , Dahlfors G , Duller S , Fagan AM , Forlenza O , Frisoni GB , Galasko D , Galimberti D , Hampel H , Handberg A , Heneka MT , Herskovits AZ , Herukka SK , Holtzman DM , Humpel C , Hyman BT , Iqbal K , Jucker M , Kaeser SA , Kaiser E , Kapaki E , Kidd D , Klivenyi P , Knudsen CS , Kummer MP , Lui J , Llado A , Lewczuk P , Li QX , Martins R , Masters C , McAuliffe J , Mercken M , Moghekar A , Molinuevo JL , Montine TJ , Nowatzke W , O’Brien R , Otto M , Paraskevas GP , Parnetti L , Petersen RC , Prvulovic D , de Reus HP , Rissman RA , Scarpini E , Stefani A , Soininen H , Schroder J , Shaw LM , Skinningsrud A , Skrogstad B , Spreer A , Talib L , Teunissen C , Trojanowski JQ , Tumani H , Umek RM , Van Broeck B , Vanderstichele H , Vecsei L , Verbeek MM , Windisch M , Zhang J , Zetterberg H , Blennow K ((2011) ) The Alzheimer’s Association external quality control program for cerebrospinal fluid biomarkers. Alzheimers Dement 7: , 386–395e386. |
[40] | Hansson O , Mikulskis A , Fagan AM , Teunissen C , Zetterberg H , Vanderstichele H , Molinuevo JL , Shaw LM , Vandijck M , Verbeek MM , Savage M , Mattsson N , Lewczuk P , Batrla R , Rutz S , Dean RA , Blennow K ((2018) ) The impact of preanalytical variables on measuring cerebrospinal fluid biomarkers for Alzheimer’s disease diagnosis: A review. Alzheimers Dement 14: , 1313–1333. |
[41] | Janelidze S , Stomrud E , Brix B , Hansson O ((2019) ) Towards a unified protocol for handling of CSF before beta-amyloid measurements. Alzheimers Res Ther 11: , 63. |
[42] | FDA, EVALUATION OF AUTOMATIC CLASS Ill DESIGNATION FOR Lumipulse G β-Amyloid Ratio (1-42/1-40)https://www.accessdata.fda.gov/scripts/cdrh/cfdocs/cfpmn/denovo.cfm?id=DEN200072 |
[43] | van Dyck CH , Swanson CJ , Aisen P , Bateman RJ , Chen C , Gee M , Kanekiyo M , Li D , Reyderman L , Cohen S , Froelich L , Katayama S , Sabbagh M , Vellas B , Watson D , Dhadda S , Irizarry M , Kramer LD , Iwatsubo T ((2023) ) Lecanemab in early Alzheimer’s disease. N Engl J Med 388: , 9–21. |
[44] | Sims JR , Zimmer JA , Evans CD , Lu M , Ardayfio P , Sparks J , Wessels AM , Shcherbinin S , Wang H , Monkul Nery ES , Collins EC , Solomon P , Salloway S , Apostolova LG , Hansson O , Ritchie C , Brooks DA , Mintun M , Skovronsky DM; TRAILBLAZER-ALZ 2 Investigators ((2023) ) Donanemab in early symptomatic Alzheimer disease: The TRAILBLAZER-ALZ 2 randomized clinical trial. JAMA 330: , 512–527. |


