
Assessment of Gray Matter Microstructural Alterations in Alzheimer’s Disease by Free Water Imaging
Abstract
Background:
Cortical neurodegenerative processes may precede the emergence of disease symptoms in patients with Alzheimer’s disease (AD) by many years. No study has evaluated the free water of patients with AD using gray matter-based spatial statistics.
Objective:
The aim of this study was to explore cortical microstructural changes within the gray matter in AD by using free water imaging with gray matter-based spatial statistics.
Methods:
Seventy-one participants underwent multi-shell diffusion magnetic resonance imaging, 11C-Pittsburgh compound B positron emission tomography, and neuropsychological evaluations. The patients were divided into two groups: healthy controls (n = 40) and the AD spectrum group (n = 31). Differences between the groups were analyzed using voxel-based morphometry, diffusion tensor imaging, and free water imaging with gray matter-based spatial statistics.
Results:
Voxel-based morphometry analysis revealed gray matter volume loss in the hippocampus of patients with AD spectrum compared to that in controls. Furthermore, patients with AD spectrum exhibited significantly greater free water, mean diffusivity, and radial diffusivity in the limbic areas, precuneus, frontal lobe, temporal lobe, right putamen, and cerebellum than did the healthy controls. Overall, the effect sizes of free water were greater than those of mean diffusivity and radial diffusivity, and the larger effect sizes of free water were thought to be strongly correlated with AD pathology.
Conclusions:
This study demonstrates the utility of applying voxel-based morphometry, gray matter-based spatial statistics, free water imaging and diffusion tensor imaging to assess AD pathology and detect changes in gray matter.
INTRODUCTION
Over the past few decades, numerous studies have sought to characterize the neurodegenerative alterations in Alzheimer’s disease (AD) in vivo by using noninvasive neuroimaging techniques. Although the clinical diagnosis of AD is based on the clinical course and symptoms of neuropsychological tests, diagnostic imaging of the brain has become an indispensable supplement to research criteria. Previous studies employing volumetric T1-weighted magnetic resonance imaging (MRI) have primarily focused on the macrostructural atrophy observed in the hippocampus and other structures within the temporal lobe [1, 2]. Recent research shows that amyloid-β interacts with cortical tau pathology to influence neurodegeneration [3, 4]. However, AD pathology accumulates for many years before the appearance of macrostructural changes that can be reliably detected by conventional T1-weighted imaging [5]. Neuroimaging techniques to assess the pathology of AD are essential for staging and monitoring treatment response given the irreversibility of neuronal loss.
Concurrently, diffusion tensor imaging (DTI) was extensively used to investigate the microstructures in the AD brain [6, 7]. In a previous study, DTI was suggested as a noninvasive method for detecting brain pathology in vivo in early stages of AD [8]. As a noninvasive modality for assessing cerebral water diffusion characteristics, DTI provides quantitative parameters in voxel units [9]. However, standard DTI techniques primarily evaluate white matter (WM) and exhibit limitations, particularly in the assessment of gray matter (GM) or regions with complex fibrous structures [10, 11]. The innovation of free water imaging (FWI) has provided a novel technique for the appraisal of MRI diffusion, facilitating estimations of the portion of the diffusive signal ascribed to isotopically unhindered water through regularization of the bi-tensor model [12]. Elevated levels of free water (FW) in the brain tissue may indicate a potential link between neuroinflammation and AD [13]. An unbiased statistical analysis of the cortical microstructure can be performed based on voxel-specific GM data using gray matter-based spatial statistics (GBSS) [14]. The damage associated with AD first appears in the cortex, not in the WM [15], and examining GM FW using GBSS may be worthwhile. However, no study has evaluated the FW of patients with AD using GBSS.
In this context, we hypothesized that patients with AD spectrum (AD-S) also show an increase in cortical fine-structure FW. Thus, in this study, we aimed to investigate cortical microstructural alterations in AD-S and characterize the microstructures within the GM using FWI.
MATERIALS AND METHODS
Participants
Ninety-three participants were recruited for this prospective study from 2014 to 2018, which was conducted at the National Center for Neurology and Psychiatry. Participants were required to be aged≥55 years. Those with concurrent chronic diseases, antecedents of central nervous system disorders (including vascular disorders, severe cerebral trauma, or meeting the criteria for substance abuse/dependence) were excluded. The participants were amyloid-negative cognitively healthy controls (HCs) and individuals with an amyloid-positive AD-S. In our investigation, we meticulously recruited participants from the AD-S cohort exhibiting clinical signs of cognitive decline, with a global Clinical Dementia Rating (CDR) of≥0.5, thereby encompassing stages from mild cognitive impairment (MCI) onward. Notably, our cohort did not include individuals in the preclinical phase of AD, characterized by a CDR of 0 and amyloid positivity, ensuring focused examination of symptomatic stages of the disease. All amyloid-positive participants in our study met the clinical diagnostic criteria for AD, as outlined by the National Institute on Aging and Alzheimer’s Association guidelines. These criteria integrate clinical assessments and biomarker evidence to provide a comprehensive framework for AD diagnosis. The participants underwent 3.0 T MRI (including three-dimensional [3D] T1-weighted imaging and multishell diffusion imaging), 11C-Pittsburgh compound B (PiB) positron emission tomography (PET), and neuropsychological evaluations. Individuals demonstrating cognitive decline and absence of amyloid deposition were excluded to allow for a clearer differentiation between the HC group and those deemed clinically healthy, facilitating the discrete categorization of AD. Subsequently, 71 participants were divided into two groups based on the results of neuropsychological tests and amyloid PET by evaluating the centiloid scale (CL) units of the target cortex, as stipulated by the Global Alzheimer’s Association Interactive Network (http://www.gaain.org/centiloid-project) protocol: the HC group consisted of amyloid-negative participants with a CDR of 0 (N = 40), and the AD-S group comprised amyloid-positive participants (N = 31). This cross-sectional, observational study was approved by the Institutional Review Board of the National Center for Neurology and Psychiatry, and written informed consent was obtained from all participants before participation.
Image acquisition
The participants underwent MRI using a 3.0 T MRI system (Verio, Siemens, Erlangen, Germany). Three-dimensional sagittal T1-weighted magnetization-prepared rapid acquisition with gradient echo images were captured with the following scanning parameters: repetition time/echo time, 1900 ms/2.52 ms; flip angle, 9°; in-plane resolution, 1.0×1.0 mm; effective slice thickness, 1.0 mm without an interval; 300 slices; matrix, 256×256; and field of view (FOV), 25×25 cm. For FWI and DTI metrics, multishell diffusion images were acquired along 30 non-collinear directions at three b-values (0, 1000, and 2000 s/mm2). Furthermore, two images with reverse-phase encoding (blip up/down) were acquired without a diffusion gradient. The diffusion MRI parameters were as follows: repetition time/echo time, 17700 ms/93 ms; flip angle, 90°; in-plane resolution, 2.0×2.0 mm; effective slice thickness, 2.0 mm; 74 slices; matrix, 114×114; and FOV, 22.4×22.4 cm.
Positron emission tomography/computed tomography scans were performed using a Siemens/Biograph 16 scanner (3D acquisition mode; 81 image planes; axial FOV, 16.2 cm; transaxial resolution, 4.2 mm; axial resolution, 4.7 mm; and slice interval, 2 mm). Low-dose computed tomography was performed for attenuation correction. An intravenous injection of 11C-PiB at a dose of 555 MBq was administered 50 min before the PET/CT scan for 11C-PiB imaging, with an emission scan duration of 20 min. The PET/CT images were reconstructed using the fusion of Fourier rebinning and ordered subset expectation. The mean interval and standard deviation between 11C-PiB PET and MRI was 22.1±23.0 days (11C-PiB to MRI: 18.3±23.8 days).
Voxel-based morphometry analysis
The CAT12 toolbox (http://dbm.neuro.uni-jena.de/cat/) implemented in SPM12 (www.fil.ion.ucl.ac.uk) was used for voxel-based morphometry (VBM) analysis. The T1WI scans were segmented into GM, WM, and cerebrospinal fluid. These three components were used to calculate intracranial volume. DARTEL was used to spatially normalize the segmented GM and WM images to the Montreal Neurological Institute space. Finally, the GM and WM images were flattened using an isotropic Gaussian kernel with a full width at half maximum of 8 mm.
Free water index and DTI index processing
The correction of diffusion MRI data for eddy current and motion was performed using the eddy tool in the FMRIB Software Library (FSL Version 6.0.5) [16]. The DTI indices (fractional anisotropy, mean diffusivity [MD], axial diffusivity, and radial diffusivity [RD]) and FW imaging were generated from eddy current corrected volumes by fitting the FW model executed using Diffusion Imaging in Python ver. 1.0 (DIPY, https://dipy.org).
Gray matter-based spatial statistics analysis
We used GBSS [14] contained within the FSL software package [17] for detailed topographical mapping of statistically significant differences between groups across all DTI and FW images. GBSS [14] is a GM analog to tract-based spatial statistics that strictly adheres to the latter methodology. Initially, non-cerebral voxels were eliminated from the three-dimensional T1-weighted images of each participant using a Brain Extraction Tool. Subsequently, every skull-stripped three-dimensional T1-weighted image (affine and nonlinear) was aligned to the MNI152 standard space of 1-mm resolution using the FMRIB Linear Image Registration Tool and the FMRIB Nonlinear Image Registration Tool [18], respectively. Subsequently, the field bias was rectified, and segmentations of GM, WM, and cerebrospinal fluid were performed using the FMRIB Automated Segmentation Tool [14]. The resultant GM image was employed to engender a median GM skeleton. This was achieved by discarding any data with a probability value < 0.2 in the GM image after segmentation, thus effectively excluding WM and cerebrospinal fluid (CSF). Each participant’s b0 maps were then affine-aligned to their respective three-dimensional T1-weighted images using the echo-planar imaging registration process. After ensuring that all maps were affinely and nonlinearly aligned into the MNI152 brain common space at a resolution of 1 mm [18], each participant’s aligned maps were projected onto the median GM skeleton map.
Region of interest (ROI) analysis
Region of interest analysis was performed to quantify and evaluate changes in GM. Further, regions in the Automated Anatomical Labeling atlas [19] where significant differences were detected by GBSS were used for skeletal ROI analysis. Average maps were calculated for each ROI on the skeleton of each individual participant. The effect sizes for each map were compared between HC and AD-S individuals.
Positron emission tomography processing
The 11C-PiB PET images were spatially normalized using SPM after partial-volume correction using the PETPVE12 toolbox. The participant PET images were co-registered to their T1-weighted images and spatially normalized to the MNI space using the DARTEL method. All PET images were divided by the positive mean uptake value of the cerebellar GM after spatial normalization using MRI parameters. Consequently, standardized uptake value ratio (SUVR) images were obtained, and each image was subsequently smoothed using an 8-mm full width at half maximum Gaussian kernel. The SUVR was calculated from standardized participant PET counts in the cerebral cortex (GAAIN Pons VOI). The resultant SUVR was then transmuted to CL values to ensure standardization of amyloid imaging results because tracers, PET scanners, procedural factors, and analysis methods varied among diagnostic imaging facilities [20]. A cut-off CL value of 10 was adopted to define positive and negative amyloid accumulation [21].
Statistical analysis
For the VBM analysis, white matter and GM volumes were analyzed using whole-brain SPM12 analyses, a two-sample t-test, and multiple regression designs, with age, sex, and years of education as covariates. Results with a height threshold of p = 0.001 (uncorrected) and clusters that fell below a cluster-corrected p value = 0.05 (family-wise error [FWE]) were considered significant.
An unpaired Student’s t-test, a general linear model framework (including one-way analysis of variance with age and intracranial volume computed using SPM12 as covariates), and the threshold-free cluster enhancement (TFCE) option were used in randomize to avoid selection of an arbitrary cluster-forming threshold [22]. A randomization test with 50000 permutations was used to compare FW and various DTI metrics between the groups. A corrected family-wise error (p = 0.05) was considered statistically significant. Additionally, GBSS analyses were conducted to explore the correlations among age, sex, education, clinical severity, FW, and various DTI metrics. Clinical severity was assessed using the Montreal Cognitive Assessment (MoCA), Mini-Mental State Examination (MMSE), and Clinical Dementia Rating-Sum of Boxes (CDR-SOB). Bonferroni correction was applied to the clinical severity index to account for multiple comparisons. Region of interest (ROI) analysis was performed on the cortical areas previously reported to be associated with AD [13, 23–25]. The effect sizes were calculated using Cohen’s d. Furthermore, Pearson correlation analysis was used to examine the correlation between FW and GM cortical volume and regional SUVR.
RESULTS
Participant characteristics
The demographic characteristics, neuropsychological scores, SUVR, and CL of each group are summarized in Table 1. The two groups showed no significant differences in terms of age, sex, or years of education.
Table 1
Demographic characteristics of the Alzheimer’s disease-spectrum group (AD-S) and healthy control (HC) group
| HCs | AD-S group | P | |||||
| (N = 40) | (N = 31) | ||||||
| Mean | ± | SD | Mean | ± | SD | ||
| Age (y) | 65.5 | ± | 8.7 | 70.4 | ± | 8.0 | 0.01° |
| Sex (female:male) | 20 | : | 20 | 20 | : | 11 | 0.22‡ |
| Education (y) | 14.4 | ± | 2.4 | 13.5 | ± | 2.6 | 0.11° |
| MoCA score | 27.1 | ± | 2.2 | 20.4 | ± | 6.2 | <0.001° |
| MMSE score | 29.3 | ± | 1.1 | 23.6 | ± | 4.7 | <0.001° |
| CDR-SOB | all 0 | – | 3.3 | ± | 3.1 | – | |
| SUVR of 11C-PiB within the whole cortex | 0.97 | ± | 0.04 | 1.81 | ± | 0.51 | <0.001° |
| CL of 11C-PiB with the cerebellum as the reference region | –3.2 | ± | 3.9 | 75.5 | ± | 48.4 | – |
*Some of them could not be collected, °one-way ANOVA, ‡ χ2 test. HC; healthy controls; AD-S, Alzheimer’s disease spectrum; N, number of participants; SD, standard deviation; CDR, Clinical Dementia Rating; MMSE, Mini-Mental State Examination; MoCA, Montreal Cognitive Assessment; FAB, Frontal Assessment Battery; SUVR, Standardized Uptake Value Ratio; CL, CentiLoid units; SOB, sum of boxes.
Voxel-based morphometry analysis
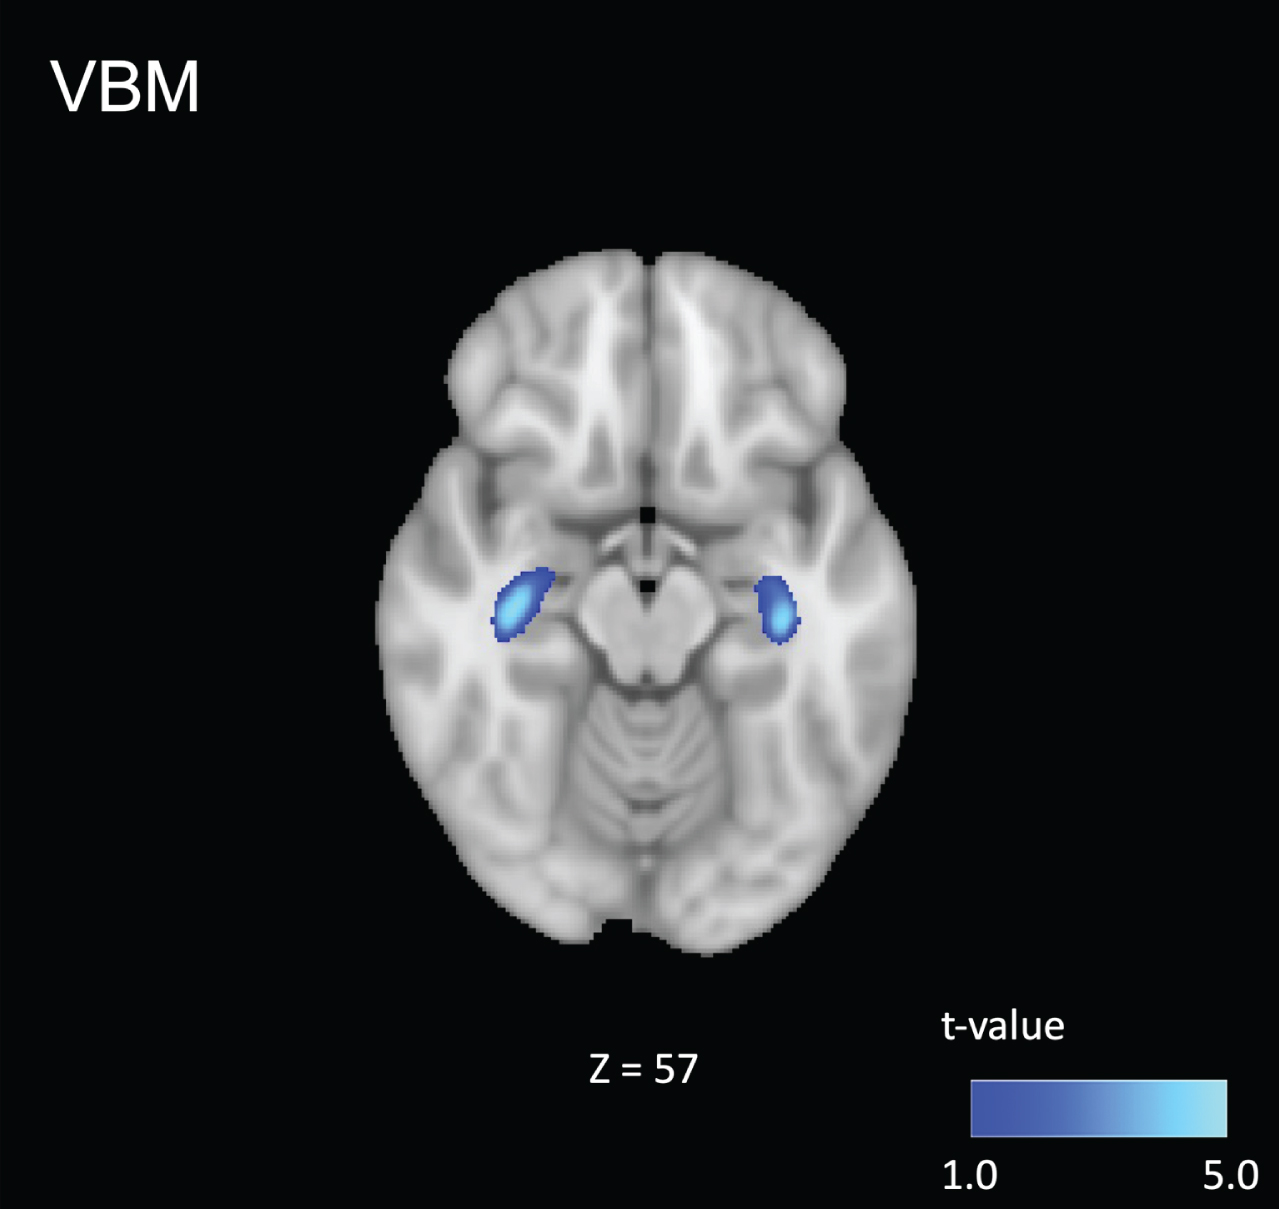
Voxel-based morphometry analysis showed GM volume loss in the hippocampus in the AD-S group compared to that in the control group (p < 0.001; uncorrected, Fig. 1). No significant differences were found at the cluster level (p < 0.05, FWE-corrected). No significant differences were found between individuals with AD-S and controls for the WM volume (p < 0.001; uncorrected, p < 0.05, FWE).
Fig. 1
Comparison of the patients in the Alzheimer’s spectrum group (AD-S) with healthy controls. Voxel-based morphometry analysis showed gray matter volume loss in the hippocampus of patients in the AD-S group compared to that in the control group (p < 0.001; uncorrected). Blue-light blue voxels represent lower values.
Gray matter-based spatial statistics and ROI analysis
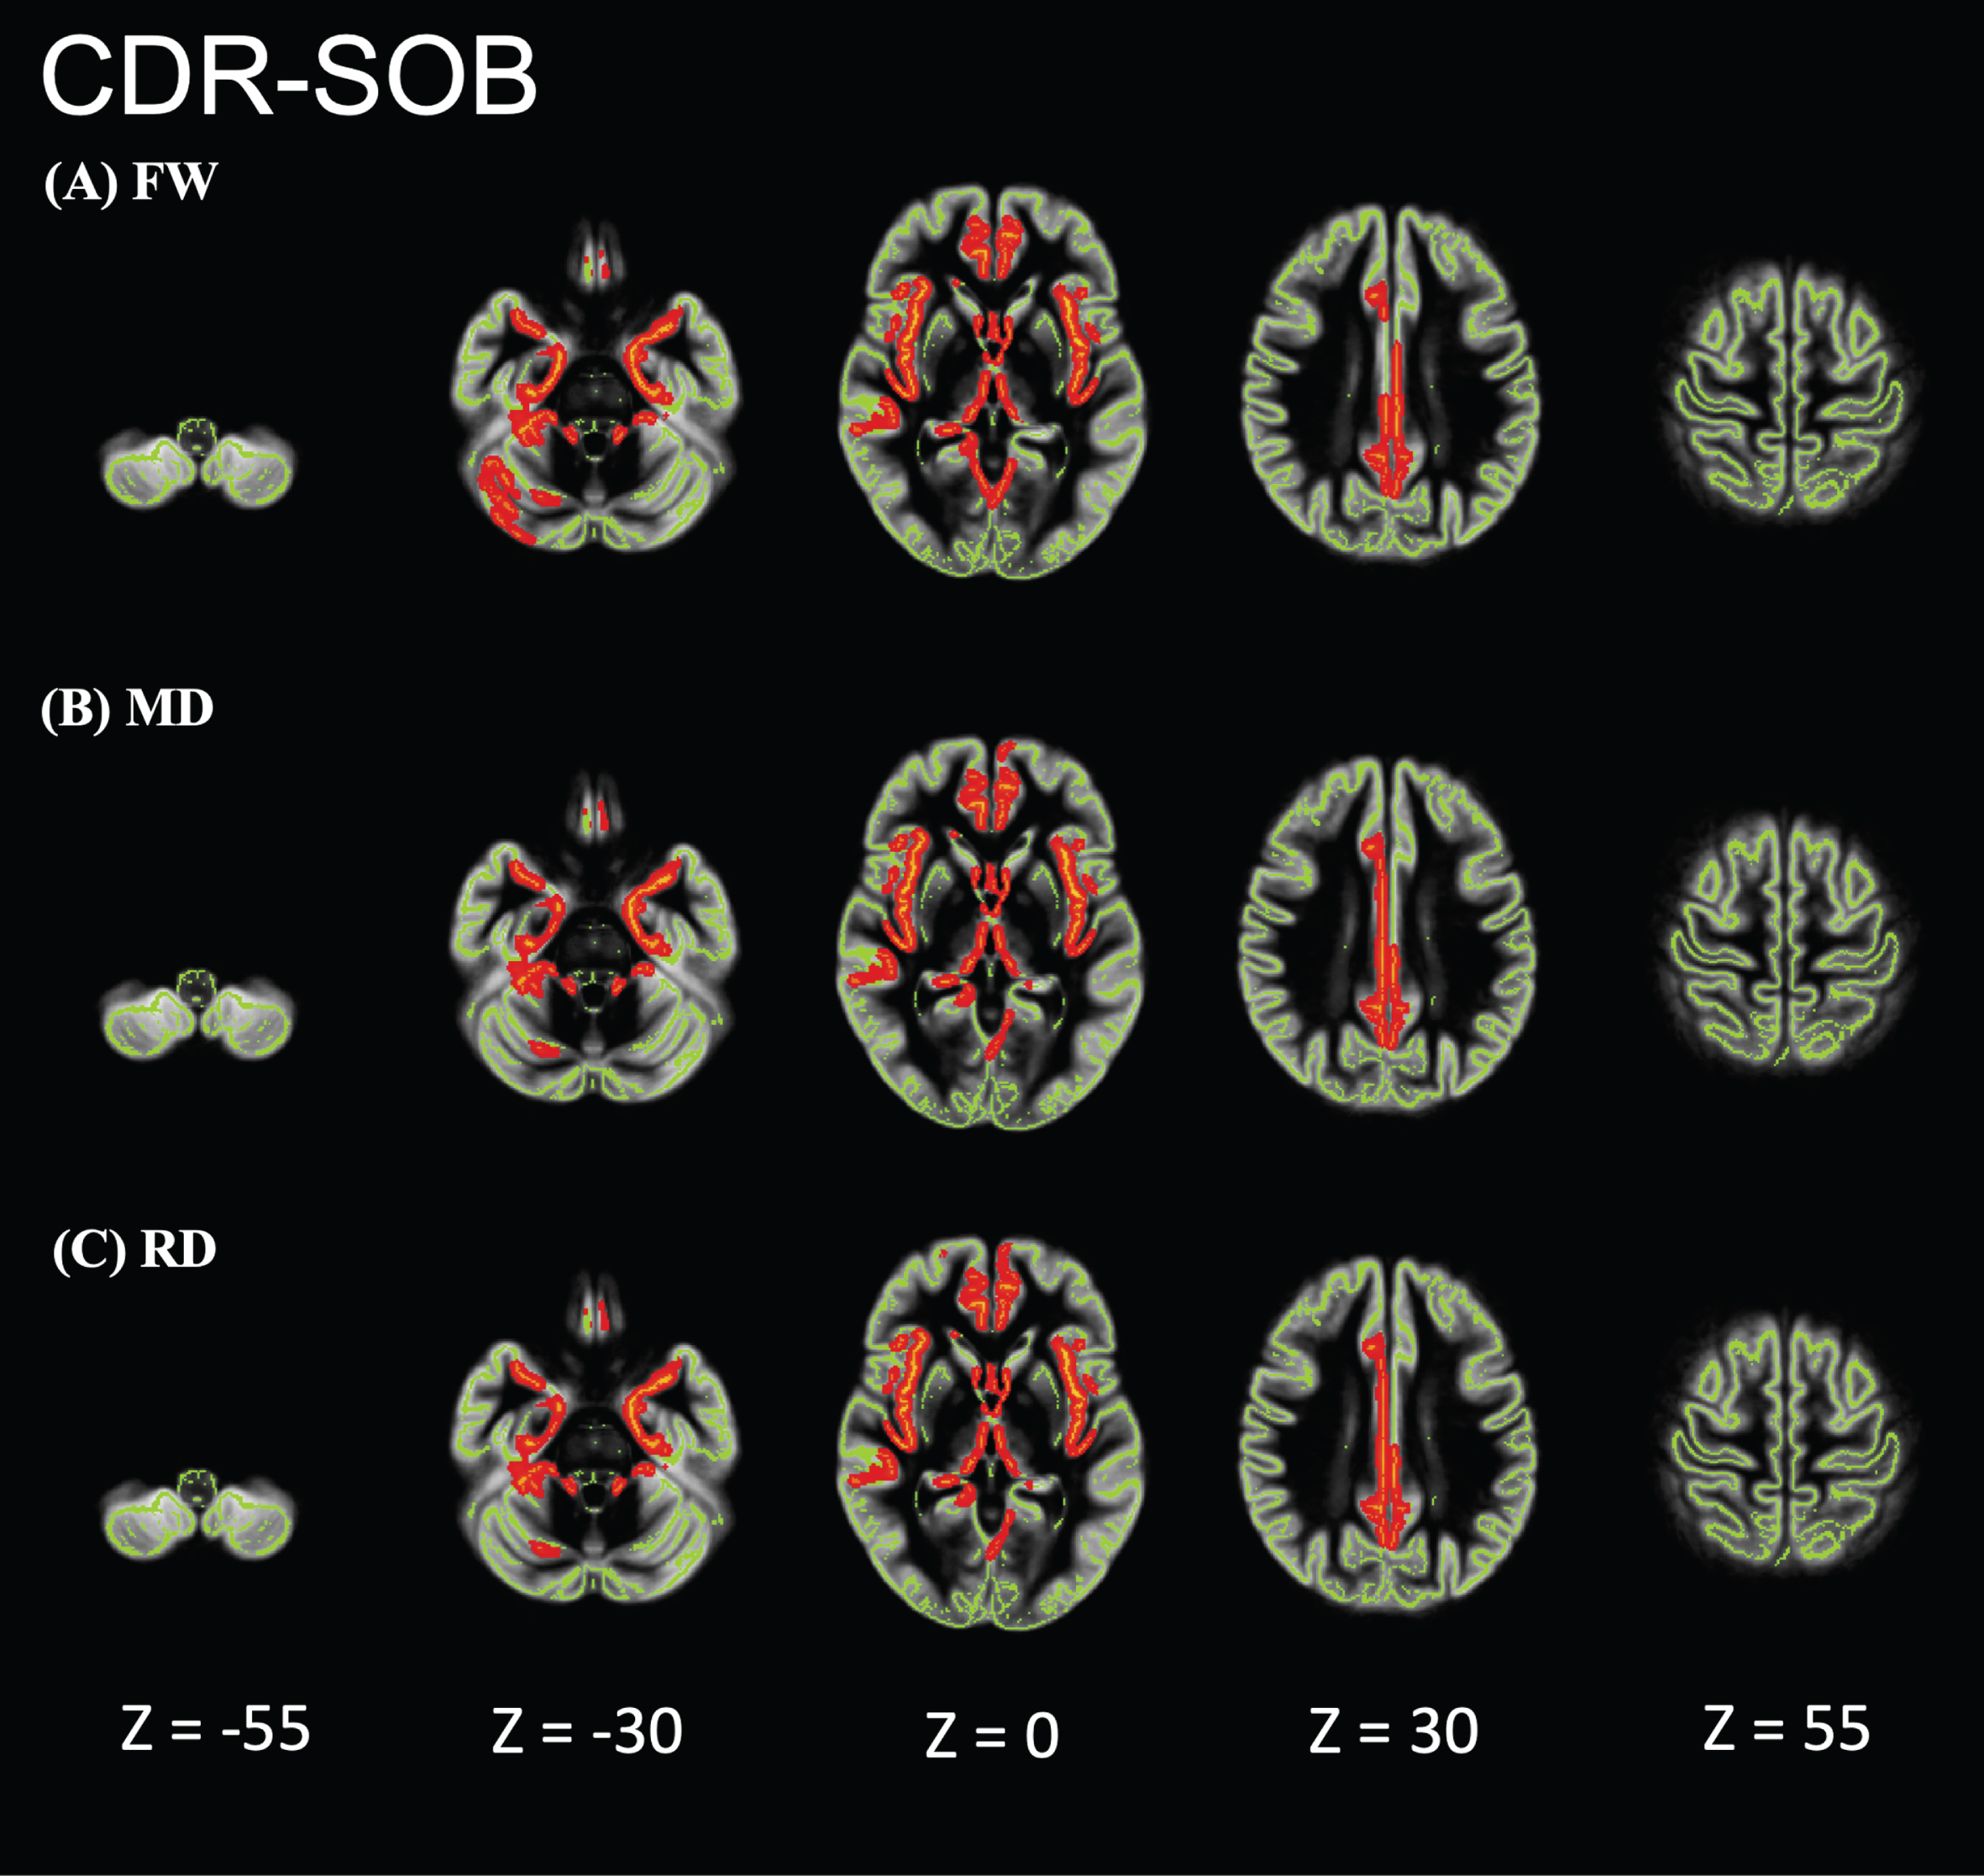
Individuals with AD showed significantly higher FW, MD, and RD values than did HCs in the limbic areas, precuneus, frontal lobe, temporal lobe, right putamen, and cerebellum (Fig. 2). However, the FA, axial diffusivity, and free-water-corrected DTI metrics (FA, MD, RD) did not significantly differ between individuals with AD and HCs (data not shown). In the GBSS analysis, no correlation was found between FW or DTI and age, sex, or education. GBSS analyses of the relationship between MoCA, MMSE, CDR-SOB, and FW metrics in the AD-S group showed significant correlations in the limbic areas, precuneus, frontal lobe, and temporal lobe (Figs. 3–5).
Fig. 2
Comparison of the patients in the Alzheimer’s disease-spectrum group (AD-S) with healthy controls (HCs). AD-S patients showed significantly higher free water (FW), mean diffusivity (MD), and radial diffusivity (RD) values than did HCs in the limbic areas, precuneus, frontal lobe, temporal lobe, right putamen, and cerebellum. Red-yellow represents higher values. The skeleton is represented in green.
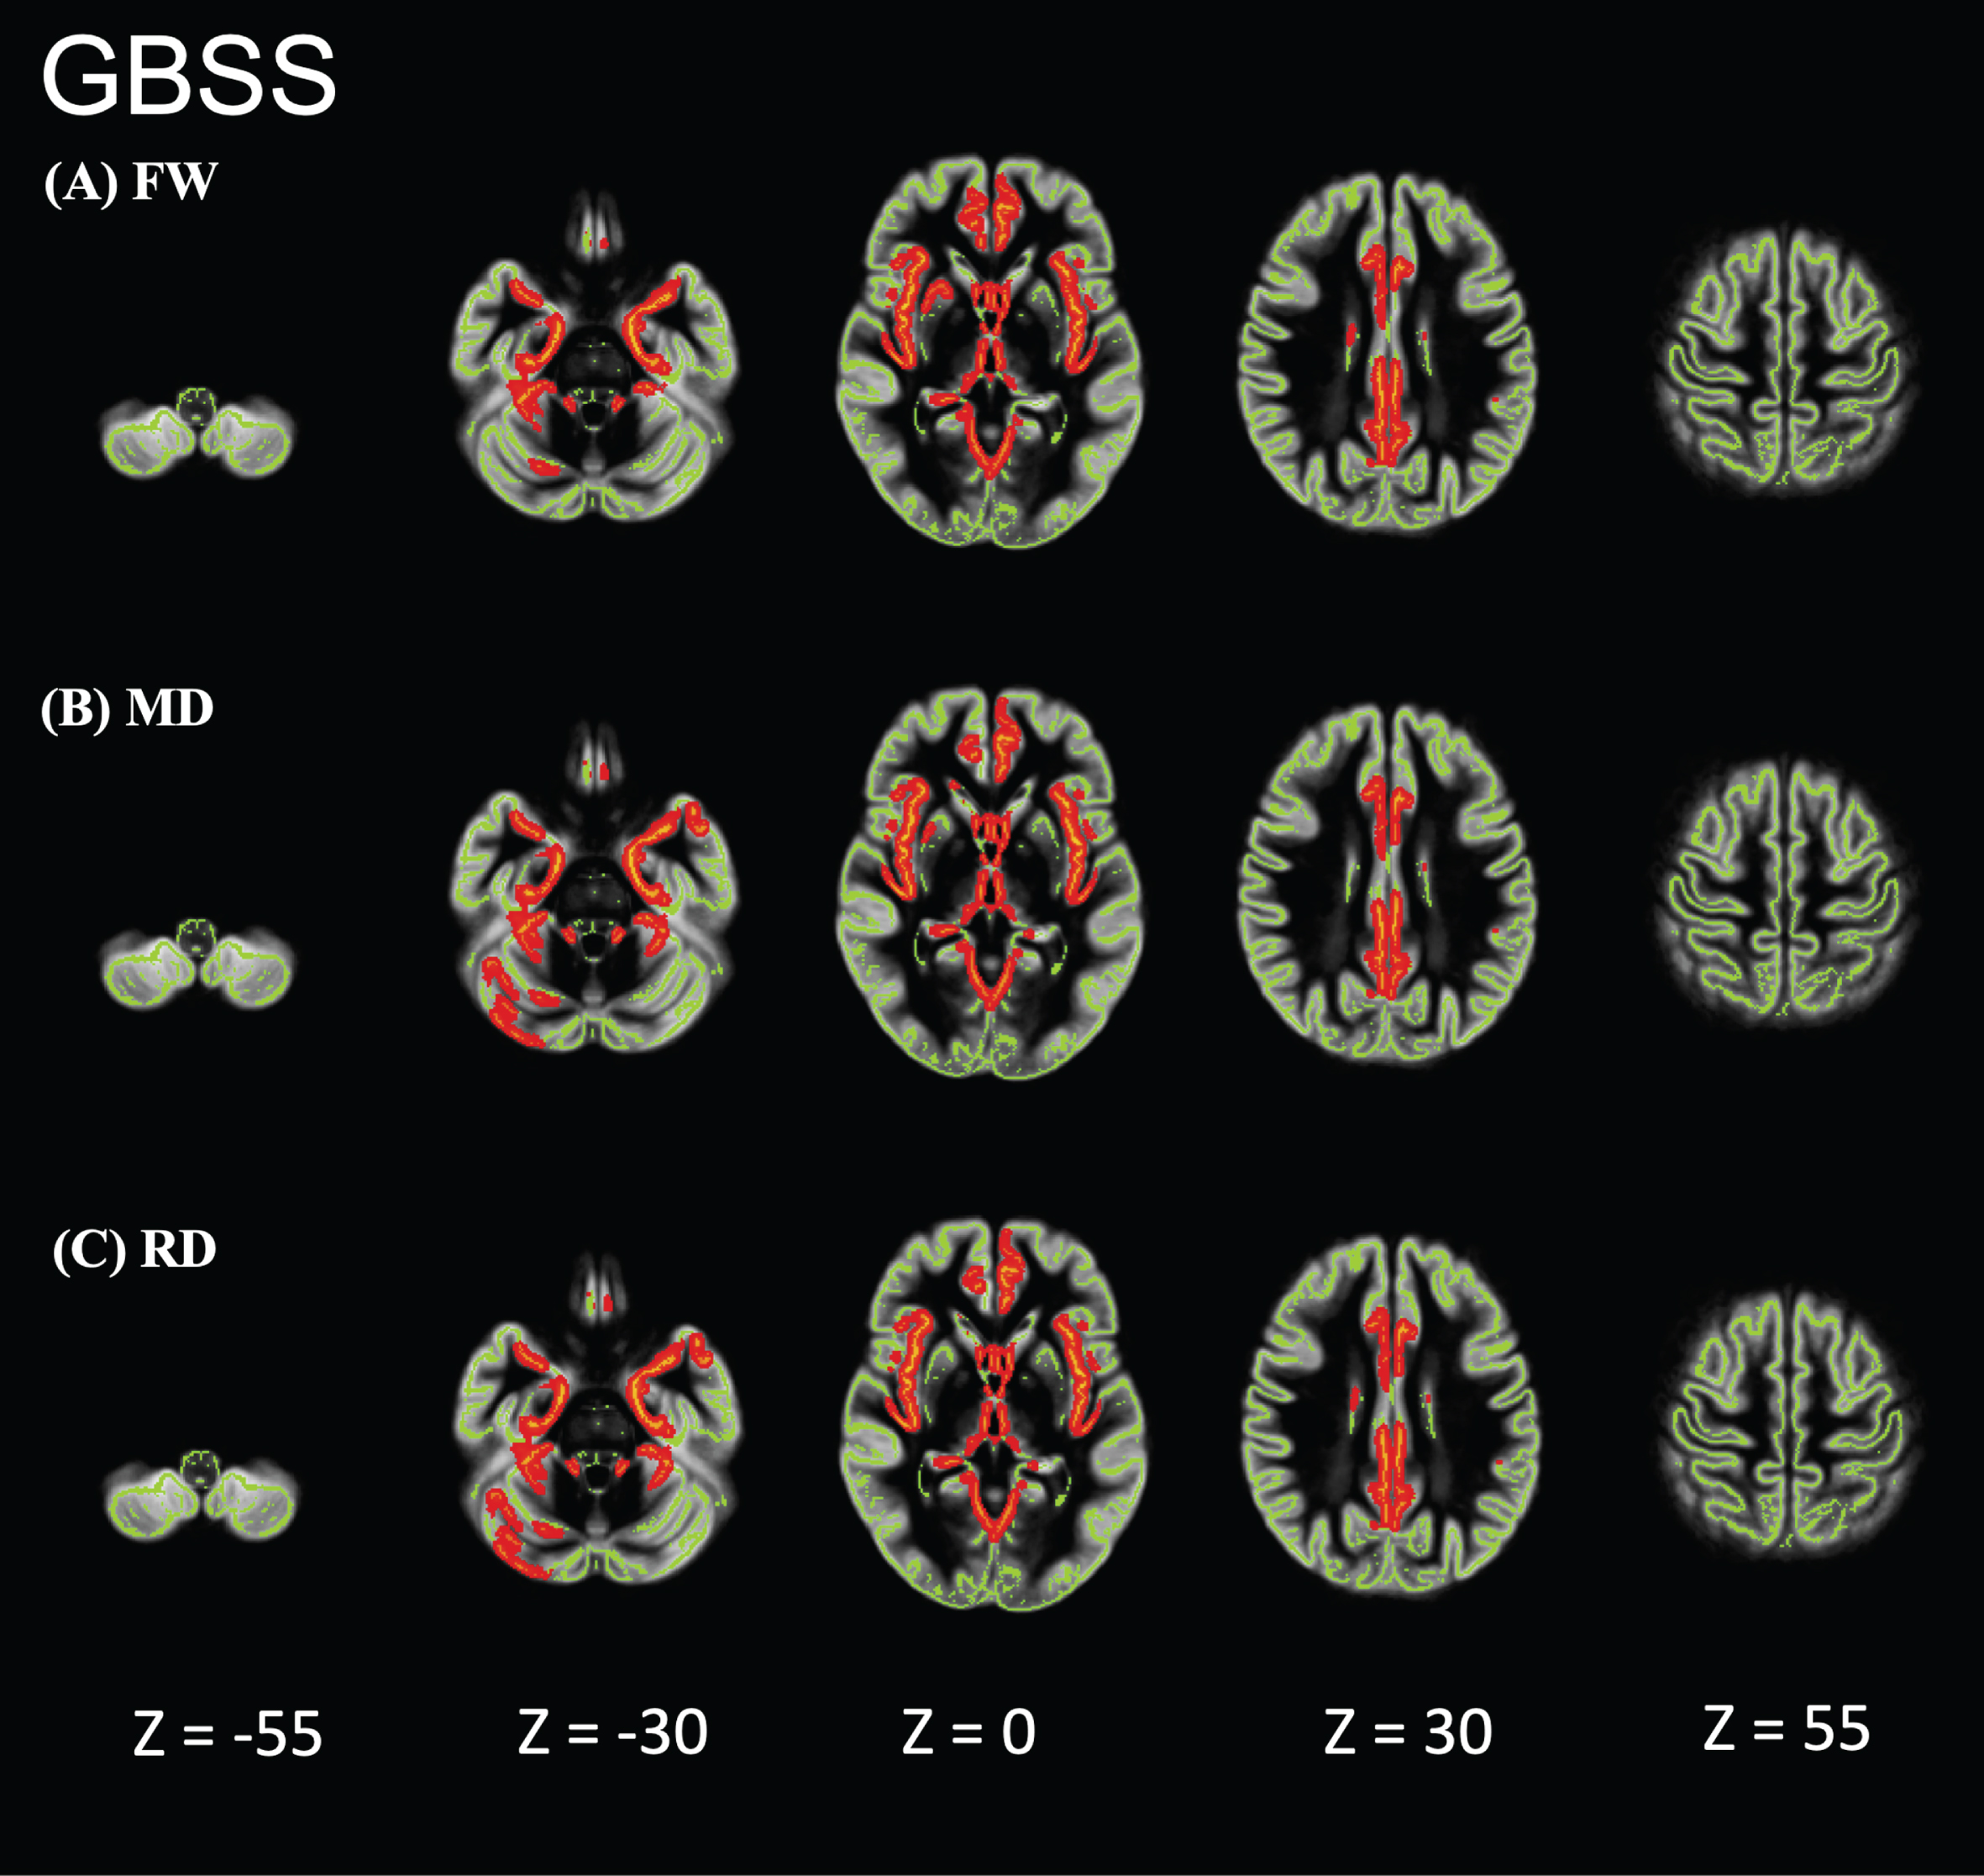
Fig. 3
Relationship between Montreal Cognitive Assessment (MoCA) and FW metrics of patients in the Alzheimer’s disease-spectrum group (AD-S). AD-S patients showed significant negative correlations in the limbic areas, precuneus, frontal lobe, and temporal lobe. Blue-light blue voxels represent lower values. The skeleton is represented in green.
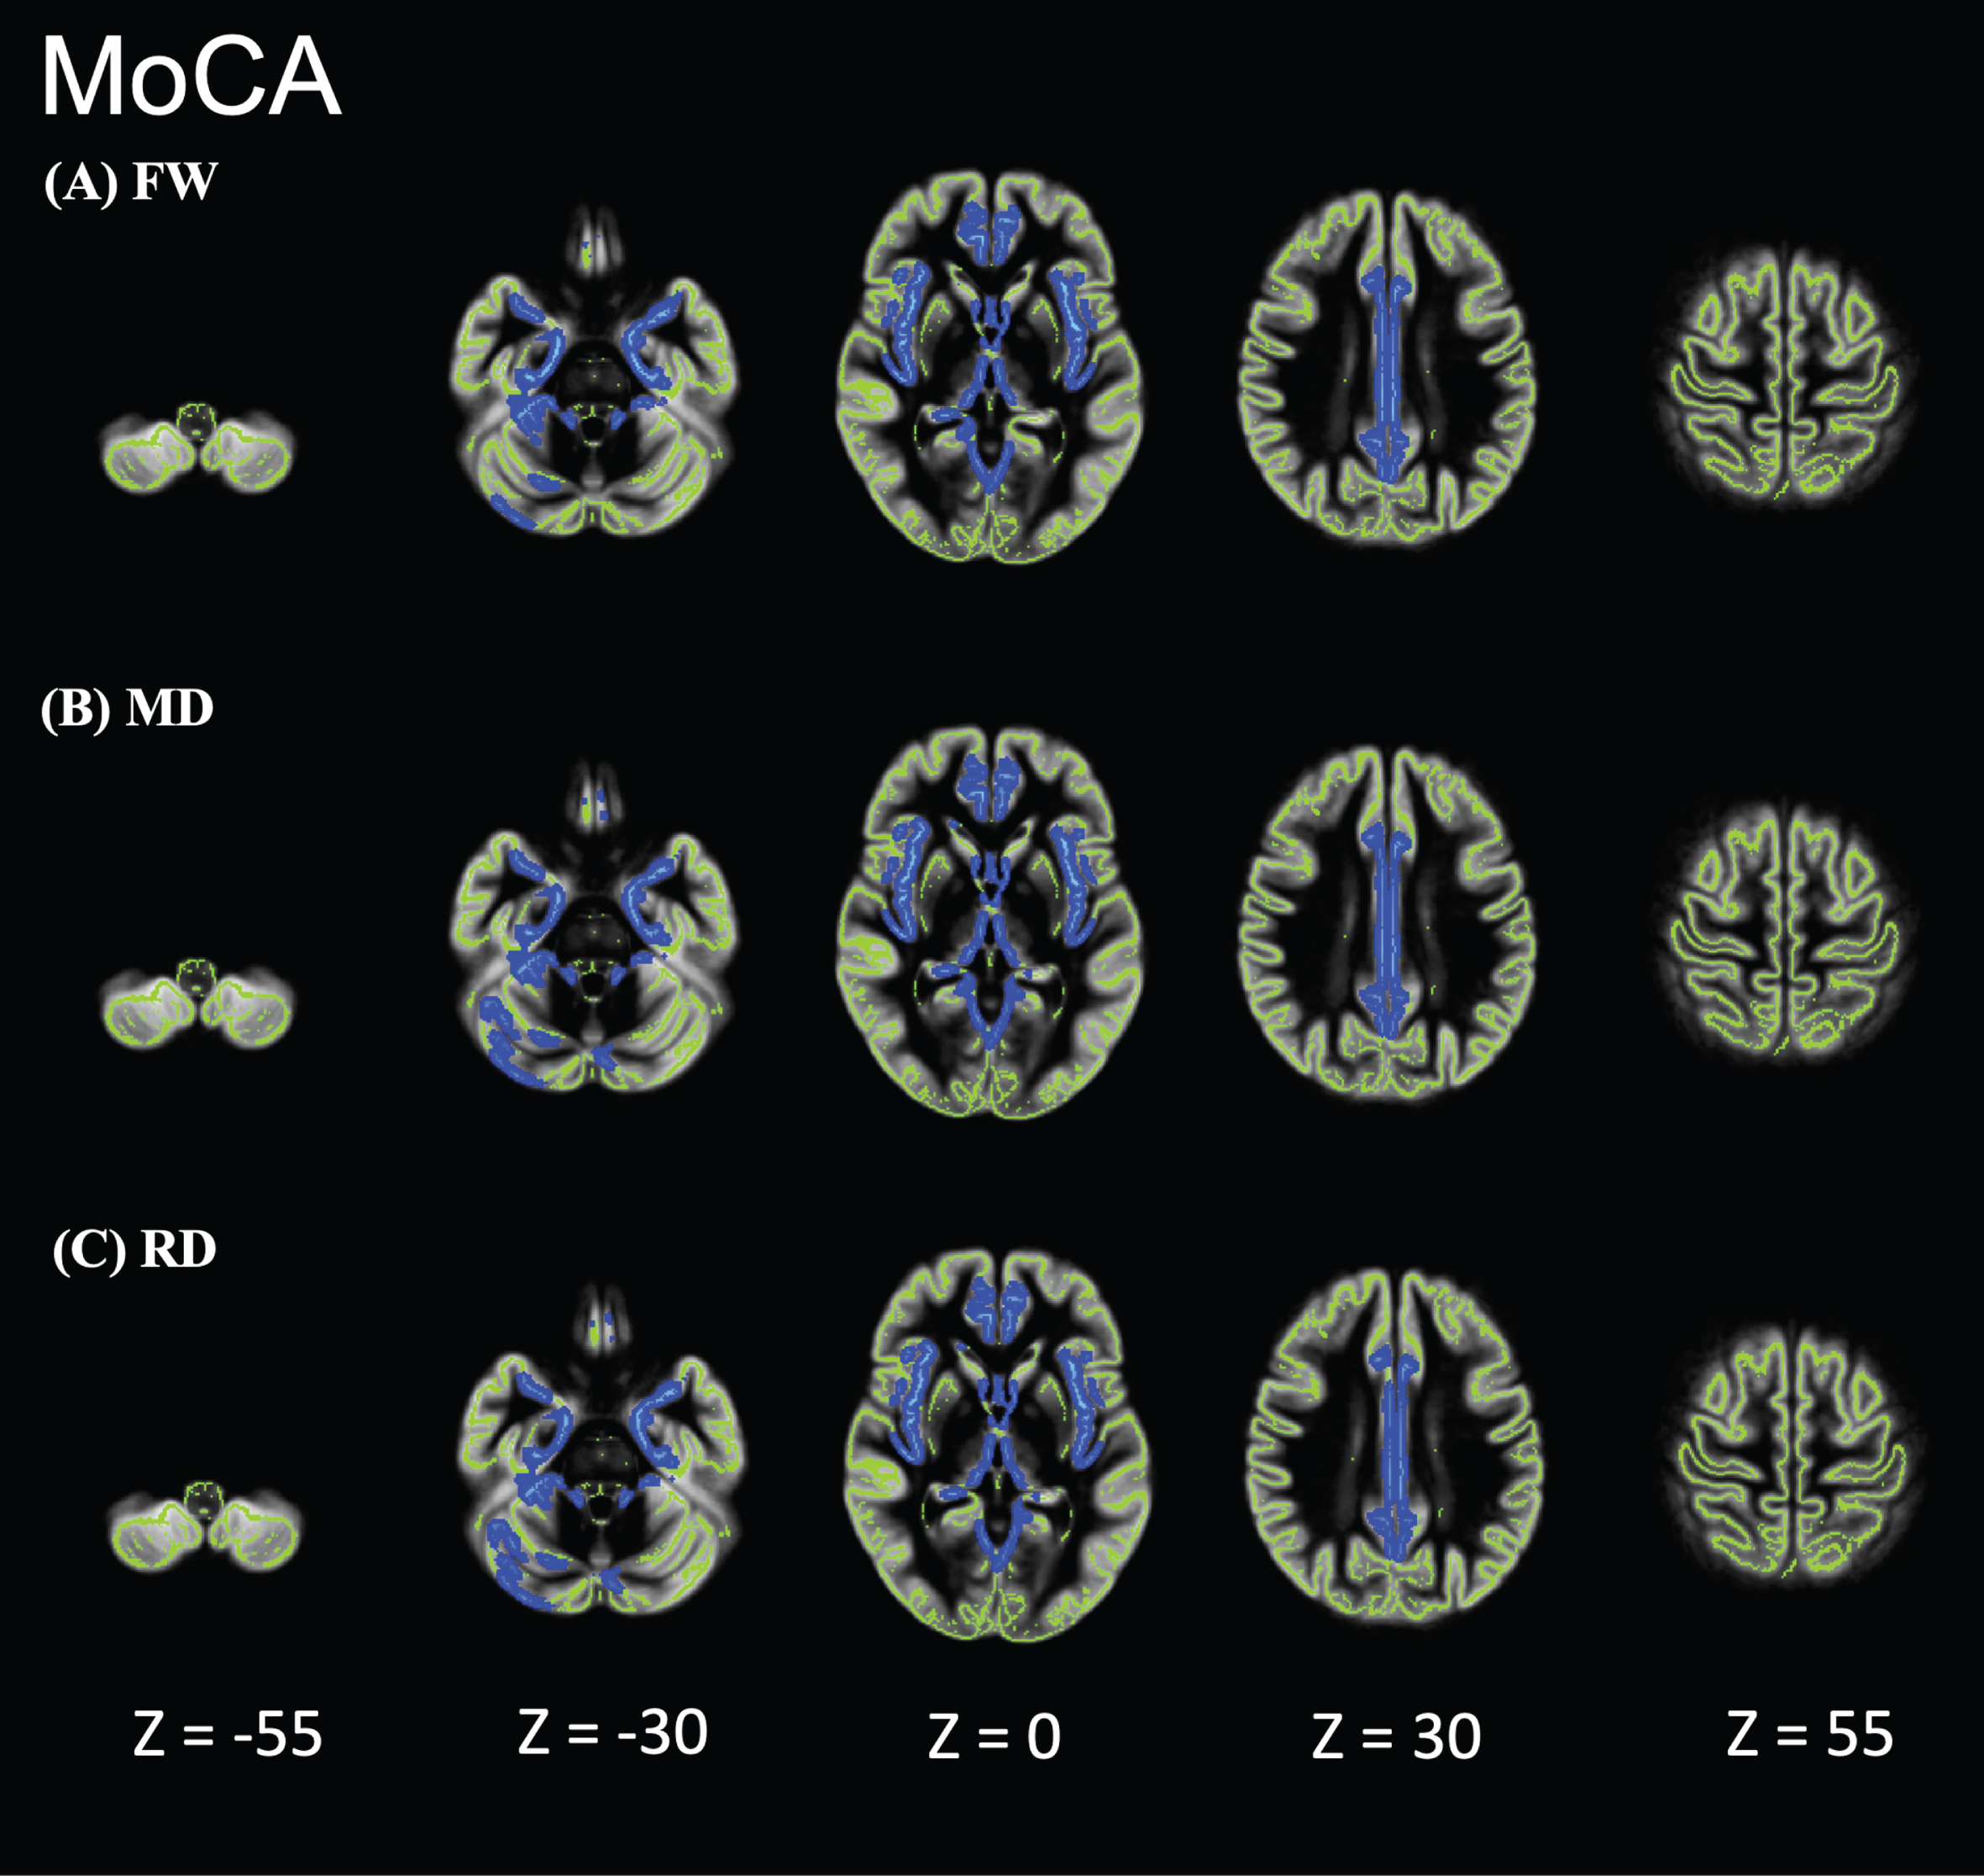
Fig. 4
Relationship between Mini-Mental State Examination (MMSE) and FW metrics of patients in the Alzheimer’s disease-spectrum group (AD-S). AD-S patients showed significant negative correlations in the limbic areas, precuneus, frontal lobe, and temporal lobe. Blue-light blue voxels represent lower values. The skeleton is represented in green.
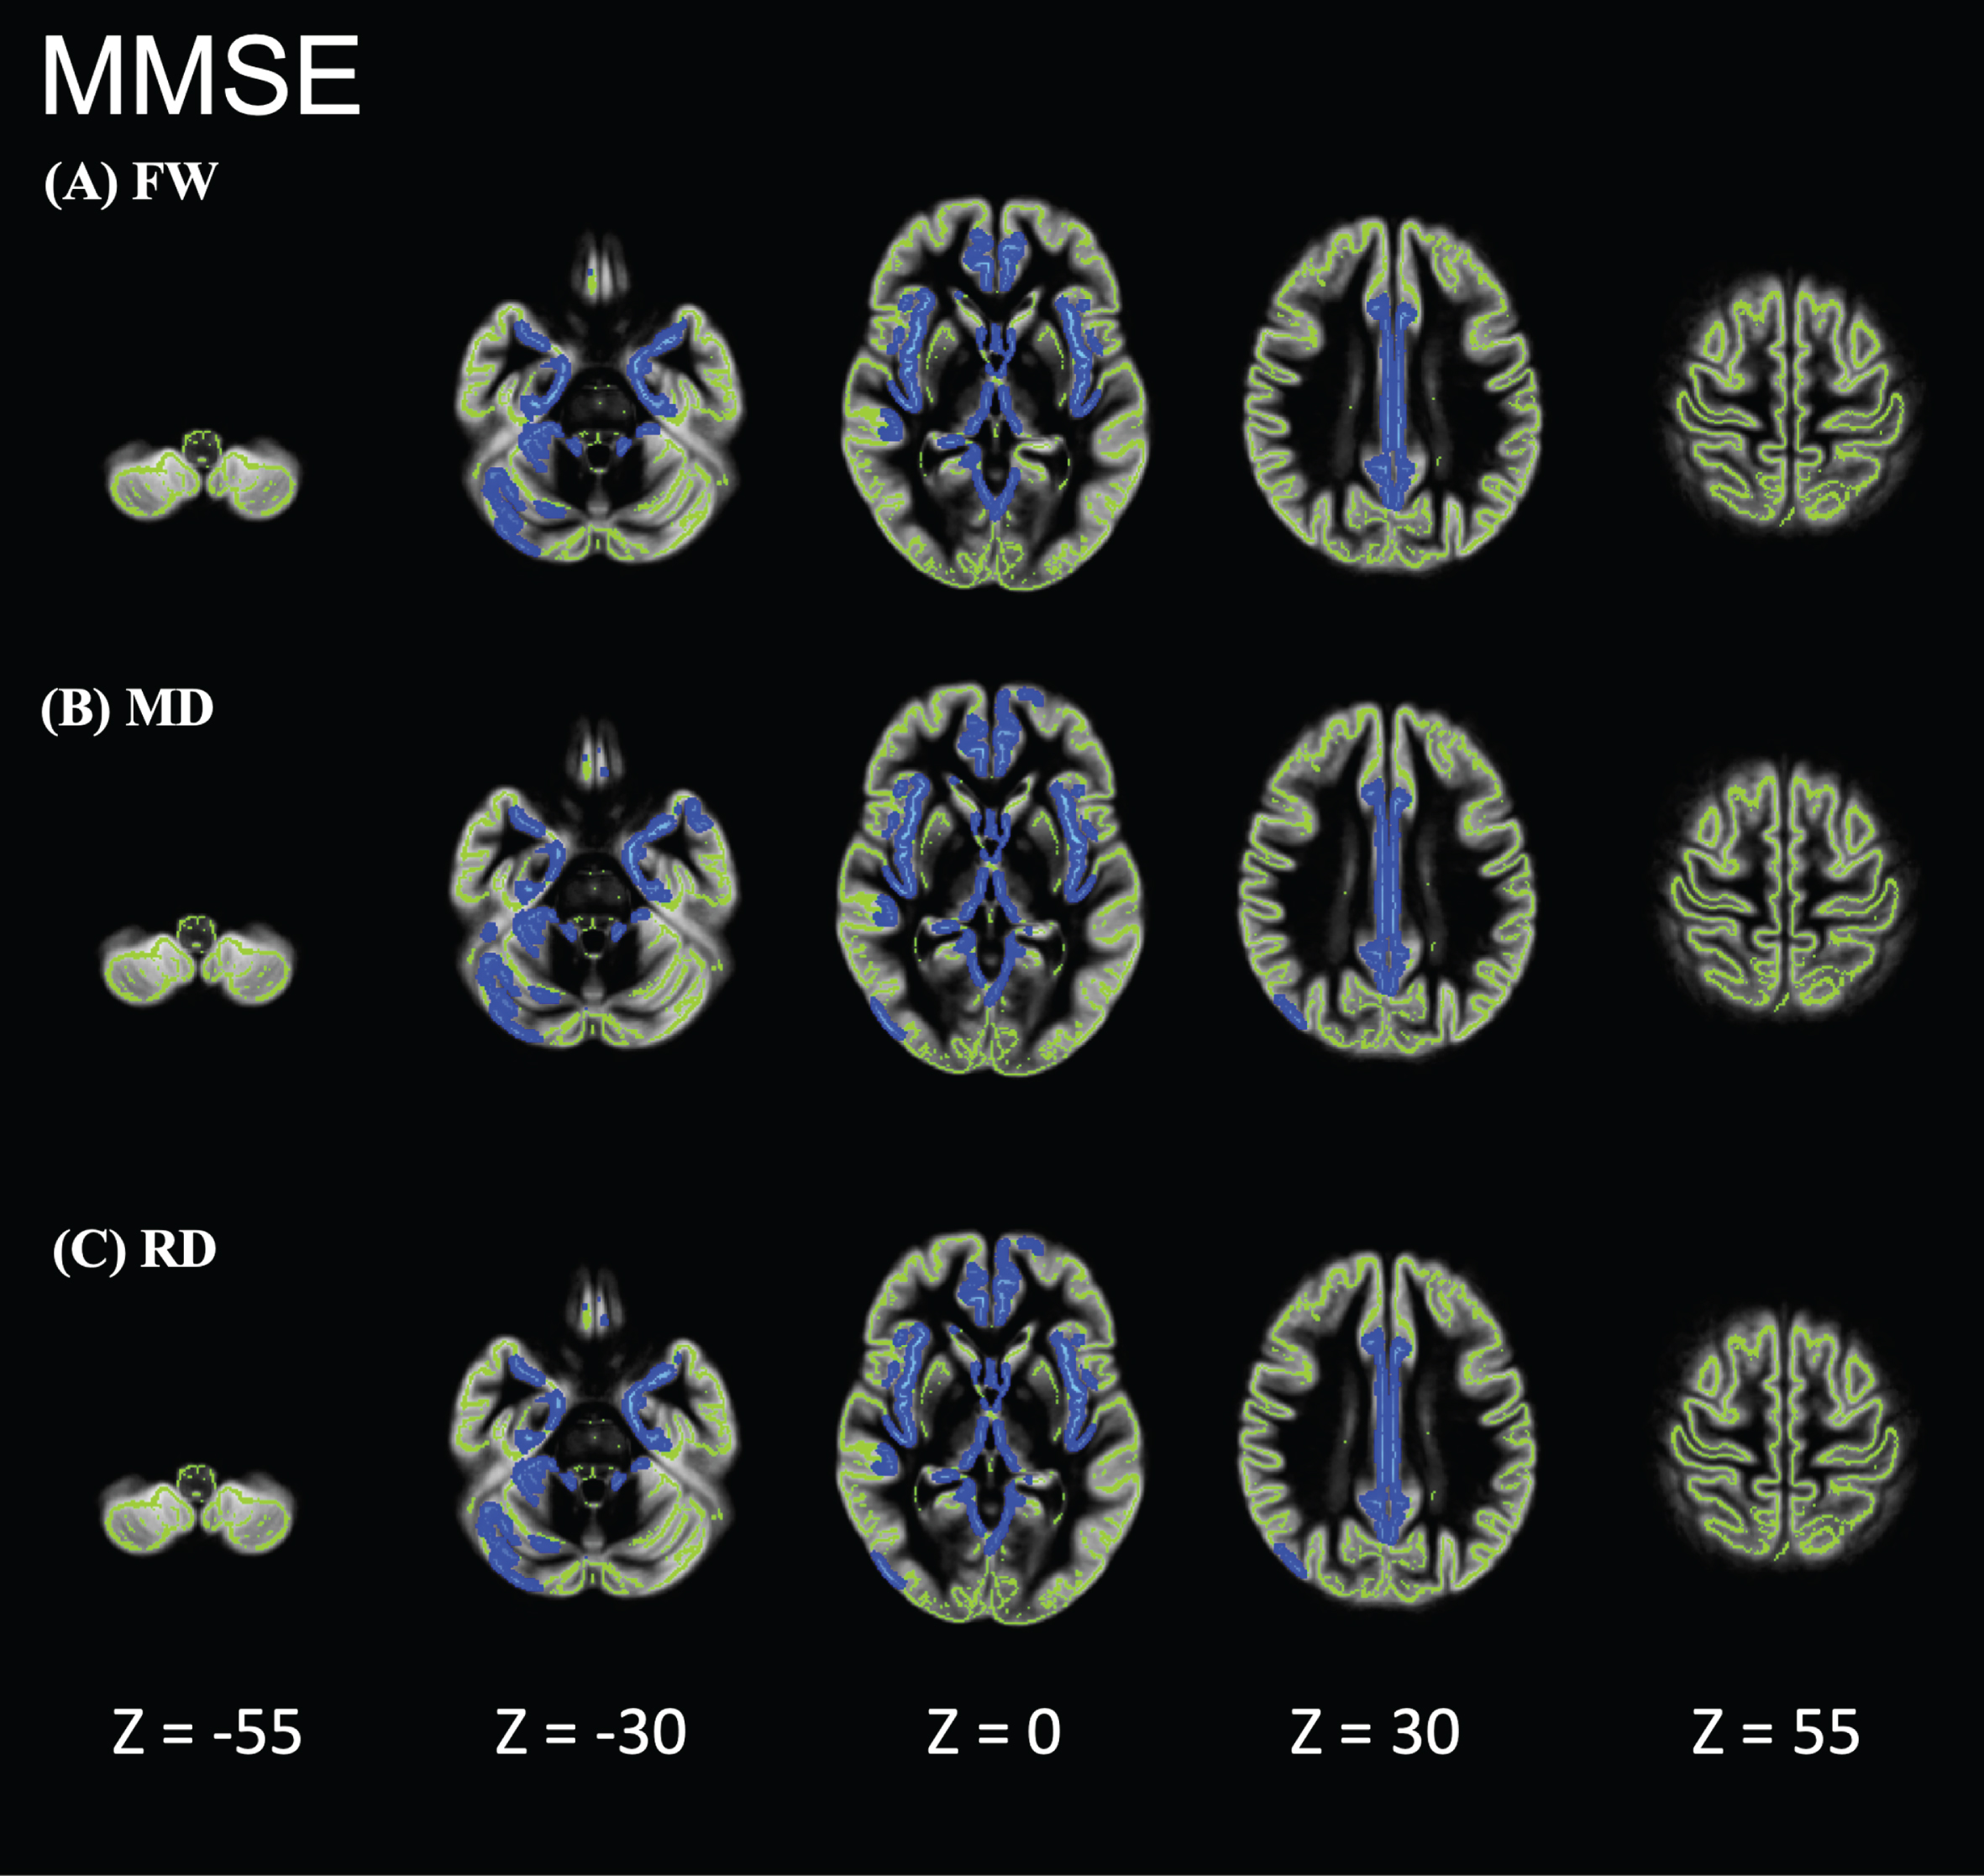
Fig. 5
Relationship between Clinical Dementia Rating-Sum of Boxes (CDR-SOB) and FW metrics of patients in the Alzheimer’s disease-spectrum group (AD-S). AD-S patients showed significant positive correlations in the limbic areas, precuneus, frontal lobe, and temporal lobe. Red-yellow represents higher values. The skeleton is represented in green.
Region of interest analysis showed that individuals with AD had significantly higher FW, MD, and RD values than did HCs. The effect sizes of FW were greater than those of MD and RD (Table 2). The areas with effect sizes exceeding 1.10 for FW were the amygdala, posterior cingulate, hippocampus, parahippocampus, and precuneus, which are supposed to be vulnerable to AD pathology.
Table 2
Effect sizes in the ROI analysis
| FW | MD | RD | |
| Amygdala_L | 1.49 | 1.28 | 1.27 |
| Amygdala_R | 0.92 | 1.07 | 1.03 |
| Cingulate_Mid_L | 0.69 | 0.65 | 0.65 |
| Cingulate_Mid_R | 0.95 | 0.89 | 0.89 |
| Cingulate_Post_L | 1.08 | 1.04 | 1.05 |
| Cingulate_Post_R | 1.24 | 1.23 | 1.24 |
| Cuneus_L | 0.66 | 0.68 | 0.69 |
| Cuneus_R | 0.91 | 0.87 | 0.87 |
| Frontal_Med_Orb_R | 0.78 | 0.53 | 0.53 |
| Frontal_Inf_Oper_L | 0.70 | 0.58 | 0.57 |
| Frontal_Inf_Oper_R | 0.99 | 0.79 | 0.78 |
| Frontal_Inf_Orb_2_L | 0.76 | 0.67 | 0.67 |
| Frontal_Inf_Orb_2_R | 1.00 | 0.82 | 0.81 |
| Frontal_Inf_Tri_L | 0.76 | 0.58 | 0.58 |
| Frontal_Inf_Tri_R | 1.09 | 0.82 | 0.83 |
| Frontal_Med_Orb_L | 0.85 | 0.76 | 0.76 |
| Frontal_Mid_2_L | 0.66 | 0.51 | 0.51 |
| Frontal_Mid_2_R | 0.91 | 0.77 | 0.76 |
| Frontal_Sup_2_L | 0.71 | 0.59 | 0.58 |
| Frontal_Sup_2_R | 0.77 | 0.70 | 0.69 |
| Frontal_Sup_Medial_L | 0.85 | 0.76 | 0.75 |
| Frontal_Sup_Medial_R | 0.75 | 0.63 | 0.61 |
| Hippocampus_L | 1.11 | 1.02 | 1.03 |
| Hippocampus_R | 1.13 | 1.13 | 1.13 |
| Insula_L | 0.98 | 0.85 | 0.86 |
| Insula_R | 1.07 | 0.95 | 0.96 |
| ParaHippocampal_L | 1.15 | 1.02 | 1.03 |
| ParaHippocampal_R | 1.01 | 1.07 | 1.10 |
| Precentral_L | 0.62 | 0.56 | 0.56 |
| Precentral_R | 0.79 | 0.65 | 0.65 |
| Precuneus_L | 0.92 | 0.87 | 0.88 |
| Precuneus_R | 1.21 | 1.14 | 1.14 |
| Temporal_Inf_L | 1.01 | 0.97 | 0.98 |
| Temporal_Inf_R | 1.09 | 0.95 | 0.95 |
| Temporal_Mid_L | 0.90 | 0.94 | 0.93 |
| Temporal_Mid_R | 0.95 | 0.91 | 0.90 |
| Temporal_Pole_Mid_L | 1.03 | 0.95 | 0.97 |
| Temporal_Pole_Mid_R | 0.95 | 0.79 | 0.79 |
| Temporal_Pole_Sup_L | 0.92 | 0.86 | 0.85 |
| Temporal_Pole_Sup_R | 1.00 | 0.71 | 0.69 |
| Temporal_Sup_L | 0.85 | 0.78 | 0.77 |
| Temporal_Sup_R | 0.88 | 0.81 | 0.80 |
FW, free water; L, Left; MD, mean diffusivity; R, Right, RD, radial diffusivity; ROI, region of interest.
In the correlation between FW and cortical volume, significant correlations were noted in the amygdala, posterior cingulate, hippocampus, parahippocampus, and the precuneus. Conversely, significant correlations between FW and regional SUVR were only observed in some areas, such as the posterior cingulate (Table 3).
Table 3
Correlations between FW and GM volume or regional PiB SUVR
| FW and GM volume | FW and PiB SUVR | |||
| r | p | r | p | |
| Amygdala_L | –0.60 | <0.001 | 0.03 | 0.83 |
| Amygdala_R | –0.63 | <0.001 | –0.05 | 0.71 |
| Cingulate_Mid_L | –0.65 | <0.001 | 0.37 | <0.001 |
| Cingulate_Mid_R | –0.67 | <0.001 | 0.38 | <0.001 |
| Cingulate_Post_L | –0.06 | 0.66 | 0.47 | <0.001 |
| Cingulate_Post_R | –0.41 | <0.001 | 0.48 | <0.001 |
| Cuneus_L | –0.63 | <0.001 | 0.20 | 0.10 |
| Cuneus_R | –0.59 | <0.001 | 0.18 | 0.16 |
| Frontal_Med_Orb_R | –0.54 | <0.001 | 0.19 | 0.13 |
| Frontal_Inf_Oper_L | –0.71 | <0.001 | 0.34 | <0.001 |
(Continued)
Table 3
(Continued)
| FW and GM volume | FW and PiB SUVR | |||
| r | p | r | p | |
| Frontal_Inf_Oper_R | –0.64 | <0.001 | 0.35 | <0.001 |
| Frontal_Inf_Tri_L | –0.76 | <0.001 | 0.44 | <0.001 |
| Frontal_Inf_Tri_R | –0.47 | <0.001 | 0.28 | 0.02 |
| Frontal_Med_Orb_L | –0.62 | <0.001 | 0.32 | 0.01 |
| Frontal_Mid_2_L | –0.61 | <0.001 | 0.32 | 0.01 |
| Frontal_Mid_2_R | –0.50 | <0.001 | 0.27 | 0.03 |
| Frontal_Sup_2_L | –0.61 | <0.001 | 0.17 | 0.17 |
| Frontal_Sup_2_R | –0.67 | <0.001 | 0.18 | 0.14 |
| Frontal_Sup_Medial_L | –0.81 | <0.001 | 0.25 | 0.04 |
| Frontal_Sup_Medial_R | –0.63 | <0.001 | 0.19 | 0.11 |
| Hippocampus_L | –0.84 | <0.001 | –0.25 | 0.04 |
| Hippocampus_R | –0.84 | <0.001 | –0.14 | 0.26 |
| Insula_L | –0.66 | <0.001 | 0.36 | <0.001 |
| Insula_R | –0.88 | <0.001 | 0.37 | <0.001 |
| ParaHippocampal_L | –0.70 | <0.001 | 0.29 | 0.02 |
| ParaHippocampal_R | –0.72 | <0.001 | 0.37 | <0.001 |
| Precentral_L | –0.60 | <0.001 | 0.05 | 0.71 |
| Precentral_R | –0.63 | <0.001 | 0.01 | 0.94 |
| Precuneus_L | –0.72 | <0.001 | 0.25 | 0.04 |
| Precuneus_R | –0.64 | <0.001 | 0.24 | 0.05 |
| Temporal_Inf_L | –0.47 | <0.001 | 0.41 | <0.001 |
| Temporal_Inf_R | –0.72 | <0.001 | 0.41 | <0.001 |
| Temporal_Mid_L | –0.69 | <0.001 | 0.47 | <0.001 |
| Temporal_Mid_R | –0.79 | <0.001 | 0.39 | <0.001 |
| Temporal_Pole_Mid_L | –0.42 | <0.001 | 0.05 | 0.72 |
| Temporal_Pole_Mid_R | –0.69 | <0.001 | 0.22 | 0.08 |
| Temporal_Pole_Sup_L | –0.67 | <0.001 | 0.18 | 0.14 |
| Temporal_Pole_Sup_R | –0.51 | <0.001 | 0.18 | 0.14 |
| Temporal_Sup_L | –0.75 | <0.001 | 0.35 | <0.001 |
| Temporal_Sup_R | –0.81 | <0.001 | 0.35 | <0.001 |
FW, Free Water; GM, Gray Matter; L, Light; SUVR, Standardized Uptake Value Ratio; R, Right; ROI, Region of Interest.
DISCUSSION
We used DTI and FW models to examine cortical microstructural changes in individuals with AD-S compared to those in the HC group. Voxel-based morphometry analysis detected decreased GM volume only in the hippocampus of individuals with AD-S. However, GBSS analysis showed that individuals with AD had increased MD, RD, and FW in the medial temporal lobe, posterior cingulate, and precuneus, which are thought to be affected by AD. In addition, ROI analysis in the AD-S group showed that the effect sizes of FW were greater than those of MD and RD. This study utilizes GBSS along with FW metrics to improve our understanding of AD pathology. The study findings contribute to the growing body of research by highlighting the potential of FW metrics, obtained through GBSS, as markers for AD pathology. This approach enhances our ability to characterize microstructural alterations within GM in AD, offering insights into neurodegenerative processes of the disease.
The morphological changes in patients with AD were characterized by atrophy of the medial temporal lobe, encompassing the hippocampus, entorhinal cortex, and amygdala [26–28]. This finding was confirmed by previous studies using the VBM method and comparative analysis of patients with AD and healthy individuals [29–32]. Our study also detected decreased GM volume in the hippocampus of individuals with AD-S by VBM analysis. Voxel-based morphometry automatically analyzes the size of each voxel in the segmented tissue to identify volume differences that are indicative of GM atrophy or local WM density changes. Therefore, VBM can avoid the subjective differences caused by artificially depicting ROIs without being biased toward structural changes in specific brain regions and can objectively and comprehensively assess anatomical changes throughout the brain. Thus, minute changes in brain volume or density in the early stages of AD can be detected using VBM analysis [33].
In this study, we utilized FWI in conjunction with GBSS to assess GM alterations in individuals with AD-S. FWI offers several advantages over DTI. Although DTI was widely used to measure water diffusion and infer microstructural properties, it may not accurately represent nonspecific water molecules in extracellular spaces owing to the partial-volume effect [34]. MD measures the average diffusion within a voxel, sensitive to changes in the tissue microenvironment, including both intra- and extracellular spaces [35]. Conversely, RD indicates diffusion perpendicular to the principal direction of fiber tracts, often associated with myelin damage in WM [36]. In contrast, FWI can differentiate between intra- and extracellular water and depict extracellular water, providing a more accurate measure of neurodegeneration-related changes [37]. The correlation between these measures can vary depending on the pathological context. Elevated FW suggests augmented extracellular space, possibly due to neurodegeneration or inflammation, which would also affect MD by increasing overall diffusivity. However, the extent to which FW contributes to MD changes can depend on the specific brain region and the stage of AD. Regions with significant neuroinflammatory responses may exhibit a stronger correlation between FW and MD increases. Regarding the observation of higher effect sizes for FW compared to MD in certain regions, and the similarity of many effect sizes, it is plausible to interpret that the contribution of FW to the observed MD changes is substantial in areas with pronounced AD pathology. This is consistent with the hypothesis that neuroinflammatory processes, reflected by increased FW, play a critical role in the microstructural alterations observed in AD. Nevertheless, in regions where Cohen’s d is higher for MD, other factors beyond FW, such as intracellular edema or tissue loss, might contribute more significantly to the MD increase. Future studies employing advanced modeling techniques that can separate these contributions within the AD brain are necessary to precisely quantify the impact of FW on MD alterations [38].
Specifically, in the context of AD, increased FW could reflect loss of cellular integrity and increased extracellular space due to neuronal loss and degeneration. The increase in FW observed in AD patients is predominantly pathological [13, 23]. The pathological basis is supported by the fact that AD is characterized by neuronal loss, amyloid-beta plaque accumulation, and neurofibrillary tangles, all of which contribute to the brain’s microstructural alterations [39]. By providing a more direct measure of these pathological changes, FW imaging can detect subtle neurodegenerative changes earlier and with greater specificity than conventional DTI metrics, as described by Sun et al. [40]. For instance, Maillard et al. demonstrated the potential of FWI in detecting early microstructural changes in the brain that are associated with cognitive decline, a hallmark of AD [41]. In addition, increased levels of FW in the hippocampus have been documented in AD [13, 23]. The association between FW changes and amyloid accumulation can be discussed in terms of indirect relations [23]. While no direct evidence from pathological studies is available, a suggested relationship between PET scans, cerebrospinal fluid amyloid-beta, and increased levels of FW has been hypothesized [13]. An indirect link has been suggested through the pathological progression of AD, where amyloid buildup causes neuronal degeneration [42]. This degeneration leads to an expanded extracellular space, indicated by higher FW, as noted in earlier studies [13]. Disruption of the cortical minicolumnar structure in AD represents a critical aspect of its pathology, influencing the diffusion patterns observed in cortical GM. Concurrently, the strong correlation between synaptic density and GM diffusivity underscores the importance of synaptic integrity in the neurodegenerative processes of AD [43]. These insights collectively suggest that the observed increases in FW and changes in diffusion metrics are substantially influenced by the underlying synaptic density, offering a novel perspective on the microstructural alteration’s characteristic of AD.
Our findings revealed a significant elevation in FW within the GM in the AD-S group, particularly in regions such as the medial temporal lobe, posterior cingulate, and precuneus. Region of interest analysis further indicated that FW had a more pronounced effect than did DTI metrics, especially in the temporal pole and medial temporal lobe, indicating the utility of combining GBSS with FWI for characterizing GM alterations in AD. Free water may play a role in neurodegenerative processes, as demonstrated in our previous study [13]. An increase in cortical FW is anticipated during the symptomatic stage of AD, potentially resulting from the breakdown of elements such as myelin cell membranes and cellular components that typically limit water molecule mobility and are linked to the neuroinflammatory response of the blood-brain barrier [13, 44].
Unlike with regional SUVR, our study found a very strong correlation between FW and GM cortical volume and indicated significant correlations between these cognitive scores and FW in the areas that are supposed to be vulnerable regions in AD pathology. Aβ primarily accumulates in the cerebral cortex, and its association with the progression of AD and cognitive impairment has been found to be weak [45]. However, FW may reflect the brain structure and emergence of symptoms more sensitively [46]. The application of GBSS in our study (which was introduced in the context of multicompartment diffusion modeling [47]) provided a robust approach to discern distinct cortical alterations. GBSS also has the advantage of effectively resolving multiple fiber populations within a voxel, offering a more detailed representation of the brain microstructure [48]. In fact, the GBSS analysis in our study revealed significant differences that VBM could not identify. Our study coupled GBSS with FWI to demonstrate the potential to further elucidate AD-related changes and inform future investigations of the GM modifications underlying AD.
Limitations
The limitation of this study was the uncertainty regarding the number of MCI cases. Thus, we do not know the start of the increase in the progression of AD. A further study including participants with mild cognitive impairment can clarify this point.
Conclusion
This study demonstrated the significance of integrating GBSS and FWI for predicting AD pathology and changes in GM. By incorporating FW and GBSS, alterations not detected by VBM can be identified. FW may be more directly associated with cognitive impairments in AD’s progression. These insights could aid in developing enhanced diagnostic and therapeutic approaches, thus improving our comprehension of the neurodegenerative processes inherent in AD.
AUTHOR CONTRIBUTIONS
Moto Nakaya (Conceptualization; Data curation; Formal analysis; Visualization; Writing – original draft); Noriko Sato (Supervision; Writing – review & editing); Hiroshi Matsuda (Funding acquisition; Methodology; Supervision; Writing – review & editing); Norihide Maikusa (Data curation; Methodology; Software); Miho Ota (Methodology; Writing – review & editing); Yoko Shigemoto (Data curation; Writing – review & editing); Daichi Sone (Data curation; Writing – review & editing); Tensho Yamao (Data curation; Writing – review & editing); Yukio Kimura (Writing – review & editing); Tadashi Tsukamoto (Data curation); Yuma Yokoi (Data curation); Masuhiro Sakata (Data curation); Osamu Abe (Writing – review & editing).
ACKNOWLEDGMENTS
We thank Editage (www.editage.jp) for English language editing.
FUNDING
This work was partly carried out under the Brain Mapping by Integrated Neurotechnologies for Disease Studies (Brain/MINDS) project (grant number 16 dm0207017h0003) funded by the Japan Agency for Medical Research and Development (AMED), Japan Society for the Promotion of Science (KAKENHI grant number JP20K08068), and Intramural Research (Grant No. 3-3) for Neurological and Psychiatric Disorders from the National Center of Neurology and Psychiatry.
CONFLICT OF INTEREST
The authors have no conflict of interest to report.
DATA AVAILABILITY
Raw data were generated at the National Center for Neurology and Psychiatry. The data supporting the findings of this study are available on request from the corresponding author, N.S.
REFERENCES
[1] | Whitwell JL , Przybelski SA , Weigand SD , Knopman DS , Boeve BF , Petersen RC , Jack CRJr ((2007) ) 3D maps from multiple MRI illustrate changing atrophy patterns as subjects progress from mild cognitive impairment to Alzheimer’s disease. Brain 130: , 1777–1786. |
[2] | de Toledo-Morrell L , Goncharova I , Dickerson B , Wilson RS , Bennett DA ((2000) ) From healthy aging to early Alzheimer’s disease: In vivo detection of entorhinal cortex atrophy. Ann N Y Acad Sci 911: , 240–253. |
[3] | Wang L , Benzinger TL , Su Y , Christensen J , Friedrichsen K , Aldea P , McConathy J , Cairns NJ , Fagan AM , Morris JC , Ances BM ((2016) ) Evaluation of tau imaging in staging Alzheimer disease and revealing interactions between β-amyloid and tauopathy. JAMA Neurol 73: , 1070–1077. |
[4] | Pascoal TA , Mathotaarachchi S , Mohades S , Benedet AL , Chung C-O , Shin M , Wang S , Beaudry T , Kang MS , Soucy J-P , Labbe A , Gauthier S , Rosa-Neto P ((2017) ) Amyloid-β and hyperphosphorylated tau synergy drives metabolic decline in preclinical Alzheimer’s disease. Mol Psychiatry 22: , 306–311. |
[5] | Villemagne VL , Burnham S , Bourgeat P , Brown B , Ellis KA , Salvado O , Szoeke C , Macaulay SL , Martins R , Maruff P , Ames D , Rowe CC , Masters CL , Australian Imaging Biomarkers and Lifestyle (AIBL) Research Group ((2013) ) Amyloid β deposition, neurodegeneration, and cognitive decline in sporadic Alzheimer’s disease: A prospective cohort study. Lancet Neurol 12: , 357–367. |
[6] | Acosta-Cabronero J , Nestor PJ ((2014) ) Diffusion tensor imaging in Alzheimer’s disease: Insights into the limbic-diencephalic network and methodological considerations. Front Aging Neurosci 6: , 266. |
[7] | Amlien IK , Fjell AM ((2014) ) Diffusion tensor imaging of white matter degeneration in Alzheimer’s disease and mild cognitive impairment. Neuroscience 276: , 206–215. |
[8] | Snow WM , Dale R , O’Brien-Moran Z , Buist R , Peirson D , Martin M , Albensi BC ((2017) ) In vivo detection of gray matter neuropathology in the 3xTg mouse model of Alzheimer’s disease with diffusion tensor imaging. J Alzheimers Dis 58: , 841–853. |
[9] | Pierpaoli C , Jezzard P , Basser PJ , Barnett A , Di Chiro G ((1996) ) Diffusion tensor MR imaging of the human brain. Radiology 201: , 637–648. |
[10] | Asato MR , Terwilliger R , Woo J , Luna B ((2010) ) White matter development in adolescence: A DTI study. Cereb Cortex 20: , 2122–2131. |
[11] | Ennis DB , Kindlmann G ((2006) ) Orthogonal tensor invariants and the analysis of diffusion tensor magnetic resonance images. Magn Reson Med 55: , 136–146. |
[12] | Pasternak O , Sochen N , Gur Y , Intrator N , Assaf Y ((2009) ) Free water elimination and mapping from diffusion MRI. Magn Reson Med 62: , 717–730. |
[13] | Nakaya M , Sato N , Matsuda H , Maikusa N , Shigemoto Y , Sone D , Yamao T , Ogawa M , Kimura Y , Chiba E , Ohnishi M , Kato K , Okita K , Tsukamoto T , Yokoi Y , Sakata M , Abe O ((2022) ) Free water derived by multi-shell diffusion MRI reflects tau/neuroinflammatory pathology in Alzheimer’s disease. Alzheimers Dement 8: , e12356. |
[14] | Ball G , Srinivasan L , Aljabar P , Counsell SJ , Durighel G , Hajnal JV , Rutherford MA , Edwards AD ((2013) ) Development of cortical microstructure in the preterm human brain. Proc Natl Acad Sci U S A 110: , 9541–9546. |
[15] | Braak H , Braak E ((1991) ) Neuropathological stageing of Alzheimer-related changes. Acta Neuropathol 82: , 239–259. |
[16] | Andersson JLR , Sotiropoulos SN ((2016) ) An integrated approach to correction for off-resonance effects and subject movement in diffusion MR imaging. Neuroimage 125: , 1063–1078. |
[17] | Jenkinson M , Bannister P , Brady M , Smith S ((2002) ) Improved optimization for the robust and accurate linear registration and motion correction of brain images. Neuroimage 17: , 825–841. |
[18] | Zhang Y , Brady M , Smith S ((2001) ) Segmentation of brain MR images through a hidden Markov random field model and the expectation-maximization algorithm. IEEE Trans Med Imaging 20: , 45–57. |
[19] | Tzourio-Mazoyer N , Landeau B , Papathanassiou D , Crivello F , Etard O , Delcroix N , Mazoyer B , Joliot M ((2002) ) Automated anatomical labeling of activations in SPM using a macroscopic anatomical parcellation of the MNI MRI single-subject brain. Neuroimage 15: , 273–289. |
[20] | Klunk WE , Koeppe RA , Price JC , Benzinger TL , Devous MDSr , Jagust WJ , Johnson KA , Mathis CA , Minhas D , Pontecorvo MJ , Rowe CC , Skovronsky DM , Mintun MA ((2015) ) The Centiloid Project: Standardizing quantitative amyloid plaque estimation by PET. Alzheimers Dement 11: , 1–15.e1-4. |
[21] | Amadoru S , Doré V , McLean CA , Hinton F , Shepherd CE , Halliday GM , Leyton CE , Yates PA , Hodges JR , Masters CL , Villemagne VL , Rowe CC ((2020) ) Comparison of amyloid PET measured in Centiloid units with neuropathological findings in Alzheimer’s disease. Alzheimers Res Ther 12: ,22. |
[22] | Smith SM , Nichols TE ((2009) ) Threshold-free cluster enhancement: Addressing problems of smoothing, threshold dependence and localisation in cluster inference. Neuroimage 44: , 83–98. |
[23] | Ofori E , DeKosky ST , Febo M , Colon-Perez L , Chakrabarty P , Duara R , Adjouadi M , Golde TE , Vaillancourt DE , Alzheimer’s Disease Neuroimaging Initiative ((2019) ) Free-water imaging of the hippocampus is a sensitive marker of Alzheimer’s disease. Neuroimage Clin 24: , 101985. |
[24] | Wang W-E , Chen R , Mayrand RP , Adjouadi M , Fang R , DeKosky ST , Duara R , Coombes SA , Vaillancourt DE , Alzheimer’s Disease Neuroimaging Initiative((2023) ) Association of longitudinal cognitive decline with diffusion MRI in gray matter, amyloid, and tau deposition. Neurobiol Aging 121: , 166–178. |
[25] | Torso M , Ridgway GR , Valotti M , Hardingham I , Chance SA , National Alzheimer’s Coordinating Center, Alzheimer’s Disease Neuroimaging Initiative> ((2023) ) In vivo cortical diffusion imaging relates to Alzheimer’s disease neuropathology. Alzheimers Res Ther 15: , 165. |
[26] | Burton EJ , McKeith IG , Burn DJ , Williams ED , O’Brien JT ((2004) ) Cerebral atrophy in Parkinson’s disease with and without dementia: A comparison with Alzheimer’s disease,dementia with Lewy bodies and controls. Brain 127: , 791–800. |
[27] | Josephs KA , Whitwell JL , Duffy JR , Vanvoorst WA , Strand EA , Hu WT , Boeve BF , Graff-Radford NR , Parisi JE , Knopman DS , Dickson DW , Jack CRJr , Petersen RC ((2008) ) Progressive aphasia secondary to Alzheimer disease vs FTLD pathology. Neurology 70: , 25–34. |
[28] | Blennow K , de Leon MJ , Zetterberg H ((2006) ) Alzheimer’s disease. Lancet 368: , 387–403. |
[29] | Baron JC , Chételat G , Desgranges B , Perchey G , Landeau B , de la Sayette V , Eustache F ((2001) ) In vivo mapping of gray matter loss with voxel-based morphometry in mild Alzheimer’s disease. Neuroimage 14: , 298–309. |
[30] | Di Paola M , Macaluso E , Carlesimo GA , Tomaiuolo F , Worsley KJ , Fadda L , Caltagirone C ((2007) ) Episodic memory impairment in patients with Alzheimer’s disease is correlated with entorhinal cortex atrophy. A voxel-based morphometry study. J Neurol 254: , 774–781. |
[31] | Shiino A , Watanabe T , Maeda K , Kotani E , Akiguchi I , Matsuda M ((2006) ) Four subgroups of Alzheimer’s disease based on patterns of atrophy using VBM and a unique pattern for early onset disease. Neuroimage 33: , 17–26. |
[32] | Huang H , Zheng S , Yang Z , Wu Y , Li Y , Qiu J , Cheng Y , Lin P , Lin Y , Guan J , Mikulis DJ , Zhou T , Wu R ((2023) ) Voxel-based morphometry and a deep learning model for the diagnosis of early Alzheimer’s disease based on cerebral gray matter changes. Cereb Cortex 33: , 754–763. |
[33] | Matsuda H ((2016) ) MRI morphometry in Alzheimer’s disease. Ageing Res Rev 30: , 17–24. |
[34] | Alexander AL , Hasan KM , Lazar M , Tsuruda JS , Parker DL ((2001) ) Analysis of partial volume effects in diffusion-tensor MRI. Magn Reson Med 45: , 770–780. |
[35] | Alexander AL , Lee JE , Lazar M , Field AS ((2007) ) Diffusion tensor imaging of the brain. Neurotherapeutics 4: , 316–329. |
[36] | Song S-K , Sun S-W , Ramsbottom MJ , Chang C , Russell J , Cross AH ((2002) ) Dysmyelination revealed through MRI as increased radial (but unchanged axial) diffusion of water. Neuroimage 17: , 1429–1436. |
[37] | Metzler-Baddeley C , O’Sullivan MJ , Bells S , Pasternak O , Jones DK ((2012) ) How and how not to correct for CSF-contamination in diffusion MRI. Neuroimage 59: , 1394–1403. |
[38] | Metzler-Baddeley C , Jones DK , Steventon J , Westacott L , Aggleton JP , O’Sullivan MJ ((2012) ) Cingulum microstructure predicts cognitive control in older age and mild cognitive impairment. J Neurosci 32: , 17612–17619. |
[39] | Armstrong RA ((2006) ) Plaques and tangles and the pathogenesis of Alzheimer’s disease. Folia Neuropathol 44: , 1–11. |
[40] | Sun X , Zhao C , Chen SY , Chang Y , Han YL , Li K , Sun HM , Wang ZF , Liang Y , Jia JJ (2023) Free water MR imaging of white matter microstructural changes is a sensitive marker of amyloid positivity in Alzheimer’s disease. JMagn Reson Imaging.doi:10.1002/jmri.29189. |
[41] | Maillard P , Fletcher E , Singh B , Martinez O , Johnson DK , Olichney JM , Farias ST , DeCarli C ((2019) ) Cerebral white matter free water: A sensitive biomarker of cognition and function. Neurology 92: , e2221–e2231. |
[42] | Vipin A , Ng KK , Ji F , Shim HY , Lim JKW , Pasternak O , Zhou JH , Alzheimer’s Disease Neuroimaging Initiative ((2019) ) Amyloid burden accelerates white matter degradation in cognitively normal elderly individuals. Hum Brain Mapp 40: , 2065–2075. |
[43] | Silva-Rudberg JA , Salardini E , O’Dell RS , Chen M-K , Ra J , Georgelos JK , Morehouse MR , Melino KP , Varma P , Toyonaga T , Nabulsi NB , Huang Y , Carson RE , van Dyck CH , Mecca AP ((2024) ) Assessment of gray matter microstructure and synaptic density in Alzheimer’s disease: A multimodal imaging study with DTI and SV2A PET. Am J Geriatr Psychiatry 32: , 17–28. |
[44] | Ji F , Pasternak O , Ng KK , Chong JSX , Liu S , Zhang L , Shim HY , Loke YM , Tan BY , Venketasubramanian N , Chen CL-H , Zhou JH ((2019) ) White matter microstructural abnormalities and default network degeneration are associated with early memory deficit in Alzheimer’s disease continuum. Sci Rep 9: , 4749. |
[45] | Jack CRJr , Holtzman DM ((2013) ) Biomarker modeling of Alzheimer’s disease. Neuron 80: , 1347–1358. |
[46] | Jack CRJr , Knopman DS , Jagust WJ , Petersen RC , Weiner MW , Aisen PS , Shaw LM , Vemuri P , Wiste HJ , Weigand SD , Lesnick TG , Pankratz VS , Donohue MC , Trojanowski JQ ((2013) ) Tracking pathophysiological processes in Alzheimer’s disease: An updated hypothetical model of dynamic biomarkers. Lancet Neurol 12: , 207–216. |
[47] | Henf J , Grothe MJ , Brueggen K , Teipel S , Dyrba M ((2018) ) Mean diffusivity in cortical gray matter in Alzheimer’s disease: The importance of partial volume correction. Neuroimage Clin 17: , 579–586. |
[48] | Parvathaneni P , Lyu I , Huo Y , Rogers BP , Schilling KG , Nath V , Blaber JA , Hainline AE , Anderson AW , Woodward ND , Landman BA ((2019) ) Improved gray matter surface based spatial statistics in neuroimaging studies. Magn Reson Imaging 61: , 285–295. |


