
Plasma Neurofilament Light Relates to Divergent Default and Salience Network Connectivity in Alzheimer’s Disease and Behavioral Variant Frontotemporal Dementia
Abstract
Background:
Alzheimer’s disease (AD) and behavioral variant frontotemporal dementia (bvFTD) show differential vulnerability to large-scale brain functional networks. Plasma neurofilament light (NfL), a promising biomarker of neurodegeneration, has been linked in AD patients to glucose metabolism changes in AD-related regions. However, it is unknown whether plasma NfL would be similarly associated with disease-specific functional connectivity changes in AD and bvFTD.
Objective:
Our study examined the associations between plasma NfL and functional connectivity of the default mode and salience networks in patients with AD and bvFTD.
Methods:
Plasma NfL and neuroimaging data from patients with bvFTD (n = 16) and AD or mild cognitive impairment (n = 38; AD + MCI) were analyzed. Seed-based functional connectivity maps of key regions within the default mode and salience networks were obtained and associated with plasma NfL in these patients.
RESULTS:
We demonstrated divergent associations between NfL and functional connectivity in AD + MCI and bvFTD patients. Specifically, AD + MCI patients showed lower default mode network functional connectivity with higher plasma NfL, while bvFTD patients showed lower salience network functional connectivity with higher plasma NfL. Further, lower NfL-related default mode network connectivity in AD + MCI patients was associated with lower Montreal Cognitive Assessment scores and higher Clinical Dementia Rating sum-of-boxes scores, although NfL-related salience network connectivity in bvFTD patients was not associated with Neuropsychiatric Inventory Questionnaire scores.
CONCLUSIONS:
Our findings indicate that plasma NfL is differentially associated with brain functional connectivity changes in AD and bvFTD.
INTRODUCTION
Alzheimer’s disease (AD) and behavioral variant frontotemporal dementia (bvFTD) are among the most common causes of dementia particularly in individuals below 65 years of age [1]. AD is characterized by gradual memory loss and impairments in other cognitive domains including language, visuospatial, and executive function [2] with little changes in social-emotional functioning [3, 4]. In contrast, bvFTD is associated with changes in personality including social disinhibition, apathy, loss and empathy and compulsive behaviors, but relatively intact episodic memory [5]. Efforts in developing effective disease-modifying treatments for AD and bvFTD have limited success, attributed in part to treatments targeting patients that are misdiagnosed, or too advanced in the disease [6–8]. Further, although AD and bvFTD have relatively distinct clinical profiles, differential diagnosis remains a challenge in some patients who show atypical or overlapping symptoms [9]. As such, identifying biomarkers that can detect early disease changes, track disease progression and differentially diagnose dementia subtypes is a crucial goal in dementia research.
Neurofilament light chain (NfL) is an abundant intermediate filament protein in myelinated axons that is heavily involved in the assembly and maintenance of the neuronal cytoskeleton [10]. Injury to central nervous system axons results in the release of NfL into the cerebrospinal fluid (CSF) and eventually the blood. This resulting increase in concentration of NfL in CSF and blood can therefore be used to track neurodegeneration in the brain [11]. In recent years, there has been growing interest in the use of CSF and blood NfL as biomarkers for early detection and tracking progression of neurodegenerative diseases, including AD and bvFTD. In particular, blood-based biomarkers are highly attractive due to its accessibility and low cost [12]. The development of ultrasensitive single molecule array (SIMOA) technology has enabled reliable measurement of NfL in the blood, even in the range of healthy individuals. Higher levels of plasma and serum levels of NfL are highly correlated with CSF NfL levels [13], and have been associated with neurodegeneration and disease progression in AD and bvFTD [14–19]. However, there remains few studies examining its association with neuroimaging markers of brain structure and function (e.g., [15, 16, 20, 21–25]).
Resting state functional connectivity, which measures the temporal synchrony between low frequency blood-oxygen level dependent (BOLD) signal fluctuations from functional magnetic resonance imaging (fMRI) under task-free settings, is a promising neuroimaging biomarker for detecting early brain alterations in neurodegenerative diseases [26, 27]. It has been demonstrated that different neurodegenerative diseases show differential vulnerability in large-scale brain networks [28], with AD targeting the default mode network, a task-negative network anchored in the posterior cingulate cortex, precuneus and medial prefrontal cortex that is associated with episodic memory [29, 30], and bvFTD targeting the salience network, a task-positive network comprising the anterior cingulate cortex and anterior insula that is linked to the detection and processing of salient stimuli such as emotional events [31, 32]. Intriguingly, AD and bvFTD have been demonstrated to show divergent functional network changes that are in line with their relatively opposing symptom-deficit profiles. AD patients showed disruptions in functional connectivity and network topology of the default mode network [33, 34], while bvFTD patients showed aberrant functional connectivity and network topology in the salience network [35–37]. Furthermore, such functional disruptions in the default mode and salience network have been associated with worse cognitive function and neuropsychiatric symptoms respectively [35, 36], mirroring the characteristic memory deficits in AD and social-emotional deficits in bvFTD. These findings thus highlight the potential utility of using fMRI for differential diagnoses of neurodegenerative diseases.
To our knowledge, no study has yet compared associations between NfL and functional connectivity in these two groups. A recent study in mild cognitive impairment patients (MCI) showed that higher baseline plasma NfL was associated with hypometabolism in cortical regions within the default mode network [38], suggesting that changes in plasma NfL may be linked to alterations in circumscribed brain networks in AD. Our study thus sought to examine the associations between plasma NfL and functional connectivity in patients with AD and bvFTD, which could shed light on the neural mechanisms underlying AD and bvFTD as well as guide future research and development of biomarkers that can track disease progression and differentiate between diagnostic groups. Given evidence of divergent functional connectivity changes in these two diseases as well as some evidence of the disease-specific effects of plasma NfL on functional connectivity in AD [38], we hypothesize that differential associations between NfL and functional connectivity in AD and bvFTD would be similarly observed, with AD patients showing lower default mode network functional connectivity with higher plasma NfL, and bvFTD patients showing lower salience network functional connectivity with higher plasma NfL. Further, we predict that these NfL-related functional connectivity changes would be linked to changes in disease severity, global cognition and neuropsychiatric symptoms.
MATERIALS AND METHODS
Participants
80 AD or mild cognitive impairment (MCI) and 37 bvFTD participants were recruited from the memory clinics at National Neuroscience Institute, Singapore between 2015 and 2018. This study was approved by the SingHealth Institutional Ethics Review Board and written informed consent was obtained from each participant prior to recruitment into the study. All patients underwent neurological examination, cognitive assessment, structural and functional brain MRI, and met consensus diagnostic criteria for MCI [39], mild AD type dementia [2] and bvFTD [5] by neurologists specialized in dementia. For patients with available CSF data, AD-specific biomarkers (such as Aβ, total and phosphorylated tau) were taken into consideration for clinical diagnosis of AD and separation of cases into the appropriate clinical diagnostic groups. In this study, only MCI patients with biomarker evidence of AD on CSF (if available), or evidence of AD-like neurodegeneration on imaging such as medial temporal atrophy were included. Patients with other neurodegenerative diseases such as Parkinson’s disease, significant cerebrovascular disease (e.g., prior stroke and/or cerebral amyloid angiopathy), psychiatric comorbidities, MCI of other type, as well as a history of alcohol or drug abuse were excluded.
Global cognition was measured using the Mini-Mental State Examination (MMSE) and Montreal Cognitive Assessment (MoCA). Neuropsychiatric and behavioral symptoms were assessed by the Neuropsychiatric Inventory questionnaire (NPI-Q) [40], which measures the presence and severity of 12 neuropsychiatric symptom domains: delusions, hallucinations, agitation, depression, anxiety, euphoria, apathy, disinhibition, irritability, motor behavior, night behavior and appetite. Disease severity was also assessed in a subset of participants using the Clinical Dementia Rating sum-of-boxes (CDR SOB) score [41] for AD + MCI patients and the Frontotemporal Lobar Degeneration-modified Clinical Dementia Rating sum-of-boxes (FTLD-CDR SOB) score [42] for bvFTD patients. Participants underwent an MRI scan within six months of clinical and cognitive evaluation. We only analyzed participants with complete demographic data, plasma NfL and good quality MRI, resulting in 16 bvFTD and 38 AD and MCI (AD + MCI) participants included in this study (see Table 1 for participants’ demographic and clinical characteristics). Of the 16 bvFTD participants, one participant was positive for a pathogenic length C9orf72 expansion (70 repeats), while the remaining cases did not have bvFTD-related mutations (in MAPT, GRN, and others). A subset of 23 participants (5 bvFTD, 18 AD + MCI) also completed a lumbar puncture and had CSF Aβ, total and phosphorylated tau protein data which were obtained in accordance with previous work [43].
Table 1
Participant demographic and clinical characteristics
| AD + MCI (n = 38) | bvFTD (n = 16) | p1 | |
| Age (Mean (SD)) | 59.05 (5.01) | 61.5 (5.15) | 0.141 |
| Education (y) (Mean (SD)) | 11.47 (3.80) | 9.75 (4.40) | 0.151 |
| Sex (M/F) | 20/18 | 5/11 | 0.150 |
| Handedness (R/L/RL) | 32/5/1 | 16/0/0 | 0.242 |
| Plasma NfL (Mean (SD)) | 18.39 (14.81) | 32.91 (19.66) | 0.001* |
| CSF Aβ42 (Mean (SD))a | 595.39 (301.69) (n = 18) | 821.40 (194.05) (n = 5) | 0.012* |
| CSF t-tau (Mean (SD))a | 717.11 (529.90) (n = 18) | 276.40 (87.16) (n = 5) | 0.060 |
| CSF p-tau (Mean (SD))a | 89.11 (52.05) (n = 18) | 40.00 (10.61) (n = 5) | 0.031* |
| Disease duration (y) (Mean (SD)) | 1.29 (2.02) (n = 35) | 2.54 (2.50) (n = 13) | 0.013* |
| Age of disease onset (y) (Mean (SD)) | 57.74 (5.67) (n = 35) | 60.23 (3.47) (n = 13) | 0.227 |
| MMSE (Mean (SD)) | 22.68 (6.28) | 22.81 (6.64) | 0.955 |
| MoCA (Mean (SD)) | 20.16 (6.87) | 19.38 (7.04) | 0.589 |
| CDR Global (Mean (SD)) | 0.76 (0.50) (n = 17) | 0.82 (0.54) (n = 14) | 0.736 |
| CDR SOB (Mean (SD)) | 3.69 (3.31) (n = 16) | – | – |
| FTLD-CDR SOB (Mean (SD)) | – | 6.11 (3.82) (n = 14) | – |
| NPI total severity (Mean (SD)) | 3.91 (3.13) (n = 22) | 7.62 (5.64) (n = 13) | 0.083 |
| NPI total caregiver distress (Mean (SD)) | 4.68 (4.24) (n = 22) | 9.77 (9.01) (n = 13) | 0.110 |
1Differences in continuous variables between AD + MCI and bvFTD groups were examined using Wilcoxon rank sum tests, while differences in categorical variables (sex, handedness) between AD + MCI and bvFTD groups were examined using chi squared tests. ‘*’ represents significant difference between bvFTD and AD + MCI groups (p < 0.05). aCSF samples were available in 23 out of 54 patients. Aβ42, amyloid-β 1-42; t-tau, total tau; p-tau, phosphorylated tau 181; AD, Alzheimer’s disease; MCI, mild cognitive impairment; bvFTD, behavioral variant frontotemporal dementia; M, male; F, female; R, right; L, left; NfL, neurofilament light; MMSE, Mini-Mental State Examination; MoCA, Montreal Cognitive Assessment; CDR Global, Clinical Dementia Rating global score; CDR SOB, Clinical Dementia Rating sum-of-boxes score; FTLD-CDR SOB, Frontotemporal Lobar Degeneration-modified Clinical Dementia Rating sum-of-boxes score; NPI, Neuropsychiatric Inventory.
Additionally, neuroimaging data from 31 healthy controls (mean age = 55.42 (7.08) years, 15 males) recruited at National Neuroscience Institute, Singapore [35] was used to generate functional connectivity network masks. All controls were free of significant neurological, psychiatric, or systemic disease.
Image acquisition
T1-weighted magnetization-prepared rapid acquisition gradient echo (MPRAGE) and T2*-weighted task-free functional magnetic resonance imaging (fMRI) sequences were acquired from participants at the Centre for Cognitive Neuroscience, Duke-NUS Medical School using a 20-channel head coil on a 3 Tesla Siemens Magnetom Prisma Fit scanner. The imaging parameters were as follows: 1) T1-weighted MPRAGE: 5 minutes, repetition time = 2300 ms, echo time = 2.98 ms, inversion time = 900 ms, flip angle = 9°, voxel size = 1.0 mm isotropic, field of view = 256×256 mm2); 2) T2*-weighted task-free fMRI: 8 minutes, echo planar sequence, 36 axial slices, repetition time = 2000 ms, echo time = 30 ms, flip angle = 90°, voxel size = 3.0 mm isotropic, field of view = 192×192 mm2, interleaved collection). For the fMRI sequence, participants were instructed to fixate at a white crosshair in the center of a black screen.
Plasma NfL measurements
EDTA blood was centrifuged at 1,800 g for 10 min within 1 h after collection. Plasma was aliquoted and stored at –80°C until use. Plasma NfL levels were measured using ultrasensitive single molecule array (Simoa) Human NfL assay on a Simoa HD-1 Analyzer (Quanterix, MA), according to the manufacturer’s protocol. All samples were measured blinded. Coefficient of variation of samples measured in duplicates was <10%. Two quality-control samples with high and low NfL concentrations, provided in the kit, were measured in each run and were in the expected range. As the distribution of plasma NfL was skewed, log transformation of the plasma NfL values was done, and these values were used in all subsequent analysis involving plasma NfL.
Image preprocessing
Functional imaging
Task-free fMRI images were preprocessed following previous procedures [44, 45] using the FMRIB (Oxford Centre for Functional MRI of the Brain) Software Library (FSL) [46] and Analysis of Functional NeuroImages software [47]. The preprocessing protocol included the following steps: 1) removal of first five volumes to allow for magnetic field stabilization; 2) motion and slice time correction; 3) time series despiking; 4) grand mean scaling; 5) spatial smoothing using a 6 mm Gaussian kernel, 6) temporal band-pass filtering (0.009 –0.1 Hz); 7) linear and quadratic detrending; 8) co-registration of T1-weighted image using boundary based registration followed by non-linear registration of fMRI image to Montreal Neurological Institute (MNI) 152 space using FSL FNIRT; and 9) regression of nine nuisance signals (white matter (WM), CSF, global signal and six motion parameters). In particular, CSF and WM nuisance signals were calculated by extracting the mean fMRI time series from CSF and WM masks, which were created using the following steps: 1) segmentation of the T1-weighted image in native T1-weighted space to grey matter (GM), WM and CSF using FSL FAST, 2) registration of CSF and WM segments (obtained from segmentation of T1-weighted images) in T1-weighted space to fMRI space, 2) smoothing of CSF and WM images in fMRI space using a 6 mm full-width-at-half-maximum gaussian kernel, 3) registration of smoothed WM and CSF images in fMRI space to MNI152 space, 4) masking the smoothed WM and CSF images in standard MNI152 space with WM and CSF priors respectively to retain only voxels within the priors, 5) registration of masked WM and CSF images back to native fMRI space, and finally, 6) thresholding and binarizing of masked WM and CSF images in fMRI space, followed by masking the images with a brain mask to retain only voxels within the brain.
Structural imaging
Voxelwise grey matter volume probability maps were obtained from structural T1-weighted images using voxel-based morphometry (VBM) via the computational anatomy toolbox (CAT12 Structural Brain Mapping Group; http://www.neuro.uni-jena.de/cat/) for Statistical Parametric Mapping (SPM12; Wellcome Trust Centre for Neuroimaging; http://www.fil.ion.ucl.ac.uk/spm/software/spm12/). For the VBM procedure, a study-specific template was first created using the following steps: 1) bias correction and affine registration of T1-weighted images to the default ICBM (MNI152) template, followed by segmentation of images into GM, WM and CSF using unified SPM segmentation [48]; 2) affine registration of GM and WM segments obtained in the previous step to the tissue probability maps; 3) creation of the study-specific template from these affine-registered GM and WM segments using DARTEL (Diffeomophic Anatomical Registration Through Exponentiated Lie Algebra) [49], which estimates deformations that best align the images together by iteratively registering these images with their averaged image, then updating the template by applying the inverse deformation to the images and averaging; and finally, 4) normalizing the study-specific template to the ICBM (MNI152) template space. VBM was then performed using the study-specific DARTEL template as follows: 1) bias correction and affine registration of T1-weighted images to the default ICBM (MNI152) template; 2) initial segmentation of images into GM, WM and CSF using unified SPM segmentation [48]; 3) subsequent segmentation using adaptive Maximum A Posterior approach which does not rely on tissue priors [50]; 4) registration of GM and WM probability maps to the study-specific template in ICBM (MNI152) space; 5) multiplication (modulation) of voxel values with the Jacobian determinant (linear and non-linear components) to allow for comparison of absolute tissue volumes; and finally 6) smoothing of the modulated normalized grey matter images using an isotropic 8 mm Gaussian kernel.
Image analyses
Derivation of seed-based functional connectivity maps
Individual intrinsic functional connectivity network maps were obtained from preprocessed fMRI images using a seed-based approach implemented through custom MATLAB scripts. Firstly, the mean BOLD time-series of two 4-mm spherical regions-of-interest (ROIs) were extracted from each participant’s preprocessed fMRI images. These ROIs were selected from peak foci of the default mode and salience networks reported in previous literature: left posterior cingulate cortex (default mode network; MNI coordinates: x = –7, y = –43, z = 33) [51] and right anterior insula (salience network; MNI coordinates: x = 35, y = 24, z = 5) [28]. For each ROI, Pearson‘s correlation between the ROI mean time-series and each voxel’s spontaneous BOLD time-series was then computed and converted to z-scores using Fisher’s r-to-z transformation. This resulted in two voxelwise seed-based functional connectivity maps for each participant, corresponding to each of the two networks. We also derived group-averaged network maps for each network by performing a one-sample t-test on the z-score maps of cognitively normal controls (description of controls are provided in Participants section).
Association between voxelwise functional connectivity maps and plasma NfL
Second-level, random effects analyses were performed using FSL randomize (number of permutations set at 5000) [52] on individual z-score functional connectivity maps to identify voxels whose functional connectivity significantly correlated with plasma NfL. Separate analyses were performed for each ROI and each group (AD + MCI or bvFTD), with voxelwise functional connectivity maps as dependent variable, plasma NfL as independent variable of interest, and age, sex, years of education, handedness, total intracranial volume (TIV) as independent variables of no interest. We focused only on voxels within the network by masking the analyses with group-averaged network maps of healthy controls. Results were thresholded using the threshold-free cluster enhancement (TFCE) approach at p < 0.01 (uncorrected) and cluster-extent threshold of 500 voxels.
To ensure that the associations between voxelwise functional connectivity maps and plasma NfL were not influenced by inter-individual variations in regional grey matter volume, we repeated the above analyses with voxelwise grey matter volume probability maps (obtained from T1-weighted images using VBM) included as an additional voxelwise variable in the general linear model. Additionally, studies have recommended that band-pass filtering be performed after regression of nuisance signals to avoid reintroduction of unwanted frequencies [53]. To ensure that our findings were robust to variations in preprocessing procedures, we repeated the above analyses on fMRI images preprocessed with bandpass filtering performed after nuisance signal regression.
Group differences in NfL-functional connectivity association between AD + MCI and bvFTD
For clusters showing significant NfL-functional connectivity associations in each group and in each ROI, we next sought to examine if associations differed significantly between the two groups. For each cluster, the mean functional connectivity (to the seed region) across all voxels within the cluster was extracted for each participant (i.e., we averaged all voxel values in the seed-based functional connectivity map that are within the cluster). Linear regression models were then conducted to identify group differences in NfL-functional connectivity association slopes between AD + MCI and bvFTD as follows:
Associations of functional connectivity with disease severity, global cognition, and neuropsychiatric symptom scores in AD + MCI and bvFTD
Finally, for clusters showing significant group differences in NfL-functional connectivity associations, we examined if the mean functional connectivity (to the seed region) across all voxels within these clusters were associated with disease severity (CDR SOB for AD + MCI patients, FTLD-CDR SOB for bvFTD patients), global cognition (MMSE, MoCA) and NPI-Q (total severity and caregiver distress) scores. Separate linear regression models were performed for each group with disease severity, global cognition or neuropsychiatric symptom score as dependent variable and mean cluster functional connectivity as independent variable of interest. Age, sex, years of education, handedness and TIV were included as nuisance covariates.
As validation, we repeated the above analyses using instead the functional connectivity of peak foci of the above clusters. 4 mm spheres around the peak foci were first created and the mean functional connectivity across all voxels within the sphere were extracted. Similar linear regression models as described above were then performed to identify significant associations of mean peak foci connectivity with disease severity, global cognition, and neuropsychiatric symptom scores.
RESULTS
Differential associations between voxelwise functional connectivity maps and plasma NfL in AD + MCI and bvFTD
We first examined associations between voxelwise seed-based functional connectivity and plasma NfL in AD + MCI and bvFTD separately. The analyses revealed differential plasma NfL-functional connectivity associations between AD + MCI and bvFTD (Table 2). AD + MCI patients showed lower default mode network functional connectivity of the left posterior cingulate cortex to the left dorsolateral prefrontal cortex with higher plasma NfL, but no associations between salience network functional connectivity and plasma NfL. In contrast, bvFTD patients showed significant associations between functional connectivity and plasma NfL in the salience network but not the default mode network. Specifically, higher plasma NfL in bvFTD patients was linked to lower salience network connectivity of the right anterior insula to a cluster that spanned the right frontal gyrus, insula, putamen, middle and anterior cingulate cortex, and higher salience network connectivity of the right anterior insula to the right inferior and middle frontal gyrus.
Table 2
Clusters showing significant associations between functional connectivity and plasma NfL in AD + MCI and bvFTD patients separately
| Group | Nature of association | Cluster | |||||
| Regions | Size (voxels) | Peak T | X (mm) | Y (mm) | Z (mm) | ||
| Default mode network seed: Left posterior cingulate cortex (X = –7, Y = –43, Z = 33) | |||||||
| AD + MCI | Negative | Left DLPFC | 505 | 3.43 | –44 | 8 | 40 |
| Salience network seed: Right anterior insula (X = 35, Y = 24, Z = 5) | |||||||
| bvFTD | Positive | Right IFGtriang/IFGoperc/MFG | 713 | 3.76 | 52 | 21 | 33 |
| Negative | Right MFG/INS/IFGtriang/IFGoperc/PUT/ACG/DCG/ROL | 2824 | 4.29 | 29 | –6 | 2 | |
Coordinates shown are in Montreal Neurological Institute normalized space (thresholded at the uncorrected TFCE threshold of p < 0.01 and cluster size of 500 voxels). NfL, neurofilament light; AD, Alzheimer’s disease; MCI, mild cognitive impairment; bvFTD, behavioral variant frontotemporal dementia; DLPFC, dorsolateral prefrontal cortex; IFGtriang, inferior frontal gyrus, triangular part; IFGoperc, inferior frontal gyrus, opercular part; MFG, middle frontal gyrus; INS, insula; PUT, lenticular nucleus, putamen; ACG, anterior cingulate and paracingulate gyri; DCG, median cingulate and paracingulate gyri; ROL, rolandic operculum.
To examine the differences in NfL-functional connectivity associations between the two groups, we tested whether the above clusters showed group differences between AD + MCI and bvFTD patients (Table 3). With higher plasma NfL, AD + MCI patients showed significantly lower default mode network functional connectivity in the left dorsolateral prefrontal cortex compared to bvFTD patients (Fig. 1A), while bvFTD patients showed significantly lower salience network connectivity in the cluster comprising right frontal gyrus, insula, putamen, middle and anterior cingular cortex relative to AD + MCI patients (Fig. 1B). Although voxelwise analyses also revealed a positive association between plasma NfL and salience network functional connectivity in the right inferior and middle frontal gyrus in bvFTD patients, this association was not significantly higher in bvFTD patients compared to AD + MCI patients.
Fig. 1
AD + MCI and bvFTD patients show divergent changes in the associations between plasma NfL and fConflictunctional connectivity of default mode and salience networks. Group functional connectivity association maps, depicting brain clusters that show significant negative associations (cool color) between plasma NfL and (A) functional connectivity to the left posterior cingulate cortex (default mode network seed) in AD + MCI patients as well as (B) functional connectivity to the right anterior insula (salience network seed) in bvFTD patients, are overlaid on their respective group network masks generated from cognitively normal controls (purple color). Both maps are displayed on the Montreal Neurological Institute template brain. Scatterplots on the right depict the relationship between plasma NfL and mean functional connectivity of these clusters to the (A) default mode and (B) salience network seeds respectively for both groups. (A) Higher plasma NfL was associated with lower default mode network functional connectivity of the left posterior cingulate cortex to the left dorsolateral prefrontal cortex in AD + MCI patients. The association between plasma NfL and mean functional connectivity of this cluster to the left posterior cingulate cortex was significantly higher in AD + MCI compared to bvFTD patients. By comparison, (B) higher plasma NfL was associated with lower salience network functional connectivity of the right anterior insula to a cluster comprising the right frontal gyrus, insula, putamen, middle and anterior cingulate cortex in bvFTD patients. The association between plasma NfL and mean functional connectivity of this cluster to the right anterior insula was significantly higher in bvFTD compared to AD + MCI patients. NfL, neurofilament light; AD, Alzheimer’s disease; MCI, mild cognitive impairment; bvFTD, behavioral variant frontotemporal dementia; DMN, default mode network; SN, salience network.
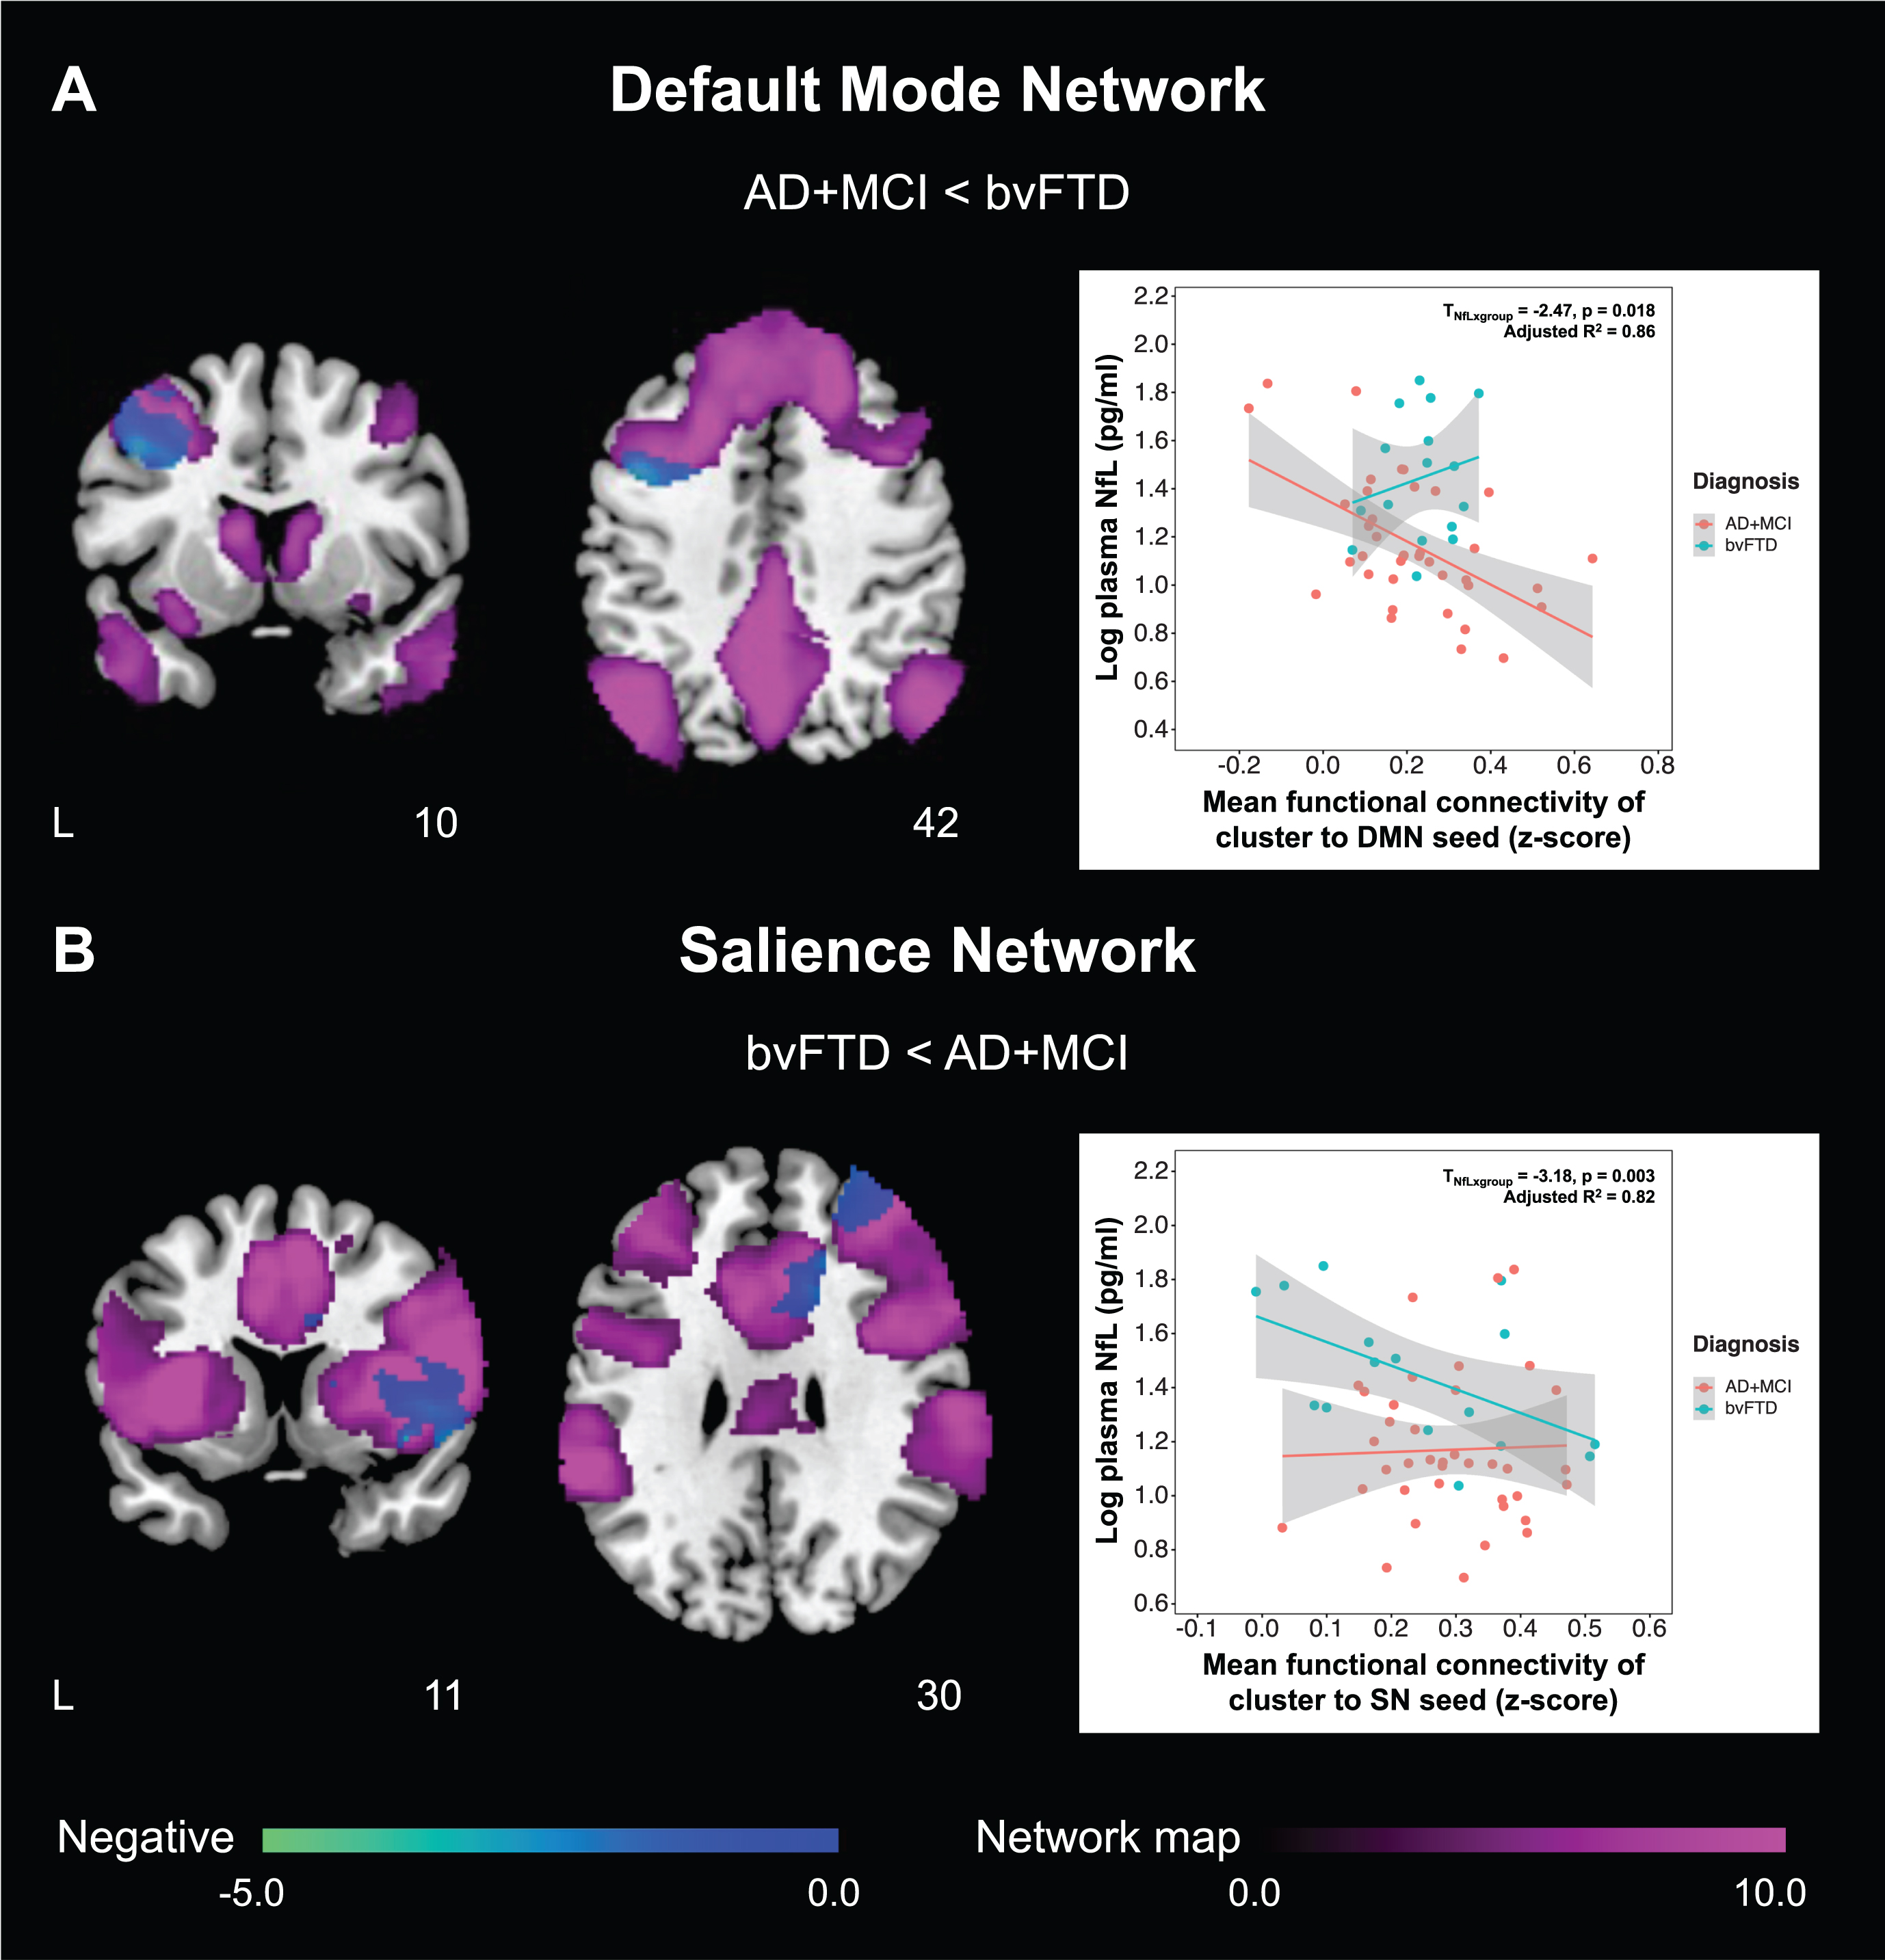
Table 3
Differences in functional connectivity-NfL association between AD + MCI and bvFTD patients
| Cluster showing significant FC-NfL association | Difference in FC-NfL association (AD + MCI<bvFTD) | ||||
| Nature of association | Regions | Unstd. coeff. | SE | t | p |
| Default mode network seed: Left posterior cingulate cortex (X = –7, Y=–43, Z = 33) | |||||
| Negative association in AD + MCI | Left DLPFC | 0.426 | 0.134 | 3.18 | 0.003* |
| Salience network seed: Right anterior insula (X = 35, Y = 24, Z = 5) | |||||
| Positive association in bvFTD | Right IFGtriang/IFGoperc/MFG | 0.272 | 0.155 | 1.75 | 0.087 |
| Negative association in bvFTD | Right MFG/INS/IFGtriang/IFGoperc/PUT/ACG/DCG/ROL | –0.334 | 0.135 | –2.47 | 0.018* |
‘*’ represents significant differences in the functional connectivity-NfL association between AD + MCI and bvFTD patients (p < 0.05). FC, functional connectivity; NfL, neurofilament light; AD, Alzheimer’s disease; MCI, mild cognitive impairment; bvFTD, behavioral variant frontotemporal dementia; Unstd. coeff., unstandardized coefficient; SE, standard error; DLPFC, dorsolateral prefrontal cortex; IFGtriang, inferior frontal gyrus, triangular part; IFGoperc, inferior frontal gyrus, opercular part; MFG, middle frontal gyrus; INS, insula; PUT, lenticular nucleus, putamen; ACG, anterior cingulate and paracingulate gyri; DCG, median cingulate and paracingulate gyri; ROL, rolandic operculum.
These findings remained even after controlling for voxelwise grey matter volumes, indicating little influence of grey matter atrophy on the associations (Supplementary Table 1). Findings were also largely similar using fMRI images preprocessed with bandpass filtering performed after nuisance signal regression, although most clusters were smaller than the original cluster size threshold of 500 voxels (Supplementary Figure 1, Supplementary Table 2). Nevertheless, there remained a significant association between higher plasma NfL and higher salience network connectivity of the right anterior insula to the right inferior and middle frontal gyrus (cluster size of 745 voxels) in bvFTD patients (but not AD + MCI patients), indicating differential associations between NfL and functional connectivity in AD + MCI and bvFTD patients.
Associations of NfL and functional connectivity with disease severity, global cognition, and neuropsychiatric symptom scores in AD + MCI and bvFTD
First, we examined whether plasma NfL was associated with disease severity, global cognition and neuropsychiatric symptom scores in AD + MCI and bvFTD patients separately. Higher plasma NfL was associated with lower MMSE and MoCA and higher CDR SOB scores in AD + MCI patients, but not bvFTD patients. Additionally, there were no associations between plasma NfL and NPI-Q scores (total severity and caregiver distress) for both groups (Table 4).
Table 4
Association between plasma NfL and neuropsychological assessment scores in AD + MCI and bvFTD patients
| Group | Neuropsychological assessment | n | Unstd. coeff. | SE | t | p |
| AD + MCI | MMSE | 38 | –14.00 | 3.08 | –4.54 | <0.001* |
| MoCA | 38 | –15.94 | 3.13 | –5.09 | <0.001* | |
| CDR SOB | 16 | 8.84 | 1.34 | 6.61 | <0.001* | |
| NPI total severity | 22 | –0.56 | 2.43 | –0.23 | 0.820 | |
| NPI total caregiver distress | 22 | 1.93 | 3.08 | 0.62 | 0.541 | |
| bvFTD | MMSE | 16 | –5.76 | 7.33 | –0.79 | 0.450 |
| MoCA | 16 | –9.59 | 8.09 | –1.19 | 0.263 | |
| FTLD-CDR SOB | 14 | 5.36 | 5.08 | 1.06 | 0.322 | |
| NPI total severity | 13 | –16.88 | 10.24 | –1.65 | 0.143 | |
| NPI total caregiver distress | 13 | –34.35 | 15.46 | –2.22 | 0.062 |
‘*’ represents significant association between plasma NfL and neuropsychological assessment scores (p < 0.05). NfL, neurofilament light; AD, Alzheimer’s disease; MCI, mild cognitive impairment; bvFTD, behavioral variant frontotemporal dementia; Unstd. coeff., unstandardized coefficient; SE, standard error; MMSE, Mini-Mental State Examination; MoCA, Montreal Cognitive Assessment; CDR SOB, Clinical Dementia Rating sum-of-boxes score; FTLD-CDR SOB, Frontotemporal Lobar Degeneration-modified Clinical Dementia Rating sum-of-boxes score; NPI, Neuropsychiatric Inventory.
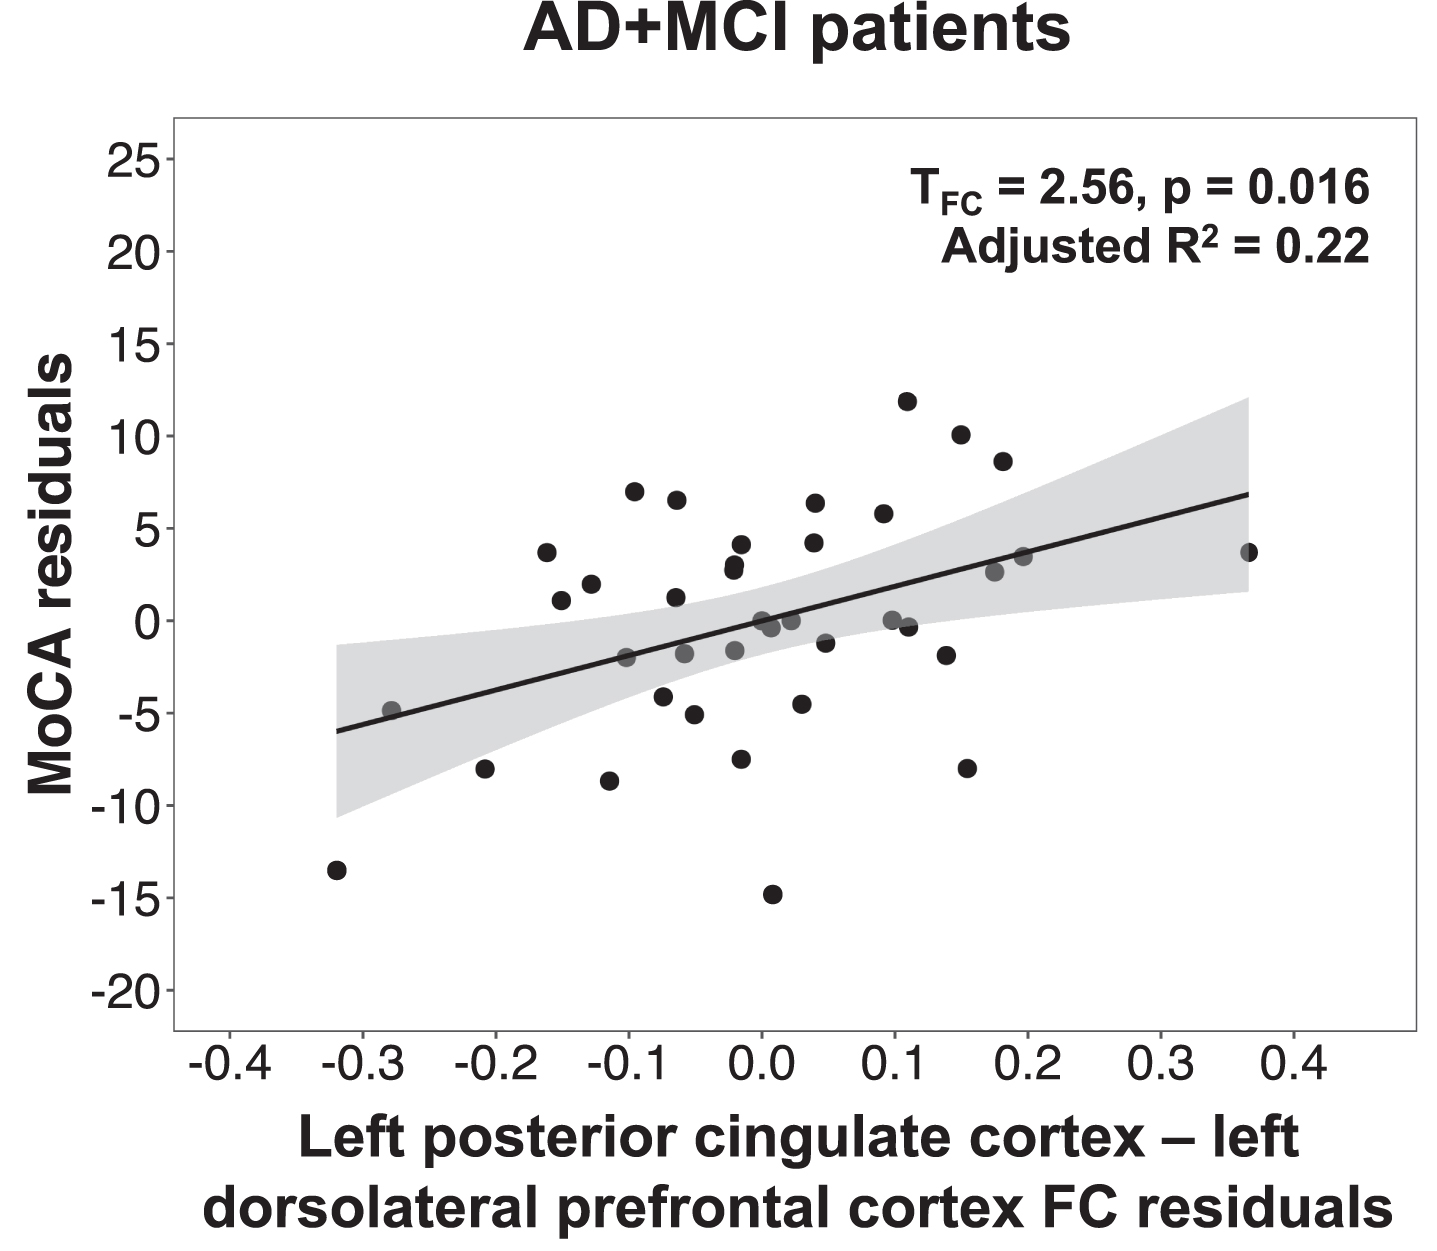
We next tested whether the mean functional connectivity of clusters showing group differences in plasma NfL-functional connectivity associations were also linked to disease severity, global cognition, and neuropsychiatric inventory scores. In AD + MCI patients, lower default mode network functional connectivity in the left dorsolateral prefrontal cortex was found to be associated with lower MoCA (Fig. 2) and higher CDR SOB scores (Table 5). No significant associations with disease severity, global cognition, and neuropsychiatric symptom scores were found for the salience network clusters. The validation analyses using the mean functional connectivity of 4 mm spheres created around the peak foci of the above regions to compute these associations revealed the same findings (Supplementary Table 3).
Table 5
Association between neuropsychological assessment scores and functional connectivity in AD + MCI and bvFTD patients
| Group | Cluster showing significant FC-NfL association and significant group difference in FC-NfL association between AD + MCI and bvFTD patients | Association with neuropsychological assessment scores | ||||||
| Nature of association | Regions | Assessment | n | Unstd. coeff. | SE | t | p | |
| Default mode network seed: Left posterior cingulate cortex (X=–7, Y=–43, Z = 33) | ||||||||
| AD + MCI | Negative association in AD + MCI | Left DLPFC | MMSE | 38 | 12.83 | 7.19 | 1.78 | 0.084 |
| MoCA | 38 | 18.74 | 7.31 | 2.56 | 0.016* | |||
| CDR SOB | 16 | –15.91 | 5.30 | –3.00 | 0.017* | |||
| NPI total severity | 22 | 2.89 | 4.76 | 0.61 | 0.553 | |||
| NPI total caregiver distress | 22 | –1.56 | 6.18 | –0.25 | 0.804 | |||
| Salience network seed: Right anterior insula (X = 35, Y = 24, Z = 5) | ||||||||
| bvFTD | Negative association in bvFTD | Right MFG/INS/IFGtriang/IFGoperc/PUT/ACG/DCG/ROL | MMSE | 16 | 9.75 | 11.38 | 0.86 | 0.412 |
| MoCA | 16 | 17.92 | 12.25 | 1.46 | 0.174 | |||
| FTLD-CDR SOB | 14 | –11.68 | 7.81 | –1.49 | 0.173 | |||
| NPI total severity | 13 | 1.79 | 17.38 | 0.10 | 0.921 | |||
| NPI total caregiver distress | 13 | 0.99 | 29.09 | 0.03 | 0.974 | |||
‘*’ represents significant association between functional connectivity and neuropsychological assessment scores (p < 0.05). AD, Alzheimer’s disease; MCI, mild cognitive impairment; bvFTD, behavioral variant frontotemporal dementia; FC, functional connectivity; NfL, neurofilament light; Unstd. coeff., unstandardized coefficient; SE, standard error; MMSE, Mini-Mental State Examination; MoCA, Montreal Cognitive Assessment; CDR SOB, Clinical Dementia Rating sum-of-boxes score; FTLD-CDR SOB, Frontotemporal Lobar Degeneration-modified Clinical Dementia Rating sum-of-boxes score; NPI, Neuropsychiatric Inventory; DLPFC, dorsolateral prefrontal cortex; MFG, middle frontal gyrus; INS, insula; IFGtriang, inferior frontal gyrus, triangular part; IFGoperc, inferior frontal gyrus, opercular part; PUT, lenticular nucleus, putamen; ACG, anterior cingulate and paracingulate gyri; DCG, median cingulate and paracingulate gyri; ROL, rolandic operculum.
DISCUSSION
Our study revealed that AD + MCI and bvFTD had differential associations between plasma NfL and functional connectivity in the default mode and salience networks. Notably, only AD + MCI participants showed lower default mode network functional connectivity (in the left dorsolateral prefrontal cortex) with higher plasma NfL. In contrast, only bvFTD patients showed lower salience network functional connectivity (in core salience network regions spanning insula, frontal regions, anterior cingulate cortex) with higher plasma NfL. Further, when examining associations of these NfL-related functional connectivity changes with disease severity, global cognition, and neuropsychiatric symptom scores, we found that lower functional connectivity in the default mode network was linked to lower MoCA and higher CDR SOB scores in AD + MCI patients. Our findings suggest that plasma NfL is associated with divergent functional connectivity changes in a disease-dependent manner, linking to cognitive impairment and greater disease severity. Moreover, these findings raise the potential utility of using both functional connectivity and plasma NfL as biomarkers for tracking disease progression and cognitive decline, as well as distinguishing between different diagnostic groups.
Fig. 2
Lower default mode network connectivity in the left dorsolateral prefrontal cortex was associated with lower MoCA scores in AD + MCI patients. Scatterplot indicates association between MoCA residuals and left posterior cingulate cortex-left dorsolateral prefrontal cortex functional connectivity residuals in AD + MCI patients, after controlling for age, sex, years of education, handedness and total intracranial volume. Lower MoCA scores was associated with lower functional connectivity between the left posterior cingulate cortex and left dorsolateral prefrontal cortex in AD + MCI patients. MoCA, Montreal cognitive assessment; AD, Alzheimer’s disease; MCI, mild cognitive impairment; FC, functional connectivity.
AD + MCI and bvFTD patients show divergent associations between plasma NfL and functional connectivity
We demonstrated differential NfL-functional connectivity associations between AD + MCI and bvFTD patients, with higher plasma NfL linked to lower default mode network functional connectivity in AD + MCI patients and disrupted salience network connectivity in bvFTD patients. Direct comparisons between the two groups further supported this finding: AD + MCI patients showed lower default mode network connectivity with higher plasma NfL compared to bvFTD patients, and bvFTD patients showed lower salience network connectivity with higher plasma NfL compared to AD + MCI patients. While an earlier study reported no associations between CSF NfL and default mode network functional connectivity in both early and late AD individuals [54], a more recent study demonstrated a link between higher serum NfL and lower default mode network functional connectivity in individuals with autosomal dominant AD ranging from cognitively unimpaired to cognitively impaired [55]. Our findings of lower default mode network connectivity with higher plasma NfL in AD + MCI patients thus provide further support to the notion that blood-based measurements of NfL track with functional connectivity disruptions in AD. Moreover, our observations are consistent with past AD studies linking higher plasma NfL levels to hypometabolism in AD-vulnerable regions, including core regions within the default mode network such as the posterior cingulate cortex, temporal and frontal regions [25, 38, 56]. Changes in functional connectivity are closely linked to changes in brain metabolism [33, 57, 58], reflecting the metabolic demands associated with increased brain activity. Our findings are also in line with studies relating higher plasma/serum NfL levels to changes in diffusion tensor imaging metrics such as lower fractional anisotropy [59–61], providing evidence that changes in NfL, which are mainly shed from large-caliber myelinated axons, relates to disruptions in white matter microstructure. As brain functional connectivity is thought to be constrained by the underlying large-scale white matter structure of the cerebral cortex [62, 63], higher NfL levels may hence be linked to functional connectivity disruptions via degeneration of white matter tracts. Taken together, our findings therefore suggest that NfL is related to changes in brain networks in a disease-dependent manner.
NfL, on its own, has been identified to be a nonspecific marker of neurodegeneration in neurodegenerative diseases. Although studies have reported lower levels of NfL (both blood and CSF) in AD relative to bvFTD, the diagnostic accuracy of NfL in distinguishing between the two groups is poor [64–67], suggesting limited value of NfL as a biomarker for differential diagnoses. Notwithstanding, NfL has shown utility as a biomarker of disease severity in some disorders including AD and bvFTD [16, 17, 24], and our findings suggest that in milder stages of AD and bvFTD, disease-related alterations in functional connectivity may also be reflected by plasma NfL levels, independent of the degree of atrophy.
The divergent findings between AD + MCI and bvFTD patients are also in line with past research demonstrating circumscribed atrophy and functional connectivity disruptions within the default mode network and salience network in AD and bvFTD patients respectively [28, 36], reflecting the symptom-deficit profiles of the two groups. Corroborating previous research, our study similarly found lower default mode network functional connectivity in AD + MCI patients and lower salience network functional connectivity in bvFTD patients (Supplementary Figure 2, Supplementary Table 4). The default mode network, which comprises posteriomedial, medial prefrontal, and temporal cortices, shows increased amyloid deposition at early stages of AD [68, 69] and has been associated with episodic and autobiographical memory retrieval [70–73], which is primarily impaired in AD. On the other hand, the salience network, which includes the anterior insula, anterior cingulate cortex, ventral striatum, and thalamus, is involved in social-emotional processing [74, 75], a core deficit in bvFTD patients. Our findings of differential NfL-functional connectivity associations between AD + MCI and bvFTD patients thus lend further support to the idea that neurodegenerative diseases target different brain networks (i.e., network-based neurodegeneration).
Interestingly, while higher plasma NfL was mainly associated with lower functional connectivity of the default mode and salience networks in AD + MCI and bvFTD patients respectively, we also found higher plasma NfL to be linked to higher salience network connectivity in the right inferior and middle frontal gyrus. Further investigations on the network assignments (using a widely used independent functional brain atlas [76]) of these clusters showing significant NfL-functional connectivity associations revealed that the positively associated salience network cluster in the right inferior and middle frontal gyrus in bvFTD patients was predominantly located within the control network of the brain atlas, while the negatively associated default mode network cluster in the left dorsolateral prefrontal cortex in AD + MCI patients and salience network cluster in the right frontal gyrus/insula/putamen/middle and anterior cingulate cortex in bvFTD patients were predominantly located within the default and salience/ventral attention networks of the brain atlas respectively (Supplementary Table 5). The positive association between NfL and connectivity of the right anterior insula to the right inferior and middle frontal gyrus in bvFTD patients could thus imply that higher plasma NfL was associated with higher inter-network connectivity between the salience network and the control network, and correspondingly, lower functional segregation of the salience network in bvFTD. A loss of network segregation, which measures the brain’s ability for specialized processing to occur within networks that show strong intra-network connections but weak inter-network connections [77], has been associated with normal aging [78–81], greater AD dementia severity [82], and lower cognitive performance [83]. Further, our findings are in line with a previous study demonstrating lower network segregation and distinctiveness in the modular structure of bvFTD patients compared to healthy controls, particularly that of the salience network [35]. Moreover, we noted that this positive association between NfL and right anterior insula connectivity of the right inferior and middle frontal gyrus in bvFTD patients was particularly robust to variations in preprocessing procedure, reinforcing the possible link between neurodegeneration and loss of network segregation in bvFTD patients. Taken together, greater neurodegeneration as measured by plasma NfL may thus also be associated with a loss of network segregation and consequently poorer processing efficiency of the brain [77] in bvFTD, although future studies systematically examining whole-brain functional connectivity using an independent brain atlas are needed to better elucidate the effects of plasma NfL on inter- and intra-network functional connectivity in AD and bvFTD individuals.
Lower default mode network functional connectivity in AD + MCI was associated with higher plasma NfL, lower MoCA scores, and higher CDR SOB scores
Furthermore, we found lower plasma NfL-related default mode network connectivity between the left posterior cingulate cortex and left dorsolateral prefrontal cortex in AD + MCI patients to be associated with lower MoCA scores and higher CDR SOB scores. Higher plasma NfL [15, 16, 84] and lower default mode network functional connectivity [85, 86] have both been shown to relate to lower cognitive function and higher disease severity in AD. Our findings suggest that functional connectivity changes linked to changes in plasma NfL may also be associated with disease severity and global cognition. However, these functional connectivity changes that were linked to changes in plasma NfL did not show any associations with neuropsychiatric symptoms in both groups, which may possibly be due to the small sample size in this study. Future studies utilizing larger sample sizes could further clarify these associations between functional connectivity changes related to plasma NfL and changes in cognition and behaviour. Nevertheless, our findings highlight that functional connectivity changes in the default mode network that are associated with plasma NfL changes may be predictive of disease severity and cognitive impairment.
Limitations
There are some limitations of this study. Firstly, the sample size in this study is relatively small, particularly for bvFTD patients. Future studies employing larger sample sizes would serve to confirm the findings of this study and shed more light on the relationships between plasma NfL, functional connectivity, and cognition and behavior. Secondly, we did not perform PET imaging in this study to confirm AD and bvFTD pathology for both groups. However, a subset of patients did have CSF AD-related biomarker studies confirming AD + MCI related to AD, or confirming a non-AD process in bvFTD patients. Thirdly, this study is a cross-sectional study. Longitudinal studies on functional connectivity—NfL associations at different dementia stages (i.e., cognitively normal, MCI, dementia) are needed to confirm the trajectory of associations with disease progression. Finally, in this study, we only examined relationships between plasma NfL and static measures of functional connectivity in specific networks (default mode and salience networks). Future studies examining associations of plasma NfL with whole-brain functional connectivity or dynamic functional connectivity measures (which take into account the time-varying properties of functional connectivity) could provide greater insight into the differential associations between plasma NfL and brain functional connectivity in bvFTD and AD individuals.
Conclusion
Our study found divergent associations between plasma NfL and functional connectivity in the default mode and salience networks in patients with AD and bvFTD. AD + MCI patients showed lower default mode network functional connectivity with higher plasma NfL while bvFTD patients showed lower salience network functional connectivity with higher plasma NfL. Further, lower NfL-related default mode network functional connectivity was linked to higher disease severity and lower general cognition in AD + MCI patients. Our findings suggest that plasma NfL is differentially associated with functional connectivity changes in a disease-dependent manner, which may in turn be predictive of disease severity and cognitive impairment. These findings also represent a step towards the development of functional connectivity and plasma NfL as biomarkers for both disease monitoring and differential diagnosis.
AUTHOR CONTRIBUTIONS
Joanna Su Xian Chong (Conceptualization; Data curation; Formal analysis; Methodology; Software; Validation; Visualization; Writing – original draft; Writing – review & editing); Yi Jayne Tan (Conceptualization; Data curation; Investigation; Methodology; Project administration; Validation; Writing – original draft; Writing – review & editing); Amelia Jialing Koh (Data curation; Investigation; Project administration; Software; Writing – review & editing); Simon Kang Seng Ting (Conceptualization; Project administration; Resources; Writing – review & editing); Nagaendran Kandiah (Conceptualization; Project administration; Resources; Writing – review & editing); Adeline Su Lyn Ng (Conceptualization; Funding acquisition; Methodology; Project administration; Resources; Supervision; Writing – review & editing); Juan Helen Zhou (Conceptualization; Funding acquisition; Methodology; Project administration; Resources; Supervision; Writing – review & editing).
ACKNOWLEDGMENTS
The authors have no acknowledgements to report.
FUNDING
This study was supported by Singapore’s National Medical Research Council (NMRC/CIRG/1416/2015 to J.H.Z and A.S.L.N., MOH-TA18may-0003 to A.S.L.N and CS-NIG NRN17/002 to A.S.L.N), Core Research Funding from Yong Loo Lin School of Medicine, National University of Singapore (J.H.Z), the Duke-NUS signature research program funding from Ministry of Health and Duke-NUS Khoo Bridge Funding Award (KBrFA/2019-0020 to J.H.Z.), NMRC Open Fund Large Collaborative Grant (OFLCG09May0035 to J.H.Z.), and NMRC Star Award (MOH00070701 to J.H.Z.).
CONFLICT OF INTEREST
Juan Helen Zhou and Nagaendran Kandiah are Editorial Board Member of this journal but were not involved in the peer-review process of this article nor had access to any information regarding its peer-review. All other authors have no conflict of interest to report.
DATA AVAILABILITY
The data supporting the findings of this study are available on request from the corresponding author. The data are not publicly available due to privacy or ethical restrictions.
SUPPLEMENTARY MATERIAL
[1] The supplementary material is available in the electronic version of this article: https://dx.doi.org/10.3233/JAD-231251.
REFERENCES
[1] | Ratnavalli E , Brayne C , Dawson K , Hodges JR ((2002) ) The prevalence of frontotemporal dementia. Neurology 58: , 1615–1621. |
[2] | McKhann GM , Knopman DS , Chertkow H , Hyman BT , Jack CR, Jr. , Kawas CH , Klunk WE , Koroshetz WJ , Manly JJ , Mayeux R , Mohs RC , Morris JC , Rossor MN , Scheltens P , Carrillo MC , Thies B , Weintraub S , Phelps CH ((2011) ) The diagnosis of dementia due to Alzheimer’s disease: Recommendations from the National Institute on Aging-Alzheimer’s Association workgroups on diagnostic guidelines for Alzheimer’s disease. Alzheimers Dement 7: , 263–269. |
[3] | Rankin KP , Gorno-Tempini ML , Allison SC , Stanley CM , Glenn S , Weiner MW , Miller BL ((2006) ) Structural anatomy of empathy in neurodegenerative disease. Brain 129: , 2945–2956. |
[4] | Mendez MF , Shapira JS ((2009) ) Altered emotional morality in frontotemporal dementia. Cogn Neuropsychiatry 14: , 165–179. |
[5] | Rascovsky K , Hodges JR , Knopman D , Mendez MF , Kramer JH , Neuhaus J , van Swieten JC , Seelaar H , Dopper EG , Onyike CU , Hillis AE , Josephs KA , Boeve BF , Kertesz A , Seeley WW , Rankin KP , Johnson JK , Gorno-Tempini ML , Rosen H , Prioleau-Latham CE , Lee A , Kipps CM , Lillo P , Piguet O , Rohrer JD , Rossor MN , Warren JD , Fox NC , Galasko D , Salmon DP , Black SE , Mesulam M , Weintraub S , Dickerson BC , Diehl-Schmid J , Pasquier F , Deramecourt V , Lebert F , Pijnenburg Y , Chow TW , Manes F , Grafman J , Cappa SF , Freedman M , Grossman M , Miller BL ((2011) ) Sensitivity of revised diagnostic criteria for the behavioural variant of frontotemporal dementia. Brain 134: , 2456–2477. |
[6] | Mehta D , Jackson R , Paul G , Shi J , Sabbagh M ((2017) ) Why do trials for Alzheimer’s disease drugs keep failing? A discontinued drug perspective for 2010–2015. Expert Opin Investig Drugs 26: , 735–739. |
[7] | Katisko K , Cajanus A , Korhonen T , Remes AM , Haapasalo A , Solje E ((2019) ) Prodromal and early bvFTD: Evaluating clinical features and current biomarkers. Front Neurosci 13: , 658. |
[8] | Yiannopoulou KG , Anastasiou AI , Zachariou V , Pelidou SH ((2019) ) Reasons for failed trials of disease-modifying treatments for Alzheimer disease and their contribution in recent research. Biomedicines 7: , 97. |
[9] | Musa G , Slachevsky A , Munoz-Neira C , Mendez-Orellana C , Villagra R , Gonzalez-Billault C , Ibanez A , Hornberger M , Lillo P ((2020) ) Alzheimer’s disease or behavioral variant frontotemporal dementia? Review of key points toward an accurate clinical and neuropsychological diagnosis. J Alzheimers Dis 73: , 833–848. |
[10] | Alirezaei Z , Pourhanifeh MH , Borran S , Nejati M , Mirzaei H , Hamblin MR ((2019) ) Neurofilament light chain as a biomarker, and correlation with magnetic resonance imaging in diagnosis of CNS-related disorders. Mol Neurobiol 57: , 469–491. |
[11] | Thebault S , Booth RA , Freedman MS ((2020) ) Blood neurofilament light chain: The neurologist’s troponin? Biomedicines 8: , 523. |
[12] | Zetterberg H , Burnham SC ((2019) ) Blood-based molecular biomarkers for Alzheimer’s disease. Mol Brain 12: , 26. |
[13] | Khalil M , Teunissen CE , Otto M , Piehl F , Sormani MP , Gattringer T , Barro C , Kappos L , Comabella M , Fazekas F , Petzold A , Blennow K , Zetterberg H , Kuhle J ((2018) ) Neurofilaments as biomarkers in neurological disorders. Nat Rev Neurol 14: , 577–589. |
[14] | Preische O , Schultz SA , Apel A , Kuhle J , Kaeser SA , Barro C , Graber S , Kuder-Buletta E , LaFougere C , Laske C , Voglein J , Levin J , Masters CL , Martins R , Schofield PR , Rossor MN , Graff-Radford NR , Salloway S , Ghetti B , Ringman JM , Noble JM , Chhatwal J , Goate AM , Benzinger TLS , Morris JC , Bateman RJ , Wang G , Fagan AM , McDade EM , Gordon BA , Jucker M , Dominantly Inherited Alzheimer Network ((2019) ) Serum neurofilament dynamics predicts neurodegeneration and clinical progression in presymptomatic Alzheimer’s disease. Nat Med 25: , 277–283. |
[15] | Mattsson N , Andreasson U , Zetterberg H , Blennow K , Alzheimer’s Disease Neuroimaging Initiative ((2017) ) Association of plasma neurofilament light with neurodegeneration in patients with Alzheimer disease. JAMA Neurol 74: , 557–566. |
[16] | Mattsson N , Cullen NC , Andreasson U , Zetterberg H , Blennow K ((2019) ) Association between longitudinal plasma neurofilament light and neurodegeneration in patients with Alzheimer disease. JAMA Neurol 76: , 791–799. |
[17] | Rohrer JD , Woollacott IO , Dick KM , Brotherhood E , Gordon E , Fellows A , Toombs J , Druyeh R , Cardoso MJ , Ourselin S , Nicholas JM , Norgren N , Mead S , Andreasson U , Blennow K , Schott JM , Fox NC , Warren JD , Zetterberg H ((2016) ) Serum neurofilament light chain protein is a measure of disease intensity in frontotemporal dementia. Neurology 87: , 1329–1336. |
[18] | Rojas JC , Wang P , Staffaroni AM , Heller C , Cobigo Y , Wolf A , Goh SM , Ljubenkov PA , Heuer HW , Fong JC , et al. ((2021) ) Plasma neurofilament light for prediction of disease progression in familial frontotemporal lobar degeneration. Neurology 96: , e2296–e2312. |
[19] | Benussi A , Karikari TK , Ashton N , Gazzina S , Premi E , Benussi L , Ghidoni R , Rodriguez JL , Emersic A , Simren J , Binetti G , Fostinelli S , Giunta M , Gasparotti R , Zetterberg H , Blennow K , Borroni B ((2020) ) Diagnostic and prognostic value of serum NfL and p-Tau181 in frontotemporal lobar degeneration. J Neurol Neurosurg Psychiatry 91: , 960–967. |
[20] | Wheelock MD , Strain JF , Ances BM , Preische O , Morris JC , Bateman RJ , Jucker M , Benzinger TLS , Eggebrecht AT , Gordon BA ((2020) ) Brain network dysfunction associated with blood neurofilament light chain in autosomal dominant Alzheimer disease. Alzheimers Dement 16: (Suppl 2), e041586. |
[21] | Benedet AL , Leuzy A , Pascoal TA , Ashton NJ , Mathotaarachchi S , Savard M , Therriault J , Kang MS , Chamoun M , Scholl M , Zimmer ER , Gauthier S , Labbe A , Zetterberg H , Rosa-Neto P , Blennow K , Alzheimer’s Disease Neuroimaging Initiative ((2020) ) Stage-specific links between plasma neurofilament light and imaging biomarkers of Alzheimer’s disease. Brain 143: , 3793–3804. |
[22] | Ashton NJ , Leuzy A , Lim YM , Troakes C , Hortobagyi T , Hoglund K , Aarsland D , Lovestone S , Scholl M , Blennow K , Zetterberg H , Hye A ((2019) ) Increased plasma neurofilament light chain concentration correlates with severity of post-mortem neurofibrillary tangle pathology and neurodegeneration. Acta Neuropathol Commun 7: , 5. |
[23] | Thijssen EH , La Joie R , Wolf A , Strom A , Wang P , Iaccarino L , Bourakova V , Cobigo Y , Heuer H , Spina S , VandeVrede L , Chai X , Proctor NK , Airey DC , Shcherbinin S , Duggan Evans C , Sims JR , Zetterberg H , Blennow K , Karydas AM , Teunissen CE , Kramer JH , Grinberg LT , Seeley WW , Rosen H , Boeve BF , Miller BL , Rabinovici GD , Dage JL , Rojas JC , Boxer AL , Advancing Research and Treatment for Frontotemporal Lobar Degeneration (ARTFL) investigators ((2020) ) Diagnostic value of plasma phosphorylated tau181 in Alzheimer’s disease and frontotemporal lobar degeneration. Nat Med 26: , 387–397. |
[24] | Zetterberg H , Skillback T , Mattsson N , Trojanowski JQ , Portelius E , Shaw LM , Weiner MW , Blennow K , Alzheimer’s Disease Neuroimaging Initiative ((2016) ) Association of cerebrospinal fluid neurofilament light concentration with Alzheimer disease progression. JAMA Neurol 73: , 60–67. |
[25] | Benedet AL , Ashton NJ , Pascoal TA , Leuzy A , Mathotaarachchi S , Kang MS , Therriault J , Savard M , Chamoun M , Scholl M , Zimmer ER , Gauthier S , Labbe A , Zetterberg H , Blennow K , Neto PR ((2019) ) Plasma neurofilament light associates with Alzheimer’s disease metabolic decline in amyloid-positive individuals. Alzheimers Dement (Amst) 11: , 679–689. |
[26] | Ewers M , Sperling RA , Klunk WE , Weiner MW , Hampel H ((2011) ) Neuroimaging markers for the prediction and early diagnosis of Alzheimer’s disease dementia. Trends Neurosci 34: , 430–442. |
[27] | Jack CR , Knopman DS , Jagust WJ , Petersen RC , Weiner MW , Aisen PS , Shaw LM , Vemuri P , Wiste HJ , Weigand SD , Lesnick TG , Pankratz VS , Donohue MC , Trojanowski JQ ((2013) ) Tracking pathophysiological processes in Alzheimer’s disease: An updated hypothetical model of dynamic biomarkers. Lancet Neurol 12: , 207–216. |
[28] | Seeley WW , Crawford RK , Zhou J , Miller BL , Greicius MD ((2009) ) Neurodegenerative diseases target large-scale human brain networks. Neuron 62: , 42–52. |
[29] | Raichle ME ((2015) ) The brain’s default mode network. Annu Rev Neurosci 38: , 433–447. |
[30] | Greicius MD , Krasnow B , Reiss AL , Menon V ((2003) ) Functional connectivity in the resting brain: A network analysis of the default mode hypothesis. Proc Natl Acad Sci U S A 100: , 253–258. |
[31] | Seeley WW , Menon V , Schatzberg AF , Keller J , Glover GH , Kenna H , Reiss AL , Greicius MD ((2007) ) Dissociable intrinsic connectivity networks for salience processing and executive control. J Neurosci 27: , 2349–2356. |
[32] | Menon V , Uddin LQ ((2010) ) Saliency, switching, attention and control: A network model of insula function. Brain Struct Funct 214: , 655–667. |
[33] | Sheline YI , Raichle ME ((2013) ) Resting state functional connectivity in preclinical Alzheimer’s disease. Biol Psychiatry 74: , 340–347. |
[34] | Tijms BM , Wink AM , de Haan W , van der Flier WM , Stam CJ , Scheltens P , Barkhof F ((2013) ) Alzheimer’s disease: Connecting findings from graph theoretical studies of brain networks. Neurobiol Aging 34: , 2023–2036. |
[35] | Ng ASL , Wang J , Ng KK , Chong JSX , Qian X , Lim JKW , Tan YJ , Yong ACW , Chander RJ , Hameed S , Ting SKS , Kandiah N , Zhou JH ((2021) ) Distinct network topology in Alzheimer’s disease and behavioral variant frontotemporal dementia. Alzheimers Res Ther 13: , 13. |
[36] | Zhou J , Greicius MD , Gennatas ED , Growdon ME , Jang JY , Rabinovici GD , Kramer JH , Weiner M , Miller BL , Seeley WW ((2010) ) Divergent network connectivity changes in behavioural variant frontotemporal dementia and Alzheimer’s disease. Brain 133: , 1352–1367. |
[37] | Agosta F , Sala S , Valsasina P , Meani A , Canu E , Magnani G , Cappa SF , Scola E , Quatto P , Horsfield MA , Falini A , Comi G , Filippi M ((2013) ) Brain network connectivity assessed using graph theory in frontotemporal dementia. Neurology 81: , 134–143. |
[38] | Mayeli M , Mirshahvalad SM , Aghamollaii V , Tafakhori A , Abdolalizadeh A , Rahmani F ((2019) ) Plasma neurofilament light chain levels are associated with cortical hypometabolism in Alzheimer disease signature regions. J Neuropathol Exp Neurol 78: , 709–716. |
[39] | Petersen RC ((2011) ) Clinical practice. Mild cognitive impairment. N Engl J Med 364: , 2227–2234. |
[40] | Cummings JL ((1997) ) The Neuropsychiatric Inventory: Assessing psychopathology in dementia patients. Neurology 48: , S10–16. |
[41] | Hughes CP , Berg L , Danziger WL , Coben LA , Martin RL ((1982) ) A new clinical scale for the staging of dementia. Br J Psychiatry 140: , 566–572. |
[42] | Knopman DS , Kramer JH , Boeve BF , Caselli RJ , Graff-Radford NR , Mendez MF , Miller BL , Mercaldo N ((2008) ) Development of methodology for conducting clinical trials in frontotemporal lobar degeneration. Brain 131: , 2957–2968. |
[43] | Tan YJ , Wong BYX , Vaidyanathan R , Sreejith S , Chia SY , Kandiah N , Ng ASL , Zeng L ((2021) ) Altered cerebrospinal fluid exosomal microRNA levels in young-onset Alzheimer’s disease and frontotemporal dementia. J Alzheimers Dis Rep 5: , 805–813. |
[44] | Chong JSX , Jang H , Kim HJ , Ng KK , Na DL , Lee JH , Seo SW , Zhou J ((2019) ) Amyloid and cerebrovascular burden divergently influence brain functional network changes over time. Neurology 93: , e1514–e1525. |
[45] | Chong JSX , Liu S , Loke YM , Hilal S , Ikram MK , Xu X , Tan BY , Venketasubramanian N , Chen CL , Zhou J ((2017) ) Influence of cerebrovascular disease on brain networks in prodromal and clinical Alzheimer’s disease. Brain 140: , 3012–3022. |
[46] | Jenkinson M , Beckmann CF , Behrens TE , Woolrich MW , Smith SM ((2012) ) FSL. Neuroimage 62: , 782–790. |
[47] | Cox RW ((1996) ) AFNI: Software for analysis and visualization of functional magnetic resonance neuroimages. Comput Biomed Res 29: , 162–173. |
[48] | Ashburner J , Friston KJ ((2005) ) Unified segmentation. Neuroimage 26: , 839–851. |
[49] | Ashburner J ((2007) ) A fast diffeomorphic image registration algorithm. Neuroimage 38: , 95–113. |
[50] | Rajapakse JC , Giedd JN , Rapoport JL ((1997) ) Statistical approach to segmentation of single-channel cerebral MR images. IEEE Trans Med Imaging 16: , 176–186. |
[51] | Sridharan D , Levitin DJ , Menon V ((2008) ) A critical role for the right fronto-insular cortex in switching between central-executive and default-mode networks. Proc Natl Acad Sci U S A 105: , 12569–12574. |
[52] | Winkler AM , Ridgway GR , Webster MA , Smith SM , Nichols TE ((2014) ) Permutation inference for the general linear model. Neuroimage 92: , 381–397. |
[53] | Bright MG , Tench CR , Murphy K ((2017) ) Potential pitfalls when denoising resting state fMRI data using nuisance regression. Neuroimage 154: , 159–168. |
[54] | Pereira JB , Janelidze S , Ossenkoppele R , Kvartsberg H , Brinkmalm A , Mattsson-Carlgren N , Stomrud E , Smith R , Zetterberg H , Blennow K , Hansson O ((2021) ) Untangling the association of amyloid-beta and tau with synaptic and axonal loss in Alzheimer’s disease. Brain 144: , 310–324. |
[55] | Wheelock MD , Strain JF , Mansfield P , Tu JC , Tanenbaum A , Preische O , Chhatwal JP , Cash DM , Cruchaga C , Fagan AM , Fox NC , Graff-Radford NR , Hassenstab J , Jack CR , Karch CM , Levin J , McDade EM , Perrin RJ , Schofield PR , Xiong C , Morris JC , Bateman RJ , Jucker M , Benzinger TLS , Ances BM , Eggebrecht AT , Gordon BA , Dominantly Inherited Alzheimer Network ((2023) ) Brain network decoupling with increased serum neurofilament and reduced cognitive function in Alzheimer’s disease. Brain 146: , 2928–2943. |
[56] | Moscoso A , Grothe MJ , Ashton NJ , Karikari TK , Lantero Rodriguez J , Snellman A , Suarez-Calvet M , Blennow K , Zetterberg H , Scholl M , Alzheimer’s Disease Neuroimaging Inititaive ((2021) ) Longitudinal associations of blood phosphorylated Tau181 and neurofilament light chain with neurodegeneration in Alzheimer disease. JAMA Neurol 78: , 396–406. |
[57] | Passow S , Specht K , Adamsen TC , Biermann M , Brekke N , Craven AR , Ersland L , Gruner R , Kleven-Madsen N , Kvernenes OH , Schwarzlmuller T , Olesen RA , Hugdahl K ((2015) ) Default-mode network functional connectivity is closely related to metabolic activity. Hum Brain Mapp 36: , 2027–2038. |
[58] | Tomasi D , Wang GJ , Volkow ND ((2013) ) Energetic cost of brain functional connectivity. Proc Natl Acad Sci U S A 110: , 13642–13647. |
[59] | Spotorno N , Lindberg O , Nilsson C , Landqvist Waldo M , van Westen D , Nilsson K , Vestberg S , Englund E , Zetterberg H , Blennow K , Latt J , Markus N , Lars-Olof W , Alexander S ((2020) ) Plasma neurofilament light protein correlates with diffusion tensor imaging metrics in frontotemporal dementia. PLoS One 15: , e0236384. |
[60] | Saraste M , Bezukladova S , Matilainen M , Tuisku J , Rissanen E , Sucksdorff M , Laaksonen S , Vuorimaa A , Kuhle J , Leppert D , Airas L ((2021) ) High serum neurofilament associates with diffuse white matter damage in MS. Neurol Neuroimmunol Neuroinflamm 8: , e926. |
[61] | Schultz SA , Strain JF , Adedokun A , Wang Q , Preische O , Kuhle J , Flores S , Keefe S , Dincer A , Ances BM , Berman SB , Brickman AM , Cash DM , Chhatwal J , Cruchaga C , Ewers M , Fox NN , Ghetti B , Goate A , Graff-Radford NR , Hassenstab JJ , Hornbeck R , Jack C, Jr. , , Johnson K , Joseph-Mathurin N , Karch CM , Koeppe RA , Lee AKW , Levin J , Masters C , McDade E , Perrin RJ , Rowe CC , Salloway S , Saykin AJ , Sperling R , Su Y , Villemagne VL , Voglein J , Weiner M , Xiong C , Fagan AM , Morris JC , Bateman RJ , Benzinger TLS , Jucker M , Gordon BA , Dominantly Inherited Alzheimer Network ((2020) ) Serum neurofilament light chain levels are associated with white matter integrity in autosomal dominant Alzheimer’s disease. Neurobiol Dis 142: , 104960. |
[62] | Honey CJ , Sporns O , Cammoun L , Gigandet X , Thiran JP , Meuli R , Hagmann P ((2009) ) Predicting human resting-state functional connectivity from structural connectivity. Proc Natl Acad Sci U S A 106: , 2035–2040. |
[63] | van den Heuvel MP , Mandl RC , Kahn RS , Hulshoff Pol HE ((2009) ) Functionally linked resting-state networks reflect the underlying structural connectivity architecture of the human brain. Hum Brain Mapp 30: , 3127–3141. |
[64] | Illan-Gala I , Lleo A , Karydas A , Staffaroni AM , Zetterberg H , Sivasankaran R , Grinberg LT , Spina S , Kramer JH , Ramos EM , Coppola G , La Joie R , Rabinovici GD , Perry DC , Gorno-Tempini ML , Seeley WW , Miller BL , Rosen HJ , Blennow K , Boxer AL , Rojas JC ((2021) ) Plasma tau and neurofilament light in frontotemporal lobar degeneration and Alzheimer disease. Neurology 96: , e671–e683. |
[65] | Rosengren LE , Karlsson JE , Sjogren M , Blennow K , Wallin A ((1999) ) Neurofilament protein levels in CSF are increased in dementia. Neurology 52: , 1090–1093. |
[66] | Sjogren M , Rosengren L , Minthon L , Davidsson P , Blennow K , Wallin A ((2000) ) Cytoskeleton proteins in CSF distinguish frontotemporal dementia from AD. Neurology 54: , 1960–1964. |
[67] | Steinacker P , Anderl-Straub S , Diehl-Schmid J , Semler E , Uttner I , von Arnim CAF , Barthel H , Danek A , Fassbender K , Fliessbach K , Foerstl H , Grimmer T , Huppertz HJ , Jahn H , Kassubek J , Kornhuber J , Landwehrmeyer B , Lauer M , Maler JM , Mayer B , Oeckl P , Prudlo J , Schneider A , Volk AE , Wiltfang J , Schroeter ML , Ludolph AC , Otto M ; FTLDc study group ((2018) ) Serum neurofilament light chain in behavioral variant frontotemporal dementia. Neurology 91: , e1390–e1401. |
[68] | Mintun MA , Larossa GN , Sheline YI , Dence CS , Lee SY , Mach RH , Klunk WE , Mathis CA , DeKosky ST , Morris JC ((2006) ) [11C]PIB in a nondemented population: Potential antecedent marker of Alzheimer disease. Neurology 67: , 446–452. |
[69] | Buckner RL , Snyder AZ , Shannon BJ , LaRossa G , Sachs R , Fotenos AF , Sheline YI , Klunk WE , Mathis CA , Morris JC , Mintun MA ((2005) ) Molecular, structural, and functional characterization of Alzheimer’s disease: Evidence for a relationship between default activity, amyloid, and memory. J Neurosci 25: , 7709–7717. |
[70] | Buckner RL , Andrews-Hanna JR , Schacter DL ((2008) ) The brain’s default network: Anatomy, function, and relevance to disease. Ann N Y Acad Sci 1124: , 1–38. |
[71] | Wagner AD , Shannon BJ , Kahn I , Buckner RL ((2005) ) Parietal lobe contributions to episodic memory retrieval. Trends Cogn Sci 9: , 445–453. |
[72] | Addis DR , Wong AT , Schacter DL ((2007) ) Remembering the past and imagining the future: Common and distinct neural substrates during event construction and elaboration. Neuropsychologia 45: , 1363–1377. |
[73] | Svoboda E , McKinnon MC , Levine B ((2006) ) The functional neuroanatomy of autobiographical memory: A meta-analysis. Neuropsychologia 44: , 2189–2208. |
[74] | Seeley WW , Crawford R , Rascovsky K , Kramer JH , Weiner M , Miller BL , Gorno-Tempini ML ((2008) ) Frontal paralimbic network atrophy in very mild behavioral variant frontotemporal dementia. Arch Neurol 65: , 249–255. |
[75] | Rosen HJ , Gorno-Tempini ML , Goldman WP , Perry RJ , Schuff N , Weiner M , Feiwell R , Kramer JH , Miller BL ((2002) ) Patterns of brain atrophy in frontotemporal dementia and semantic dementia. Neurology 58: , 198–208. |
[76] | Yeo BT , Krienen FM , Sepulcre J , Sabuncu MR , Lashkari D , Hollinshead M , Roffman JL , Smoller JW , Zollei L , Polimeni JR , Fischl B , Liu H , Buckner RL ((2011) ) The organization of the human cerebral cortex estimated by intrinsic functional connectivity. J Neurophysiol 106: , 1125–1165. |
[77] | Rubinov M , Sporns O ((2010) ) Complex network measures of brain connectivity: Uses and interpretations. Neuroimage 52: , 1059–1069. |
[78] | Ng KK , Lo JC , Lim JK , Chee MW , Zhou J ((2016) ) Reduced functional segregation between the default mode network and the executive control network in healthy older adults: A longitudinal study. Neuroimage 133: , 321–330. |
[79] | Chan MY , Park DC , Savalia NK , Petersen SE , Wig GS ((2014) ) Decreased segregation of brain systems across the healthy adult lifespan. Proc Natl Acad Sci U S A 111: , E4997–E5006. |
[80] | Chong JSX , Ng KK , Tandi J , Wang C , Poh JH , Lo JC , Chee MWL , Zhou JH ((2019) ) Longitudinal changes in the cerebral cortex functional organization of healthy elderly. J Neurosci 39: , 5534–5550. |
[81] | Betzel RF , Byrge L , He Y , Goni J , Zuo XN , Sporns O ((2014) ) Changes in structural and functional connectivity among resting-state networks across the human lifespan. Neuroimage 102 Pt 2: , 345–357. |
[82] | Zhang Z , Chan MY , Han L , Carreno CA , Winter-Nelson E , Wig GS , Alzheimer’s Disease Neuroimaging I ((2023) ) Dissociable effects of Alzheimer’s disease-related cognitive dysfunction and aging on functional brain network segregation. J Neurosci 43: , 7879–7892. |
[83] | Geerligs L , Renken RJ , Saliasi E , Maurits NM , Lorist MM ((2015) ) A brain-wide study of age-related changes in functional connectivity. Cereb Cortex 25: , 1987–1999. |
[84] | Zhou W , Zhang J , Ye F , Xu G , Su H , Su Y , Zhang X , Alzheimer’s Disease Neuroimaging Initiative ((2017) ) Plasma neurofilament light chain levels in Alzheimer’s disease. Neurosci Lett 650: , 60–64. |
[85] | Brier MR , Thomas JB , Snyder AZ , Benzinger TL , Zhang D , Raichle ME , Holtzman DM , Morris JC , Ances BM ((2012) ) Loss of intranetwork and internetwork resting state functional connections with Alzheimer’s disease progression. J Neurosci 32: , 8890–8899. |
[86] | Petrella JR , Sheldon FC , Prince SE , Calhoun VD , Doraiswamy PM ((2011) ) Default mode network connectivity in stable vs progressive mild cognitive impairment. Neurology 76: , 511–517. |


