
Plasma Amyloid-β, Total Tau, and Neurofilament Light Chain Across the Alzheimer’s Disease Clinical Spectrum: A Population-Based Study
Abstract
Background:
Plasma biomarkers have emerged as a promising approach for characterizing pathophysiology in mild cognitive impairment (MCI) and Alzheimer’s disease (AD).
Objective:
We aimed to characterize plasma biomarkers for AD and neurodegeneration across the AD clinical continuum, and to assess their ability to differentiate between AD, MCI, and normal cognition.
Methods:
This population-based study engaged 1,446 rural-dwelling older adults (age ≥60 years, 61.0% women) derived from MIND-China; of these, 402 were defined with MCI and 142 with AD. Plasma amyloid-β (Aβ), total tau (t-tau), and neurofilament light chain (NfL) concentrations were analyzed using the Simoa platform. Data were analyzed using linear and logistic regression models, and receiver operating characteristic (ROC) analysis.
Results:
Across the AD clinical spectrum, plasma Aβ40 and NfL increased, whereas Aβ42/Aβ40 ratio decreased. Plasma t-tau was higher in people with AD dementia than those with MCI or normal cognition. Plasma NfL outperformed other biomarkers in differentiating AD from normal cognition (area under the ROC curve [AUC] = 0.75), but all plasma biomarkers performed poorly to distinguish MCI from normal cognition (AUC <0.60). Plasma NfL in combination with age, sex, education, and APOE genotype yielded the AUC of 0.87 for differentiating between AD and normal cognition, 0.79 between AD and MCI, and 0.64 between MCI and normal cognition.
Conclusions:
In this Chinese population, AD plasma biomarkers vary by age, sex, and APOE genotype. Plasma Aβ, t-tau, and NfL differ across the AD clinical spectrum, and plasma NfL appears to be superior to plasma Aβ and t-tau for defining the clinical spectrum.
INTRODUCTION
The clinical continuum of Alzheimer’s disease (AD) can be divided into three stages: normal cognition, mild cognitive impairment (MCI), and clinical dementia [1]. Amyloid-β (Aβ) plaques, neurofibrillary tangles, and neurodegeneration in the brain are pathophysiological hallmarks of AD [2]. Molecular neuroimaging studies revealed that Aβ in the brain begin to appear up to 20–30 years prior to clinical manifestations of AD [3]. These pathophysiologic changes can be detected either in cerebrospinal fluid (CSF) or in the brain via positron emission tomography (PET) imaging techniques [1]; however, these methods are invasive and relatively expensive. Several blood-based AD biomarkers have in recent years emerged as more accessible, less invasive, and more cost-effective indicators for early detection of MCI and AD [4, 5]. Specifically, plasma Aβ42/Aβ40 ratio, which correlates with brain amyloid PET load, is considered a reliable biomarker of Aβ pathology in the brain, whereas plasma neurofilament light chain (NfL) and total tau (t-tau) are biomarkers for neurodegeneration [6–8].
Several studies have shown that plasma concentrations of AD biomarkers may vary substantially across ethnoracial groups [9–12]. For example, Mexican Americans had lower plasma Aβ40 and NfL, and higher plasma t-tau levels compared to non-Hispanic whites [10, 12]. In addition, genetic background, socioeconomic status, lifestyle factors, and comorbid diseases, which vary across ethnic groups, may influence the racial differences in AD biomarkers [9, 13]. However, the large majority of the previous community-based studies regarding AD plasma biomarkers have been conducted in North America and Europe [12, 14–18]. Exploring the demographic distributions of these plasma biomarkers and their utilities in defining the AD clinical spectrum among the underrepresented ethnical populations (e.g., Chinese population) is highlyrelevant.
The distributions of AD plasma biomarkers across AD clinical spectrum were described in only a few population-based studies. For instance, the Mayo Clinic Study of Aging reported higher plasma t-tau in people with AD than those with normal cognition or MCI, but no difference between normal cognition and MCI [19–21]. The community-based multi-ethnic Health and Aging Brain among Latino Elders study indicated a gradient increase in plasma NfL from normal cognition through MCI to AD, with the area under the receiver operating characteristic (ROC) curve (AUC) for detecting MCI and dementia being 0.55 and 0.70, respectively [12]. However, very few population-based studies have explored simultaneously multiple AD plasma biomarkers for differentiating the AD clinical spectrum. This is important to deepen the understanding of plasma biomarker signatures for AD clinical spectrum. Data from the Washington Heights-Inwood Columbia Aging Project (n = 300) showed that plasma Aβ42/Aβ40 ratio, t-tau, and NfL had poor ability to detect clinical AD (AUC <0.6) [15]. However, the accuracy of AD plasma biomarkers for defining the AD clinical spectrum among Chinese older adults has not yet been evaluated.
Therefore, in this population-based study of rural-dwelling older adults, we aimed to 1) describe the distribution of plasma Aβ, t-tau, and NfL by demographics and apolipoprotein E (APOE) genotype; 2) examine the associations of these biomarkers with the clinical spectrum from normal cognition through MCI to clinical AD; and 3) evaluate the performance of these biomarkers to differentiate individuals with normal cognition, MCI, and AD.
METHODS
Study participants
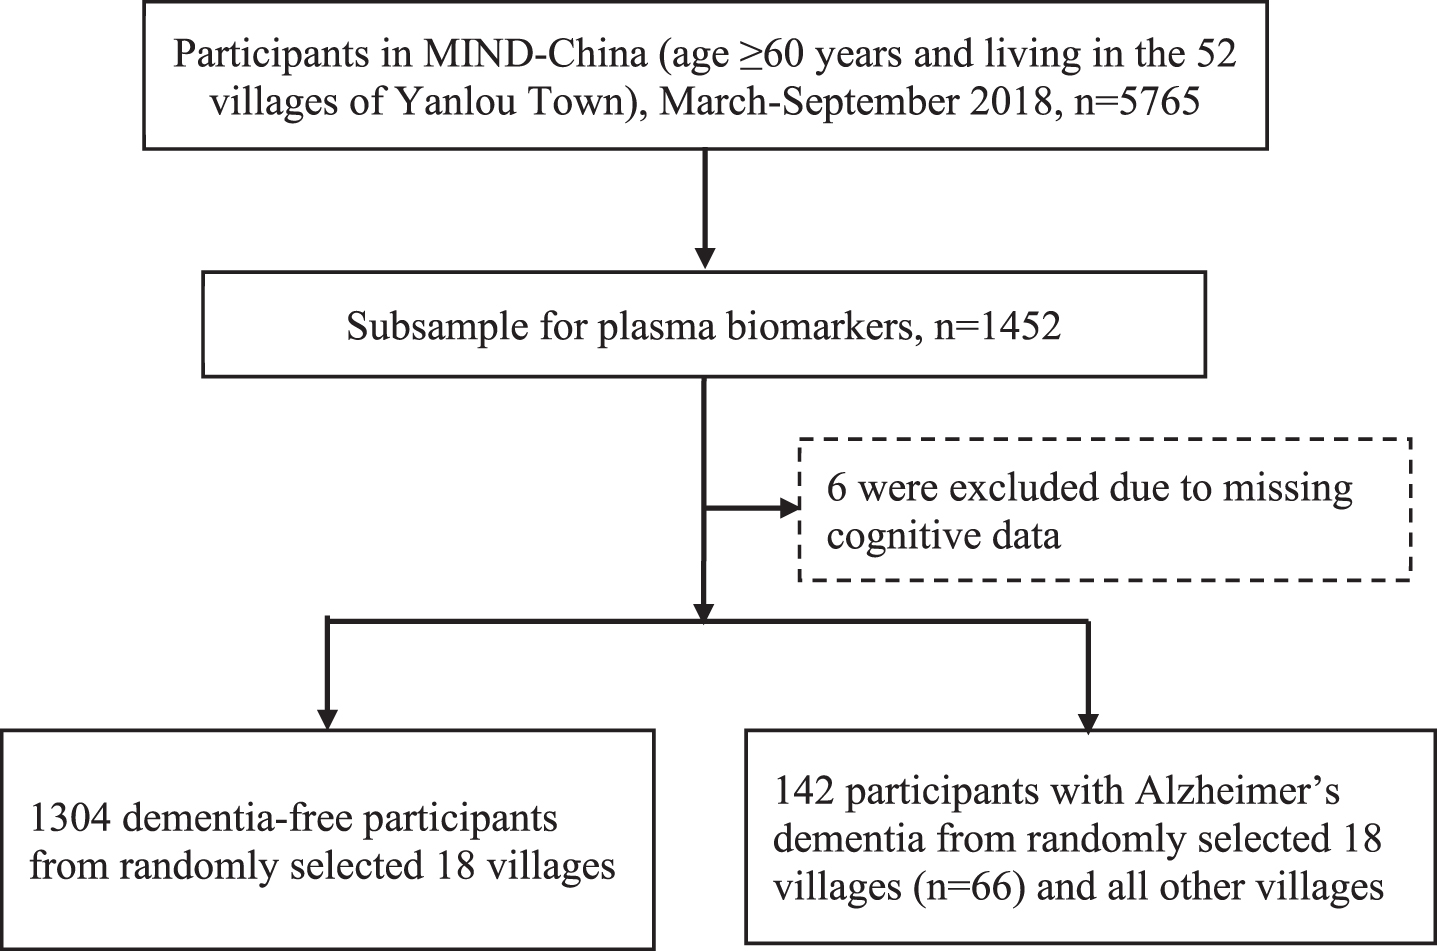
This population-based study used data from a subsample of participants in the baseline assessments of the Multimodal Interventions to Delay Dementia and Disability in Rural China (MIND-China) study, as previously described [22, 23]. In brief, as a participating project in the World-Wide FINGERS Network [24], MIND-China engaged people who were aged ≥60 years and living in the rural communities (52 villages) of Yanlou Town, Yanggu County, western Shandong Province, China. In March-September 2018, 5,765 residents (74.9% of all eligible persons) underwent the baseline examination. Plasma AD biomarkers (i.e., plasma Aβ40, Aβ42, t-tau, and NfL) were measured in a subsample of 1,304 dementia-free participants who were living in the 18 villages that were randomly selected from the 52 villages plus 142 persons who had blood samples and were diagnosed with AD in all MIND-China participants (of these persons with AD, 66 were from the 18 villages) (Fig. 1). Compared with participants who did not have data on plasma AD biomarkers (n = 4,319), those in the plasma biomarker substudy (n = 1,446) were slightly younger (mean age 70.2 versus 71.1 years, p < 0.001) and more likely to be women (61.0% versus 55.9%, p < 0.001), but the two groups did not differ significantly in educational level.
Fig. 1
Flowchart of the study participants.
The MIND-China project was approved by the Ethics Committee at Shandong Provincial Hospital affiliated to Shandong University in Jinan, Shandong. Written informed consents were obtained from all participants, or in case of people with severe cognitive impairment, from informants. This study was carried out in accordance with the ethical principles expressed in the Declaration of Helsinki. MIND-China was registered in the Chinese Clinical Trial Registry (Registration No: ChiCTR1800017758).
Data collection and assessments
Following a structured questionnaire, the trained medical staff collected data through face-to-face interviews, clinical examinations, neuropsychological testing, and laboratory tests, which included sociodemographic features (age, sex, and education), behavioral factors (e.g., smoking and alcohol consumption), metabolic factors (e.g., blood pressure, diabetes, and lipids), health conditions (e.g., coronary heart disease and stroke), use of medications (e.g., antihypertensive agents, blood glucose-lowering drugs, and cholesterol-lowering agents), and APOE genotype. Definitions, assessments, and categorizations of covariates are described elsewhere [25, 26] and provided in the Supplementary Material as well.
Neuropsychological assessments and clinical diagnosis of AD and MCI
Cognitive function was evaluated using a neuropsychological test battery, as previously reported [22, 23]. In brief, we assessed function of the following four cognitive domains: memory was assessed using the Auditory Verbal Learning Test immediate recall, the long-delayed free recall, and the long-delayed recognition; verbal fluency was assessed using the Verbal Fluency Test, including animal, fruit, and vegetable categories; attention was assessed with the Trail Making Test-A and Digit Span Forward test; and executive function was assessed using the Trail Making Test-B and Digit Span Backward test. Each of the raw test scores was standardized into z score using the mean and standard deviation (SD), derived from all participants who were free from dementia. Then, the composite z score for each of the cognitive domains was calculated by averaging the z scores of all the tests for that domain.
The diagnostic procedure of AD and MCI in the MIND-China study has been described elsewhere [22, 23]. In brief, dementia was clinically diagnosed according to the Diagnostic and Statistical Manual of Mental Disorders, Fourth Edition (DSM-IV) criteria [27], following a three-step diagnostic procedure. That is, the trained medical staff first conducted clinical and neurological examinations to assess health-related factors, medical history, and cognitive function following structured questionnaires. Then, neurologists specialized in dementia care reviewed all of the data collected from the initial assessments and made a preliminary judgement for people who were suspected to have dementia. Finally, the neurologists conducted the second in-person interviews with those who were suspected to have dementia or who had insufficient data for making a diagnosis of dementia status, and reassessed their medical history, cognitive status, Chinese version of activity of daily living, and whenever available, brain imaging data. In the case of uncertainty, a senior neurologist was consulted and a consensus diagnosis of dementia was reached. Clinical diagnosis of AD dementia was made according to the National Institute on Aging and Alzheimer’s Association (NIA-AA) criteria for probable AD dementia [28]. MCI was defined according to the Petersen’s criteria [29], where both neuropsychological test scores and a consensus agreement among the examining neurologists were considered, as previously described [23].
Measurement of plasma biomarkers
After an overnight fast, peripheral blood samples were drawn into ethylene diamine tetraacetic acid (EDTA) citrate vacutainer tubes and centrifuged in a tabletop centrifuge. Plasma samples were then aliquoted and stored at –80°C until retrieved and thawed on ice. Plasma biomarkers were measured using the Single molecule array (Simoa) platform (Quanterix Corp, MA, USA) for Aβ42 and Aβ40, t-tau (Human Neurology 3-Plex A assay), and NfL (NF-light® advantage Kit) at the laboratory of Wayen Biotechnologies Inc., Shanghai, China. Two quality control plasma samples were run in duplicate on each plate for each analyte. The intra-assay coefficient of variation and the inter-assay coefficient of variation were all below 13.0% for the control sample.
Statistical analysis
We conducted descriptive statistical analysis to report means (SD) for continuous and frequency (%) for categorical variables. Plasma Aβ40 and NfL were natural log-transformed to reduce skewness. Outliers (>5 SDs above the mean of the whole sample) were excluded from the main analysis. We compared characteristics of study participants among normal cognition, MCI, and AD groups using Kruskal-Wallis tests for continuous variables with skewed distribution, and chi-square test for categorical variables. Spearman’s rank order correlation was used to assess correlations between plasma biomarkers (plasma Aβ42, Aβ40, Aβ42/Aβ40 ratio, t-tau, and NfL). We used the general linear regression models to examine the associations of demographic factors and APOE genotype with plasma biomarkers in the total sample and among dementia-free individuals as previously reported [16]. Multinomial logistic regression analyses were used to estimate the odds ratio (OR) and 95% confidence interval (CI) of plasma biomarkers associated with MCI and AD, in which plasma biomarkers were analyzed as both continuous and categorical (tertiles) variables. We evaluated interactions of plasma biomarkers with age groups (<75 versus ≥75 years), sex, education, or APOE ɛ4 allele on the likelihood of MCI and AD. Stratifying analysis was then performed when a statistical interaction was detected. We presented the main results from two models: model 1 was adjusted for age, sex, and education, and model 2 was further adjusted for body mass index, smoking, alcohol drinking, estimated glomerular filtration rate (calculated from serum creatinine), hypertension, diabetes, dyslipidemia, coronary heart disease, stroke, and APOE genotype. In addition, we used ROC analysis to assess the ability of plasma biomarkers to differentiate between diagnostic groups. Youden index was used to determine optimal sensitivity and specificity. Differences in AUCs were evaluated using Bootstrap test with N = 2000 repetitions [30]. We used Bootstrap test to evaluate to what extent plasma biomarkers alone and in combination with demographic factors and APOE genotype could improve the diagnostic accuracy.
We used SAS version 9.4 (SAS Institute Inc., Cary, NC) and R version 4.1.3 for Windows (R Core Team, R Foundation for Statistical Computing, Vienna, Austria. www.R-project.org/) for all the data analyses.
RESULTS
Characteristics of the study participants
Out of the 1,446 participants, 402 (27.8%) were defined with MCI and 142 (9.8%) were diagnosed with AD dementia. The mean age of all participants was 70.22 years (SD 5.30), 61.0% were women, and 40.3% were illiterate (Table 1). Compared with normal cognition, participants with MCI or AD were older, less educated, more likely to be women, less likely to smoke and drink alcohol, had lower estimated glomerular filtration rate and plasma Aβ42/Aβ40 ratio, and higher plasma Aβ40 and NfL concentrations (p < 0.05) (Table 1). In addition, participants with AD had lower body mass index and higher plasma Aβ42 and t-tau than those with normal cognition. Participants with MCI had a higher prevalence of hypertension and stroke than those with normal cognition (p < 0.05) (Table 1). The three groups had no significant differences in the proportion of APOE ɛ4 allele, coronary heart disease, diabetes mellitus, and hypercholesterolemia.
Table 1
Characteristics of the study participants by cognitive status (n = 1446)
| Total sample | AD cognitive continuum | ||||
| Characteristicsa | (n = 1,446) | Normal (n = 902) | MCI (n = 402) | AD (n = 142) | p |
| Age, y | 70.22 (5.30) | 69.10 (4.29) | 70.55 (5.13)* | 76.35 (7.00)*† | <0.001 |
| Women | 882 (61.00) | 492 (54.55) | 274 (68.16)* | 116 (81.69)*† | <0.001 |
| Illiteracy | 582 (40.25) | 279 (30.93) | 194 (48.26)* | 109 (76.76)*† | <0.001 |
| APOE ɛ4 carrier | 227 (16.07) | 135 (15.34) | 64 (16.33) | 28 (19.86) | 0.39 |
| Body mass index, kg/m2 | 24.98 (3.59) | 25.10 (3.49) | 25.14 (3.63) | 23.82 (3.96)*† | <0.001 |
| Current smoking | 274 (18.95) | 207 (22.95) | 59 (14.68)* | 8 (5.63)*† | <0.001 |
| Current alcohol drinking | 397 (27.72) | 318 (35.53) | 67 (16.92)* | 12 (8.51)*† | <0.001 |
| Stroke | 197 (13.62) | 107 (11.86) | 68 (16.92)* | 22 (15.49) | 0.04 |
| Coronary heart disease | 296 (20.47) | 180 (19.96) | 77 (19.15) | 39 (27.46) | 0.09 |
| Hypertension | 1,002 (69.73) | 607 (67.75) | 301 (75.25)* | 94 (66.67) | 0.02 |
| Diabetes mellitus | 222 (15.35) | 143 (15.85) | 56 (13.93) | 23 (16.20) | 0.64 |
| Hypercholesterolemia | 234 (16.18) | 144 (15.96) | 61 (15.17) | 29 (20.42) | 0.33 |
| eGFR, mL/min/1.73 m2 | 90.71 (18.39) | 92.22 (17.38) | 89.72 (18.84)* | 83.99 (21.53)*† | <0.001 |
| Plasma biomarkers | |||||
| Aβ40, pg/ml | 179.21 (46.48) | 174.61 (45.62) | 183.04 (44.46)* | 197.58 (52.04)*† | <0.001 |
| Aβ42, pg/ml | 11.97 (3.01) | 11.85 (2.91) | 12.00 (2.90) | 12.67 (3.82)* | 0.04 |
| Aβ42/Aβ40 ratio (×100) | 6.87 (1.62) | 6.99 (1.64) | 6.72 (1.56)* | 6.53 (1.58)* | <0.001 |
| Total-tau, pg/ml | 2.36 (0.98) | 2.32 (0.93) | 2.32 (1.01) | 2.77 (1.09)*† | <0.001 |
| NfL, pg/mlb | 15.16 (10.00) | 13.87 (8.58) | 15.68 (10.78)* | 21.96 (12.94)*† | <0.001 |
MCI, mild cognitive impairment; AD, Alzheimer’s disease; APOE, apolipoprotein E gene; eGFR, estimated glomerular filtration rate; Aβ, amyloid-β; NfL, neurofilament light chain. aNumber of participants with missing values was 33 for APOE genotype, 8 for body mass index, 14 for alcohol drinking, and 9 for hypertension. bEight outliers with plasma NfL values 5 SDs above the mean of the whole data, as well as one plasma NfL value below the lower limit of quantification were excluded from the analysis (n = 1437, of these, 897 with normal cognition, 400 with MCI, and 140 with AD). *p < 0.05 for the comparison with normal cognition. †p < 0.05 for the comparison with MCI.
Correlations between plasma biomarkers
Spearman rank correlation analysis suggested significant correlations of plasma Aβ40 with Aβ42 (r = 0.57), t-tau (r = 0.30), and NfL (r = 0.27), of plasma Aβ42 with t-tau (r = 0.15) and NfL (r = 0.20), of plasma Aβ42/Aβ40 ratio with t-tau (r = –0.14) and NfL (r = –0.07), and of plasma t-tau with NfL (r = 0.20) (for all correlation coefficients, p < 0.001) (Supplementary Figure 1).
Associations of plasma biomarkers with demographic factors and APOE ɛ4 allele
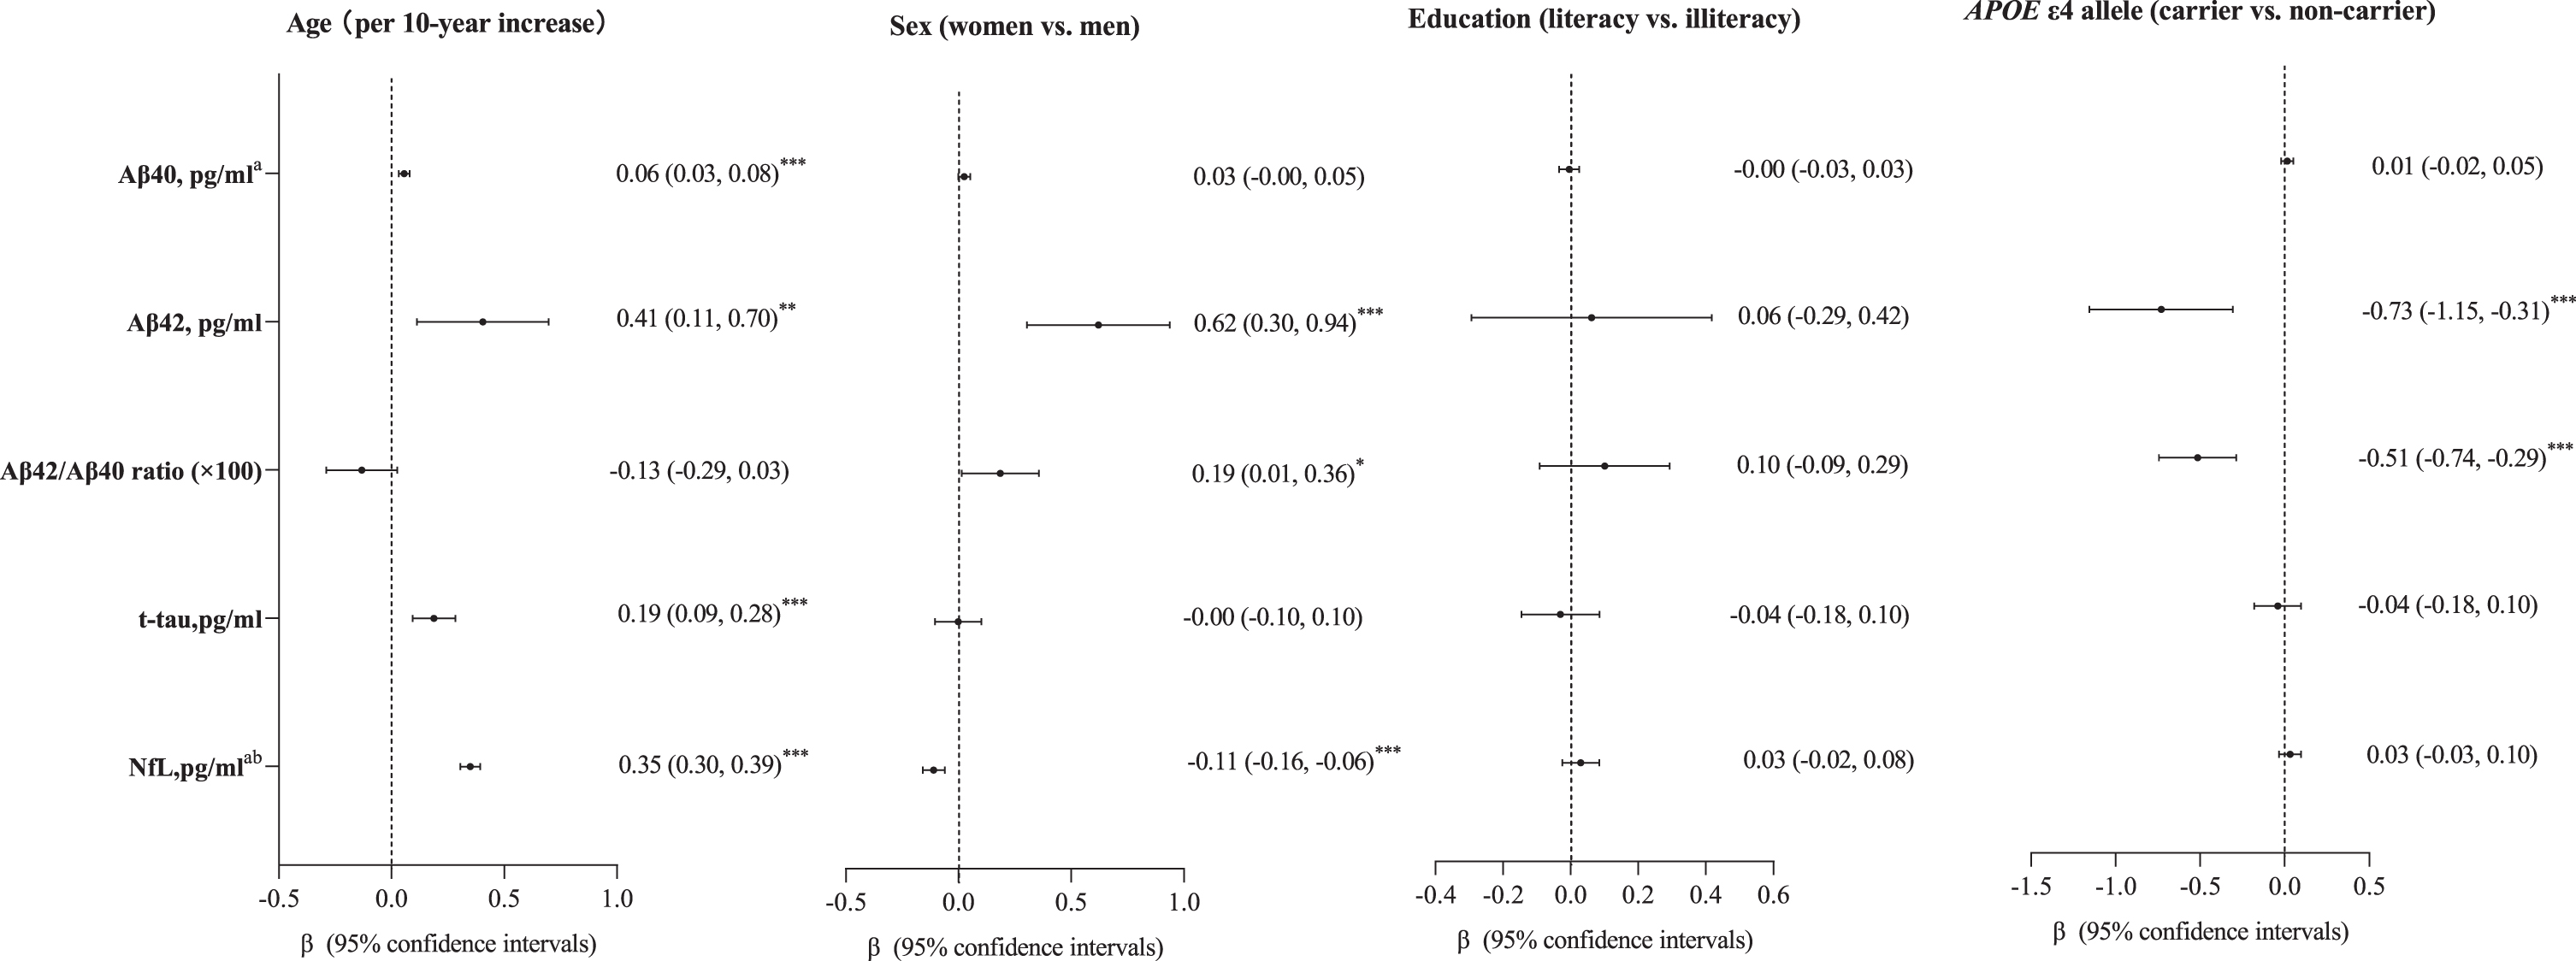
Plasma Aβ40, Aβ42, t-tau, and NfL, but not Aβ42/Aβ40 ratio, increased with advanced age (Fig. 2). Furthermore, after controlling for age, plasma Aβ42, and the Aβ42/Aβ40 ratio were higher in women than in men, whereas plasma NfL was lower in women than in men (for all sex differences, p < 0.05) (Fig. 2). In addition, APOE ɛ4 allele was significantly associated with lower plasma Aβ42 and Aβ42/Aβ40 ratio in the age- and sex-adjusted model (Fig. 2). Education was not significantly associated with any of the examined plasma biomarkers. All these associations remained largely the same after adjustment for demographic factors, APOE genotype, lifestyles, metabolic factors, and clinical factors (Supplementary Figure 2).
Fig. 2
Associations of age, sex, education, and APOE ɛ4 allele with plasma biomarkers. Aβ, amyloid-β; t-tau, total-tau; NfL, neurofilament light chain; APOE, apolipoprotein E gene. aThese data were natural log-transformed to normalize the distributions (n = 1,446, 402 with mild cognitive impairment, 142 with Alzheimer’s disease). bEight outliers with plasma NfL values >5 SDs above the mean of the whole data, as well as one plasma NfL value below the lower limit of quantification was excluded from the main analysis (n = 1437, 400 with mild cognitive impairment and 140 with Alzheimer’s disease). *p < 0.05; **p < 0.01; ***p < 0.001. Model was adjusted for age and sex wherever appropriate.
Among individuals free of dementia, the associations of plasma Aβ40, Aβ42, and NfL with increased age remained statistically significant, but the correlation between plasma t-tau and advanced age became statistically non-significant (Supplementary Figure 3).
Associations of plasma biomarkers with the cognitive continuum
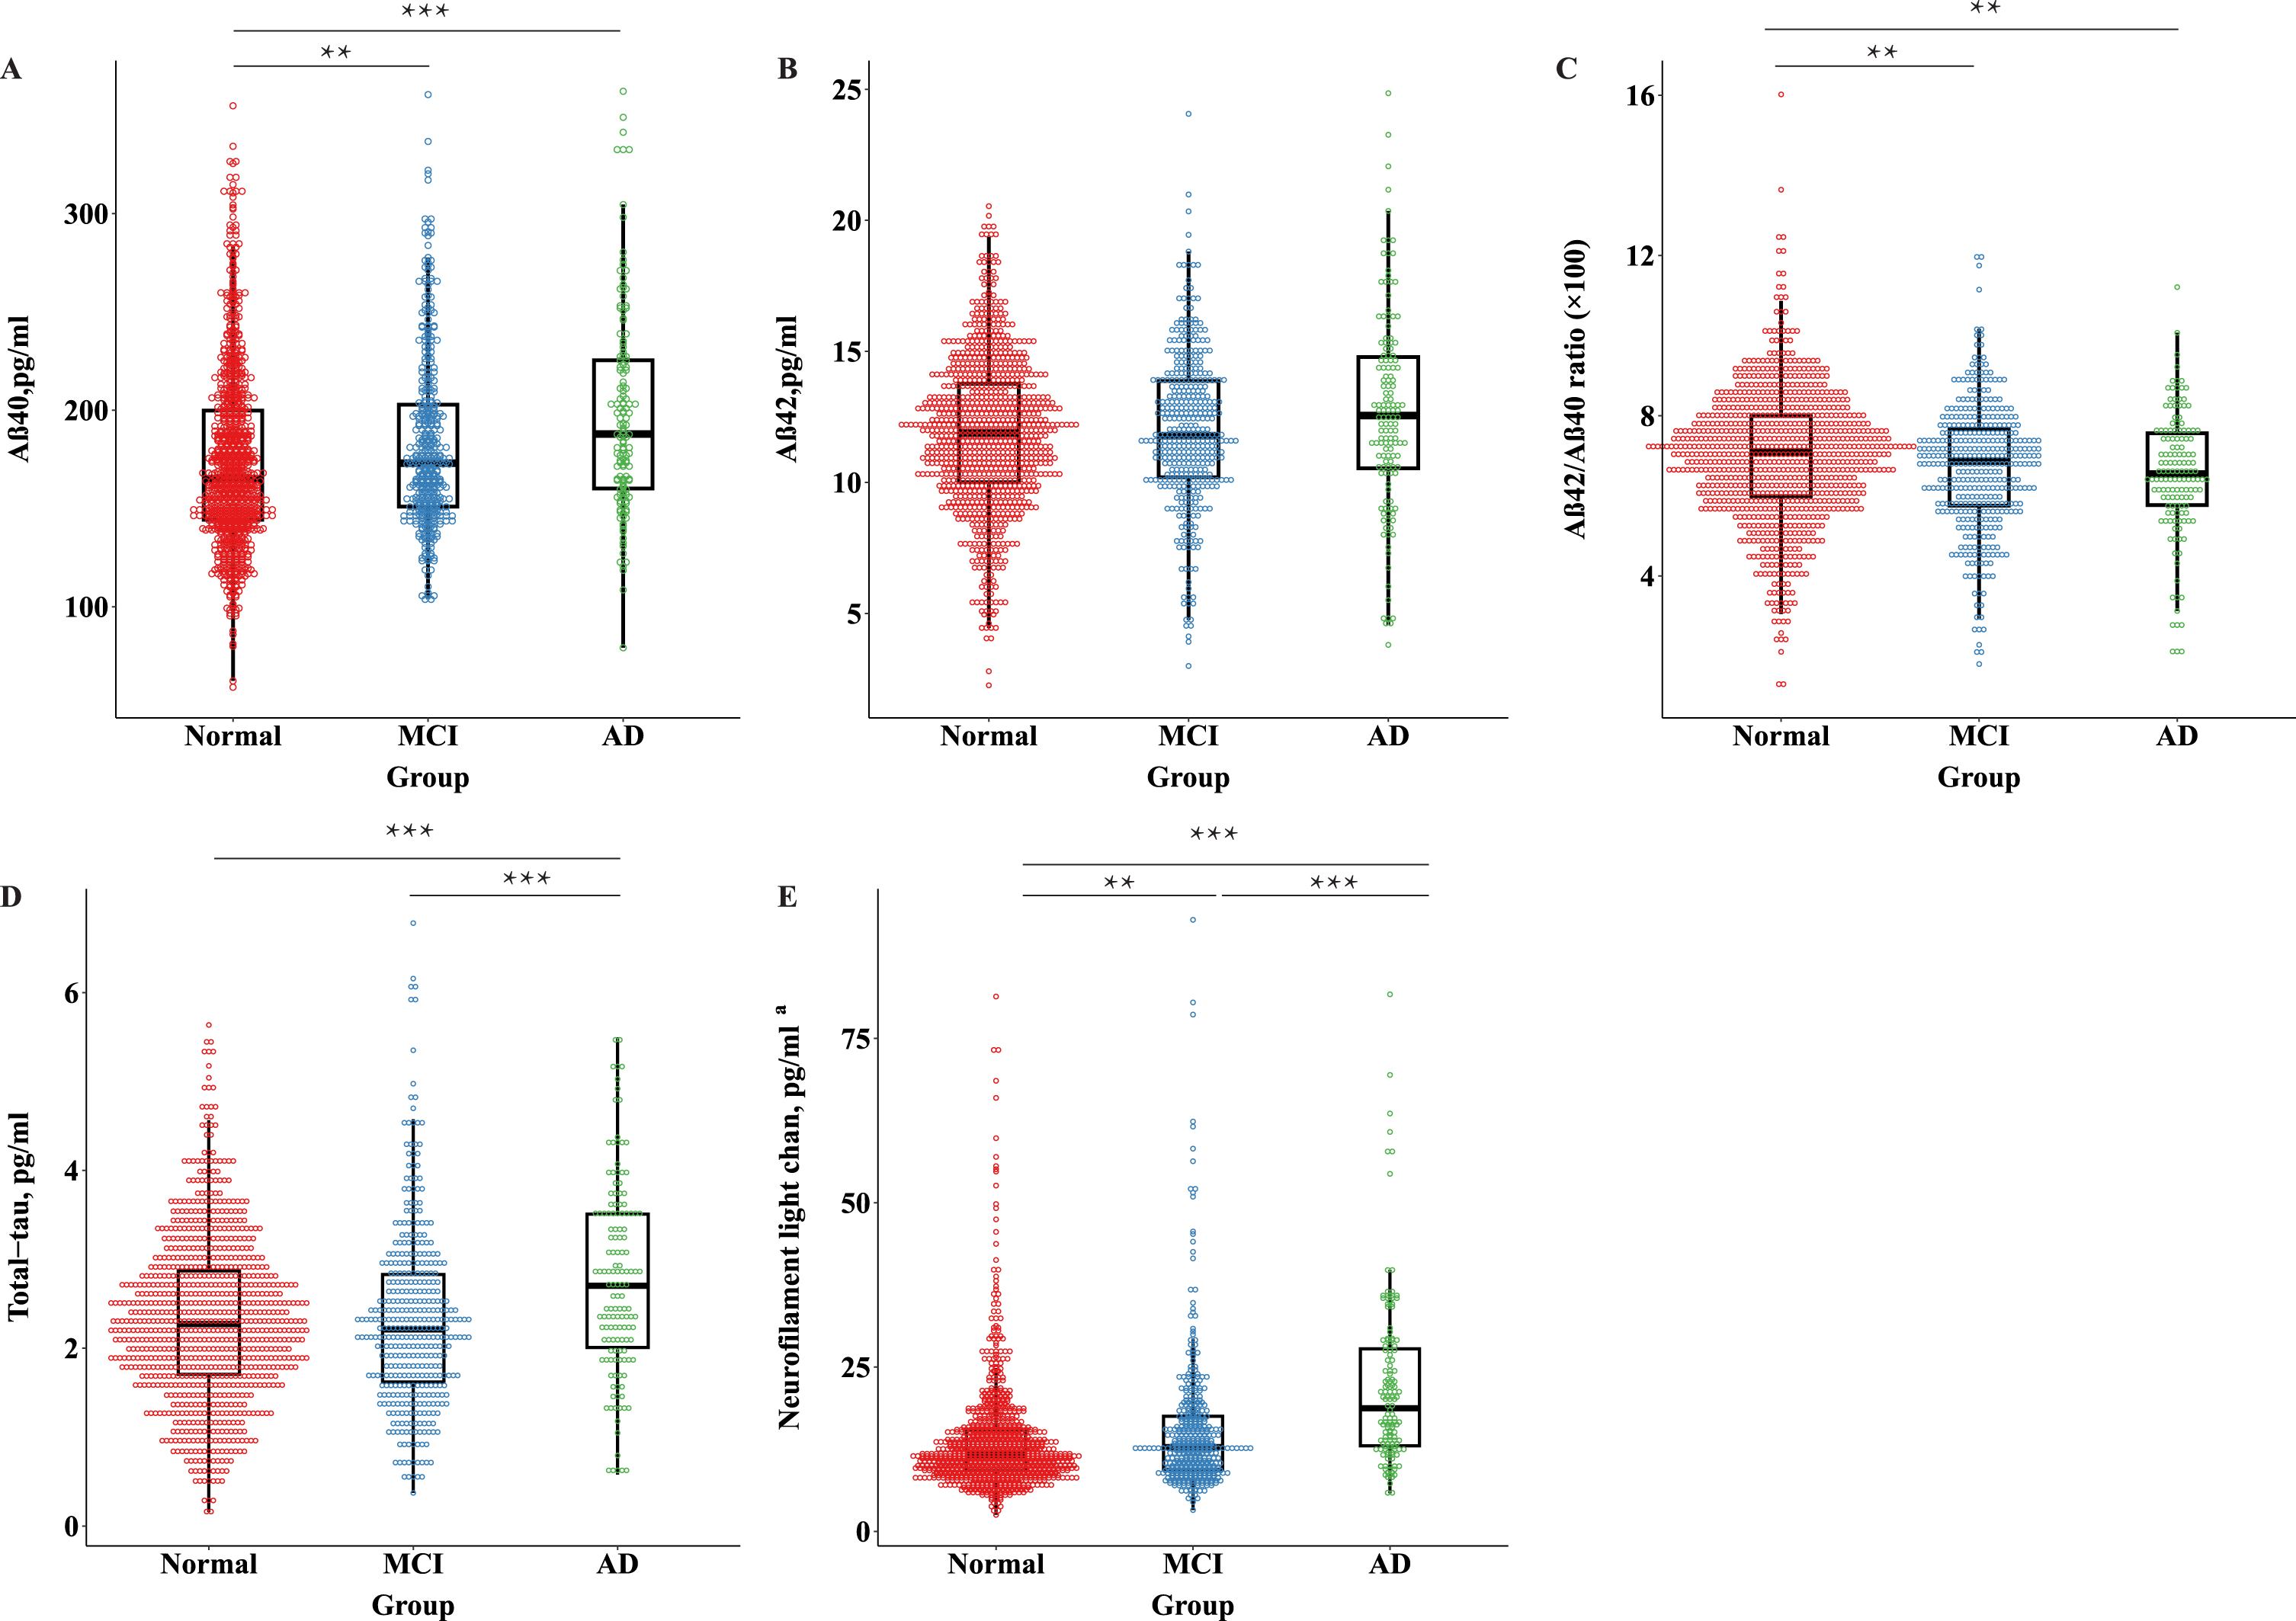
Participants with AD (versus normal cognition group) had higher plasma Aβ40, t-tau, and NfL, and lower Aβ42/Aβ40 ratio (demographic-adjusted p < 0.01) (Fig. 3). Participants with AD dementia showed higher plasma t-tau and NfL than those with MCI (demographic-adjusted p < 0.01). In addition, participants with MCI showed higher plasma Aβ40 and NfL, and a lower Aβ42/Aβ40 ratio than those with normal cognition (demographic-adjusted p < 0.01) (Fig. 3). Same results were obtained in fully-adjusted models.
Fig. 3
Distribution of AD plasma biomarkers across groups of people with normal cognition, mild cognitive impairment, and Alzheimer’s disease. MCI, mild cognitive impairment; AD, Alzheimer’s disease; Aβ, amyloid-β; NfL, neurofilament light chain. aEight outliers with plasma NfL values >5 SDs above the mean of the whole data, as well as one below the lower limit of quantification were excluded from the main analysis (n = 1437, 400 with mild cognitive impairment, 140 with Alzheimer’s disease). *p < 0.05; **p < 0.01; ***p < 0.001. All p values are derived from the general linear model, adjusting for age, sex, and education.
Similarly, higher plasma Aβ40 and NfL, and a lower Aβ42/Aβ40 ratio were significantly related to a higher likelihood of MCI after controlling for demographic factors (Table 2, Model 1). In addition, higher plasma Aβ40, t-tau, and NfL, and a lower Aβ42/Aβ40 ratio were significantly associated with a higher likelihood of AD after adjusting for demographic factors (Table 2, Model 1). When plasma Aβ, t-tau, and NfL were analyzed as tertiles, similar patterns of associations with MCI and AD were obtained (Table 2, Model 1). All these associations remained statistically significant when further controlling for APOE genotype, lifestyle, metabolic factors, and clinical factors, except that the association between medium tertile of Aβ40 and an increased likelihood of AD was attenuated and became statistically non-significant (Table 2, Model 2).
Table 2
Odds ratios and 95% confidence intervals of mild cognitive impairment and Alzheimer’s disease with plasma biomarkers from multinomial logistic regression models (n = 1,446)
| Plasma biomarkers | Mild cognitive impairment (n = 402) | Alzheimer’s disease (n = 142) | ||
| Model 1† | Model 2† | Model 1† | Model 2† | |
| Aβ40, pg/mla | ||||
| Continues | 2.16 (1.32–3.53)** | 1.99 (1.19–3.33)** | 4.50 (1.94–10.45)*** | 3.27 (1.33–8.00)** |
| Categorical (tertiles) | ||||
| Lower | 1.00 (reference) | 1.00 (reference) | 1.00 (reference) | 1.00 (reference) |
| Medium | 1.52 (1.13–2.05)** | 1.56 (1.15–2.12)** | 1.75 (1.00, 3.05)* | 1.60 (0.90–2.83) |
| Upper | 1.52 (1.12–2.05)** | 1.44 (1.05–1.97)* | 2.28 (1.33–3.90)** | 1.84 (1.05–3.23)* |
| p for trend | <0.01 | 0.02 | <0.01 | 0.03 |
| Aβ42, pg/ml | ||||
| Continues | 1.01 (0.97–1.05) | 1.00 (0.96–1.04) | 1.05 (0.98–1.12) | 1.02 (0.95–1.10) |
| Categorical (tertiles) | ||||
| Lower | 1.00 (reference) | 1.00 (reference) | 1.00 (reference) | 1.00 (reference) |
| Medium | 1.14 (0.84–1.53) | 1.10 (0.81–1.49) | 1.05 (0.62–1.78) | 0.91 (0.53–1.57) |
| Upper | 1.09 (0.81–1.47) | 1.03 (0.75–1.40) | 1.12 (0.68–1.86) | 0.91 (0.53–1.55) |
| p for trend | 0.59 | 0.88 | 0.64 | 0.74 |
| Aβ42/Aβ40 ratio (×100) | ||||
| Continues | 0.89 (0.83–0.96)** | 0.90 (0.83–0.97)** | 0.84 (0.74–0.96)** | 0.85 (0.74–0.97)* |
| Categorical (tertiles) | ||||
| Lower | 1.00 (reference) | 1.00 (reference) | 1.00 (reference) | 1.00 (reference) |
| Medium | 0.99 (0.74–1.32) | 1.04 (0.77–1.40) | 1.08 (0.66–1.76) | 1.05 (0.63–1.75) |
| Upper | 0.64 (0.47–0.86)** | 0.65 (0.48–0.88)** | 0.63 (0.37–1.05) | 0.65 (0.38–1.11) |
| p for trend | <0.01 | <0.01 | 0.08 | 0.11 |
| T-tau, pg/ml | ||||
| Continues | 0.99 (0.88–1.13) | 0.99 (0.87–1.13) | 1.37 (1.12–1.67)** | 1.39 (1.13–1.70)** |
| Categorical (tertiles) | ||||
| Lower | 1.00 (reference) | 1.00 (reference) | 1.00 (reference) | 1.00 (reference) |
| Medium | 1.00 (0.75–1.33) | 1.02 (0.76–1.37) | 1.18 (0.68–2.05) | 1.30 (0.74–2.30) |
| Upper | 0.82 (0.61–1.11) | 0.81 (0.60–1.11) | 1.77 (1.06–2.95)* | 1.89 (1.11–3.22)* |
| p for trend | 0.21 | 0.20 | 0.02 | 0.02 |
| NfL , pg/ml ab | ||||
| Continues | 1.51 (1.15–1.97)** | 1.46 (1.10–1.93)** | 3.42 (2.25–5.21)*** | 2.96 (1.90–4.62)*** |
| Categorical (tertiles) | ||||
| Lower | 1.00 (reference) | 1.00 (reference) | 1.00 (reference) | 1.00 (reference) |
| Medium | 0.96 (0.71–1.30) | 0.94 (0.69–1.28) | 1.34 (0.71–2.53) | 1.33 (0.70–2.54) |
| Upper | 1.42 (1.04–1.96)* | 1.42 (1.02–1.99)* | 3.27 (1.77–6.02)*** | 2.85 (1.50–5.42)** |
| p for trend | 0.03 | 0.04 | <0.001 | <0.001 |
Aβ, amyloid-β; t-tau, total tau; NfL, neurofilament light chain. aThese data were natural log-transformed to normalize the distributions. bEight outliers with plasma NfL values >5 SDs above the mean of the whole data, as well as one below the lower limit of quantification were excluded from the main analysis (n = 1437, 400 with mild cognitive impairment, 140 with Alzheimer’s disease). *p < 0.05; **p < 0.01; ***p < 0.001. †Participants with normal cognition (n = 902) were used as a referent group in the multinomial logistic regression analysis. Model 1 was adjusted for age, sex, and education; and in model 2, additional adjustment was made for APOE genotype, behavioral, metabolic, and clinical factors.
In addition, we detected statistical interactions of plasma Aβ42/Aβ40 ratio with APOE ɛ4 allele on the likelihood of AD (p for interaction = 0.02), such that a higher Aβ42/Aβ40 ratio was significantly associated with a lower odds ratio of AD among APOE ɛ4 allele non-carriers (multivariable-adjusted OR = 0.79; 95% CI 0.68–0.91), but not among APOE ɛ4 allele carriers (1.23; 0.87–1.74).
Performance of plasma biomarkers in discriminating the cognitive continuum
Of all the examined plasma biomarkers, plasma NfL showed the highest AUC value for differentiating between AD and the combined non-dementia groups (i.e., MCI plus normal cognition) (AUC = 0.73; 95% CI 0.69–0.77; Fig. 4A), between AD and normal cognition (0.75; 0.70–0.79; Fig. 4B), and between AD and MCI (0.69; 0.64–0.74; Fig. 4D). Plasma t-tau showed similar AUC to that of plasma NfL for discriminating AD from MCI (0.63; 0.58–0.68; Fig. 4D) (p for bootstrap test >0.05). All the examined plasma biomarkers performed poorly in differentiating between MCI and normal cognition (Fig. 4C).
Fig. 4
Discriminative performance of plasma biomarkers across diagnostic groups. Receiver-operating characteristics curves displaying the performance of plasma Aβ40, Aβ42, Aβ42/Aβ40 ratio, total-tau, and NfL to distinguish (A) between AD dementia and non-dementia; (B) between AD dementia and normal cognition, (C) between MCI and normal cognition, and (D) between AD dementia and MCI. MCI, mild cognitive impairment; AD, Alzheimer’s disease; Aβ, amyloid-β; NfL, neurofilament light chain; AUC, areas under the receiver operating characteristics curve.
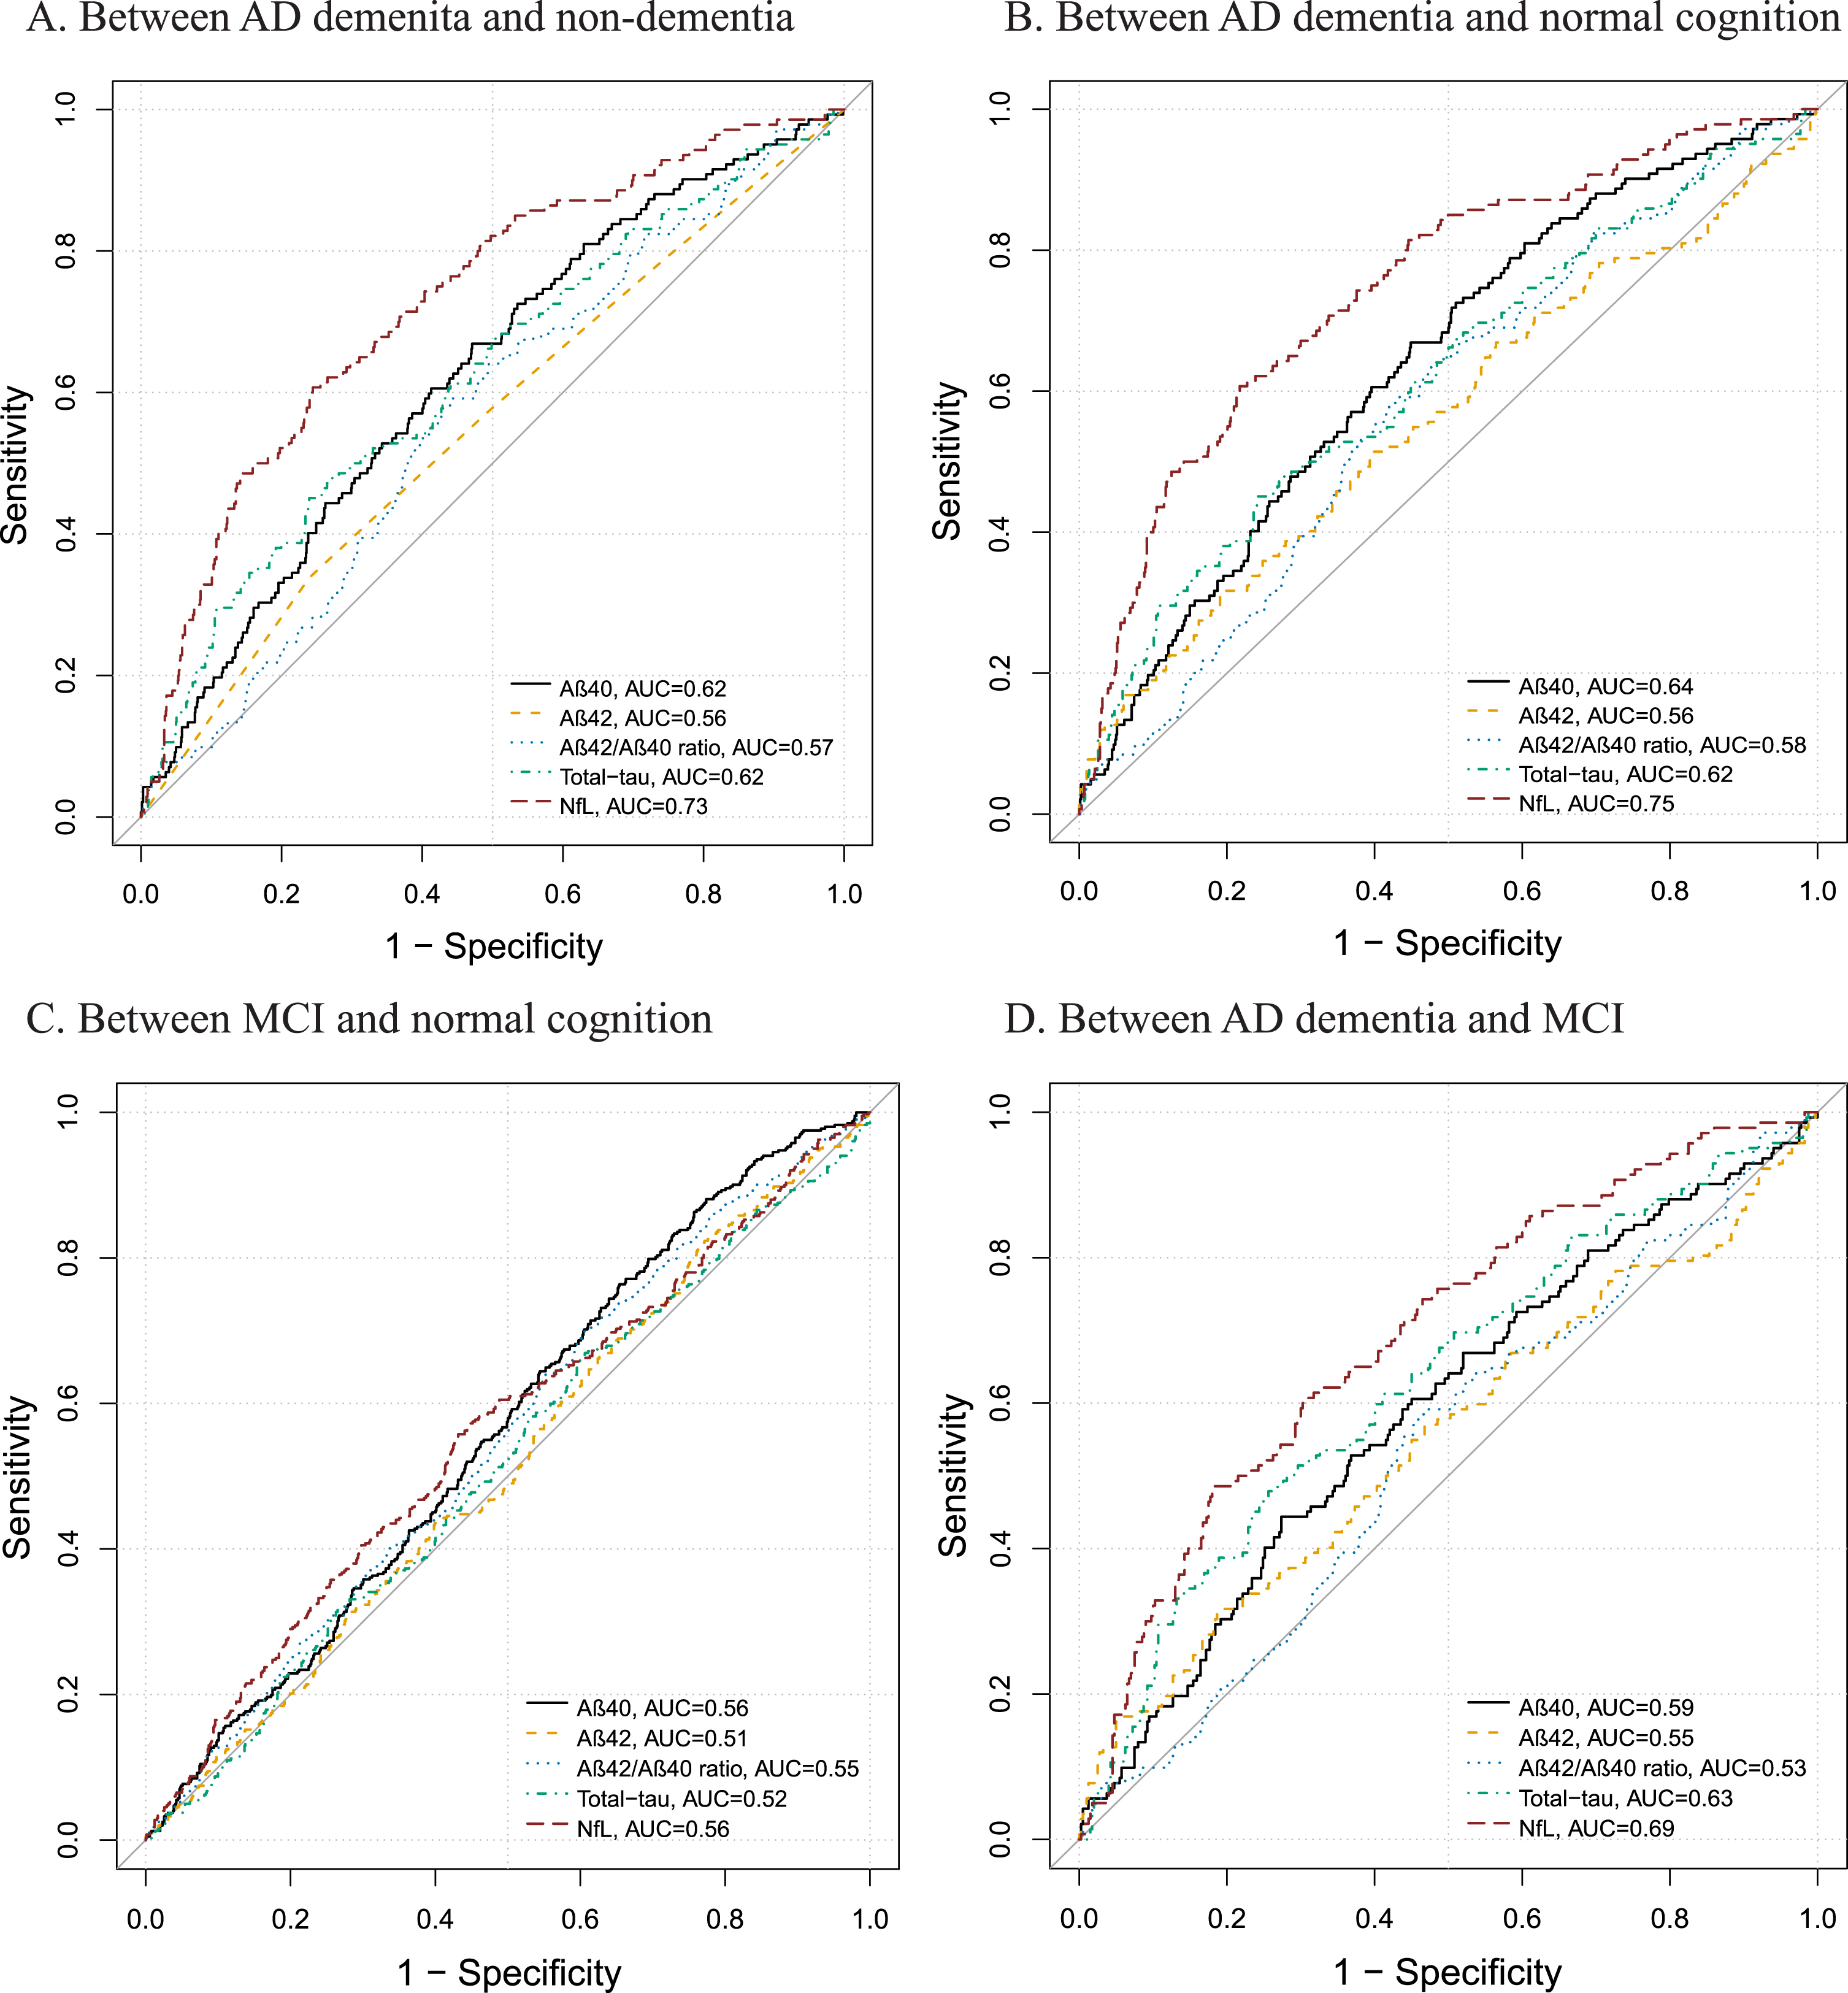
Adding age, sex, education, and APOE ɛ4 allele to plasma NfL in the models significantly improved the accuracy for discriminating AD from non-dementia (AUC = 0.85:95% CI 0.81–0.88), normal cognition (0.87; 0.84–0.91), and MCI (0.79; 0.74–0.83) (compared with plasma NfL alone, all p for bootstrap test <0.001), but not for differentiating between MCI and normal cognition (p for bootstrap test >0.05) (Supplementary Table 1).
DISCUSSION
In this population-based study of rural-dwelling older adults in China, we characterized the plasma biomarkers of amyloid and neurodegeneration associated with the cognitive continuum from normal cognition through MCI to AD and further evaluated diagnostic performance of the plasma biomarkers. The main findings can be summarized as follows: 1) plasma Aβ, t-tau, and NfL varied by age, sex, or APOE genotype such that older age was associated with higher plasma Aβ40, Aβ42, t-tau, and NfL; that women had higher plasma Aβ42 but lower NfL than men; and that APOE ɛ4 carriers had lower plasma Aβ42 and Aβ42/Aβ40 ratio than non-carriers; 2) plasma Aβ40, t-tau, and NfL concentrations increased while the Aβ42/Aβ40 ratio decreased from normal cognition through MCI to AD; and 3) plasma NfL outperformed all other examined biomarkers in distinguishing people with AD dementia from those with MCI or with normal cognition.
The increase in plasma Aβ40, Aβ42, t-tau, and NfL with advanced age was consistent with the reports from the Mayo Clinic Study of Aging [14] and the Rotterdam Study [16]. From the perspective of neuropathology, the age-dependent increase in plasma Aβ might be due to the increased Aβ production and decreased Aβ clearance with advanced age [31]. The age-dependent increase in neurodegeneration (e.g., NfL) might partly contribute to the accumulative subclinical comorbid pathologies in old age such as cerebrovascular lesions and neuroinflammation as well as injuries of neuron and axon[32, 33].
Previously, the population-based studies and the meta-analysis revealed higher plasma and CSF NfL concentrations in men than in women [12, 34], which was consistent with our study, although some other studies did not find such a sex difference [14, 15, 17]. In addition, two population-based studies reported no sex difference of plasma t-tau [15, 18], which was in line with our observation, but two other population-based studies did report higher plasma t-tau in women than in men [14, 17]. The differences in ethnicity/race, comorbid diseases or lifestyle of the study participants may partly contribute to discrepancies in findings across studies. The sex differences in plasma Aβ and neurodegenerative biomarkers warrant further investigation in various ethnic populations.
In addition, we found that APOE ɛ4 allele was associated with lower plasma Aβ42 and Aβ42/Aβ40 ratio but not with plasma Aβ40, consistent with the findings from the Rotterdam study [35] and a genome-wide association study [36]. The Aβ42, the primary component of amyloid plaque, is more likely to aggregate than Aβ40. In addition, the apoE4 protein, coded by the ɛ4 allele variant of the APOE gene, is known to influence the Aβ aggregation or clearance process rather than the process of Aβ peptide production [36].
We found that across the AD clinical spectrum, plasma Aβ40 increased and the Aβ42/Aβ40 ratio decreased, whereas there was no difference in plasma Aβ42. This was consistent with the Atherosclerosis Risk in Communities Neurocognitive study, which reported that higher plasma Aβ40 and lower plasma Aβ42/Aβ40 ratio in midlife and late-life were associated with MCI and dementia and that lower plasma Aβ42 at midlife, but not late-life, was related to MCI or dementia [37]. However, previous cross-sectional studies regarding the association of plasma Aβ with dementia have yielded mixed results because both elevated and decreased plasma Aβ42 levels were reported in people with cognitive impairment [38, 39]. In addition, plasma Aβ42 levels might increase in the pre-pathological stage of AD and then decrease with progression of the disease [40], and as a result, plasma Aβ42 levels may decline into normal ranges in the clinical phase. Thus, plasma Aβ measured at different stages of AD may partly interpret the discrepancies. Furthermore, we found that plasma t-tau concentration was higher in people with AD than those with MCI or normal cognition, which was in line with the report from the Mayo Clinic Study of Aging [20, 21]. This suggests that plasma t-tau could be a biomarker at the relatively late stages of the AD clinical continuum [16, 41]. Our data were also in agreement with a community-based multi-ethnic study in US [12], which showed that plasma NfL levels were increased across the AD clinical spectrum.
A lower plasma Aβ42/Aβ40 ratio might reflect more Aβ aggregation in the brain. Indeed, recent cohort studies showed that plasma Aβ42/Aβ40 ratio could be used to identify people with abnormal CSF or PET amyloid status [42] and that a low plasma Aβ42/Aβ40 ratio was associated with a high load of cerebral AD pathology [43]. However, our data suggested that plasma Aβ42/Aβ40 ratio was not sensitive in differentiating cognitive phenotypes in old age. This may be related to the very low effect size (fold change) in amyloid positive versus negative individuals, resulting in a low robustness for this blood biomarker [44]. Indeed, plasma Aβ levels may reflect only to some extent the Aβ aggregation in the brain due to peripheral Aβ generation, degradation by circulating enzymes, and metabolism in the liver [45]. In addition, the available Aβ assay was specific for x-40 and x-42 rather than 1–40 and 1–42, which was less disease-specific [46], and the head-to-head study showed that certain mass spectroscopy-based methods performed better than immunoassays for plasma Aβ42/Aβ40 ratio when detecting Aβ pathology in the brain [47]. Plasma t-tau is considered a biomarker of neuronal damage and neurodegeneration. However, our study showed that plasma t-tau was elevated only in the late stage of the AD clinical spectrum and the diagnostic performance was poor for plasma t-tau to discriminate AD from non-dementia. This finding is in agreement with data from the Alzheimer’s Disease Neuroimaging Initiative (ADNI) study, showing only a minor increase in plasma t-tau in people with AD dementia compared with healthy controls [48], probably because current assay for plasma t-tau captures both brain-derived and peripherally produced tau protein [49]. Plasma NfL was increased in several neurodegenerative disorders (e.g., frontotemporal dementia, AD, and corticobasal syndrome) [4]. Plasma NfL in combination with demographic features and APOE genotype appeared to be powerful in differentiating AD from normal cognition, which is in line with the reports from the ADNI study [50] and a community-based study in US [51].
In this population-based study, we characterized plasma amyloid and neurodegenerative biomarkers across the AD clinical spectrum and assessed their accuracy for differentiating between normal cognition, MCI, and AD among rural-dwelling older adults in China, a sociodemographic group that has been largely ignored in Alzheimer research. Furthermore, we used the state-of-the-art Simoa platform to measure plasma biomarkers. However, our study also has limitations. First, we did not have data of highly sensitive and specific plasma biomarkers for tau pathology (e.g., phosphorylated tau181, tau217, and tau231). Furthermore, we did not have data on biomarkers related to amyloid, tau, and neurodegeneration (ATN) in central nervous system, which are more reliable than peripheral AD-related biomarkers to define pathological features of AD. Finally, our study sample was derived only from only one rural area in China, which should be kept in mind when generalizing the study findings to different populations.
In conclusion, plasma amyloid, t-tau, and NfL concentrations vary with age, sex, and APOE genotype and across the AD clinical spectrum. Notably, plasma NfL increased across the continuum from normal cognition to prodromal and clinical AD dementia and could be a valuable biomarker for detecting AD in older adults. Further longitudinal studies are required to evaluate the trajectory of these plasma biomarkers in defining the AD cognitive continuum and their prognostic ability in predicting dynamic evolution of cognitive traits.
ACKNOWLEDGMENTS
We would like to thank all the participants of the MIND-China Project as well as our staff in the Yanlou Town Hospital and in the Department of Neurology at Shandong Provincial Hospital who were involved in the organization of field survey as well as data collection and management.
FUNDING
MIND-China was supported by the grant from the National Natural Science Foundation of China (grants no.: 82171175, 82011530139, and 81861138008), the National Key Research and Development Program of China (grant no.: 2017YFC1310100), the Alzheimer’s Association Grant (grant no.: AACSFD-22-922844), the Natural Science Foundation of Shandong Province (grant no.: ZR2021MH005), the Academic Promotion Program of Shandong First Medical University (2019QL020 and 2023ZL001), the Integrated Traditional Chinese and Western Medicine Program in Shandong Province (YXH2019ZXY008), and the Brain Science and Brain-like Intelligence Technology Research Projects of China (2021ZD0201801 and 2021ZD0201808). Cong L received a grant from the Shandong Provincial Key Research and Development Program (grant no.: 2021LCZX03). Tang S received grants from the NSFC (grant no.: 82001397) and the Jinan Science and Technology Bureau (grant no.: 202225047). Winblad B received support from the Margaretha af Ugglas Foundation, Stockholm, Sweden. Qiu C received grants from the Swedish Research Council (grants no.: 2017-05819 and 2020-01574), the Swedish Foundation for International Cooperation in Research and Higher Education (grant no.: CH2019-8320), and Karolinska Institutet (grants no.: 2018-01854 and 2020-01456), Stockholm, Sweden. The funding agency had no role in the study design, data collection and analysis, the writing of this article, and in the decision to submit the work for publication.
CONFLICT OF INTEREST
Yongxiang Wang and Yifeng Du are Editorial Board Members of the Journal of Alzheimer’s Disease but were not involved in the peer-review process nor had they access to any information regarding its peer-review. All other authors have no conflict of interest to report.
DATA AVAILABILITY
The datasets used and/or analyzed during the current study are available from the corresponding author upon reasonable request and approval by the Steering Committee of MIND-China at the Department of Neurology, Shandong Provincial Hospital.
SUPPLEMENTARY MATERIAL
[1] The supplementary material is available in the electronic version of this article: https://dx.doi.org/10.3233/JAD-230932.
REFERENCES
[1] | Jack CR Jr , Bennett DA , Blennow K , Carrillo MC , Dunn B , Haeberlein SB , Holtzman DM , Jagust W , Jessen F , Karlawish J , Liu E , Molinuevo JL , Montine T , Phelps C , Rankin KP , Rowe CC , Scheltens P , Siemers E , Snyder HM , Sperling R, Contributors ((2018) ) NIA-AA Research Framework: Toward a biological definition of Alzheimer’s disease. Alzheimers Dement 14: , 535–562. |
[2] | Aisen PS , Cummings J , Jack CR Jr. , Morris JC , Sperling R , Frolich L , Jones RW , Dowsett SA , Matthews BR , Raskin J , Scheltens P , Dubois B ((2017) ) On the path to 2025: Understanding the Alzheimer’s disease continuum. Alzheimers Res Ther 9: , 60. |
[3] | Jansen WJ , Ossenkoppele R , Knol DL , Tijms BM , Scheltens P , Verhey FR , Visser PJ , Amyloid Biomarker Study G, Aalten P , Aarsland D , Alcolea D , Alexander M , Almdahl IS , Arnold SE , Baldeiras I , Barthel H , van Berckel BN , Bibeau K , Blennow K , Brooks DJ , van Buchem MA , Camus V , Cavedo E , Chen K , Chetelat G , Cohen AD , Drzezga A , Engelborghs S , Fagan AM , Fladby T , Fleisher AS , van der Flier WM , Ford L , Forster S , Fortea J , Foskett N , Frederiksen KS , Freund-Levi Y , Frisoni GB , Froelich L , Gabryelewicz T , Gill KD , Gkatzima O , Gomez-Tortosa E , Gordon MF , Grimmer T , Hampel H , Hausner L , Hellwig S , Herukka SK , Hildebrandt H , Ishihara L , Ivanoiu A , Jagust WJ , Johannsen P , Kandimalla R , Kapaki E , Klimkowicz-Mrowiec A , Klunk WE , Kohler S , Koglin N , Kornhuber J , Kramberger MG , Van Laere K , Landau SM , Lee DY , de Leon M , Lisetti V , Lleo A , Madsen K , Maier W , Marcusson J , Mattsson N , de Mendonca A , Meulenbroek O , Meyer PT , Mintun MA , Mok V , Molinuevo JL , Mollergard HM , Morris JC , Mroczko B , Van der Mussele S , Na DL , Newberg A , Nordberg A , Nordlund A , Novak GP , Paraskevas GP , Parnetti L , Perera G , Peters O , Popp J , Prabhakar S , Rabinovici GD , Ramakers IH , Rami L , Resende de Oliveira C , Rinne JO , Rodrigue KM , Rodriguez-Rodriguez E , Roe CM , Rot U , Rowe CC , Ruther E , Sabri O , Sanchez-Juan P , Santana I , Sarazin M , Schroder J , Schutte C , Seo SW , Soetewey F , Soininen H , Spiru L , Struyfs H , Teunissen CE , Tsolaki M , Vandenberghe R , Verbeek MM , Villemagne VL , Vos SJ , van Waalwijk van Doorn LJ , Waldemar G , Wallin A , Wallin AK , Wiltfang J , Wolk DA , Zboch M , Zetterberg H ((2015) ) Prevalence of cerebral amyloid pathology in persons without dementia: A meta-analysis. JAMA 313: , 1924–1938. |
[4] | Teunissen CE , Verberk IMW , Thijssen EH , Vermunt L , Hansson O , Zetterberg H , van der Flier WM , Mielke MM , Del Campo M ((2022) ) Blood-based biomarkers for Alzheimer’s disease: Towards clinical implementation. Lancet Neurol 21: , 66–77. |
[5] | Hampel H , O’Bryant SE , Molinuevo JL , Zetterberg H , Masters CL , Lista S , Kiddle SJ , Batrla R , Blennow K ((2018) ) Blood-based biomarkers for Alzheimer disease: Mapping the road to the clinic. Nat Rev Neurol 14: , 639–652. |
[6] | Blennow K ((2021) ) Phenotyping Alzheimer’s disease with blood tests. Science 373: , 626–628. |
[7] | Leuzy A , Mattsson-Carlgren N , Palmqvist S , Janelidze S , Dage JL , Hansson O ((2022) ) Blood-based biomarkers for Alzheimer’s disease. EMBO Mol Med 14: , e14408. |
[8] | Zhou RZ , Vetrano DL , Grande G , Duell F , Jonsson L , Laukka EJ , Fredolini C , Winblad B , Tjernberg L , Schedin-Weiss S ((2023) ) A glycan epitope correlates with tau in serum and predicts progression to Alzheimer’s disease in combination with APOE4 allele status. Alzheimers Dement 19: , 3244–3249. |
[9] | Babulal GM , Quiroz YT , Albensi BC , Arenaza-Urquijo E , Astell AJ , Babiloni C , Bahar-Fuchs A , Bell J , Bowman GL , Brickman AM , Chetelat G , Ciro C , Cohen AD , Dilworth-Anderson P , Dodge HH , Dreux S , Edland S , Esbensen A , Evered L , Ewers M , Fargo KN , Fortea J , Gonzalez H , Gustafson DR , Head E , Hendrix JA , Hofer SM , Johnson LA , Jutten R , Kilborn K , Lanctot KL , Manly JJ , Martins RN , Mielke MM , Morris MC , Murray ME , Oh ES , Parra MA , Rissman RA , Roe CM , Santos OA , Scarmeas N , Schneider LS , Schupf N , Sikkes S , Snyder HM , Sohrabi HR , Stern Y , Strydom A , Tang Y , Terrera GM , Teunissen C , Melo van Lent D , Weinborn M , Wesselman L , Wilcock DM , Zetterberg H , O’Bryant SE , International Society to Advance Alzheimer’s R, Treatment AsA ((2019) ) Perspectives on ethnic and racial disparities in Alzheimer’s disease and related dementias: Update and areas of immediate need. Alzheimers Dement 15: , 292–312. |
[10] | O’Bryant SE , Johnson LA , Barber RC , Braskie MN , Christian B , Hall JR , Hazra N , King K , Kothapalli D , Large S , Mason D , Matsiyevskiy E , McColl R , Nandy R , Palmer R , Petersen M , Philips N , Rissman RA , Shi Y , Toga AW , Vintimilla R , Vig R , Zhang F , Yaffe K , Team HS ((2021) ) The Health & Aging Brain among Latino Elders (HABLE) study methods and participant characteristics. Alzheimers Dement (Amst) 13: , e12202. |
[11] | Hansson O , Edelmayer RM , Boxer AL , Carrillo MC , Mielke MM , Rabinovici GD , Salloway S , Sperling R , Zetterberg H , Teunissen CE ((2022) ) The Alzheimer’s Association appropriate use recommendations for blood biomarkers in Alzheimer’s disease. Alzheimers Dement 18: , 2669–2686. |
[12] | O’Bryant S , Petersen M , Hall J , Johnson L , Yaffe K , Braskie M , Toga AW , Rissman RA , team Hs ((2022) ) Characterizing plasma NfL in a community-dwelling multi-ethnic cohort: Results from the HABLE study. Alzheimers Dement 18: , 240–250. |
[13] | Morris JC , Schindler SE , McCue LM , Moulder KL , Benzinger TLS , Cruchaga C , Fagan AM , Grant E , Gordon BA , Holtzman DM , Xiong C ((2019) ) Assessment of racial disparities in biomarkers for Alzheimer disease. JAMA Neurol 76: , 264–273. |
[14] | Syrjanen JA , Campbell MR , Algeciras-Schimnich A , Vemuri P , Graff-Radford J , Machulda MM , Bu G , Knopman DS , Jack CR Jr. , Petersen RC , Mielke MM ((2022) ) Associations of amyloid and neurodegeneration plasma biomarkers with comorbidities. Alzheimers Dement 18: , 1128–1140. |
[15] | Brickman AM , Manly JJ , Honig LS , Sanchez D , Reyes-Dumeyer D , Lantigua RA , Lao PJ , Stern Y , Vonsattel JP , Teich AF , Airey DC , Proctor NK , Dage JL , Mayeux R ((2021) ) Plasma p-tau181, p-tau217, and other blood-based Alzheimer’s disease biomarkers in a multi-ethnic, community study. Alzheimers Dement 17: , 1353–1364. |
[16] | de Wolf F , Ghanbari M , Licher S , McRae-McKee K , Gras L , Weverling GJ , Wermeling P , Sedaghat S , Ikram MK , Waziry R , Koudstaal W , Klap J , Kostense S , Hofman A , Anderson R , Goudsmit J , Ikram MA ((2020) ) Plasma tau, neurofilament light chain and amyloid-beta levels and risk of dementia; a population-based cohort study. Brain 143: , 1220–1232. |
[17] | Chatterjee P , Pedrini S , Ashton NJ , Tegg M , Goozee K , Singh AK , Karikari TK , Simren J , Vanmechelen E , Armstrong NJ , Hone E , Asih PR , Taddei K , Dore V , Villemagne VL , Sohrabi HR , Zetterberg H , Masters CL , Blennow K , Martins RN ((2022) ) Diagnostic and prognostic plasma biomarkers for preclinical Alzheimer’s disease. Alzheimers Dement 18: , 1141–1154. |
[18] | Rubsamen N , Maceski A , Leppert D , Benkert P , Kuhle J , Wiendl H , Peters A , Karch A , Berger K ((2021) ) Serum neurofilament light and tau as prognostic markers for all-cause mortality in the elderly general population-an analysis from the MEMO study. BMC Med 19: , 38. |
[19] | Dage JL , Wennberg AMV , Airey DC , Hagen CE , Knopman DS , Machulda MM , Roberts RO , Jack CR Jr , Petersen RC , Mielke MM ((2016) ) Levels of tau protein in plasma are associated with neurodegeneration and cognitive function in a population-based elderly cohort. Alzheimers Dement 12: , 1226–1234. |
[20] | Mielke MM , Hagen CE , Wennberg AMV , Airey DC , Savica R , Knopman DS , Machulda MM , Roberts RO , Jack CR Jr , Petersen RC , Dage JL ((2017) ) Association of plasma total tau level with cognitive decline and risk of mild cognitive impairment or dementia in the Mayo Clinic Study on Aging. JAMA Neurol 74: , 1073–1080. |
[21] | Mielke MM , Hagen CE , Xu J , Chai X , Vemuri P , Lowe VJ , Airey DC , Knopman DS , Roberts RO , Machulda MM , Jack CR Jr , Petersen RC , Dage JL ((2018) ) Plasma phospho-tau181 increases with Alzheimer’s disease clinical severity and is associated with tau- and amyloid-positron emission tomography. Alzheimers Dement 14: , 989–997. |
[22] | Wang Y , Han X , Zhang X , Zhang Z , Cong L , Tang S , Hou T , Liu C , Han X , Zhang Q , Feng J , Yin L , Song L , Dong Y , Liu R , Li Y , Ngandu T , Kivipelto M , Snyder H , Carrillo M , Persson J , Fratiglioni L , Launer LJ , Jia J , Du Y , Qiu C ((2022) ) Health status and risk profiles for brain aging of rural-dwelling older adults: Data from the interdisciplinary baseline assessments in MIND-China. Alzheimers Dement (N Y) 8: , e12254. |
[23] | Cong L , Ren Y , Wang Y , Hou T , Dong Y , Han X , Yin L , Zhang Q , Feng J , Wang L , Tang S , Grande G , Laukka EJ , Du Y , Qiu C ((2023) ) Mild cognitive impairment among rural-dwelling older adults in China: A community-based study. Alzheimers Dement 19: , 56–66. |
[24] | Kivipelto M , Mangialasche F , Snyder HM , Allegri R , Andrieu S , Arai H , Baker L , Belleville S , Brodaty H , Brucki SM , Calandri I , Caramelli P , Chen C , Chertkow H , Chew E , Choi SH , Chowdhary N , Crivelli L , Torre R , Du Y , Dua T , Espeland M , Feldman HH , Hartmanis M , Hartmann T , Heffernan M , Henry CJ , Hong CH , Hakansson K , Iwatsubo T , Jeong JH , Jimenez-Maggiora G , Koo EH , Launer LJ , Lehtisalo J , Lopera F , Martinez-Lage P , Martins R , Middleton L , Molinuevo JL , Montero-Odasso M , Moon SY , Morales-Perez K , Nitrini R , Nygaard HB , Park YK , Peltonen M , Qiu C , Quiroz YT , Raman R , Rao N , Ravindranath V , Rosenberg A , Sakurai T , Salinas RM , Scheltens P , Sevlever G , Soininen H , Sosa AL , Suemoto CK , Tainta-Cuezva M , Velilla L , Wang Y , Whitmer R , Xu X , Bain LJ , Solomon A , Ngandu T , Carrillo MC ((2020) ) World-Wide FINGERS Network: A global approach to risk reduction and prevention of dementia. Alzheimers Dement 16: , 1078–1094. |
[25] | Dong Y , Wang Y , Liu K , Hou T , Han X , Cong L , Ren Y , Zhang Q , Tang S , Ekstrom I , Laukka EJ , Du Y , Qiu C ((2022) ) Dementia screening in rural-dwelling Chinese older adults: The utility of a smell test and the self-rated AD8. J Am Geriatr Soc 70: , 1106–1116. |
[26] | Dong Y , Li Y , Liu K , Han X , Liu R , Ren Y , Cong L , Zhang Q , Hou T , Song L , Tang S , Shi L , Luo Y , Kalpouzos G , Laukka EJ , Winblad B , Wang Y , Du Y , Qiu C ((2023) ) Anosmia, mild cognitive impairment, and biomarkers of brain aging in older adults. Alzheimers Dement 19: , 589–601. |
[27] | American Psychiatric Association (APA) ((1994) ) Diagnostic and Statistical Manual of Mental Disorders, fourth edition (DSM-IV), APA, Washington, D.C. |
[28] | McKhann GM , Knopman DS , Chertkow H , Hyman BT , Jack CR Jr. , Kawas CH , Klunk WE , Koroshetz WJ , Manly JJ , Mayeux R , Mohs RC , Morris JC , Rossor MN , Scheltens P , Carrillo MC , Thies B , Weintraub S , Phelps CH ((2011) ) The diagnosis of dementia due to Alzheimer’s disease: Recommendations from the National Institute on Aging-Alzheimer’s Association workgroups on diagnostic guidelines for Alzheimer’s disease. Alzheimers Dement 7: , 263–269. |
[29] | Petersen RC , Roberts RO , Knopman DS , Geda YE , Cha RH , Pankratz VS , Boeve BF , Tangalos EG , Ivnik RJ , Rocca WA ((2010) ) Prevalence of mild cognitive impairment is higher in men. The Mayo Clinic Study of Aging. Neurology 75: , 889–897. |
[30] | Robin X , Turck N , Hainard A , Tiberti N , Lisacek F , Sanchez JC , Muller M ((2011) ) pROC: An open-source package for R and S+ to analyze and compare ROC curves. BMC Bioinformatics 12: , 77. |
[31] | Fukumoto H , Tennis M , Locascio JJ , Hyman BT , Growdon JH , Irizarry MC ((2003) ) Age but not diagnosis is the main predictor of plasma amyloid beta-protein levels. Arch Neurol 60: , 958–964. |
[32] | Khalil M , Pirpamer L , Hofer E , Voortman MM , Barro C , Leppert D , Benkert P , Ropele S , Enzinger C , Fazekas F , Schmidt R , Kuhle J ((2020) ) Serum neurofilament light levels in normal aging and their association with morphologic brain changes. Nat Commun 11: , 812. |
[33] | Baldacci F , Lista S , Manca ML , Chiesa PA , Cavedo E , Lemercier P , Zetterberg H , Blennow K , Habert MO , Potier MC , Dubois B , Vergallo A , Hampel H , group IN-ps , Alzheimer Precision Medicine I ((2020) ) Age and sex impact plasma NFL and t-Tau trajectories in individuals with subjective memory complaints: A 3-year follow-up study. Alzheimers Res Ther 12: , 147. |
[34] | Bridel C , van Wieringen WN , Zetterberg H , Tijms BM , Teunissen CE , and the NFLG, Alvarez-Cermeno JC , Andreasson U , Axelsson M , Backstrom DC , Bartos A , Bjerke M , Blennow K , Boxer A , Brundin L , Burman J , Christensen T , Fialova L , Forsgren L , Frederiksen JL , Gisslen M , Gray E , Gunnarsson M , Hall S , Hansson O , Herbert MK , Jakobsson J , Jessen-Krut J , Janelidze S , Johannsson G , Jonsson M , Kappos L , Khademi M , Khalil M , Kuhle J , Landen M , Leinonen V , Logroscino G , Lu CH , Lycke J , Magdalinou NK , Malaspina A , Mattsson N , Meeter LH , Mehta SR , Modvig S , Olsson T , Paterson RW , Perez-Santiago J , Piehl F , Pijnenburg YAL , Pyykko OT , Ragnarsson O , Rojas JC , Romme Christensen J , Sandberg L , Scherling CS , Schott JM , Sellebjerg FT , Simone IL , Skillback T , Stilund M , Sundstrom P , Svenningsson A , Tortelli R , Tortorella C , Trentini A , Troiano M , Turner MR , van Swieten JC , Vagberg M , Verbeek MM , Villar LM , Visser PJ , Wallin A , Weiss A , Wikkelso C , Wild EJ ((2019) ) Diagnostic value of cerebrospinal fluid neurofilament light protein in neurology: A systematic review and meta-analysis. JAMA Neurol 76: , 1035–1048. |
[35] | Fani L , Ahmad S , Ikram MK , Ghanbari M , Ikram MA ((2021) ) Immunity and amyloid beta, total tau and neurofilament light chain: Findings from a community-based cohort study. Alzheimers Dement 17: , 446–456. |
[36] | Damotte V , van der Lee SJ , Chouraki V , Grenier-Boley B , Simino J , Adams H , Tosto G , White C , Terzikhan N , Cruchaga C , Knol MJ , Li S , Schraen S , Grove ML , Satizabal C , Amin N , Berr C , Younkin S , Alzheimer’s Disease Neuroimaging Initiative, Gottesman RF , Buee L , Beiser A , Knopman DS , Uitterlinden A , DeCarli C , Bressler J , DeStefano A , Dartigues JF , Yang Q , Boerwinkle E , Tzourio C , Fornage M , Ikram MA , Amouyel P , de Jager P , Reitz C , Mosley TH , Lambert JC , Seshadri S , van Duijn CM ((2021) ) Plasma amyloid beta levels are driven by genetic variants near APOE, BACE1, APP, PSEN2: A genome-wide association study in over 12,000 non-demented participants. Alzheimers Dement 17: , 1663–1674. |
[37] | Sullivan KJ , Blackshear C , Simino J , Tin A , Walker KA , Sharrett AR , Younkin S , Gottesman RF , Mielke MM , Knopman D , Windham BG , Griswold ME , Mosley TH ((2021) ) Association of midlife plasma amyloid-beta levels with cognitive impairment in late life: The ARIC Neurocognitive Study. Neurology 97: , e1123–e1131. |
[38] | Wang J , Qiao F , Shang S , Li P , Chen C , Dang L , Jiang Y , Huo K , Deng M , Wang J , Qu Q ((2018) ) Elevation of plasma amyloid-beta level is more significant in early stage of cognitive impairment: A population-based cross-sectional study. J Alzheimers Dis 64: , 61–69. |
[39] | Xiao Z , Wu X , Wu W , Yi J , Liang X , Ding S , Zheng L , Luo J , Gu H , Zhao Q , Xu H , Ding D ((2021) ) Plasma biomarker profiles and the correlation with cognitive function across the clinical spectrum of Alzheimer’s disease. Alzheimers Res Ther 13: , 123. |
[40] | Botella Lucena P , Vanherle S , Lodder C , Gutierrez de Rave M , Stancu IC , Lambrichts I , Vangheluwe R , Bruffaerts R , Dewachter I ((2022) ) Blood-based Abeta42 increases in the earliest pre-pathological stage before decreasing with progressive amyloid pathology in preclinical models and human subjects: Opening new avenues for prevention. Acta Neuropathol 144: , 489–508. |
[41] | Hadjichrysanthou C , Evans S , Bajaj S , Siakallis LC , McRae-McKee K , de Wolf F , Anderson RM , Alzheimer’s Disease Neuroimaging Initiative ((2020) ) The dynamics of biomarkers across the clinical spectrum of Alzheimer’s disease. Alzheimers Res Ther 12: , 74. |
[42] | Li Y , Schindler SE , Bollinger JG , Ovod V , Mawuenyega KG , Weiner MW , Shaw LM , Masters CL , Fowler CJ , Trojanowski JQ , Korecka M , Martins RN , Janelidze S , Hansson O , Bateman RJ ((2022) ) Validation of plasma amyloid-beta 42/40 for detecting Alzheimer disease amyloid plaques. Neurology 98: , e688–e699. |
[43] | Winder Z , Sudduth TL , Anderson S , Patel E , Neltner J , Martin BJ , Snyder KE , Abner EL , Jicha GA , Nelson PT , Wilcock DM ((2023) ) Examining the association between blood-based biomarkers and human post mortem neuropathology in the University of Kentucky Alzheimer’s Disease Research Center autopsy cohort. Alzheimers Dement 19: , 67–78. |
[44] | Rabe C , Bittner T , Jethwa A , Suridjan I , Manuilova E , Friesenhahn M , Stomrud E , Zetterberg H , Blennow K , Hansson O , Alzheimer’s Disease Neuroimaging Initiative, the the Swedish BioFINDER study ((2023) ) Clinical performance and robustness evaluation of plasma amyloid-beta(42/40) prescreening. Alzheimers Dement 19: , 1393–1402. |
[45] | Janelidze S , Stomrud E , Palmqvist S , Zetterberg H , van Westen D , Jeromin A , Song L , Hanlon D , Tan Hehir CA , Baker D , Blennow K , Hansson O ((2016) ) Plasma beta-amyloid in Alzheimer’s disease and vascular disease. Sci Rep 6: , 26801. |
[46] | Graff-Radford J , Mielke MM , Hofrenning EI , Kouri N , Lesnick TG , Moloney CM , Rabinstein A , Cabrera-Rodriguez JN , Rothberg DM , Przybelski SA , Petersen RC , Knopman DS , Dickson DW , Jack CR , Algeciras-Schimnich A , Nguyen AT , Murray ME , Vemuri P ((2022) ) Association of plasma biomarkers of amyloid and neurodegeneration with cerebrovascular disease and Alzheimer’s disease. Neurobiol Aging 119: , 1–7. |
[47] | Janelidze S , Teunissen CE , Zetterberg H , Allue JA , Sarasa L , Eichenlaub U , Bittner T , Ovod V , Verberk IMW , Toba K , Nakamura A , Bateman RJ , Blennow K , Hansson O ((2021) ) Head-to-head comparison of 8 plasma amyloid-beta 42/40 assays in Alzheimer disease. JAMA Neurol 78: , 1375–1382. |
[48] | Mattsson N , Zetterberg H , Janelidze S , Insel PS , Andreasson U , Stomrud E , Palmqvist S , Baker D , Tan Hehir CA , Jeromin A , Hanlon D , Song L , Shaw LM , Trojanowski JQ , Weiner MW , Hansson O , Blennow K , ADNI Investigators ((2016) ) Plasma tau in Alzheimer disease. Neurology 87: , 1827–1835. |
[49] | Gonzalez-Ortiz F , Turton M , Kac PR , Smirnov D , Premi E , Ghidoni R , Benussi L , Cantoni V , Saraceno C , Rivolta J , Ashton NJ , Borroni B , Galasko D , Harrison P , Zetterberg H , Blennow K , Karikari TK ((2023) ) Brain-derived tau: A novel blood-based biomarker for Alzheimer’s disease-type neurodegeneration. Brain 146: , 1152–1165. |
[50] | Mattsson N , Andreasson U , Zetterberg H , Blennow K , Alzheimer’s Disease Neuroimaging Initiative ((2017) ) Association of plasma neurofilament light with neurodegeneration in patients with Alzheimer disease. JAMA Neurol 74: , 557–566. |
[51] | Sugarman MA , Zetterberg H , Blennow K , Tripodis Y , McKee AC , Stein TD , Martin B , Palmisano JN , Steinberg EG , Simkin I , Budson AE , Killiany R , O’Connor MK , Au R , Qiu WWQ , Goldstein LE , Kowall NW , Mez J , Stern RA , Alosco ML ((2020) ) A longitudinal examination of plasma neurofilament light and total tau for the clinical detection and monitoring of Alzheimer’s disease. Neurobiol Aging 94: , 60–70. |


